ceres global ag fy21 management discussion and analysis
TRANSCRIPT

1
MANAGEMENT’S DISCUSSION AND ANALYSIS
Table of Contents
1. FINANCIAL AND OPERATING SUMMARY ................................................................................................ 4
2. QUARTERLY FINANCIAL DATA ................................................................................................................. 9
3. LIQUIDITY & CASH FLOW ...................................................................................................................... 10
4. CAPITAL RESOURCES ............................................................................................................................. 12
5. ACCOUNTING POLICIES AND CRITICAL ACCOUNTING ESTIMATES ...................................................... 13
6. OUTLOOK ............................................................................................................................................... 14
7. OTHER .................................................................................................................................................... 16
8. NON‐IFRS FINANCIAL MEASURES AND RECONCILIATIONS .................................................................. 18
9. KEY ASSUMPTIONS & ADVISORIES FORWARD‐LOOKING STATEMETNS .............................................. 20
This Management’s Discussion and Analysis (“MD&A”) dated September 9, 2021 should be read in conjunction with the audited Consolidated Financial Statements for the year ended June 30, 2021 of Ceres Global Ag Corp. (“Ceres”, the “Corporation”, “we”, “our”, and “us”), and the Corporation’s audited Consolidated Financial Statements for the year ended June 30, 2020 (the “Annual Consolidated Financial Statements”). Additional information about Ceres filed with Canadian securities regulatory authorities, including the quarterly financial statements and MD&A, and the annual information form, is available online at www.sedar.com.
Basis of Presentation
Unless otherwise noted, all financial information has been prepared in accordance with International Financial Reporting Standards (“IFRS”) as issued by the International Accounting Standards Board. Unless otherwise indicated, dollar amounts are expressed in United States dollars (“$” and “USD”) and references to “CAD” and “C$” are to Canadian dollars.
Non‐IFRS Financial Measures
This MD&A contains references to certain financial measures, including some that do not have any standardized meaning prescribed by IFRS. These measures include “EBITDA” (Earnings before interest, income tax, depreciation and amortization), and “Return on shareholders’ equity, none of which have a standardized meaning under IFRS. See “Non‐IFRS Financial Measures and Reconciliations.”

2
Risks and Forward‐Looking Information
The Corporation’s financial and operational performance is potentially affected by a number of factors, including, but not limited to, the factors described in “Key Assumptions & Advisories”.
This annual MD&A contains forward‐looking information based on the Corporation’s current expectations, estimates, projections, and assumptions. This information is subject to a number of risks and uncertainties, including those discussed in this MD&A and the Corporation’s other disclosure documents, many of which are beyond the Corporation’s control. Users of this information are cautioned that actual results may differ materially. See “Key Assumptions & Advisories” for information on material risk factors and assumptions underlying the Corporation’s forward‐looking information.
Who We Are
Through its network of commodity logistics centers and team of industry experts, Ceres merchandises high‐quality North American agricultural commodities and value‐added products and provides reliable supply chain logistics services to agricultural, energy, and industrial customers worldwide.
Ceres is headquartered in Golden Valley, MN and together with its wholly owned affiliates operates 13 facilities across Saskatchewan, Manitoba, Ontario, and Minnesota. These facilities throughout North America have an aggregate grain and oilseed storage capacity of approximately 31 million bushels.
Ceres also has a 50% interest in Savage Riverport, LLC, a joint venture with Consolidated Grain and Barge Co., a 50% interest in Farmers Grain, LLC, a joint venture with Farmer’s Cooperative Grain and Seed Association, a 50% interest in Gateway Energy Terminal, an unincorporated joint operation with Steel Reef Infrastructure Corp., a 25% interest in Stewart Southern Railway Inc., a short‐line railway located in southeast Saskatchewan with a range of 130 kilometers, and a 17% interest in Canterra Seed Holdings Ltd., a Canadian‐based seed development company.
Grain Segment
The Corporation's Grain segment is engaged in the procurement, storage, handling, trading, and merchandising of commodity and specialty grains and oilseeds such as hard red spring wheat, durum wheat, oats, barley, rye, canola, and pulses through its 10 grain storage and handling facilities in Saskatchewan, Manitoba, Ontario, and Minnesota. These facilities are strategically located, either close to where Ceres’ core products are grown and sourced, or, at key supply chain locations to effectively serve customers and markets. Eight of Ceres’ grain storage facilities are located on major rail lines across North America, two are located at deep‐water ports on the Great Lakes allowing access to vessels, and another facility is located on the Minnesota River with capacity to load barges for shipment down the Mississippi River to export terminals in New Orleans. These facilities combine to provide Ceres with efficient access to export and import flows of our core grains and oilseeds to North America and global markets. Approximately 25 million bushels of the Corporation's facilities are "regular" for delivery for both spring wheat against the Minneapolis Grain Exchange futures contract and oats against the Chicago Board of Trade futures contract. In addition, spring wheat and oats sourced by the Corporation out of Canada are eligible for delivery against respective futures contracts.
Supply Chain Services Segment
The Supply Chain Services segment provides logistics services, storage, and transloading for non‐agricultural commodities and industrial products. Ceres efficiently manages its supply chains and assets

3
to ensure the optimization of storage and handling capacity and transportation costs and that high quality and value adding products are delivered to key customers and markets served.
One of Ceres’ key Supply Chain Services assets is its terminal at Northgate, Saskatchewan (“Northgate”). Northgate sits on approximately 1,300 acres of land, and is designed to utilize two rail loops, each capable of handling unit trains of up to 120 railcars and two ladder tracks capable of handling up to 65 railcars. Northgate is an approximately $75 million state‐of‐the‐art grain, oil, natural gas liquids and fertilizer terminal and is connected to the Burlington Northern Santa Fe Railway (the “BNSF”). The Corporation intends to further build out its infrastructure to support handling of other industrial products and equipment.
Ceres commenced its initial grain operations at Northgate in October 2014 and its grain elevator was fully operational in May 2016. As part of it grain operations, Ceres contracts grain and oilseed purchases from Western Canadian producers that are delivered by truck and unloaded at Northgate. Ceres has the option of storing the grain on‐site, loading it into outbound railcars to end‐users, or shipping to the Corporations’ other facilities to take advantage of the value and strategic location of its current asset base.
In June 2019, Ceres established Gateway Energy Terminal, a 50/50 unincorporated joint operation with Steel Reef Infrastructure Corp. located at Northgate (“Gateway”). Gateway began operations on July 1, 2019 and handles the transloading of hydrocarbons at Northgate on an exclusive basis. Ceres’ existing hydrocarbon transload contracts were transferred to Gateway as of July 1, 2019. Gateway’s operations at Northgate provide a direct link for hydrocarbons to enter the US market.
In November 2015, Ceres entered into an agreement with Koch Fertilizer Canada, ULC for the storage and handling of dry fertilizer products at Northgate’s state‐of‐the‐art, 26,000‐ton fertilizer storage terminal. The fertilizer is loaded out by Ceres into trucks and distributed to Canadian retailers. The fertilizer operation commenced on April 30, 2017.
The Corporation continues to expand products transloaded at the Northgate facility including but not limited to barite, bentonite, solvents, drilling pipe, lumber, oriented strand board, and magnesium chloride.
Seed and Processing Segment
The Corporation’s Seed and Processing segment was created through the acquisition of Delmar Commodities Ltd. (“Delmar”) and consists of a soybean crush facility located in a strong soybean producing region with low‐cost origination driven by export economics, a specialty crops blending/birdfeed production and sales business, and a seed production and distribution business focused on western Canada under the trade name “Ceres Global Seeds”. This segment’s operations are primarily located in Manitoba, Canada.
Delmar has entered into long‐term agreements with Sevita International Corporation (“Sevita”) for the production and distribution of soybean seed in Western Canada, and with Horizon Seeds Canada Inc. (“Horizon”) for the distribution of corn seed in Western Canada. Partnering with these highly specialized seed companies will enable Ceres to diversify its agriculture‐related businesses in regions that it knows and understands well, and to continue delivering high‐quality products and superior value to its seed dealer and grower network.

4
1. FINANCIAL AND OPERATING SUMMARY
For the year ended June 30, 2021 and June 30, 2020
Year ended June 30,
(in thousands of USD except per share) 2021 2020 2019
Revenues $ 748,204 $ 581,713 $ 438,396 Gross profit (loss) $ 24,918 $ 27,318 $ 14,320 Income (loss) from operations $ 8,865 $ 9,615 $ 1,289 Net income (loss) $ 12,044 $ 4,337 $ (16,871) Weighted average common shares outstanding 30,772,845 30,041,801 27,934,991 Diluted weighted average common shares outstanding
32,719,775
31,822,571
27,934,991
Income (loss) per share – Basic $ 0.39 $ 0.14 $ (0.60) Income (loss) per share – Diluted $ 0.37 $ 0.14 $ (0.60) EBITDA (1) $ 14,845 $ 16,883 $ (4,061) As at: Total assets $ 338,590 $ 254,987 $ 212,964 Total bank indebtedness, current $ 80,760 $ 31,702 $ 33,694 Term loan (2) $ 28,877 $ 29,721 $ 19,608 Shareholders' equity $ 156,918 $ 144,989 $ 130,764 Return on shareholders' equity (1) 7.7% 3.0% (12.9)% (1) Non‐IFRS measures. See Non‐IFRS Financial Measures and Reconciliations section.
(2) Includes current portion of term loan.
HIGHLIGHTS FOR THE YEAR ENDED June 30, 2021
Revenue grew 28.6%, primarily due to an increase of 14.4 million bushels handled and higher commodity prices compared to the prior year;
Gross Profit of $24.9 million was ahead of target but below a record year in fiscal year 2020. All commodities performed well and finished the year strong driven by a disciplined approach to risk management that guided us profitably through a challenging weather driven market
Net income of $12.0 million, increased $7.7 million compared to the year ended June 30, 2020. During the fourth quarter of fiscal year 2021, Ceres’ subsidiary Riverland Ag Corp., brought a previously unrecognized deferred tax asset on to its balance sheet, resulting in a $9.7 million income tax recovery. For more information regarding the recognition of the deferred tax asset refer to the income tax section of the Financial Summary below;
Established Farmers Grain, LLC (“Farmers Grain”), a joint venture with Farmer’s Cooperative Grain and Seed Association of Thief River Falls, MN and broke ground on a project to add 1.2 million bushels of storage and unit train loading capabilities, and is expected to be completed by the 2022 harvest. This grain merchandising joint venture will allow Ceres to increase its grower origination footprint in the region to better connect the Corporation’s farmer partners to its end user customers;

5
On June 11, 2021, the Corporation entered in to a five‐year senior secured $50 million term debt credit facility with the Bank of Montreal that includes a that includes a $30 million term loan draw that was used to retire the Bixby Loan (as defined below) along with an additional $20 million delayed draw committed term loan that will be used to fund future growth projects and initiatives. The interest on the new agreement is 250 basis points lower than our prior agreement and will significantly reduce borrowing costs going forward;
The 50% crush plant expansion at Jordan Mills was substantially completed as of June 30, 2021 and will be fully operational in July 2021.
Overall Performance
The Corporation’s net income was $12.0 million for the year ended June 30, 2021, compared to net income of $4.3 million for the year ended June 30, 2020. Due to the Corporation’s continued improvement in profitable results and outlook, the Company recognized a $9.7 million tax gain on previously unrecognized deferred tax assets that drove the improvement in results over the prior year.
Income from operations of $8.9 million was ahead of target but below prior year’s record results of $9.6 million. Gross margins were above target across all core product lines driven by increasing bushels handled and a disciplined approach to risk management during a challenging weather driven market. Operating costs were higher due to the purchase of the Nicklen Facility along with a full year ownership of Delmar but were in line with prior year across all other operating locations. General and administrative costs were lower and benefited from lower employee costs and travel expenses that were partially offset by higher legal costs during the year.
The Corporation’s higher stock price resulted in a $685 thousand expense on revaluation of stock appreciation rights compared to a gain in the prior year resulting in a difference of $1.0 million year over year. Prior year results included a $917 thousand one‐time revaluation gain on a contingent consideration from the acquisition of Nature’s Organic Grist, LLC. The increase in net income was driven by the recognition of a deferred tax asset of $9.7 million, offset by a reduction of $750 thousand in income from operations.
Revenues and Gross Profit
Total revenue increased by $166.5 million, primarily due to an increase of 14.4 million grain bushels handled and merchandised during the year, as well as increased commodity prices compared to the prior year. The Corporation handled and traded 106.9 million bushels of grain and oilseeds during the year ended June 30, 2021 compared to 92.5 million bushels for the year ended June 30, 2020. In agriculture commodity markets, cost of sales generally follow increases or decreases in gross revenues. Ceres’ Management believes it is more important to focus on changes in gross profits and volume handled rather than changes in revenue dollars.

6
The table below represents a summary of the components of gross profit for the year ended June 30, 2021 and 2020:
2021
(in thousands of USD)
Grain
Supply Chain Services
Seed and Processing
Corporate*
Total
Net trading margin $ 31,761 $ ‐ $ ‐ $ ‐ $ 31,761 Supply Chain Services revenue
3,346
3,155
‐
‐
6,501
Net Seed and Processing margin
‐
‐
8,650
‐
8,650
Operating expenses included in cost of sales
(10,329)
(2,321)
(3,300)
‐
(15,950)
Depreciation expense included in cost of sales
(4,341)
(1,113)
(299)
(291)
(6,044)
Gross profit (loss) $ 20,437 $ (279) $ 5,051 $ (291) $ 24,918
2020
(in thousands of USD)
Grain
Supply Chain Services
Seed and Processing
Total
Net trading margin $ 34,014 $ ‐ $ ‐ $ 34,014 Supply Chain Services revenue
3,569
4,034
‐
7,603
Net Seed and Processing margin
‐ ‐ 5,545 5,545
Operating expenses included in cost of sales
(9,266)
(2,810)
(2,591)
(14,667)
Depreciation expense included in cost of sales
(3,850)
(1,071)
(256)
(5,177)
Gross profit (loss) $ 24,467 $ 153 $ 2,698 $ 27,318
* The $291 thousand of depreciation expense included in cost of sales for fiscal year 2021 is due to depreciation taken at the Corporate level related to a step‐up in asset values acquired from Delmar. For fiscal year 2020, Corporate depreciation was nil.
Gross profit was above target but $2.4 million lower than prior year results. Net seed and processing margins were strong and improved across the crushing, seed, and bird food businesses. Grain trading margins were on target and strong across all core product lines but lower than prior year record results. Operating costs and depreciation were higher driven by the purchase of the Nicklen facility and a full year of Delmar operations.
Net Trading Margin
Net trading margins were strong and above target, but were $2.3 million lower compared to the record year ended June 30, 2020. Strong results across all core product lines were driven by an increase in

7
bushels handled along with disciplined risk management approach that enabled the Corporation to effectively and profitably manage through a challenging weather market environment that is putting pressure on production and supply across grain origination markets.
Supply Chain Services Revenue
Supply Chain Services revenue decreased by $1.1 million for the year ended June 30, 2021 compared to the year ended June 30, 2020. The Corporation’s grain‐related Supply Chain Services revenue decreased as a result of a reduction in the number of bushels stored on behalf of third‐party customers year over year. Continued energy market fundamentals continue to challenge the non‐grain supply chain services business that had $879 thousand in reduced revenue due to lower volumes of natural gas liquid transloaded through Gateway Energy Terminal compared to the same period in 2020.
Net Seed and Processing Margin
Net Seed and Processing margin was $8.7 million for the year ended June 30, 2021 compared to $5.5 million for the year end June 30, 2020. The increase in Seed and Processing margin is mainly due to an increase in bird feed and soybean crush volumes and margins that benefited from strong market fundamentals during the year.
Operating Expenses and Depreciation
For the year ended June 30, 2021, operating and depreciation expense included in cost of sales totaled $21.9 million compared to $19.8 million for the year ended June 30, 2020. The increase is driven by the operating expenses and depreciation related to the operation of the Nicklen Facility which was acquired in the first quarter of fiscal year 2021.
General and Administrative Expenses For the year ended June 30, 2021, general and administrative expenses totaled $16.1 million compared to $17.7 million in the year ended June 30, 2020. General and administrative expenses decreased due to lower incentive accruals and travel costs that were offset slightly by higher legal expenses booked in the period ended June 30, 2021.
Finance Loss
For the year ended June 30, 2021, finance loss totaled $357 thousand compared to a finance loss of $80 thousand during the year ended June 30, 2020. Finance loss is composed of realized and unrealized gains and losses on foreign exchange transactions and currency hedging transactions along with revaluation gains of portfolio investments.

8
Interest Expense
Year ended June 30,
(in thousands of USD except per share) 2021 2020
Interest on bank indebtedness $ (2,114) $ (2,475) Interest on term loan (1,867) (2,407) Interest on repurchase obligations (115) ‐ Interest attributable to leases (210) (195) Amortization of financing costs paid (961) (783) Interest on other financing obligations 24 3
Total interest expense $ (5,243) $ (5,857)
For the year ended June 30, 2021, interest expense totaled $5.2 million compared to $5.9 million for the year ended June 30, 2020. While the daily average borrowings on the revolving line of credit were higher year over year, the average interest rate on the borrowings decreased as a result of the lower interest rates in the amendment to the revolving credit facility as well as significantly lower LIBOR rates during the year ended June 30, 2021 compared to the year ended June 30, 2020. Refer to notes 12 and 13 in the Consolidated Financial Statements for the year ended June 30, 2021 for more information on revolving credit facility and term loan.
Amortization of Intangible Assets
Amortization of intangible assets totaled $262 thousand for the year ended June 30, 2021 and $241 thousand for the year ended June 30, 2020. Amortization for fiscal year 2021 was comprised solely of the amortization of intangible assets related to the Delmar acquisition including customer relationships, producer relationships, and trademarks/tradenames.
Share of Net Income (Loss) in Investments in Associates
For the year ended June 30, 2021, the Corporation’s share in investments in associates was a loss of $369 thousand compared to a $168 thousand loss for the year ended June 30, 2020. The increased loss in investments in associates is driven by a loss at Farmers Grain and Savage Riverport, LLC for the year ended June 30, 2021.
For the year ended June 30, 2021, the Corporation’s share in Savage Riverport, LLC was a loss of $82 thousand compared to a gain of $95 thousand for the year ended June 30, 2020. On April 30, 2018, the Corporation formed Savage Riverport, LLC and transferred the grain elevator and related assets at its Savage, Minnesota facility, which had net book value of $9.3 million as at April 30, 2018, to the newly formed entity. Subsequent to the transaction, Ceres received cash of $8.5 million from Consolidated Grain and Barge Co. in exchange for 50% of the equity in Savage Riverport, LLC, of which, $2.0 million was utilized to pay down the term debt. The sale of the equity in Savage Riverport, LLC net of transaction fees resulted in a gain of $3.7 million. The Corporation has been and will continue to recognize the remaining gain of $3.8 million over the useful life of the contributed assets. For the year ended, June 30, 2021 and June 30, 2020, the Corporation recognized a deferred gain of $347 thousand and $347 thousand, respectively, under share of net income (loss) of associates.
For the year ended June 30, 2021, the Corporations share in SSR was a loss of $127 thousand compared to a $209 thousand loss for the year ended June 30, 2020.

9
For the year ended June 30, 2021, the Corporation’s share in Farmers Grain, LLC was a loss of $160 thousand compared to nil for the year ended June 30, 2020.
Income Tax (Expense) Recovery
For the year ended June 30, 2021, the Corporation recognized an income tax recovery of $9.8 million compared to an expense of $150 thousand for the year ended June 30, 2020. During the fourth quarter of fiscal year 2021, Ceres’ subsidiary, Riverland, brought a previously unrecognized deferred tax asset on to its balance sheet, resulting in a $9.7 million income tax recovery. The deferred tax asset derived from the Corporation’s Net Operating Loss carryforward from historical years. The Corporation determined that, based on recent performance and future outlook, it was appropriate to recognize the benefit of the tax impact on the Net Operating Loss carryforwards.
2. QUARTERLY FINANCIAL DATA
3 months 3 months 3 months 3 months 3 months 3 months 3 months 3 months
Reporting dates 6/30/2021 3/31/2021 12/31/2020 9/30/2020 6/30/2020 3/31/2020 12/31/2019 9/30/2019
(in thousands of USD except per share)
Q4 2021 Q3 2021 Q2 2021 Q1 2021 Q4 2020 Q3 2020 Q2 2020 Q1 2020
Revenue $196,929 $203,911 $175,267 $ 172,097 $ 176,508 $ 120,947 $ 157,186 $ 127,072
Gross profit (loss) $ 8,756 $ 5,858 $ 6,494 $ 3,810 $ 6,994 $ 4,306 $ 9,332 $ 6,686
Income (loss) from operations $ 3,875 $ 2,215 $ 2,733 $ 42 2,038 $ 245 $ 4,301 $ 3,301
Net income (loss) $ 11,733 $ (78) $ 1,325 $ (936) $ 527 $ (281) $ 2,333 $ 1,758
Return on shareholders' equity ¹ 7.5% (0.1%) 1.0% (0.6%) 0.4% (0.2%) 1.6% 1.2%
Basic weighted‐average number of common shares for the quarter
30,773
30,773
30,773
30,739 30,739 30,739 30,739 27,965
Dilutive weighted‐average number of common shares for the quarter
32,765
30,773
32,820
30,739 32,547 30,739 32,220 29,167
Basic earnings (loss) per share $ 0.38 $ ‐ $ 0.04 $ (0.03) $ 0.02 $ (0.01) $ 0.08 $ 0.06
Fully diluted earnings (loss) per share $ 0.36 $ ‐ $ 0.04 $ (0.03) $ 0.02 $ (0.01) $ 0.07 $ 0.06
EBITDA ¹ $ 5,477 $ 3,495 $ 4,255 $ 1,618 $ 3,651 $ 2,830 $ 5,785 $ 4,639
EBITDA per share $ 0.18 $ 0.11 $ 0.14 $ 0.05 $ 0.12 $ 0.09 $ 0.19 $ 0.17
Shareholders' equity, as at reporting date
$156,918
$145,344
$145,478
$ 144,124 $ 144,989 $ 144,362 $ 144,430 $ 142,126
Shareholders' equity per common share, as at reporting date
$ 5.10
$ 4.72
$ 4.73
$ 4.69 $ 4.72 $ 4.70 $ 4.70 $ 5.08
Volumes (in thousands of tonnes)
Total Product Handled and Traded 629 781 756 782 686 550 751 626
Fourth Quarter The Corporation recognized net income for the quarter ended June 30, 2021 of $9.8 million compared to net income of $527 thousand in the same quarter of the prior year. Improved net income was driven by the recognition of a previously unrecognized deferred tax asset, resulting in an income tax recovery of $9.7 million as well as a $1.8 million increase in gross profit for the year ended June 30, 2021. The increase in gross profit was driven by higher soybean crush processing volumes and margins as well as increased trading margins driven by a disciplined and profitable approach risk management during a challenging weather driven market environment.

10
3. LIQUIDITY & CASH FLOW
Year ended June 30,
(in thousands of USD) 2021 2020
Net cash provided by (used in) Operating activities $ (25,938) $ 7,864 Investing activities (18,029) (25,527)
Net cash provided (used) before financing activities Financing activities
(43,967) 47,485
(17,663) 16,470
Increase (decrease) in cash $ 3,518 $ (1,193)
Operating Activities
Cash used in operating activities was $25.9 million for the year ended June 30, 2021 compared to cash provided by operating activities of $7.9 million in the prior year. The increase in cash used is attributable to the change in working capital. During the year ended June 30, 2021, with the cash used in operating activities of $25.9 million, the Corporation utilized its revolving credit facility to fund its operations and increase in inventory.
Investing Activities
During the year ended June 30, 2021, the Corporation used $18.0 million in investing activities including the asset acquisition of the Nicklen facility of $6.3 million and the investment in Farmers Grain of $8.6 million, which is a $7.5 million decrease compared to the $25.5 million in cash used in investing activities in the prior year. The decrease in cash used in investing activities was primarily driven by the acquisition of Delmar for $23.8 million in the prior year.
Financing Activities
During the year ended June 30, 2021, the Corporation had $47.5 million in cash provided by financing activities compared to cash provided by financing activities of $16.5 million in the prior year. The Corporation increased its cash from its revolving line of credit by $51.0 million to fund working capital needs, driven by an increase in commodity prices, as well as the investment in Farmers Grain and the acquisition of the Nicklen facility. This increase was offset by the decrease in cash provided by other financing sources including the net $10.0 million borrowed on the Bixby loan and $9.5 million raised from the private placement in the same period in the prior year.
Available Sources of Liquidity
Bank Indebtedness
The Corporation’s sources of liquidity as at June 30, 2021 include available funds under its revolving credit facility (the “2021 Credit Facility”). Management believes that cash flow from operations will be adequate to fund operating expenditures, maintenance capital, interest, and any income tax obligations. Growth capital expenditures in the next fiscal year are expected to be funded by cash on hand and borrowing against the 2021 Credit Facility. Any additional debt incurred is expected to be serviced by the anticipated increases in cash flow and will only be borrowed within the Corporation’s debt covenant and borrowing base limits.

11
In addition, the 2021 Credit Facility, as at June 30, 2021 contains certain covenants, including a covenant that the Corporation maintain minimum working capital of not less than $25.0 million. As at June 30, 2021 the Corporation’s working capital – defined as current assets less current liabilities – totaled $39.2 million. The covenants also include the maintenance of “consolidated debt” to “consolidated EBITDA” (as defined in the agreement) and consolidated tangible net worth of not less than $120.0 million. As at and for the year ended June 30, 2021 and June 30, 2020, the Corporation was in compliance with all material financial covenants.
As at June 30, 2021 and June 30, 2020, the Corporation had $19.0 million and $44.3 million in availability, respectively, on its revolving credit facility.
Term Loan
On June 11, 2021, the Corporation entered into a five‐year senior secured $50 million term debt credit facility with the Bank of Montreal (the “BMO Loan”) that includes a $30 million term loan draw that was used to retire the Bixby Loan along with an additional $20 million delayed draw committed term loan that will be used to fund future growth projects and initiatives. Undrawn amounts on the delayed draw term loan are subject to a 0.25% commitment Interest.
Liquidity Risk
As at June 30, 2021 and June 30, 2020, the following are the contractual maturities of financial liabilities, excluding interest payments:
June 30, 2021 (in thousands of USD)
Carrying Amount
Contractual Cash Flows
1 year
2 years
3 to 5 Years
More than 5 years
Bank indebtedness $ 80,760 $ 81,000 $ 81,000 $ ‐ $ ‐ $ ‐ Accounts payable and accrued liabilities
41,336
41,336
41,336
‐
‐
‐
Accounts payable ‐ related parties
136
136
136
‐
‐
‐
Unrealized losses on open cash contracts
25,112
25,112
25,112
‐
‐
‐
Term loan 28,877 29,625 1,500 1,500 26,625 ‐ Lease commitments 3,856 5,346 882 653 1,745 2,066
$ 180,077 $ 182,555 $ 149,966 $ 2,153 $ 28,370 $ 2,066
June 30, 2020 (in thousands of USD)
Carrying Amount
Contractual Cash Flows
1 year
2 years
3 to 5 Years
More than 5 years
Bank indebtedness $ 31,702 $ 32,000 $ 32,000 $ ‐ $ ‐ $ ‐ Accounts payable and accrued liabilities
38,069
38,069
38,069
‐
‐
‐
Accounts payable ‐ related parties
25
25
25
‐
‐
‐
Unrealized losses on open cash contracts
5,752
5,752
5,752
‐
‐
‐
Term loan 29,721 30,000 ‐ 5,000 25,000 ‐
Lease commitments 3,014 3,985 738 753 816 1,678
$ 108,283 $ 109,831 $ 76,584 $ 5,753 $ 25,816 $ 1,678

12
Future expected operational cash flows and sufficient assets are available to fund the settlement of these obligations in the normal course of business. In addition, the following factors allow for the substantial mitigation of liquidity risk: the prompt settlement of amounts due from brokers, the active management of trade accounts receivable and the lack of concentration risk related thereto. The Corporation’s cash flow management activities and the continued likelihood of its operations further minimize liquidity risk.
4. CAPITAL RESOURCES
The Corporation utilizes the 2021 Credit Facility to finance its grain trading operations, which primarily consist of purchases of grain inventories, financing of accounts receivable, and hedging activities, less accounts payable. Levels of short‐term debt fluctuate based on changes in underlying commodity prices, inventories on hand and the timing of grain purchases.
Credit Facility
As disclosed in the Consolidated Financial Statements for the year ended June 30, 2021, on February 12, 2020, the Corporation amended its then‐existing revolving credit facility, resulting in the 2020 Credit Facility, which increased the amount of the revolving credit facility available to Ceres from $80 million to $100 million, with the potential to access an accordion feature that would provide an additional $20 million. The 2020 Credit Facility matured on February 12, 2021.
The interest rate under the 2020 Credit Facility was changed to a tiered annual interest rate based on the utilization and is as follows:
Revolver Facility Utilization
Applicable Margin
< 35% 3.125% ≥ 35% to < 70% 3.00%
≥ 70% 2.875%
Renewal of Credit Facility On February 10, 2021, the Corporation amended the 2020 Credit Facility, resulting in the 2021 Credit Facility. Under the 2021 Credit Facility, the amount of the revolving facility available to Ceres remains at $100 million, with the potential to access an accordion feature that would provide an additional $20 million. The revolving facility matures on February 9, 2022.
The interest rate under the 2021 Credit Facility is a tiered annual interest rate based on the utilization and is as follows:
Revolver Facility Utilization
Applicable Margin
≤ 30% 2.75% > 30% 2.50%
The total interest rate is calculated by adding the applicable margins above plus one‐week LIBOR. In the event the one‐week LIBOR does not adequately reflect the cost to the lenders, the adjusted base rate
13
shall be a rate equal to the average of the lender’s cost of funding the borrowings. The interest rate is calculated and paid on a monthly basis. The 2021 Credit Facility is subject to borrowing base limitations. Amounts under the agreement that remain undrawn are not subject to a commitment fee. The 2021 Credit Facility has certain covenants pertaining to the accounts of the Corporation, as at June 30, 2021, the Corporation was in compliance with all material covenants.
Term Loan
On November 15, 2018, the Corporation entered into a $20.0 million term loan agreement with Bixby Bridge Fund IV, LLC (the “Bixby Loan”). On August 16, 2019, the Bixby Loan was amended in conjunction with the Corporation’s acquisition of Delmar Commodities Ltd. which increased the amount of the loan by $15.0 million to a total of $35.0 million. On February 28, 2020, the Corporation elected to pay the $5.0 million scheduled payment due November 15, 2020 early. Additionally, the annual interest rate increased to 6.00% plus one‐month LIBOR.
On June 11, 2021, the Corporation entered into the BMO Loan, a five‐year senior secured $50 million term debt credit facility, includes a $30 million term loan draw that was used to retire the Bixby Loan along with an additional $20 million delayed draw committed term loan that will be used to fund future growth projects and initiatives. Repayment of the loan will be in the form of quarterly payments of $375 thousand over the 5‐year term, with the remaining balance of $22.5 million due on the maturity date of June 11, 2026. Undrawn amounts on the delayed draw term loan are subject to a 0.25% commitment Interest is paid monthly and at the Corporation’s option, the BMO Loan will bear interest equal to:
3.5% plus one‐month LIBOR; or
2.5% plus the greater of (i) Lender’s prime commercial rate as in effect on such day, (ii) the sum of the Fed Funds plus 0.5%, and (iii) the one‐month LIBOR plus 1.0%
In connection with the origination of term loans, the Corporation paid transaction costs relating to the loan closure in the amount of $748 thousand during fiscal year 2021 and $349 thousand during fiscal year 2020, which included legal fees and other related borrowing costs. Transaction costs directly attributable to the issuance of the loan are recognized as a reduction in the balance of the loan and are amortized over the term of the loan using the effective interest rate method.
5. ACCOUNTING POLICIES AND CRITICAL ACCOUNTING ESTIMATES
Changes in Accounting Policies and Standards Issued but not yet Effective
For the year ended June 30, 2021, there were no changes in accounting policies, and no standards issued but not yet effective which are expected to have a material impact to the Corporation’s Financial Statements. Refer to note 3 of the Annual Consolidated Financial Statements for information pertaining to the significant accounting policies for the year ended June 30, 2021.
Critical Accounting Judgements, Estimates, and Assumptions
The discussion and analysis of Ceres’ financial condition and results of operations are based upon the Corporation’s Consolidated Financial Statements, which have been prepared in accordance with IFRS. Ceres’ significant accounting policies and accounting judgements, estimates, and assumptions are contained in the Consolidated Financial Statements (see notes 3 and 4, respectively, for the description of policies or references to notes where such policies are contained). The critical accounting estimates are valuation of investments; valuation of inventories and commodity derivatives; measurement of

14
deferred tax; and the critical accounting judgements are determination of the functional currency; and business combinations; because they require Ceres to make assumptions about matters that are potentially uncertain at the time the judgement is made and due to the likelihood that materially different amounts could be reported under different conditions or using different assumptions.
Current Events
COVID‐19
The outbreak of COVID‐19 has resulted in governments worldwide enacting emergency measures to combat the spread of the virus. These measures, which include the implementation of travel bans, non‐essential business closures, self‐imposed quarantine periods and social distancing, have caused material disruption to businesses globally resulting in an economic slowdown. Although the Corporation has managed through this crisis without material impacts to its business, COVID‐19 and any other future pandemic or public health crisis may have impacts on the Corporation’s business, affairs, operations, financial condition, liquidity, availability of credit and results of operations that will depend on future developments that are highly uncertain and cannot be predicted with any meaningful precision.
6. OUTLOOK
Grain Segment
Markets for the products Ceres handles and merchandizes were extremely volatile during the quarter (April‐June 2021). A once in 20‐year drought in the Northern U.S. Plains and Canadian Prairies negatively affected yields and led to much smaller crops than expected. Throughout the growing season the market was very reactive to weather forecasts while prices trended higher across all products. The Corporation anticipated the deteriorating conditions and secured supply for key customers. Ceres benefitted from this by being positioned well across its cereal grain portfolio as prices increased. Meanwhile, total volume handled and merchandized maintained a strong pace, finishing 16% higher for the fiscal year. Overall, Ceres effectively navigated through challenging markets and established a solid position to start the next fiscal year. Looking forward, given limited supplies due to smaller crops, markets should remain volatile but with strong underlying support. Specifically, the Corporation expects prices will reach levels where demand is rationed in order to balance limited supply for the crop year. Exports from Canada and the U.S. are likely to be lower than normal as U.S. and Canadian demand remains strong and keeps inventories within North America. Meanwhile, quality could become an issue as the early drought and late rains potentially affected test weight, color, and toxin levels. While overall volumes are expected to be lower over the 2022 fiscal year, the Corporation expects to realize opportunities through effective trading and positioning, cost management and blending lower quality new crop with high quality old crop inventories. In addition, special attention will be given to moisture received across the growing areas during fall and winter months as this will be critical ahead of the planting period next spring. Regarding growth and development, on February 10th, 2021, Ceres formed a joint venture with Farmers Cooperative Grain and Seed Association from Thief River Falls, MN, which allows Ceres to continue to work directly with growers to deliver value‐added solutions for its customers. A major investment and initiative from this joint venture, which is currently underway and on schedule, is adding storage and unit train loading capabilities to the grain operation in Thief River Falls. Construction is expected to be completed prior to harvest 2022 (late summer). Beyond this joint venture, the business development

15
team continues to work through a healthy pipeline of projects and expects to have more growth opportunities to announce over the coming quarters.
Supply Chain Services Segment
Industrial product and fertilizer volumes were again strong for the quarter, most notably oriented strand board (“OSB”) as pent‐up demand from the U.S. homebuilding sector helped that product line increase volume by 20% vs the same quarter a year ago. Natural gas liquid (“NGL”) volumes through Gateway Energy Terminal were lower vs. a year ago due to lower volumes leaving the region. Overall, gross margins for the segment came in as expected, albeit slightly lower than the same quarter a year ago.
Looking forward, OSB and fertilizer volumes are expected to remain strong while NGL volumes are expected to slightly increase relative to the past several quarters. The segment overall is expected to generate positive gross margins.
Seed and Processing Segment
The soybean crush business slowed down during the fourth quarter (April – June 2021) due to minimal soybean supply left from the crop year and from shutdowns attributed to increasing the plant’s capacity. These two factors happened at an opportune time as opportunity cost was minimal due to lower supplies and the expansion finished on time and below budget. Looking forward, margins are expected to be attractive once new crop harvest begins (October 2021), and volumes much higher as plant capacity has increased by 50%. Ceres looks forward to having more capacity and expects that to have a meaningful impact on results starting with the coming crop year.
Specialty crop blending, including birdfeed manufacturing, finished the year very strong as better than expected demand resulting from the COVID‐19 environment remained robust. Specifically, birdfeed sales in Canada reached record levels for the year and maintained a higher‐than‐normal pace. Going forward, demand is expected to remain strong; however, the primary input for bird seed, sunflower seeds, is in high demand from the oilseed crush sector. This is resulting in an increase in the price of sunflower seeds, and subsequently, the price of birdseed. Therefore, volumes are expected to slightly contract over the coming year as the retail price of bird seed increases.
The Seed business performed very well considering the change in supplier partners and limited seed varieties to work with over the past growing season. This business is now positioned for growth as it effectively maintained relationships and business with key distributor customers and will have significantly more varieties to offer in the coming year. Regarding growth and development, on May 25th, 2021 Ceres announced its plan to build a $350 million integrated canola processing facility in Northgate, Saskatchewan, to help meet the current and growing global demand for canola products. The state‐of‐the‐art facility will have capacity to process approximately 1 million metric tons of canola and refine over 500 thousand metric tons of canola oil, for both food and fuel, annually. The facility is expected to be operational by summer 2024 and is expected to result in the creation of over 50 full time jobs in Saskatchewan, which is the largest canola producing province in Canada. The Corporation hired Ascendant Partners as an advisor and is engaged in discussions with financial and industry players interested in the project.

16
7. OTHER
CONTROLS ENVIRONMENT
Disclosure Controls and Procedures
Ceres maintains appropriate information systems, procedures, and controls to ensure that new information disclosed externally is complete, reliable, and timely. National Instrument 52‐109 Certification of Disclosure in Issuers’ Annual and Interim Filings (“NI 52‐109”) requires the Chief Executive Officer and the Chief Financial Officer to certify that they are responsible for establishing and maintaining disclosure controls and procedures (“DC&P”) and that they have, as at June 30, 2021, designed the DC&P (or have caused such DC&P to be designed under their supervision) to provide reasonable assurance that material information relating to Ceres is made known to them by others, particularly during the period in which Ceres’ annual filings are being prepared, and that information required to be disclosed by Ceres in its annual filings, interim filings or other reports filed or submitted by Ceres under applicable securities legislation is recorded, processed, summarized, and reported within the time periods specified in applicable securities legislation.
Internal Controls over Financial Reporting
NI 52‐109 also requires the Chief Executive Officer and the Chief Financial Officer to certify that they are responsible for establishing and maintaining internal control over financial reporting (“ICFR”) and that they have, as at June 30, 2021, designed ICFR to provide reasonable assurance regarding the reliability of financial reporting and the preparation of the financial statements for external purposes in accordance with International Financial Reporting Standards (“IFRS”). The control framework used by the Chief Executive Officer and the Chief Financial Officer to design Ceres’ ICFR is the Risk Management and Governance: Guidance on Control (COCO Framework) published by CPA Canada. There have been no material changes in the Corporation’s internal control over financial reporting during the year ended June 30, 2021 that materially affected, or are reasonably likely to materially affect, the Corporation’s internal control over financial reporting.
FINANCIAL INSTRUMENTS AND OTHER INSTRUMENTS
The Corporation’s financial instruments and other instruments, including a discussion of risks and relevant risk sensitivities, can be found in note 7 of the Consolidated Financial Statements.
OFF‐BALANCE SHEET ARRANGEMENTS
The Corporation does not currently have any off‐balance sheet arrangements.

17
RELATED‐PARTY TRANSACTIONS
The remuneration of key management personnel of the Corporation, which includes both members of the Board of Directors and leadership team including the President and CEO, CFO, and vice presidents, is set out below in aggregate:
For the Year Ended June 30,
(in thousands of USD) 2021 2020
Salary and short‐term employee and director benefits $ 2,001 $ 2,004
Share‐based compensation 608 535
$ 2,609 $ 2,539
Ownership The Corporation’s majority shareholder, VN Capital Management, LLC, beneficially owns and controls, directly and indirectly, through VN Capital Fund C, L.P., a total of 16,782,557 common shares, representing 54.5% of Ceres’ outstanding shares (15,338,057 common shares, 49.8% as at June 30, 2020).
Savage Riverport, LLC Ceres routinely transacts business directly with Savage Riverport, LLC. Such transactions are in the ordinary course of business and include storage and elevation fees for grain storage, as well as management fees. Related party revenue of $80 thousand is included in total revenue for the fiscal year 2021 compared to related party revenue of $80 thousand in fiscal year 2020. Related party expenses recorded in cost of sales are $1.8 million for the fiscal year 2021 and $1.5 million for fiscal year 2020. As at June 30, 2021, the accounts receivable, due from Savage Riverport, LLC totaled $212 thousand ($84 thousand in 2020) and accounts payable, due to Savage Riverport, LLC totaled $39 thousand ($25 thousand in 2020). Farmers Grain, LLC Ceres routinely transacts business directly with Farmers Grain. Such transactions are in the ordinary course of business and include the purchase of grain as well as management fees. Related party revenue of $162 thousand is included in total revenue for the fiscal year 2021 compared to nil in fiscal year 2020. Related party expenses recorded in cost of sales are $359 thousand for the fiscal year 2021 and nil for fiscal year 2020. As at June 30, 2021, the accounts receivable, due from Farmers Grain totaled $147 thousand compared to nil as at June 30, 2020. Stewart Southern Railway Inc. As at June 30, 2020, the Corporation had a CAD $25 thousand note due from SSR. During the fiscal year ended June 30, 2021, the note was repaid in full.

18
Gateway Energy Terminal As at June 30, 2021, the accounts receivable, due from Gateway Energy Terminal, totaled $84 thousand and $195 thousand for the year ending June 30, 2020. Bixby Loan As at June 30, 2020, an affiliate of Bixby Bridge Fund IV, LLC (“the Lender”), separate and distinct from the Lender, held an indirect, minority investment in Ceres. The Bixby Loan was negotiated on arm’s length terms after consideration of other financing alternatives under the supervision of members of the Board who are independent of the Lender. As at June 30, 2021, the balance of Bixby Loan was nil.
Private Placement
During the year ended June 30, 2020, the Corporation closed a non‐brokered private placement, issuing 2,802,599 common shares. Certain key management personnel and an entity controlled by a director of the Corporation, subscribed for 2,792,599 shares including VN Capital Fund C, L.P. which subscribed for 2,757,487 shares.
SHARES OUTSTANDING
As at September 9, 2021, the issued and outstanding equity securities of the Corporation consisted of 30,772,845 common shares. In addition, the Corporation has 1,301,875 stock options outstanding with a weighted‐average exercise price of C$3.99 per common share, 206,718 restricted stock units outstanding, 515,643 equity‐settled deferred share units outstanding, and 69,472 cash‐settled deferred share units outstanding.
CONTINGENCIES
The Corporation announced on June 18, 2021, that the Corporation and certain of its current and former personnel have received subpoenas from the US Department of Justice to produce documents and other records regarding the Corporation’s trading and other related activities, with a particular focus on the Corporation’s oat market trades from 2016 to 2019. Ceres also received a voluntary document request from the US Commodities Futures Trading Commission seeking similar information. Ceres has cooperated, and will continue to cooperate, with both investigations. As these investigations are in the preliminary discovery and voluntary document request stage, and the Corporation is not aware of wrongdoing by the Corporation and its current or former employees, it has not made any provisions as of June 30, 2021. Management of the Corporation is not aware of any other legal proceedings or regulatory actions outstanding, threatened or pending for the period ending June 30, 2021 by or against the Corporation, or any of its subsidiaries, or relating to its business that would be material to a holder of the Common Shares and other securities of the Corporation.
8. NON‐IFRS FINANCIAL MEASURES AND RECONCILIATIONS
Certain financial measures in this annual MD&A and discussed below are not prescribed by and do not have a standardized meaning under IFRS. As such, they are unlikely to be comparable to similar measures presented by other issuers. These non‐IFRS financial measures are included because management uses the information to analyze leverage, liquidity, and operating performance.

19
Earnings Before Interest, Income Taxes, Depreciation, and Amortization
The Corporation believes the presentation of EBITDA can provide useful information to investors and shareholders as it provides increased transparency. EBITDA is one metric that is used by management to determine the Corporation’s ability to service its debt and finance capital. EBITDA excludes gains and losses on property, plant and equipment, assets held for sale, and gains and losses on equity investments.
The following table is a reconciliation of EBITDA for Ceres on a consolidated basis for the three months and year ended June 30, 2021 and 2020:
Three months ended June 30,
Year ended June 30,
(in thousands of USD) 2021 2020 2021 2020
Net income (loss) for the period
$ 11,733 $ 527 $ 12,044 $ 4,337
Interest expense 1,596 1,118 5,243 5,857
Amortization of intangible assets
65
241
262
241
Income tax (recovery) (9,712) 148 (9,768) 150
Share of net (Income) loss in investment in associates 1
67
536
369
168
Depreciation and amortization
1,728
1,533
6,695
6,130
$ 5,477 $ 4,103 $ 14,845 $ 16,883
1 In June 2020, the Corporation determined that the revenue and expenses resulting
from Gateway Energy Terminal, should be accounted for as a joint operation. This resulted in reclassifying $130 thousand from “Share of net income (loss) of associates” into gross profit for the quarter ended June 30, 2020 and $475 thousand for the year ended June 30, 2020.
20
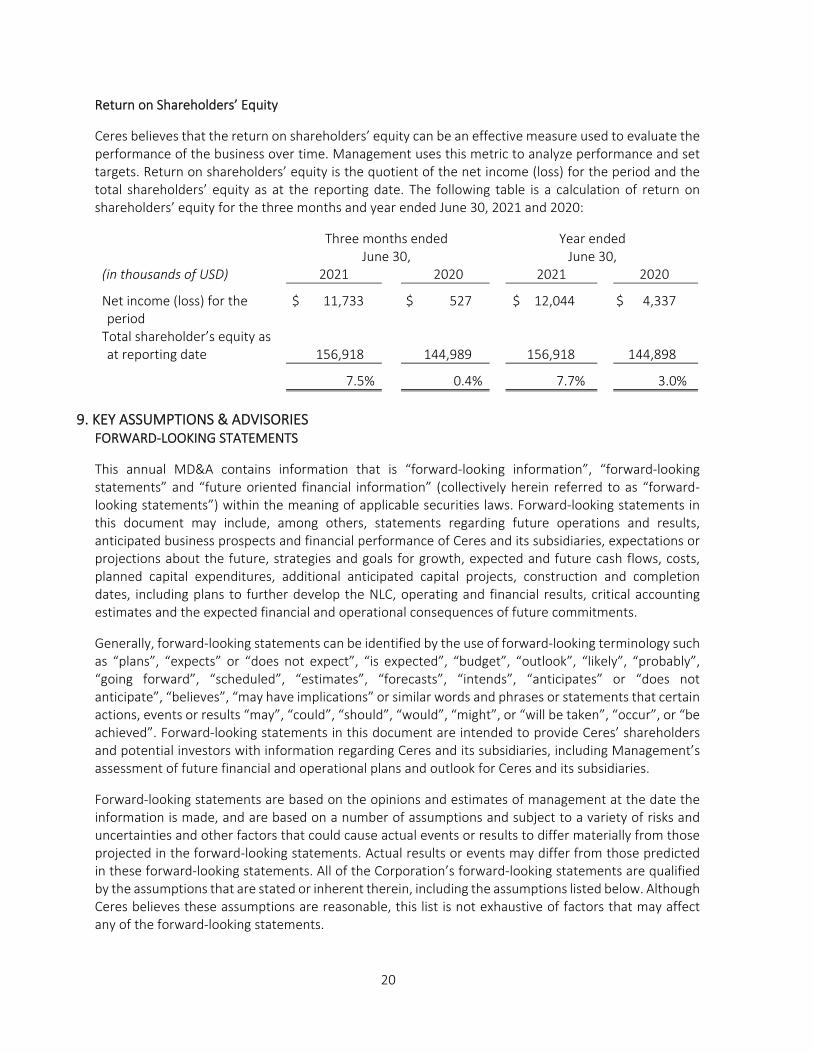
Return on Shareholders’ Equity
Ceres believes that the return on shareholders’ equity can be an effective measure used to evaluate the performance of the business over time. Management uses this metric to analyze performance and set targets. Return on shareholders’ equity is the quotient of the net income (loss) for the period and the total shareholders’ equity as at the reporting date. The following table is a calculation of return on shareholders’ equity for the three months and year ended June 30, 2021 and 2020:
Three months ended June 30,
Year ended June 30,
(in thousands of USD) 2021 2020 2021 2020
Net income (loss) for the period
$ 11,733 $ 527 $ 12,044 $ 4,337
Total shareholder’s equity as at reporting date
156,918
144,989
156,918
144,898
7.5% 0.4% 7.7% 3.0%
9. KEY ASSUMPTIONS & ADVISORIES FORWARD‐LOOKING STATEMENTS
This annual MD&A contains information that is “forward‐looking information”, “forward‐looking statements” and “future oriented financial information” (collectively herein referred to as “forward‐looking statements”) within the meaning of applicable securities laws. Forward‐looking statements in this document may include, among others, statements regarding future operations and results, anticipated business prospects and financial performance of Ceres and its subsidiaries, expectations or projections about the future, strategies and goals for growth, expected and future cash flows, costs, planned capital expenditures, additional anticipated capital projects, construction and completion dates, including plans to further develop the NLC, operating and financial results, critical accounting estimates and the expected financial and operational consequences of future commitments.
Generally, forward‐looking statements can be identified by the use of forward‐looking terminology such as “plans”, “expects” or “does not expect”, “is expected”, “budget”, “outlook”, “likely”, “probably”, “going forward”, “scheduled”, “estimates”, “forecasts”, “intends”, “anticipates” or “does not anticipate”, “believes”, “may have implications” or similar words and phrases or statements that certain actions, events or results “may”, “could”, “should”, “would”, “might”, or “will be taken”, “occur”, or “be achieved”. Forward‐looking statements in this document are intended to provide Ceres’ shareholders and potential investors with information regarding Ceres and its subsidiaries, including Management’s assessment of future financial and operational plans and outlook for Ceres and its subsidiaries.
Forward‐looking statements are based on the opinions and estimates of management at the date the information is made, and are based on a number of assumptions and subject to a variety of risks and uncertainties and other factors that could cause actual events or results to differ materially from those projected in the forward‐looking statements. Actual results or events may differ from those predicted in these forward‐looking statements. All of the Corporation’s forward‐looking statements are qualified by the assumptions that are stated or inherent therein, including the assumptions listed below. Although Ceres believes these assumptions are reasonable, this list is not exhaustive of factors that may affect any of the forward‐looking statements.

21
KEY ASSUMPTIONS
Key assumptions have been made in connection with the forward‐looking statements in this annual MD&A. These assumptions include, but are not limited to, the following:
- No material change in the regulatory environment in Canada and the United States;
- Supply and demand factors as well as the pricing environment for grains and other agricultural commodities;
- Fluctuation of currency and interest rates;
- General financial conditions for Western Canadian and American agricultural producers;
- Market share that will be achieved by the Corporation;
- Adequate and timely service from the railroads, and in particular from the BNSF at Northgate;
- The Corporation’s ability to maintain existing customer contracts and relationships coupled with its ability to increase its customer portfolio;
- COVID‐19 does not significantly impact the Corporation’s operations and the markets it serves; and
- The ability of Ceres to successfully operate Delmar.
The preceding list is not an exhaustive list of all possible factors. All factors should be considered carefully when making decisions with respect to Ceres. Many such factors and events are not within the control of Ceres. Factors that could cause actual results or events to differ materially from current expectations include, among others, risks related to weather, politics and governments, changes in environmental and other laws and regulations, competitive factors in the agricultural, food processing and feed sectors, construction and completion of capital projects, labour, equipment and material costs, access to capital markets, interest and currency exchange rates, technological developments, global and local economic conditions, the ability of Ceres to successfully implement strategic initiatives and whether such strategic initiatives will yield the expected benefits, the operating performance of the Corporation’s assets, the availability and price of commodities, and the regulatory environment, processes and decisions. Ceres has attempted to identify important factors that could cause actual actions, events or results to differ materially from those described in forward‐looking statements. However, there may be other factors that might cause actions, events or results that are not anticipated, estimated or intended. There can be no assurance that forward‐looking statements will prove to be accurate, as actual results and future events could differ materially from those anticipated in such statements or information.
By their nature, forward‐looking statements are subject to various risks and uncertainties, including those risks discussed in other sections of this MD&A and in other filings and communications, any of which could cause Ceres’ actual results and experience to differ materially from the anticipated results or published expectations. Additional information on these and other factors is available in the reports filed by Ceres with Canadian securities regulators. Readers are cautioned not to place undue reliance on the forward‐looking statements herein, which are given as of the date of this MD&A or otherwise, and not to use future‐oriented information or financial outlooks for anything other than their intended purpose. Ceres undertakes no obligation to update publicly or revise any forward‐looking statements or information, whether as a result of new information, change in management’s estimates or opinions, future events or otherwise, except as required by law.