cereal production and food security in south asia
TRANSCRIPT

Cereal production and food security in South Asia
Working Paper
April 2019
Mazhar Mughal
Charlotte Fontan Sers
Pau Business School, Pau, France.
Abstract
South Asia is one of the remaining major strongholds of hunger in the world. This is in spite of the
fact that countries of the region went through the Green revolution during the second half of the 20th
century which led to tripling of cereal production. This study examines the role this increase in cereal
production has played in improving the region’s food security situation. Controlling for various
economic, demographic, social and climatic factors that drive food security, we study the association
between different aspects of food security and cereal production prevalent in South Asia over the past
25 years.
We find a beneficial role of production and yield of cereals and the extent of undernourishment. This
impact is visible for the availability, stability and utilization aspects of food security but not for the
access aspect. The positive effect is in particular present in the case of rice and maize production.
The beneficial effect on food security persists up to three years. These findings are robust to
alternative empirical specifications and techniques. The results explain, in part, the means by which
South Asian nations have succeeded in reducing the extent of undernourishment.
Key Words: cereal production, food security, South Asia
JEL Codes : O11, O13, 053, Q18
Résumé
L’Asie du Sud est l’une des régions du monde où l’insécurité alimentaire est la plus forte. Cela est
malgré le fait que les pays de cette région ont lancé dans la deuxième partie du XXème siècle la
Révolution verte qui a permis de tripler la production de céréales. Cet article cherche à étudier le rôle
qu’a pu jouer la hausse de la production de céréales dans l’amélioration de la sécurité alimentaire en
Asie du Sud. En intégrant plusieurs facteurs économiques, démographiques, sociaux et climatiques
qui influencent la sécurité alimentaire, notre étude tient compte de la relation entre différents aspects
de la sécurité alimentaire et de la production de céréales qui a pu existé pendant les 25 dernières
années.
Nos résultats indiquent un rôle positif joué par l’évolution de la production et du rendement de
céréales sur le nombre de personnes sous-alimentées. Cet impact est vérifié pour différentes
dimensions de la sécurité alimentaire (la disponibilité physique des aliments, la stabilité dans le temps
et l’utilisation des aliments) mais pas pour l’accès économique et physique des aliments. De plus, la
relation positive est particulièrement forte pour les productions de riz et de maïs.
L’effet bénéfique sur la sécurité alimentaire perdure jusqu’à trois ans. Ces résultats sont robustes,
ayant été testés par différentes spécifications et techniques empiriques. Ils expliquent, en partie,
comment les pays d’Asie du Sud ont réussi à réduire l’insécurité alimentaire.
Mots clés: Production de cereals, sécurité alimentaire, Asie du Sud
JEL Codes : O11, O13, O53, Q18

1. Introduction
The United Nations declared the 2016 to 2025 period Decade of Action on Nutrition. In
particular focus in this regard are the countries of Sub-Saharan Africa and South Asia, two
regions where a significant proportion of the population still faces hunger. South Asia alone
is home to a third of the world's undernourished (FAO, IFAD, WFP, 2015). In 2014, 281
million inhabitants of the region corresponding to 15% of the population were estimated to be
unable to meet their dietary needs. India, the largest and most populous country of the region,
alone accounts for a quarter of all food insecure population in the world.
Serious efforts have been made over the years at both the national and international level to
counter this challenge of food insecurity in the region. Measures such as delivery of
subsidized cereals through public distribution systems, food stamps, mid-day meals for
school children, food for work programmes and provision of nutritional supplements to
mothers and children have helped reduce the proportion of food insecurity in all the eight
countries of the region during the previous twenty five years (FAOSTAT, 2016). This is
reflected in the fact that the Millennium Development Goal (MDG) of reducing poverty by
half was achieved in time (IFPRI, 2016).
An important objective of South Asian governments' food security and anti-poverty policy
has been to achieve self-sufficiency in staple grains (mainly rice, wheat and maize). For this
purpose, a sizeable chunk of government budgets is spent on price support, subsidies on
inputs and agricultural loans, maintenance of stocks of seeds and cereals, and research and
development.
Most countries have succeeded in raising cereal yield two or three-fold since the beginning of
the Green revolution in the 1960s, and India and Pakistan have become self sufficient in
cereal production. What, then has been the role of these attempts at food self-sufficiency in
achieving food security? Is strong focus on increasing cereal production a significant, even
important factor in driving the fall in undernutrition seen in South Asia? Which of the four
pillars of food security (availability, access, utilization and stability) as defined by FAO
(2009) are more relevant?
In this study, we look for answers to these questions by exploring data on the eight South
Asian countries during the 1990 - 2014 period. We take into account different indicators of
cereal production as well as its temporal and spatial dimensions. We control for potential
endogeneity and include economic, climatic and sociopolitical factors which are considered
important determinants of food security.

We find evidence for a beneficial role of the aforementioned focus on improving the
production and yield of cereals on South Asia’s food security situation. The findings of this
study could have useful policy implications in a developing-country context.
The study is organized in the following manner: In the next section, we briefly describe the
food security and cereal production situation of South Asian countries. Section 3 introduces
the data and model as well as the empirical methodology. Results are presented and discussed
in Section 4. Conclusion and policy implications follow.
2. Food security and cereal production in South Asia
2.1. State of food security
The number of undernourished in South Asia has marginally declined since the 1990s (Table
1). While the numbers have fallen in the remaining six countries, the size of food insecure
population has grown in Afghanistan and Pakistan. In Afghanistan, the number doubled from
3.8 million in 1990-1992 to 8.6 million in 2014-2016 whereas in Pakistan, it soared from 28.7
million to 41.4 million during the same period.
In Afghanistan, decades of war and internal strife, earthquakes and failed crops have meant
that majority of the population lacks access and means to obtain food, whereas population
growth rates that are among the highest in the world have exacerbated the problem.
The situation in the region is less gloomy in relative terms. The proportion of undernourished
in South Asia's total population has fallen significantly from 23.9% in the early 1990s to
15.7% today (Table 1). While the proportion has fallen in all the eight countries of the region,
the fall is most spectacular in Bangladesh and Nepal: in Bangladesh, the proportion of
undernourished halved from 32.8% estimated in 1990-1992 to 16.4% in 2014-2016 while the
decrease in Nepal during the same period was even greater from 22.8% to 7.8%. The
Maldives are close to eliminating hunger from the country with the proportion of
undernourished down to 5.2%.
Table 1. Undernourishment Trends in South Asia
India, which accounts for 69% of the region's undernourished, has seen a 36% drop in the
number of undernourished in the past quarter of a century, despite a 48% increase in
population (FAOSTAT, 2016). This notwithstanding, one Indian in seven (194 million or

15.2%) still remain food insecure and close to half of the children under five years of age are
stunted.
In South Asia, average per capita calorie consumption is low by world standards ranging
from 2090 kilocalorie a day in Afghanistan to 2673 in Nepal. Cereals account for half to
three-quarters of average caloric intake in the countries of the region (Figure 1). Bhutan,
Maldives, Nepal and Sri Lanka mainly rely on rice for their caloric intake while wheat is the
chief source of calories in Afghanistan and Pakistan. The population of India's northern and
western states likewise depends on wheat while rice is the staple food in the southern and
eastern states.
Figure 1. Average dietary composition in South Asian countries in 2013 (share of
cereals)
Given the high dependence on cereals for covering caloric requirements (Figure 1), national
food security policies have mainly focused on improving availability and access to affordable
staple food. These policy interventions targeted the pricing and supply mechanisms as well as
direct financial support programmes. All the countries of the region maintain public
distribution systems that make available cereals at below-market prices. For this purpose,
cereals are procured at announced support prices within the country or imported in case of
insufficient domestic production. These systems assume an indispensible role in food
importing countries such as Afghanistan and Bangladesh during global price spikes like those
seen in 2007-20081.
Bangladesh, India and Pakistan maintain large-scale Public grain reserves to counter such
contingencies. For instance, India's Targeted Public Distribution System (TPDS) aims at
improving the food security situation of 800 million poor by providing ten kilo of subsidized
food grains per family every month. However, these distribution systems involve large
subsidies and struggle to target the poor. Their reach is partial and losses are high in the
presence of poor storage and delivery mechanisms. In addition to distribution programmes,
several existing schemes aim at improving food security by providing the poor access to
food through initiatives such as Mid-day Meal Programme and Work for food schemes later
1 Between January 2007 and April 2008, the price of coarse rice in Bangladesh and wheat in Afghanistan nearly doubled
(World Bank, 2010).

transformed into the National Rural Employment Guarantee Scheme (India), Food Support
Programme (Pakistan) and Samurdhi food stamp programme (Sri Lanka). International
development agencies and non-governmental organizations also run food support
programmes in areas hit by natural calamities, conflict and poverty.
2.2. State of cereal production
In 2014, South Asia produced more than 400 million tons of cereals, or about 15% of the
global production (FAO, 2016). The region's share in the world production is far below its
proportion of the world population. This is in spite of the Green Revolution of the 1960s and
later which led to sharp increases in the region's cereal output. South Asia's cereal yield grew
threefold from 1961 to 2014 (Table 2). In comparison, cereal yield in Africa and Least
Developed Countries (LDCs) as a whole almost doubled during the period. Today, South
Asia produces about twice as much per hectare (30028 hg/ha) as does Africa (16131 hg/ha).
Bangladesh by far leads the way with a yield of 46 184 hg per hectare, almost thrice the level
in 1961. Even then, the country must still import large quantity of cereals, mainly wheat. In
contrast, India and Pakistan, despite their low yields of 29841 hg per hectare and 27503 hg
per hectare respectively, have managed to become self sufficient in cereal production. The
two countries achieved the highest growth in cereal yield in the region during the 1961 –
2014 period, corresponding to 215% and 221% respectively.
Table 2. Evolution of cereal yield per Hectare in South Asia (1961 - 2014)
Figure 2. Cereal production in South Asian countries (share of total crops)
The importance of cereal production varies widely among the countries of the region (Figure
2). In four out of eight countries, cereals represent more than 70% of the total crop produce
reaching as high as 91% in Afghanistan. In India, Maldives and Sri Lanka in contrast, cereals
account for less than half of the crop production. Barring Bangladesh, cereals amount to less
than half the value of agricultural production in all the countries of South Asia. This owes to
significant production of high value crops such as cotton, sugarcane and spices. South Asia
produced 428 tons of sugarcane in 2014 (FAOSTAT, 2016). The production of rice and
wheat, in comparison, was 225 million tons and 129 million tons respectively (Table 3).
India, Pakistan and Bangladesh are among the world's largest producers of rice while India

and Pakistan are among top rice exporters. India exported close to 24 million tons of cereals
in 2013 while Pakistan exported about 5 million tons.
Table 3. Evolution of rice, wheat and maize production in South Asia
The strong performance in cereal production and yield discussed above is a result of a long-
held policy of South Asian governments that has targetted self sufficiency in grains as a
means to achieving food security (Pingali, 2004). Research and development at government
research centers focused on producing new high-yield varieties better suited to South Asia's
soils and climate. Subsidies were provided on agricultural inputs including seeds, fertilizers,
machinery, irrigation and electricity for tubewells. Besides, small farmers were provided cash
benefits and subsidized credit. Efforts were made to improve access to agricultural credit and
to reduce its cost (FAO, 2014). Programmes for agricultural insurance in case of natural and
climatic disasters were established and expanded. Another measure designed to improve
production and protect farmers from sharp market price fluctuations has been the minimum
support price of cereals fixed every year by the government.
Thanks to these policy measures, South Asia has over the years managed to enhance its
production of cereals as well as its yield and productivity.
3. Model, data and methodology
3.1. Model and data
We empirically examine the relationship between food security and cereal production in
South Asia. Food security is considered to exist when all individuals at all times have
physical and economic access to sufficient safe and nutritious food to meet their dietary
needs. We take the prevalence of undernourishment in each country as the main indicator of
food security.
Furthermore, the four aspects of food security namely availability, access, stability and
utilization as defined by FAO (2009) are considered.
Availability measures the supply of sufficient quantity of nutritious food to all individuals.
Access indicates the physical and economic capacity of all individuals to acquire sufficient
quantity of nutritious food. Stability refers to consistent supply of nutritious food through
management of price shocks arising from local or international economic or weather
fluctuations. Finally, utilization reflects the biological capacity of individuals to absorb
nutritious food. This ability could be proxied by health and sanitation indicators.
These four dimensions of food security are examined by employing the following indicators:
Dietary energy supply as a percentage of average dietary energy requirement (availability),
domestic food price index (access) and variability of net per capita food production
(stability).
Given the lack of a clear-cut indicator for the utilization aspect, we employ two alternate
variables as proxy for individuals' food absorption capacity, namely the percentage of
population using improved sanitation facilities and the mortality rate of under five children.
The former points to the overall sanitary environment in which people live in the country
whereas the latter reflects the prevalence of life-threatening diseases.
In addition to cereal production, we also check the association of food security with per
capita cereal production and the yield of cereal crops as well as with the production of South
Asia's three main cereals (rice, wheat and maize). In the same vein, we assess the role of the
diversity of nutritious food available to the consumers in driving food security by including
the share of dietary energy derived from cereals, roots and tubers as an explanatory variable.
In previous studies, diversity of food supply has been shown to be linked with food security
(see for instance Arimond and Ruel, 2004 ; Dillon and al., 2015 ; Fanzo and al., 2013 ;
Hoddinott and Yohannes, 2002 ; Kumar and al., 2015 ; Ruel, 2002).
We control for a number of economic, demographic, political and natural factors that are
considered important drivers of food security. Economic development is considered key to
decreasing hunger in developing countries (FAO, IFAD, WFP, 2015 ; FAO, 2015; Fontan
Sers and Mughal, 2018). Rising economic tide lifts the levels of food consumption and hence
alleviate food insecurity as long as growth is not poverty-neutral. South Asia is one of the
world's fastest growing regions with average growth often exceeding 7%. GDP per capita is
taken as the indicator of economic development.
Another important factor is population growth. South Asia added equivalent of two United
States of America in the past quarter of a century as the region's population grew from 1.16
billion in 1991 to 1.74 billion in 2015 (data from World Bank 2016). Rapid increase in
population can impede efforts to reduce hunger in the presence of limited resources and
economic opportunities. Including inflation in the model is also important. Rising prices hit
the poor proportionally more and could hurt their food purchasing power. Asian
Development Bank (2013) report that an increase of 1% in food price lead to 0.4% increase
in the prevalence of undernourishment.

Government plays a crucial role in formulating and implementing food security policies. We
include government spending as a share of GDP to proxy government's involvement in
fighting hunger.
Climatic shocks such as cyclones, floods or failure of seasonal rains could jeopardize
availability or access to food. South Asia is one of the world regions most hit by climate-
related catastrophes. Floods are a recurrent phenomenon all over the region particularly
during the monsoon season lasting from June to September, while occasional droughts have
devastated parts of Afghanistan, Pakistan, India and Bangladesh. We include a binary
variable to account for food shortage, crop failure and famine to gauge the influence of such
disasters on food security.
Yet another important factor is the role of terrorism. Conflict and violence hurts economic
activity, destroys lives and assets and could thereby aggravate hunger. South Asia has long
suffered from ethnic, religious, communal and political terrorist activity. Over 67,000 people
are reported to have been killed in terrorist attacks in the region since 1990 (National
Consortium for the Study of Terrorism and Responses to Terrorism, 2016). Terrorism related
casualties per million population is taken as an indicator of terrorist activity in South Asia.
Finally, we include a dummy variable for the 2007-2008 food crisis.
Our parsimonious baseline model can be given as:
Undernutrition_prevalence i,t = f (lncereals i,t, lngdppc i,t, popgrowth i,t, inflation i,t, gfce i,t,
climatologicaldisaster i,t, terrorkilledmillion i,t, foodcrisis) (1)
where 'i' represents the corresponding South Asian country and 't' the year of the observation.
Table 4 gives the definitions and sources of the variables included in the study while the
summary statistics of these variables are given in Table 5.
Table 4. Variable definitions and sources
Table 5. Summary Statistics
3.2. Methodology
The estimation proceeds as follows. In the first step, we alternately study the relationship
between undernourishment prevalence on the one hand and the three indicators pertaining to

the production of cereals on the other. The three indicators account for the quantity of cereals
produced, per capita production and yield per hectare.
We also examine undernourishment's association with the production of rice, wheat and
maize in South Asia. These estimations are carried out using Fixed-effects panel estimator2.
Next, we test the robustness of our estimates. First, we check if food supply diversity
influences food security in any way. Second, we take into account the two outliers in our
dataset. The Maldives are the smallest country of the region with negligible cereal
production. The country is the most prosperous among South Asian countries and is close to
eradicating hunger. At the other extreme, India corresponds to 75% of the region's population
and even greater share of its output. We estimate the model by alternatively excluding the
two countries. Third, we carry out the estimations on the one, two, three, four and five-year
lagged values of cereal production instead of the level variable used in the baseline model to
control for possible delayed impact of cereal production.
We also estimate the baseline model using alternative econometric techniques considering the
possibility of endogeneity and serial autocorrelation. Arellano and Bond, System GMM and
Dynamic Panel Data (DPD) estimators are used for this purpose. In the third step, we
consider the association of cereal production with the four aspects of food security, namely
availability, access, stability and utilization.
4. Findings
Table 6 shows results of various production-related specifications. The association of
undernourishment prevalence with cereal production, per capita production and yield, all the
three indicators is found to be statistically significant and strong (Columns 1 - 3). The sign of
the three coefficients is negative suggesting the existence of a negative relationship between
food insecurity and cereal production. A 1% increase in cereal production is association with
11% decrease in the proportion of undernourished in the population, while the drop in the
latter is even stronger in case of a 1% increase in yield (21%).
Crop-wise estimates show a likewise strong result for rice production (Column 4). However,
the coefficient for wheat production is insignificant with a p-value of 0.17 (Column 5),
possibly owing to the fact that wheat is the primary staple in only two countries of the region.
Among the control variables, population growth rate and government consumption
expenditure as share of GDP are found to be the strongest factors driving food security. High
2 The Haussman Specification test invariably maintains a P-value of 0.00.

population growth, all things considered, intuitively leads to high incidence of under- and
mal-nutrition. Higher public spending, in contrast, leads to lower proportion of
undernourished population.
The coefficients of other explanatory variables are mostly insignificant.
Alternative estimates reported in Table 7 show the robustness of these findings. The negative
relationship between undernourishment and cereal production seen above remains even after
excluding the two outliers, the Maldives and India.
Likewise, the association persists when one, two and three-year lags of cereal production are
employed (Columns 4 to 6). The significance of the association dissipates beyond three lags
(Columns 7 and 8).
Estimations of the dynamic panel models (results not shown) corroborate our main finding of
a significant salutary effect of cereal production on food security in South Asia.
The above findings notwithstanding, the share of cereals in South Asia's average caloric
intake does not appear to influence the proportion of undernourished population in the region
(Column 1). South Asia's poor derive a very high share of their calorie requirements from
cereal grains. Improved availability of staples seems to help them significantly whereas
access to other sources of calorie does not appear to change the state of hunger. Food security
in South Asia therefore responds more to the production of cereals than to their share in daily
nutritional intake. This insignificant relationship between undernutrition and production
diversity corroborates the findings of Sibhatu and al. (2015) in the context of Ethiopia and
Kenya.
The results presented so far are also borne out from the estimates of multiple dimensions of
food security reported in Table 8. Cereal production significantly and beneficially influences
the availability, access and utilization aspects of food security. The adequacy of dietary
energy supply substantially increases (Column 1), the variability of per capita food
production falls (Column 3), and health indicators improve (Columns 4 and 5).
The first finding again highlights the strong link between higher grain production and better
nutritional situation in South Asia. The financial access dimension represented by the Food
Price Index variable does not significantly correlate with cereal production (Column 2).
Thanks to strong cereal price subsidy policies and other safety nets in force across the region,
shortfall in domestic grain production usually does not increase local food prices.
All in all, the evidence of a beneficial effect of cereal production in South Asia on the
region's food security situation seems to be substantial.
Table 6. Food security and cereal production - Production indicators
Table 7. Food security and cereal production - Alternative estimates
Table 8. Food security and cereal production - Dimensions of food security
To sum up, the evidence of a beneficial effect of cereal production in South Asia on the
region's food security situation seems to be substantial.
5. Conclusion
South Asia is one of the final bastions of hunger. Despite strong economic growth that
brought millions out of poverty, many in the region still lack sufficient food to satisfy dietary
energy requirements. One of the objectives of South Asian countries' food policies over the
decades has been to attain self-sufficiency in cereal production. Thanks to strong agricultural
performance since the green revolution, production of wheat, rice and other cereal crops has
doubled or tripled across the region. Nonetheless, the production of most of the countries in
the region has still fallen short of the needs of a rapidly rising population, leaving the
countries exposed to global price shocks. The need for self-sufficiency in staple grains was
deeply felt during the food price hike of 2007-2008 (Pingali, 2015).
In this study, we examine the role cereal production has played in driving South Asia's food
security situation during the 1991 to 2014 period. We found that higher production and better
yield are associated with lower proportion of undernourished population. This is particularly
the case with rice, the main source of calories for much of South Asia's population.
In rural areas, farmers retain part of their cereal production for home consumption. Similarly,
landless labourers working in the fields are in part paid in grains. Increased cereal production
is helpful even in urban areas due to subsidized sale of domestic food production.
Our findings therefore suggest a beneficial effect of policies aimed at enhancing cereal
production. Consequently, efforts should be stepped up to improve crop yields which still lag

the levels achieved in the developed countries. These include focusing on developing
drought-resistant crop varieties, providing the farmers better quality seeds, information and
technology, managing water distribution more efficiently and reducing post-harvest grain
losses.
Climate change is a looming challenge in this context as South Asia is one of the regions
hardest hit by changing climate. The frequency of floods, droughts and extreme temperatures
is increasing and farmers already are having to change their sowing habits to minimize crop
loss (Ahmad et al., 2013).
Finally, fighting hunger in the region should not be at the cost of neglecting malnutrition.
Large number of South Asians are deficient in proteins and micronutrient deficiency too is
rife among children and women. Work on enhancing dietary quality and diversity should
therefore go hand in hand with measures to increase quantity.
References AHMAD M., IQBAL M. and KHAN M. A. (2013) Climate Change, Agriculture and Food Security in Pakistan:
Adaptation Options and Strategies, Pakistan Institute of Development Economics, International Development
Research Centre, 8p.
ARIMOND M. and RUEL M.T. (2004) Dietary diversity is associated with child nutritional status: evidence
from 11 demographic and health surveys, Journal of Nutrition, Vol 134, no 10, 2579–2585.
ASIAN DEVELOPMENT BANK (2013) Food security in Asia and the Pacific. 131 p.
DILLON A., McGEE K. and OSENI G. (2015) Agricultural production, dietary diversity and climate
variability, The Journal of Development Studies, Vol.51, n°8.
FANZO J., HUNTER D., BORELLI T., MATTEI F.. (2013) Diversifying Food and Diets : Using Agricultural
Diversity to improve Nutrition and Health, Routledge, London, 401 p.
FAO, IFAD, WFP (2015) The State of food insecurity in the world, Meeting the 2015 International Hunger
targets : taking stock of uneven progress, Rome, 62 p.
FAO (2016) FAO Cereal Supply and Demand Brief. Monthly Report of the FAO.
FAO (2015) The State of Food Security and Agriculture. Social protection and agriculture : breaking the cycle
of rural poverty, Rome, 151 p.
FAO (2014) Trends, emerging issues and policy alignments since the 2007/2008 food security crisis, Food and
Agriculture policy decisions, 136 p.
FAO (2009) Declaration of the World Summit on Food Security, WSFS 2009/2, 16 November, 2009.
FONTAN SERS C. and MUGHAL M. (2018) From Maputo to Malabo: Public Agricultural Spending and Food
Security in Africa, Working papers hal01844094, HAL.
HODDINOTT J., YOHANNES Y. (2002) Dietary Diversity as a Food Security Indicator, Food Consumption
and Nutrition Division, Paper n°136, IFPRI, 2p.
IFPRI (2016) The 2016 Global Food Security Report, 154 p.
KUMAR N., HARRIS J. and RAWAT R. (2015) If they grow it, will they eat and grow ? Evidence from
Zambia on agricultural diversity and child undernutrition, The Journal of Development Studies, Vol.51, n°8.
NATIONAL CONSORTIUM FOR THE STUDY OF TERRORISM AND RESPONSES OF TERRORISM
(START) (2016) Global Terrorism Database.
PINGALI P. (2004) Agricultural diversification in Asia : opportunities and constraints, in Proceedings on the
FAO Rice Conference « Rice is life », FAO, 20p.
PINGALI P. (2015) Agricultural Policy and Nutrition outcomes- getting beyond the preoccupation with staple
grains, Food Security, 7, 583-591.
RUEL M.T. (2002) Is dietary diversity an indicator of food security or dietary quality. A review of measurement
issues and research needs, IFPRI, FNCD Discussion Paper n°140.
SHEKAR M. (2015) Nutrition and agriculture: bridging the gap, Investing in Health, News and Views in
Healthy Development, World Bank.

SIBHATU K.T., KRISHNA V.V., QUAIM M. (2015) Production diversity and dietary diversity in smallholder
farm households, PNAS, Vol 112, n°34, 6p
WORLD BANK (2010) Food price increases in South Asia: national responses and regional dimensions.
Discussion Paper 46, World Bank, Washington, DC.

Figures and Tables :
Figure 1. Average dietary composition in South Asian countries in 2013 (share of cereals)
Source : FAOSTAT, 2016
0
10
20
30
40
50
60
70
80
90
Afgh. Bangl. India Nepal Pakis. Sri L.
Percentage of Kcal fromcereals
Percentage of Kcal fromwheat
Percentage of Kcal fromrice
Percentage of Kcal frommaize

Figure 2. Cereal production in South Asian countries (share of total crops)
Source : FAOSTAT, 2016

Table 1. Undernourishment Trends in South Asia
Number of Undernourished Undernourishment Prevalence
1990-1992 2014-2016 1990-1992 2014-2016
South Asia 291.2 281.4 23.90% 15.70%
Afghanistan 3.8 8.6 29.50% 26.80%
Bangladesh 36 26.3 32.80% 16.40%
India 210.1 194.6 23.70% 15.20%
Maldives < 0,1 < 0,1 12.20% 5.20%
Nepal 4.2 2.2 22.80% 7.80%
Pakistan 28.7 41.4 25.10% 22%
Sri Lanka 5.4 4.7 30.60% 22%
Source: FAOSTAT, 2016

Table 2. Evolution of cereal yield per Hectare in South Asia (1961 - 2014)
1961 1970 1980 1990 2000 2014 Evolution (%) 1961-2014
Afghanistan 11151 11151 13490 12006 8063 20175 80.93%
Bangladesh 16811 16662 20058 24906 33844 46184 174.72%
Bhutan 14408 14367 14250 10350 14379 31300 117.24%
India 9473 11348 13500 18912 22942 29841 215.01%
Maldives 8883 8922 8500 10000 14855 24051 170.75%
Nepal 18466 17825 16871 19201 21363 27479 48.81%
Pakistan 8564 12297 16131 17664 24079 27503 221.15%
Sri Lanka 17654 21547 25011 29650 33382 38019 115.36%
South Asia 10118 11835 14170 18935 23488 30028 196.78%
Africa 8102 9075 11309 11805 12699 16131 99.10%
Least developed countries 10725 11176 13253 13788 16008 20009 86.56%
Source: FAOSTAT, 2016

Table 3. Evolution of rice, wheat and maize production in South Asia
Rice Wheat Maize
1991 2000 2014 1991 2000 2014 1991 2000 2014
Afghanistan 333000 260000 537000 1 650 000 1 469 000 5370259 480000 115000 316000
Bangladesh 26777904 37627500 52231000 890 000 840000 1303300 3350 10 000 1525000
Bhutan 55157 44300 76621 5000 4350 5172 40 000 48 500 74370
India 111151408 127464896 157200000 55134496 76368896 94483000 8961700 12043200 23670000
Nepal 3222540 4216465 5047047 835970 1183530 1883147 1204710 1414850 2283222
Pakistan 4864650 7203900 7005000 14565000 21078600 25979000 1203100 1643200 4695000
Sri Lanka 2389000 2859900 3381000 34050 31050 241144
South Asia 148793659 179676961 225477668 72 190 466 100 944 376 129023878 11886910 15247300 32804736
Source: FAOSTAT, 2016

Table 4. Variable definitions and sources
Variables Definition Source
undernutrition Prevalence of undernourishment (%) (3-year average) World Bank World Development
Indicators database
lncereals Production of cereals in log FAOSTAT
PerCapitaCerealProd Production of cereals per capita FAOSTAT
lncerealyield Yield of cereals in log FAOSTAT
ln rice Production of rice in log FAOSTAT
ln wheat Production of wheat in log FAOSTAT
ln maize Production of maize in log FAOSTAT
Foodsupplydiversity Share of dietary energy derived from cereals, roots and tubes FAOSTAT
Average Dietary Energy
Supply Adequacy Dietary Energy Supply as a percentage of Average Dietary Energy Requirement FAOSTAT
Food Price Index Domestic food price index FAOSTAT
Per capita food production
variability Variability of net per capita food production in constant 2004-2006 international $ FAOSTAT
Improved sanitation facilities
(% of population with access) percentage of the population using improved sanitation facilities FAOSTAT
mortality Mortality rate, under-5 (per 1,000 live births)
United Nations Population Division.
World Population Prospects
lngdppc GDP per capita in log World Bank national accounts data
popgrowth Growth in total population
United Nations Population Division.
World Population Prospects
inflation Inflation, consumer prices (annual %)
International Monetary Fund,
International Financial Statistics and
data files.
gfce Public spending to GDP ratio
World Bank World Development
Indicators database
climatologicaldisaster
dummy variable taking the value of 1 for the year of Climatological disaster (drought,
earthquake, flood, extreme temperature event) associated with food shortage, crop failure or
famine
Emergency Events Database (EM-
DAT)
terrorkilledmillion terrorism related casualties per million population Global Terrorism Database
Food crisis Dummy variable taking 1 for 2007-2008 and zero otherwise
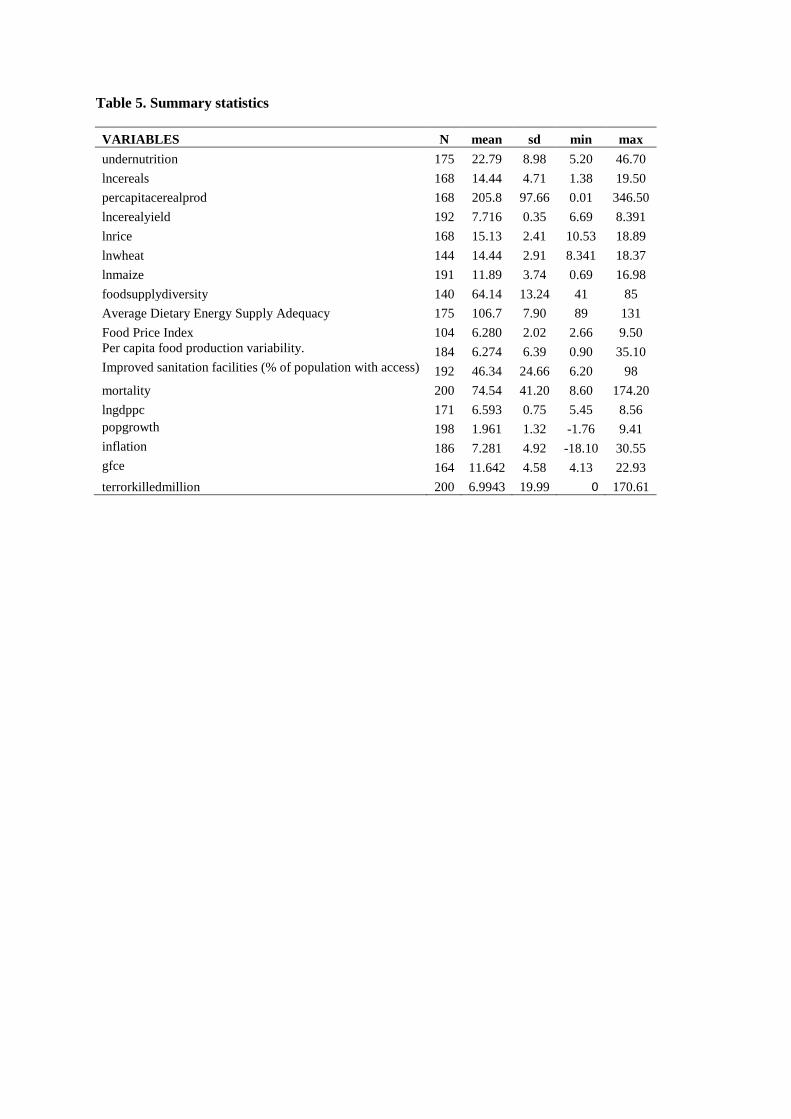
Table 5. Summary statistics
VARIABLES N mean sd min max
undernutrition 175 22.79 8.98 5.20 46.70
lncereals 168 14.44 4.71 1.38 19.50
percapitacerealprod 168 205.8 97.66 0.01 346.50
lncerealyield 192 7.716 0.35 6.69 8.391
lnrice 168 15.13 2.41 10.53 18.89
lnwheat 144 14.44 2.91 8.341 18.37
lnmaize 191 11.89 3.74 0.69 16.98
foodsupplydiversity 140 64.14 13.24 41 85
Average Dietary Energy Supply Adequacy 175 106.7 7.90 89 131
Food Price Index 104 6.280 2.02 2.66 9.50
Per capita food production variability. 184 6.274 6.39 0.90 35.10
Improved sanitation facilities (% of population with access) 192 46.34 24.66 6.20 98
mortality 200 74.54 41.20 8.60 174.20
lngdppc 171 6.593 0.75 5.45 8.56
popgrowth 198 1.961 1.32 -1.76 9.41
inflation 186 7.281 4.92 -18.10 30.55
gfce 164 11.642 4.58 4.13 22.93
terrorkilledmillion 200 6.9943 19.99 0 170.61

Table 6. Food security and cereal production - Production indicators
(1) (2) (3) (4) (5) (6)
VARIABLES
undernutrit
ion
undernutrit
ion
undernutrit
ion
undernutrit
ion
undernutrit
ion
undernutrit
ion
lncereals -11.73***
(2.857)
percapitacerealpr
od
-0.0697***
(0.0126)
lncerealyield
-21.53***
(3.746)
lnrice
-9.313***
(2.261)
lnwheat
-2.588
(1.869)
lnmaize
-2.159***
(0.212)
lngdppc -1.116 -2.735 1.918 -3.407* -3.305** -2.001
(2.104) (1.795) (2.223) (1.915) (1.306) (1.327)
popgrowth 4.150*** 5.566*** 2.136*** 3.044*** 3.770*** 2.716***
(1.136) (0.950) (0.722) (0.735) (0.798) (0.560)
inflation -0.0839 -0.0602 -0.0994 -0.0642 -0.0162 0.0465
(0.0666) (0.0618) (0.0616) (0.0657) (0.0448) (0.0497)
gfce -1.508*** -1.242*** -0.835*** -0.557*** -1.150*** -0.696***
(0.257) (0.241) (0.194) (0.206) (0.158) (0.156)
climatologicaldis
aster 0.425 0.169 0.153 -0.0339 0.389 0.303
(0.584) (0.556) (0.545) (0.600) (0.437) (0.444)
terrorkilledmillio
n 0.0124 0.00354 -0.0131 -0.0362* -0.00888 -0.0234
(0.0230) (0.0217) (0.0183) (0.0202) (0.0141) (0.0150)
foodcrisis 0.478 0.541 0.872 1.141 0.306 0.902
(0.920) (0.867) (0.867) (0.941) (0.620) (0.709)
Constant 231.1*** 56.88*** 184.8*** 196.4*** 88.54*** 65.71***
(44.68) (12.35) (21.91) (31.78) (28.98) (7.931)
Observations 106 106 126 121 78 126
R-squared 0.741 0.770 0.673 0.637 0.807 0.780
Number of id 6 6 7 6 4 7 Note: Columns 1 to 6 show estimations with logs of cereal production, per capita cereal production, cereal yield, rice production, wheat
production and maize production respectively. Bangladesh is excluded in estimation with wheat production (Column 5) due to its negligible
role in daily diet. Standard errors in parentheses *** p<0.01, ** p<0.05, * p<0.1

Table 7. Food security and cereal production - Alternative estimates
(1) (2) (3) (4) (5) (6) (7) (8)
VARIABLE
S
undernu
trition
undernu
trition
undernu
trition
undernu
trition
undernu
trition
undernu
trition
undernu
trition
undernu
trition
foodsupplyd
iversity -0.432
(0.360)
lncereals
-
12.96*** -7.634*
(3.103) (4.268)
L.lncereals -7.156**
(2.881)
L2.lncereals
-
9.061***
(2.792)
L3.lncereals -5.787*
(3.386)
L4.lncereals -1.797
(3.044)
L5.lncereals 0.561
(0.976)
lngdppc
-
10.35*** -0.916 -9.043 -3.283 -3.240 -4.212* -5.053** -5.019**
(3.206) (2.161) (5.992) (2.183) (2.155) (2.259) (2.243) (2.164)
popgrowth 3.817*** 3.830*** 2.891* 4.612*** 4.135*** 4.716*** 5.444*** 6.043***
(0.909) (1.176) (1.583) (1.298) (1.272) (1.435) (1.481) (1.161)
inflation -0.0150 -0.0822 -0.0699 0.00418 0.0404 0.0576 0.0303 0.00759
(0.0759) (0.0680) (0.0833) (0.0730) (0.0751) (0.0777) (0.0764) (0.0705)
gfce -0.413
-
1.477***
-
1.266***
-
1.434***
-
1.758***
-
1.684***
-
1.755***
-
1.622***
(0.279) (0.262) (0.332) (0.290) (0.300) (0.320) (0.326) (0.309)
climatologic
aldisaster 0.346 0.312 0.633 0.652 0.703 0.921 1.234* 0.978
(0.710) (0.605) (0.706) (0.635) (0.622) (0.644) (0.641) (0.618)
terrorkilled
million -0.0283 0.0130 0.0237 0.00957 0.0145 0.0227 0.0136 0.00426
(0.0325) (0.0232) (0.0268) (0.0246) (0.0239) (0.0252) (0.0242) (0.0222)
foodcrisis 0.307 0.470 0.160 0.277 0.140 -0.0538 0.0784 0.306
(1.130) (0.930) (1.202) (0.987) (0.959) (0.991) (0.942) (0.880)
Constant 115.3*** 258.2*** 206.0*** 165.9*** 200.5*** 150.0*** 88.77* 47.68**
(38.71) (50.13) (50.11) (46.37) (45.91) (55.18) (50.40) (21.33)
Observation
s 111 101 83 102 98 94 90 86
R-squared 0.505 0.746 0.738 0.703 0.716 0.693 0.692 0.688
Number of
id 7 5 5 6 6 6 6 6 Note:Column 1 shows estimation including food supply diversity. Columns 2 and 3 show estimations excluding Maldives and India
respectively. Columns 4 to 8 show estimations with one, two, three, four and five lags of the log of cereal production respectively. Standard
errors in parentheses *** p<0.01, ** p<0.05, * p<0.1

Table 8. Food security and cereal production - Dimensions of food security
(1) (2) (3) (4) (5)
VARIABLES
Average
Dietary Energy
Supply
Adequacy
Food
Price
Index
Per capita food
production
variability.
Improved
sanitation facilities
(% of population
with access)
mortality
lncereals 9.068*** -0.197 -11.39*** 12.52*** -27.81***
(2.627) (0.274) (2.647) (3.302) (6.352)
lngdppc -2.713 0.444 12.38*** 24.14*** -72.62***
(1.935) (0.298) (1.841) (2.296) (4.417)
popgrowth -4.495*** -0.321** 0.852 -1.026 2.863**
(1.045) (0.150) (0.563) (0.702) (1.351)
inflation 0.104*
-0.194** -0.0967 0.384**
(0.0613)
(0.0756) (0.0943) (0.181)
gfce 1.891*** 0.136*** 0.136 0.0463 -1.873***
(0.237) (0.0324) (0.267) (0.333) (0.641)
climatologicaldisaster -0.876 -0.00633 -0.731 0.105 1.609
(0.537) (0.0650) (0.760) (0.948) (1.823)
terrorkilledmillion -0.0406* 0.00973 -0.0270 -0.0371 0.143*
(0.0211) (0.00666) (0.0323) (0.0403) (0.0776)
foodcrisis -0.604 -0.0408 2.750** 1.300 -3.830
(0.846) (0.0825) (1.146) (1.430) (2.751)
Constant -37.26 5.460 105.9*** -313.9*** 1,002***
(41.08) (3.885) (35.57) (44.37) (85.36)
Observations 106 75 129 129 129
R-squared 0.696 0.420 0.421 0.780 0.887
Number of id 6 6 7 7 7 Notes: Columns 1 to 5 show estimations with Average Dietary Energy Supply Adequacy, Food Price Index, Per capita food production
variability, Improved sanitation facilities and mortality as dependent variables respectively. Standard errors in parentheses *** p<0.01, **
p<0.05, * p<0.1