cep discussion paper no 1275 june 2014 quantifying ...cep.lse.ac.uk/pubs/download/dp1275.pdf ·...
TRANSCRIPT
ISSN 2042-2695
CEP Discussion Paper No 1275
June 2014
Quantifying Spillovers in Open Source Content Production: Evidence from Wikipedia
Aleksi Aaltonen Stephan Seiler

Abstract Using detailed edit-level data over eight years across a large number of articles on Wikipedia, we find evidence for a positive spillover effect in editing activity. Cumulative past contributions, embodied by the current article length, lead to significantly more editing activity, while controlling for a host of factors such as popularity of the topic and platform-level growth trends. The magnitude of the externality is significant, and growth in editing activity on the average article would have been about 50% lower in its absence. The spillover operates through an increase in the number of contributing users, whereas the length of contributions remains unchanged. Edits triggered by spillovers involve only marginally more deletion and replacement of content than the average edit, suggesting that past contributions do inspire the creation of new content rather than corrections of past mistakes. Roughly 75% of the spillover is due to new rather than returning users contributing content. Key words: Wikipedia, open source, user-generated content, knowledge spillover, cumulative knowledge JEL: D24; L23; L86; M11; O31 This paper was produced as part of the Centre’s Productivity Programme. The Centre for Economic Performance is financed by the Economic and Social Research Council. We thank conference participants at Marketing Dynamics (UNC Chapel Hill) and NBER digitization for great feedback. We also bene_tted greatly from discussions with Kate Casey, Ben Faber, Avi Goldfarb, Andreea Gorbatai, Anders Jensen, Shane Greenstein, Christos Makridis, Petra Moser, Navdeep Sahni and Felix Weinhardt. All errors are our own. Aleksi Aaltonen, Warwick Business School, University of Warick. Stephan Seiler, assistant professor Stanford University and a research associate at Centre for Economic Performance, London School of Economics. Published by Centre for Economic Performance London School of Economics and Political Science Houghton Street London WC2A 2AE All rights reserved. No part of this publication may be reproduced, stored in a retrieval system or transmitted in any form or by any means without the prior permission in writing of the publisher nor be issued to the public or circulated in any form other than that in which it is published. Requests for permission to reproduce any article or part of the Working Paper should be sent to the editor at the above address. A. Aaltonen and S. Seiler, submitted 2014.

1 Introduction
Recently, a substantial growth in user-generated content provision occurred on the Internet
that to a large extent took place outside of traditional firms. Some user-generated content
platforms are primarily used to share individually produced content, such as blogs or social
networks like Facebook or Twitter. In other cases, a more direct interaction occurs between
users in the production of content, and the end product is the result of a collaborative process
with different people contributing pieces of the final content. A leading example of this type
of joint production is Wikipedia, an online encyclopedia that contains almost 4.4 million
individual articles on the English language version alone and has been edited by over 20
million users since its inception in 2001. Also in terms of content consumption, Wikipedia
has been hugely influential with about 400 million visits per month. It is among the top 10
most visited sites in many countries and the third most visited user-generated-content site in
the United States behind Facebook and YouTube.1 Within the market for encyclopedias, it
has to a large extent displaced the former market leader, the Encyclopedia Britannica, which
is based on a more traditional process of content production.2
Wikipedia, and open source production more generally, constitutes a marked departure
from such traditional modes of production within firms. Rather than using a fixed set of proce-
dures to arrive at a pre-specified output goal, open source is characterized by commons-based
peer production, a process that is “decentralized, collaborative, and nonproprietary; based
on sharing resources and outputs among widely distributed, loosely connected individuals”
(Benkler (2006)). Despite an ever increasing number of activities and firms relying on open
source content creation, we currently have little empirical understanding of the production
process in such environments. In this paper, we use detailed edit-level data from Wikipedia to
answer a central question in the context of open source content production: does individual
content creation spill over onto subsequent content creation by other users on the platform?
This type of externality is specific to an open source environment like Wikipedia and consti-
tutes an important advantage over other types of production processes: having a large pool of
potential editors allows individual contributors to add small pieces of information to an article
and rely on subsequent users to develop the content further. In contrast to a more traditional
editorial process, a user does not need to provide the entire content on a particular topic.
Relying on a managerial structure to explicitly organize and coordinate the editing activity is
also unnecessary. Instead, a large set of anonymous users interacts in the creation of content.
A change in article content might therefore inspire other users to further build on the newly
added content. This mechanism is similar to the process of knowledge accumulation analyzed
in the R&D literature (Scotchmer (1991), Weitzman (1998)), where innovators make use of
prior knowledge allowing them to “stand on the shoulder of giants.”3 Similarly here, users will
1see http://www.alexa.com/topsites, accessed May 2014.2Since the emergence of Wikipedia, Encyclopedia Britannica’s profits have decreased substantially from a
peak of $650 million in 1990 to only about 10% of this amount (after adjusting for inflation) in 2013 (Devereuxand Greenstein (2009)).
3Similarly to the dynamics of R&D and innovation (Kortum (1997)), the spillover effect could in principlebe negative if an edit is crowding-out future edits by “fishing out of the pool,” that is by reducing the set of
1

draw on the current stock knowledge embodied in past edits when contributing. Current con-
tent might influence them by providing new information about a topic or by making potential
areas for further contributions salient to them (Olivera, Goodman, and Tan (2008)). To the
best of our knowledge, this paper is the first to estimate the magnitude of such a spillover
effect and quantify its role in the growth process of open source content.
To estimate the editing externalities, we regress measures of weekly editing activity on
current article length (at the beginning of the respective week). We focus our attention on
Wikipedia articles that mirror efforts of more traditional encyclopedias, namely the incorpo-
ration of a given knowledge stock into online content. To this end, we analyze the subset of
Wikipedia articles belonging to the “Roman Empire” category for which the stock of knowl-
edge is presumably relatively stable over time.4 We control for inherent popularity differences
across topics by including a set of article fixed effects. Furthermore, we allow for an aggregate
growth trend for the Roman Empire category as a whole in a flexible way by including a
separate dummy for every week in our eight-year sample period (a week/article combination
is our unit of observation). In sensitivity checks, we also show robustness to including flexible
article-specific time trends and run a specification that uses only changes in editing behavior
following drastic changes in article length. Finally, we run a sensitivity check to control for the
presence of external information shocks that are correlated over time. Our main coefficient of
interest remains significant and of similar magnitude across this battery of robustness checks.
The estimated positive effect of article length on editing activity is statistically significant
and economically important. Using the predictions implied by our regression framework, we
quantify growth in editing activity in the absence of the spillover effect to assess its role in
the overall growth process. Removing the spillover, we find that growth in editing activity
between 2002 and 2010 would have been halved. Moreover, article length leads to more
editing activity by increasing the number of users editing a particular article. However, we
find no evidence that the length of edits changes as articles grow. Edits on longer articles are
more likely to involve deletion of content and are more likely to be reverted by subsequent
edits. However, both effects are small in magnitude. Finally, we find that the spillover effect
triggers content contributions of which 75% is attributed to new users and 25% to users that
had previously edited the same article.
Understanding the growth dynamics and the importance of editing spillovers on open
source platforms is of importance beyond the specific application to Wikipedia, which we
use as a test bed for the empirical analysis. Many firms are now using internal “wiki”-style
platforms to create, store, and share knowledge within the company. Other public open
source projects, such as an online dictionary and a collection of open source teaching ma-
terial, use the same technological platform and user interface as Wikipedia. Furthermore,
similar open source initiatives exist in the realm of medicine (e.g. the “Open Source Drug
possible content that can be added to the article. The sign and magnitude of the net spillover effect is thereforeultimately an empirical question.
4We do not concern ourselves in this paper with the interesting question of how Wikipedia incorporatesnew information. For articles on current political events for instance, new information plays a key role andthe knowledge stock is constantly changing. In contrast, the knowledge stock for the selected set of articles islikely to change less.
2
Discovery for Malaria Consortium” and “OpenEMR,” an electronic health records and med-
ical practice management application) and science and engineering (the “Science Commons”
allows the dissemination of scientific work outside of academic journals). Finally, more and
more open source projects are emerging that involve the production of physical products
such as Threadless.com, which relies on a large community of over 500,000 people to design
and select T-shirts (Malone, Laubacher, and Dellarocas (2009)) or Open Source Cola (see
http://en.wikipedia.org/wiki/Open source cola).5 Our findings can thus inform the design of
other open source platforms and projects. The presence of the editing externality suggests
that incentivizing users to contribute content or to “pre-populate” articles with content in
order to trigger further contributions might be beneficial. We also find suggestive evidence
that the magnitude of the spillover effect varies with the total number of users active on
the platform. This finding suggests that achieving a larger mass of potential contributors is
important to benefit from a stronger spillover effect.
One important caveat to our analysis is the fact that we can only measure the amount of
editing activity but are not able to directly assess the evolution of article quality. Quantifying
article quality is generally a difficult problem, and no metric is readily available to measure
quality consistently across articles and time.6 One might suspect that a larger amount of
editing will increase the final quality of Wikipedia articles, which research has shown is high
(Giles (2005)). Several studies across a wide range of topic areas find that Wikipedia contains
few outright factual errors, but articles often contain significant gaps in their coverage of a
specific topic area (Bragues (2007), Devgan, Powe, Blakey, and Makary (2007) and Brown
(2011)). This finding suggests that editing activity that is likely to extend the breadth of
coverage on a specific topic will tend to improve quality.
The paper relates to the literature documenting the growth process on Wikipedia, such
as Almeida, Mozafar, and Cho (2007), Suh, Convertino, Chi, and Pirolli (2009) or Voss
(2005), as well as the emerging literature on Wikipedia more broadly, such as Greenstein and
Zhu (2012a) and Greenstein and Zhu (2012b), who document the extent of political slant
on Wikipedia. Zhang and Zhu (2011) and Ransbotham and Kane (2011) analyze the effect
of the social network structure within Wikipedia. Nagaraj (2013) uses Wikipedia data to
assess the effect of copyright on creative reuse. One paper that looks at a related but more
narrowly defined issue is Gorbatai (2011), who analyzes whether expert editors become more
active when observing prior edits by novice users. Our study is also related to the concepts
of knowledge accumulation and knowledge spillovers, which are central to the endogenous
growth literature (Romer (1990), Jones (1995), Furman and Stern (2011)). At the micro level,
Jaffe (1986) takes as evidence for spillover effects the fact that competing firms’ R&D affects
a firm’s own activity. Using data from patent citations, several papers explore the specific
nature of the spillover effect and how its magnitude varies with distance (Henderson, Jaffe, and
Trajtenberg (1993)), within and across firms (Belenzon (2012)) as well as between countries
5See http://en.wikipedia.org/wiki/Open source for a list of current open source projects.6Arazy, Nov, Patterson, and Yeo (2011) measure quality for a small number of articles at one point in time
by having 3 librarians assess quality for each article. Kittur and Kraut (2008) use an internal categorizationof articles into 6 gradations of quality. This metric, however, is only available for a small subset of articles.
3
(Jaffe and Trajtenberg (1999)). In this paper, we quantify the magnitude of a spillover effect
within Wikipedia of accumulated past knowledge, as embodied by the article length, on new
knowledge creation, which we capture by measures of current editing activity. Finally, our
paper relates to the research on user-generated content such as Toubia and Stephen (2013)
or Shriver, Nair, and Hofstetter (2012), who study content contribution on social networks.
In contrast to our setting, social platforms are primarily used to share user-specific pieces
of content rather than for the joint production of a complex final product as is the case on
Wikipedia.
The structure of the paper is as follows: In the next section, we provide a description of
the data as well as descriptive statistics. In section (3), we outline a simple theoretical model
of content contribution in order to guide the empirical analysis. Sections (4) and (5) present
the main empirical results as well as robustness checks and additional results. Finally, we
provide some concluding remarks.
2 Data and Descriptive Statistics
We use the English Wikipedia database extracted on January 30, 2010, that has been made
freely available by the Wikimedia Foundation.7 The data set contains the full text of every
version of all articles from the beginning of the website in January 2001 to January 2010,
allowing us to track the evolution of content across edits for each article. We preprocessed
the XML records in the raw data using Python scripts into a tabular data set representing
19,376,577 articles and 306,829,058 edits. Our analysis focuses on a subset of those articles
that belong to one particular category: the “Roman Empire.” We choose this category, which
comprises 1,403 unique articles, because knowledge on the topic is presumably undergoing
relatively little change during our sample period. This focus helps us in terms of our identifi-
cation strategy and also removes an additional layer of complexity, which is the incorporation
of new information into Wikipedia. In the appendix we provide details on how we selected
the set of articles. Our final data set comprises 1,403 articles and 77,671 individual edits.
We transform the XML records into a numerical format and focus on the length of the
article at each version as well as the amount of change in content, measured by the number
of characters a particular edit of the article changed. More precisely, for two consecutive
versions of the same article, we compute the number of characters that need to be added,
deleted, or changed (each of these actions is counted equally) in order to convert one version
of the article into the next. For ease of exposition, we will refer to this metric simply as “edit
distance” in the remainder of the paper. More specifically, we use an algorithm known as Lev-
enshtein edit distance (Levenshtein (1966)), which is used in areas such as signal processing,
information retrieval, and computational biology (Myers (1986), Navarro (2001), Spiliopoulos
and Sofianopoulou (2007)) and is designed to assess and quantify the degree of (dis-)similarity
between strings of text. We provide a more detailed description of the procedure and its im-
plementation in the appendix. The calculation is computationally relatively heavy but offers
7enwiki-20100130-articles-meta-history.xml.7z (size: 5.9 Terabyte!!!)
4
an intuitive definition of string difference, that is, the amount of change in content induced
by an edit.8 Finally, we are also able to track users across multiple edits.
In the sections below, we provide some key descriptive statistics on users’ editing behavior
as well as aggregate growth trends for articles in the Roman Empire category. Using our
estimation framework, we later isolate the share of activity growth that originated from the
editing externality. The general growth patterns therefore provide the backdrop and a useful
benchmark for assessing the quantitative importance of the spillover effect.
2.1 Editing Behavior
Our sample contains a total of 77,671 (non-bot) edits across all 1,403 Roman Empire articles.9
The first two lines of Table (1) report the extent of individual edits measured by the change
in article length in units of characters. For ease of exposition, we split the sample into
positive and negative length changes, the former representing about two thirds of all edits.
Taken together, the two rows display a large degree of heterogeneity in the length of edits.
Whereas the median length change for positive and negative changes is 36 and 29 characters,
respectively, the length of edits increases exponentially with length changes of over 10,000
characters at the 99th percentile. A similar picture emerges when we use edit distance as the
measure of editing activity: we observe edits in the tail of the distribution that are orders
of magnitudes larger than the median edit. In other words, although the growth process of
articles is smooth and incremental for the most part, occasional large edits can change article
content dramatically. These types of discrete jumps in content are something we explicitly
exploit in one of our empirical tests.
Apart from the length of individual contributions, we focus on two characteristics of edits
that are important when assessing the spillover: the degree of content addition versus deletion
as well as whether an edit is later reverted by returning the article to a previous version. The
former allows us to characterize the extent to which an edit provides new content rather
than deleting or replacing existing content. The latter allows us to capture the longevity of
a contribution, because reverted edits do not have a lasting impact on an article’s content.
We later characterize the edits triggered by the spillover effect along those two dimensions
in order to understand what “type of edits” the externality induces. To capture the extent
of addition and/or deletion of content, we use a simple metric that combines information
from edit distances and length changes. In particular, it has to hold that |∆Length| <=
8The number of characters changed is arguably the most direct measure of the extent of an individual edit.Consider, for instance, the case of an edit that replaces large parts of an article with new content and mightentail little change in article length despite substantial content changes. Our edit distance metric is able tocapture such changes, which one would miss when measuring changes in article length.
9We remove bot activity in all of the descriptive statistics and for the main empirical analysis. That is, weare only concerning ourselves with human, non-automated editing activity. In the main empirical analysis, wedo not consider contributions by bots as part of editing activity. However, we do keep track of the aggregatearticle length at every point in time regardless of whether bots or human users have edited the article. Inother words, we are only looking at human user contributions to the individual articles and will ignore botcontributions when computing our dependent variable, editing activity. The current knowledge stock capturedby the articles’ length instead will reflect cumulative edits by both humans and bots. In the appendix, wedescribe in detail how we identify bot-edits in the data.
5

EditDistance. At the extremes, an edit that only adds new content will have ∆Length =
EditDistance, whereas for a deletion of content, it holds that −∆Length = EditDistance;
that is the number of characters that were changed is equal to the reduction in length. The
length change (in either direction) cannot exceed the number of characters changed. Based on
the relationship between the two variables, we compute ∆Length/EditDistance ∈ [−1, 1]. We
find that about 37% of edits are pure additions of content (i.e., ∆Length/EditDistance = 1),
whereas 15% are pure deletions. The remaining edits are intermediate cases in which some
existing content was deleted, but new content was also added. Edits within the intermediate
range are roughly uniformly distributed over the range of our metric.
Next, we report the number of edits that are involved in the reversion of a past edit. A
reversion can happen if a user decides to overturn a previous edit (or a sequence of edits)
and rewrites the article in such a way that the article’s content is returned to a prior version.
Reversions happen frequently and papers such as Halfaker, Kittur, Kraut, and Riedl (2009),
Vigas, Wattenberg, and Dave (2004), and Piskorski and Gorbatai (2013) focuses entirely on
the dynamics of reverting edits. To define an edit as a reversion, we use an assessment of
string (dis-)similarity similar in spirit to the earlier edit distance computation. Specifically,
we compare every version of a particular article with the previous 100 versions (if that many
exist) and assess whether the current version is identical to any of the previous ones.10 We
find that 29% of articles within the Roman Empire category are involved in a reversion. Out
of those, 14% are edits that have been reverted and 13% are reverting edits that restore a
previous version of the article. About 2% of edits are reverting edits that are subsequently
reverted. These edits are mostly part of longer spells of “edit wars” in which users go and back
forth between reverting each other’s edits repeatedly. Reversions arise from two main sources:
disagreement over newly added content, which then gets removed as part of a reversion, and
vandalism. The latter usually involves the deletion of a large amount of content that is
subsequently restored by a reverting edit. How to deal with reverted edits as well as the
reverting edits is important for our empirical analysis. For instance, consider the unsuccessful
attempt to add 1,000 characters’ worth of content. In the data, this attempt will be recorded
as two edits (the addition of content and a subsequent revert action), both with an edit
distance of 1,000 characters. Such a sequence of edits lead to a seemingly large amount
of editing activity while actually leaving the article unchanged. Similarly, “edit wars” can
contain a large amount of edits that add and remove the same piece of content multiple
times. At the bottom of Table (1), we report edit distance separately for edits that are (not)
involved in a reversion and reverted/reverting edits. We find edits involved in reversions to
be substantially larger presumably due to vandalism involving big changes in content. For
the empirical analysis, we drop all edits that are overturning a prior edit by restoring the
article to an earlier version, namely all reverting edits. However, we do keep most reverted
10Note that previous research used other, usually less conservative, definitions. For instance, Suh, Convertino,Chi, and Pirolli (2009) classify edits that have certain keywords (like “revert”) in the comment provided bythe editing user as reverting edits. Instead of relying on “self-declared” reverts, we compare the actual contentby classifying every instance that returns the article content to a previous version of the article as a revertingedit. Relative to Suh, Convertino, Chi, and Pirolli (2009), we find a substantially larger fraction of reverts,presumably due to these classification differences.
6

edits in our sample because they constitute legitimate editing activity despite the fact that
they do not have a lasting impact on the article. Indeed, many edits, even if they are not
deleted immediately, are removed at least partially by later edits. The only exception to the
above rule are edits that we consider to be acts of vandalism. We define vandalism as an
edit that is a pure deletion of content that was later reverted. Going forward, all descriptive
statistics and other empirical analysis will be based on the subsample of (non-bot) edits that
are neither reverting nor vandalizing edits. The last row of Table (1) shows the distribution
of edit distance, a key measure of editing activity, for the final sample of edits.
For most of our empirical analysis, we aggregate editing activity at the article/week-level,
allowing us to measure the number of users editing the article, as well as other measures of
editing activity over a fixed weekly time window. Importantly, individual articles often have
long spells of inactivity, something the summary statistics at the edit-level in the previous
table do not capture. We document the distribution of two key variables that measure editing
activity in the lower panel of Table (1): the number of users11 and cumulative edit distance
per week (added up across individual edits if multiple edits occur within a week). The unit
of observation is an article/week combination, of which we have a total of 265,707 across the
1,403 articles and up to 434 weeks. In about 86% of article-weeks, we observe no editing
activity. The average number of users is equal to 0.215, and rarely is more than one user
editing an article in any given week.
2.2 Content Growth at the Category Level
As a backdrop to our analysis of spillover effects, we provide some key empirical facts on the
overall content growth process to which, as we argue later, the spillover effect contributed
considerably. We start by reporting the evolution of content for the Roman Empire category
as a whole. Table (2) reports the number of articles created each year as well as the amount
of editing activity on those articles. We find that the number of new articles created increases
almost monotonically until 2005 and decreases afterward. The second and third columns re-
port the total number of users active each year and the number of edits12 on any article within
the category. For both measures, we see a substantial increase in activity peaking in 2007.
Finally, we look at the amount of editing captured by the cumulative annual edit distance
across all articles. For ease of exposition, we report edit distance in terms of characters as well
as sentences (assuming an average sentence length of 73 characters in the English language).
The pattern for this variable is similar to the other measures of editing activity: a strong
11One might be tempted to think the number of edits rather than the number of users is a more relevantmetric. However, defining the number of edits is hard because in the raw data, an edit is an instance ofsaving a new version of the article. Sometimes users save an article multiple times in a short time interval andconsidering all consecutive saved versions by the same user as a single edit might be reasonable. Any typeof aggregation is always arbitrary, however. When we aggregate any edits by the same user within an 8-hourwindow (without any other user editing the article within the same time window) into a single edit, we find ahigh correlation (correlation coefficient of 0.9785) with the number of users per week (which is not affected bymultiple saved versions). We therefore focus instead on the number of users.
12To compute the number of edits, we aggregate edits by the same user within an 8-hour window (withoutany other user editing the article within the same time window) into a single edit because users often save anarticle multiple times in a short time interval.
7

increase occurs early on and a slight decrease occurs in the later years. In the case of all
three metrics, the eventual slowdown and decrease is substantially smaller than the initial
“ramp-up,” especially in the very early years. In other words, there seems to be a degree
of maturity and possibly saturation in terms of content. But despite the long time horizon,
the level of activity is still quite high in the Roman Empire category. The growth patterns
are consistent with findings elsewhere, such as Suh, Convertino, Chi, and Pirolli (2009), who
document exponential growth patterns up to 2007 and a slowdown afterward.
Out of our three activity measures, cumulative edit distance is presumably the most direct
one because it captures both how many users engage in editing as well as how much each
contributes. Similar to Almeida, Mozafar, and Cho (2007), we find that the ratio of edits
per user as well as the edit distance per edit is very stable over time. Therefore, most of the
growth process on Wikipedia is driven by an increase in the user pool rather than changes in
users’ editing intensity. This pattern is of particular relevance because we later find that the
spillover effect also operates on this dimension: longer articles see more users editing them,
but the amount of editing activity per user is unchanged. For completeness, we report a larger
set of editing activity measures in Table (B1) in the appendix.
2.3 Content Growth at the Article Level
To document growth patterns in more detail at the article level, we split articles into different
groups by “vintages”, that is the year in which the article was created. Table (3) reports
the average article level number of users as well as the cumulative edit distance for articles
of the same vintage within a given calendar year. The first thing to note is that the activity
on articles started in 2002, the first year of activity,13 dwarves the activity on articles of
any later vintage. Editing activity generally decreases across vintages for most years, and
the differences in editing activity are extremely long-lived. Even in 2009, seven years after
the earliest articles were started, the 2002 vintage articles still receive over three times more
editing activity than articles of any later vintage. We also find that later vintages peak earlier
in their lifetime and at a lower level of activity. The patterns look similar for both measures
of editing activity. The decrease in activity across vintages is most likely due to the fact
that articles on the most interesting, broad, and relevant topics were started earlier, and
these articles are therefore edited by a larger number of users. To illustrate this pattern, we
report the five articles with the largest number of edits for each vintage in Table (B4) in the
appendix. The top five articles created in 2002 all concern broad topics such as “Holy Roman
Empire” or “Saint Peter.” By contrast, among the five most edited articles of the 2009 vintage
are more narrow topics such as “Principality of Stavelot-Malmedy” and “Siege of Godesberg
(1583).” Based on these patterns, we will later use article vintage as a proxy for the breadth
and popularity of an article.
We also report the evolution of average article length, which is the stock variable toward
which the editing activity contributes. Unsurprisingly, an increase in article length over time
13Wikipedia was started in January 2001; however, for the Roman Empire category, we observe only a smallnumber of edits until the end of 2001. The 2001 articles (3) are included in the 2002 vintage.
8

accompanies the strong growth in editing activity. We find that average article length for
the earliest articles has increased roughly tenfold and by about 200% to 400% for most other
vintages. Note, however, that the growth in editing activity does not map one to one onto
growth in the stock variable article length due to the fact that some edits involve deletion or
replacement of content. We explore this aspect in more detail in Table (B2) in the appendix.
We find that over time, articles are characterized by a larger amount of reverted edits and
more replacement of content. Furthermore, earlier vintage articles experience more deletion
of content, making the differences between vintages in terms of article length less pronounced
than the differences in editing activity.
3 A Simple Model of Editing Behavior
To guide the empirical analysis of editing externalities, we outline a simple model of editing
behavior in this section. We consider the behavior of user i on article j in time period t. A user
in our terminology denotes a potential editor of the article. We do not model the consumption
of content. We assume the content in each article can be represented in a vertical quality
space as xjt ∈ [0,∞). Finally, we also assume users are homogenous with respect to their
preferences over content; that is the same content will translate into a quality metric xjt that
does not vary across users.
When a user visits a particular article j in time period t, he receives the following utility:
uit = −αij(x∗ijt − xjt)
,where αij ≥ 0 captures how strongly the user feels about the content on the article and
x∗ijt denotes the user’s preferred quality level of content on the article. We assume x∗ijt ≥ xjt.Either the consumer has knowledge that would improve the article and therefore his optimal
quality level lies above the current one, or he has nothing to add and x∗ijt = xjt. To edit the
article, the consumer incurs an editing cost ci. For simplicity, we assume the cost of editing to
be independent of the length of the edit. Given this setup, a consumer will optimally decide to
edit the article and re-position it to the optimal quality level x∗ijt according to his preferences
if
αij(x∗ijt − xjt) > ci (1)
If the user decides to contribute, the quality level at the beginning of the next time period
is altered: xjt+1 = x∗ijt. If the user does not edit the article, xjt will remain at its current
position.
We assume a user’s optimal quality level is determined by the following relationship:
x∗ijt = (1 + γij)xjt + ξijt
,where γij ≥ 0 captures the extent to which content on the article triggers any further
contributions by the user. ξijt ≥ 0 represents any information that affects the optimal quality9

level that is derived from sources outside of Wikipedia. Put differently, γij and ξijt represent
internal and external information provision, respectively. External information might not
be incorporated into the article yet, which would lead to ξijt > 0. In the case of internal
information, this information is by definition already incorporated in the article. However,
due to heterogeneity in users’ knowledge, the existing content will make areas for further
contributions salient to the user visiting the article. We therefore think of the case in which
γij > 0 not as creating new knowledge, but allowing the consumer to access existing knowledge
more easily.
We assume two types of consumers exist
Type 1: γij = γj > 0 , ξijt = 0
Type 2: γij = 0 , ξijt = ξj > 0
Type 1 represents a user that draws inspiration from the current content and will augment
it purely based on the knowledge already embedded in the current stock of content. We will
refer to this type also as “inspired” users. Type 2 represents a user that brings new external
information to the article. Each time period carries a certain probability of a user of each type
arriving. Depending on how much the user cares about the particular article (αij) relative to
his cost of editing (ci), he will decide to edit the article or not. We denote the probability
of arrival of a consumer for whom the condition in equation (1) is fulfilled with λ1j (λ2j) for
users of type 1 (2). We further assume (λ1j +λ2j) < 1; in other words, with a strictly positive
probability, no edit is made in any given time period. This could happen either because no
user visits the article or because the user visiting the article decides not to contribute any
additional content. Note that we do not distinguish between the effect of consumer arrival and
the conversion of arrivals into actual edits. This modeling choice has a close correspondence
to our empirical exercise in which we are not able either to make this distinction. Note also
that for the sake of simplicity, we model the arrival rate as being specific only to a particular
type of consumer. In principle, one could imagine the pool of potential users (of each type)
as being made up of both users that previously contributed to the particular article and
users that are new to it. Returning users, similar to new users, might have new external
knowledge (which they acquired since their last contribution) as well as draw inspiration from
the content additions since their previous visit to the article. To keep the analysis simple,
we will not model the dynamics of return visits and edits explicitly. However, in section (5),
we investigate empirically the extent to which the spillover leads to editing activity from new
versus returning users.
It is easy to see that when a type-2 user visits the article in time period t, the growth in
content is equal to ∆xjt = xjt+1−xjt = ξj , which is the new information the user incorporates
into the article. However, in our model, the difference in content change not only affects the
current time period t, but also has a knock-on effect on future time periods. One time period
10

ahead, the expected level of content growth (relative to no user visiting in time period t) will
be
E(∆xjt+1|Typejt = 2)− E(∆xjt+1|Typejt = ∅) = λ1jγjξj
In total, a relative increase of (1+λ1jγj)ξj will occur, comprised of the initial incorporation
of ξj and the positive externality on editing in the next period λ1jγjξj . The magnitude of
the externality is determined intuitively by the probability that an “inspired” user arrives λ1j
and the magnitude of the inspiration effect γj . Our main focus in this paper is to estimate
the magnitude of this article-specific positive externality.
3.1 Article level and Aggregate Growth
In the case of a platform experiencing such a rapid growth process as Wikipedia, considering
factors driving growth at the article level as well as at a more aggregate level for the plat-
form as a whole is important. This distinction will play an important role in our empirical
identification strategy. For each article individually, the existence of some type-1 users (i.e.
with γij > 0) will lead to higher activity on articles with a higher content quality level xjt.
However, the pool of potential users likely grows over time as Wikipedia’s aggregate content
and the level of visibility of the platform grows.
In our model, we can think of this mechanism as the aggregate content stock shifting
the probability of a “knowledgable” user visiting the article. Formally, we assume that the
probability of article j being visited by a type-2 user λ2jt is a function of aggregate content
across all articles Xt =∑
j xjt. More specifically, we model the effect of an increase in the
user pool with the assumption that∂λ2jt∂Xt
> 0. In other words, the visit probability increases
with Xt for type-2 users that are able to contribute external knowledge to the article. This
assumption turns the visit probability λ2jt into a time period-specific variable, which was not
the case previously.
To see how the mechanism described above affects the analysis, consider the following
expressions for ex-ante expected growth rates in consecutive periods:
E∆xjt = λ1jγjxjt + λ2jtξj
E∆xjt+1 = λ1jγjxjt+1 + λ2jt+1ξj
Note that in the absence of an effect of platform-level growth on the visit probability
(λ2jt = λ2jt+1), we will see an increase in activity over time (E∆xjt+1 > E∆xjt) only if the
content stock increased (xjt+1 > xjt) and some positive externality exists (γj > 0). Instead,
in the case of an increase in the visit probability caused by an increase in aggregate content
(Xt+1 > Xt and therefore λ2jt+1 > λ2jt), we could see an increase in activity even in the
absence of an externality from editing (γj = 0). In this case, we would observe an increase in
editing activity over time as well as an increase in the content stock. This correlation is due
to the fact that content on other articles grows, which will increase λ2j and at the same time11

xjt increases as new external information ξj is used to update the article. This relationship is
not due to a causal effect. Instead, later in the platform’s life, articles tend to be longer, and
at the same time, the user pool is larger due to platform growth, but not necessarily article
level growth. To avoid picking up this purely correlational effect, we control carefully for the
time-trend in aggregate growth.
3.2 Crowding-out Effect in Editing
For simplicity, we have so far assumed that a type-2 user always contributes the same amount
ξj regardless of the current content level xjt. More realistically, some correlation will be
present in the knowledge stock among different users regarding a particular topic. We would
therefore expect that as article length increases, less additional content will be available for any
specific user to contribute to the article. Put differently, some extent of crowding-out is likely
to occur between edits as an edit will prevent somebody else from contributing the same piece
of information later on. This mechanism is similar to a “fishing-out” effect often modeled in
the innovation literature (see, e.g., Kortum (1997)). In our model, we can capture this effect
by assuming∂ξijt∂xjt
≤ 0 for type-2 users. Our baseline model represents the extreme case of∂ξijt∂xjt
= 0, where knowledge is mutually exclusive between users and a user always contributes
the same amount if he visits the article, regardless of any prior editing activity on that article.
For the case of∂ξijt∂xjt
< 0 instead, longer articles will receive less editing activity due to some of
the potential contributions having already been incorporated into the article. In the empirical
application, we will not be able to separate this effect from the positive editing externality.
Our estimate of the effect of article length on editing activity will therefore capture the net
effect of both mechanisms. However, because most of our data comes from a period of strong
growth, the crowding-out channel is likely to be less important. We also present some evidence
that both mechanisms might be at work when investigating heterogeneity in the externality
across article vintages. We find that articles that were created in later years tend to pertain to
more narrow topics. They are characterized by a lower net effect of article length on editing,
possibly due to the fact that the crowding-out effect is relatively more important for those
articles relative to ones on broader and more popular topics. The crowding-out effect would
also suggest a possible non-linear effect of article length on contributions, because the more
mature the content is, that is, the longer the article is, the stronger the crowding-out effect
conceivably becomes. We test for such patterns but find little evidence of non-linearity in the
spillover effect. Given the strong and persistent growth patterns, we might simply be “too
far away” from content maturity on most articles to identify such non-linearities.
3.3 Effect Heterogeneity across Articles
The multiplier effect in our model is given by λ1jγj . In other words, it is determined by the
arrival rate of inspired users that are willing to edit the article λ1j and the magnitude of the
inspiration effect of current content γj . We would therefore expect to see differences in the
strength of the spillover effect for articles with different λ1j and/or γj . Capturing variation
12

in γj across articles is hard, and we therefore focus our attention on variation in the arrival
rate λ1j . We expect that variation will occur in the arrival rate of users on any given article
over time as Wikipedia grows and becomes more well known and visible. In section (3.1), we
modeled the arrival rate of type-2 users, which bring new knowledge to the article, as being
a function of the total user pool. Similarly, we can think of the fraction of inspired users
arriving as increasing in aggregate content Xt =∑
j xjt; that is,∂λ1jt∂Xt
> 0. This increase in
the arrival rate will lead to an increase in the spillover effect over time as the Wikipedia user
pool grows. Similarly, we would expect cross-sectional differences in the magnitude of the
editing externality depending on the breadth and popularity of the particular topic. More
specifically, differences in the spillover effect might occur because out of the total pool of active
users on Wikipedia, only a subset is likely to be able to provide additional content to any
specific article. This subset of the total user pool is likely to be smaller for articles concerning
more niche topics, thus leading to a lower article-specific arrival rate λ1j . In section (5), we
present some results that explore both dimensions of heterogeneity in the magnitude of the
estimated spillover effect.
3.4 External Information Shocks
A final aspect of article growth that will inform our empirical analysis is the presence of
correlated external information shocks. Generally, as new knowledge regarding a particular
topic is discovered, multiple users might want to incorporate the new information into an
article. Each one will possibly contribute part of the increase in the external knowledge stock
and this can lead to temporary bursts in editing activity, which are unrelated to any editing
externality within the article. Correlated information shocks are an issue to the extent that
we might falsely interpret later edits in the activity burst to be reacting to previous edits,
whereas in reality, the same external information shock drives all editing activity within a
certain time window.
Consider, for example, the case of a temporary information shock that increases the ex-
ternal information provision of type-2 users (if one such user visits the article in a particular
time period) to ξj + θ for several periods starting in t + 1. In the absence of any editing
externality (γj = 0), expected content growth14 in t and subsequent periods is equal to
E∆xjt = λ2j(ξj)
E∆xj,t+τ = λ2j(ξj + θ)
,where τ ∈ [1, T ] denotes the set of time periods affected by the information shock. In time
period t+1 relative to time period t, article length is higher (Exjt+1 = xjt(1+λ1jγj)+λ2jξj ≥xjt), and at the same time, expected content contribution is higher by λ2jθ. The same logic
applies when comparing with time period t any of the later periods with higher editing activity
14Expectations are taken from the perspective of the beginning of the respective time period. That is, theknowledge stock at the beginning of the time period is known, but article visits have not realized yet.
13

due to the external shocks. The information shock therefore leads to a positive correlation
between article length and new content contribution when comparing the time periods affected
by the shock with the ones before. Note, however, that after the information shock is fully
incorporated into the article in t+ T , the extent of contributions will go back to the original
lower level. A comparison of any post-information shock period with periods with a higher
contribution level of (ξ + θ) will be characterized by a negative correlation of article length
and contribution level. The direction in which correlated information shocks would bias our
estimate is therefore unclear. Nevertheless, any kind of correlation that is caused by something
other than the editing externality is in principle problematic. To a large extent, the selection
of articles from the Roman Empire category helps us mitigate this issue, because knowledge
about the topics within the category is less likely to be subject to major shifts. External
information shocks that are correlated over time are therefore unlikely to be of great concern
in our specific setting. We do, however, also run a set of robustness checks to deal with this
issue specifically.
4 Content Growth and Externalities from Editing
To estimate the spillover effect described in the model, we run a regression of current editing
activity on the stock of existing knowledge. More specifically, in our main specification, we
regress the number of weekly users on the length of the article (in units of 10,000 characters)
at the beginning of the respective week. To implement this regression, we aggregate the
edit-level data at the weekly level for each article. Leaving out articles that were started in
2009 or later due to a short time-series, we have 1,267 articles and up to 434 weeks of data
for the earliest article, yielding a total of 265,706 observations.15 To control for the general
appeal and popularity of the article, we include a set of article fixed effects in the model. We
also control for a general time trend in editing behavior within Wikipedia as a whole. This
is important in our context, as the predictions from the theoretical model in section (3.1)
illustrate. Articles tend to be longer later in their lifetime, and in later years, more users
were active on Wikipedia. Table (3) highlights this feature of the data: both the length-stock
and editing activity have a positive time trend. We want to avoid picking up this general
platform-level growth effect and instead isolate the effect of article level variables on editing
activity. To this end, we include a set of weekly dummies, which is the most flexible way to
control for general time effects.16 Note also that our specification, by including article as well
as week fixed effects, implicitly controls for the effect of article age.17 We cluster standard
errors at the article level. Formally, we run the regression
15We drop the first week for each article because by construction, the founding week contains at least oneedit (and has zero length).
16We do not include dummies for the first 20 weeks of our sample because only a few articles exist duringthat time period and identifying weekly dummies together with article fixed effects is therefore hard.
17To see this, consider the following specification with only a linear time trend and article age as control:
UserNumjt = β ∗ArticleLengthjt + θj + γ ∗ t+ δ ∗ArticleAgejt + ejt
= β ∗ArticleLengthjt + θj + γ ∗ t+ δ ∗ (t−ArticleBirthY earj) + ejt
14
UserNumjt = βArticleLengthjt + θj + ψt + εjt (2)
,where j denotes a specific article and t denotes a week. θj and ψt are a set of article/week
fixed effects, respectively. εjt denotes the error term.
The first column of Table (4) reports the coefficient on article length, which is equal to
0.199 and highly significant. In other words, about 50,000 additional characters (about 700
sentences) of article length are associated with one more active user per week. To get a sense
of the magnitude of the effect, note that the average article in 2009 is about 7,500 characters
long. The article will therefore be edited by about 0.15 additional users per week compared to
when it first appeared. The average article that was created in 2002, the first year in our data,
was about 17,000 characters longer in 2009. This length change will lead to an additional 0.35
users each week. Given an average of 0.207 weekly users (the median is zero) and a standard
deviation of 0.813 in 2009, this effect is substantial.
Second, we use the cumulative weekly edit distance as the dependent variable instead of
the number of users. For this specification, we find a significant coefficient of 222, which can
be interpreted as 10,000 characters of article length (about 140 sentences), leading a little over
three sentences of additional weekly editing activity. For the average 2002 vintage article in
2009, this increase would entail an additional 400 characters / five sentences being contributed
each week. This effect is large relative to the mean weekly edit distance, which is equal to
400 characters, yet the effect might seem small relative to the large standard deviation of the
edit-distance variable, which is equal to 19,000 characters.
However, the distribution of weekly total edit distance is extremely skewed; therefore,
whether its standard deviation is the best benchmark for the effect size is unclear. For this
reason and to test whether large outlier values drive our results, we rerun the regression using
a version of the edit-distance variable that caps individual edits at 10,000 characters (roughly
the 98th percentile of the edit-distance distribution) before aggregating them at the weekly
level. When we switch to the capped edit distance as the dependent variable, we obtain a
positive and significant coefficient, but of smaller magnitude than for our baseline case. 10,000
characters of additional article length lead to 103 characters of additional edits rather than
222. Note, however, that in terms of standard deviations of the underlying variable (reported
in the first row of Table (4)), the effect is actually substantially stronger for the capped edit
distance measure. Note also that the large edits are legitimate data points and in terms of
effect size, one should not exclude them, because those edits have a strong impact on the
respective article. The capped measure simply provides evidence that the very heavy edits
alone are not driving the results.
For the remainder of the paper, we will use the number of weekly users as our main
Article age can be decomposed into an article-specific component (year of creation of the article) and a lineartime-component. It is easy to see that δ in the above specification cannot be separately identified from θjand γ due to co-linearity of the variables. The same intuition extends to the case of our baseline specification,which includes more flexible time controls. In other words, an increase in editing activity over the durationof an article’s existence on Wikipedia (regardless of article length) would not affect the estimated β in ourregression.
15
measure of editing activity. Edit distance is arguably the most direct measure of the extent
of change on an article; however, it has high variance due to the existence of very heavy edits
in the right tail of its distribution. We therefore prefer to work with the number of users as
the main dependent variable, which is much less affected by outliers. Furthermore, we find
that average edit distance per user is fairly stable over time, and an increase in the number of
users drives growth in editing activity. This pattern occurs for the general category as well as
article-level time trends reported in Tables (2) and (3). Later, we also test explicitly whether
increases in article length lead to relatively longer or shorter edits, and find they do not. We
are therefore able to focus on the number of users as our main measure of editing activity,
without missing other important dimensions of the growth process.
4.1 Article-specific Time trends
One possible confound for our finding is the presence of article-specific time-trends. Different
inherent levels of activity growth within articles would lead to some articles growing faster
than the average time trend (captured by the ψt-terms) would predict. These articles would
be longer than average and have a larger number of active users. The inverse would be true
for articles with a below-average growth trend. In terms of our model, we can think of the
visit probability of type-2 users λ2j increasing over time due to the increasing visibility of
Wikipedia and a larger pool of potential users as outlined in section (3.1). A disproportionate
increase in the visit probability for some articles relative to others, possibly due to a difference
in popularity, could introduce spurious correlation between editing activity and article length.
We tackle this issue in several ways.
First, we reestimate our baseline model including an article-specific cubic time trend. In
other words, we estimate
UserNumjt = βArticleLengthjt + θj + γj ∗ t+ δj ∗ t2 + ζj ∗ t3 + νjt
,where t, as before, denotes the time subscript.18 Note that this specification includes
set of article fixed effects as well as an additional three coefficients per article that capture
article-specific trends. We report results from a regression with only a linear time trend as
well as higher-order controls in columns (2) to (4) of Table (5). For easier comparison, we
report the baseline coefficient in the first column of the table. The coefficient on article length
is similar across specification with slightly lower but always statistically significant coefficients
when adding article-specific time-trends. Given the shape of the aggregate and article level
growth patterns, which are characterized by an initial steep increase and later slowdown, we
18Note that we do not include a week-specific fixed effect ψt as we did previously. Although week FEs arein principle identified, they turn out to be highly co-linear with the article-specific growth trends, and wetherefore prefer to leave them out. We reran the regression with article-specific time trends and year (insteadof week) fixed effect and find similar results. We also exclude articles that were created in 2008, because theirshort life span makes fitting article-specific time trends difficult. Excluding those observations reduces thesample from 1,267 to 1,070 articles relative to our baseline regression.
16

believe the cubic article-specific time trends do a good job of controlling for article-specific
growth dynamics.
The test also highlights a key source of variation in the data that allows us to get precise
estimates even after including rigorous time-trend controls: discrete and large jumps in article
length due to individual “heavy” edits. The presence of such edits is documented in Table
(1), which shows a highly skewed distribution of edit distances with a long right tail. In other
words, even if articles had their own time trends due to a difference in popularity between
topics, treating the specific timing of very large edits as exogenous is arguably reasonable. To
take advantage of the variation induced by large edits even more directly, we run a second
test for which we select weeks with changes in article length of more than 1,000 characters.
For each instance of a large change in length, we compute the number of users in the week
preceding the change as well as the week following the length increase. We then regress the
change in the number of users on the change in article length. Formally we run a differenced
version our original regression (2):
UserNumjt+1 − UserNumjt−1 = β(ArticleLengthjt+1 −ArticleLengthjt−1) + (ψt+1 − ψt−1) + µjt
Note that we omit the week that contains the large edit itself in order to compare time
periods that are strictly before / after the jump in article length. When estimating the
regression, we treat (ψt+1 − ψt−1), which captures the aggregate growth trend as part of
the error term. Because we are using a narrow time window, this omission should have a
negligible impact on the regression. Similarly, any article-specific growth trend will have a
minimal effect. Similar to a regression discontinuity type of approach, we are relying on the
fact that other than the article length increase, nothing else changed that could have an effect
on editing activity. We find a positive and highly significant coefficient that we report in
the final column of Table (5). In terms of magnitude, the estimated of coefficient of 0.205 is
similar to the baseline coefficient of 0.199.
Finally, we run a placebo test to further probe whether the coefficient on article length is
picking up general article level growth trends. If some articles get more editing activity and
grow faster due to their inherent popularity, we should see a high correlation between current
and all past editing activity. Instead, if we are correctly identifying the editing externality
as the mechanism, current editing activity should only respond to past editing activity that
is still embodied in the current article-content. Put differently, content that once existed on
the article but was later deleted should not in any way inspire current users to contribute.
The externality should therefore only lead to a response of editing behavior to surviving edits
rather than all past editing activity. The fact that cumulative edit distance and article length
differ substantially for many articles due to deletion and replacement of content allows us to
run a regression in which we include current article length as well as cumulative past editing
activity.19 We report coefficient estimates from this regression in the final column of Table
19Note that if there is no deletion or replacement of content on a article the two measures would be identical.For most articles the metrics diverge at some point in their lifetime. We document the fraction of content by
17

(5). We find that after controlling for article length, the cumulative past edit distance has
no additional explanatory power. The estimate is not only statistically insignificant, but
the magnitude is also very small (note the different units used for article length and edit
distance). Furthermore, the coefficient estimate on article length remains almost unchanged
at 0.181 relative to 0.199 in the baseline specification. This finding shows that editing activity
is correlated with current content stock, but not the amount of all past contributions including
non-surviving edits, lending further support to the notion that we are correctly identifying a
spillover effect.
4.2 Correlated Information Shocks
A further threat to a causal interpretation lies in the presence of information shocks that are
persistent over time. For instance, new information could become available to users outside
of Wikipedia at a particular point in time, but users might not all respond to the news at the
same time. Instead, over an extended period of time, different users might slowly incorporate
the new information into the article. Section (3.4) of the theoretical model outlines the
consequences of such an external information shock. In short, this kind of shock will lead to
an increase in both article length and current editing behavior. We therefore explicitly chose
a set of articles that was presumably not particularly affected by new information. Most
likely, the stock of knowledge regarding historic topics such as the Roman Empire among the
user pool changes little over time. However, information shocks through, for instance, media
consumption (e.g., a TV documentary) might conceivably create the type of endogeneity
problem just described.
Although we think external information shocks are less likely to be present for the set
of articles considered, we test whether our estimates are robust to an IV strategy in which
we instrument the current length of the article with lagged article length. The idea is to use
article length from a time period far enough away such that the effect of any information shock
that affected lagged article length will have no effect on current editing anymore. In terms
of the theoretical model, we would want to choose a lag that is at least as large as the time
window (denoted by T in the model) over which an external information shock as modeled
in section (3.4) affects editing behavior. Because we have no direct guidance regarding the
time frame of the information shock, we experiment with various lags and find similar results.
Columns (2) to (4) of Table (6) report results using article length three months prior. The
second-stage coefficient on article length is not significantly different from the OLS coefficient
in column (1), and the two point estimates are similar in magnitude.20 We also replicate the
IV using an even larger lag of six months in columns (5) to (7), which again yields similar
results. Note also that because article length is persistent over time, lagged article length is
strongly correlated with current length, leading to highly significant first-stage coefficients.
article vintage in Table (B3) in the appendix.20Column (2) replicates the OLS specification of the baseline case with the reduced number of observations
that is available for the IV. Due to the usage of a lagged instrument the first few observations for each articlecannot be used in the regression (the instrument is not defined for those observations).
18
5 Mechanism and Additional Results
5.1 Effect Magnitude and User pool Variation
In the theoretical model, we derived the magnitude of the spillover effect as a function of
the arrival rate of inspired users that are willing to edit the article λ1j and the magnitude
of the inspiration effect of current content γj . As discussed in section (3.3), we expect to
see differences in the arrival rate and hence the spillover effect both over time because of the
growing user base and across articles with different levels of breadth and appeal to users. In
this section, we empirically investigate heterogeneity along those two dimensions.
We start by operationalizing the cross-sectional dimension. Defining breadth and size of
the potential user pool across articles is hard; however, we have some indication that articles
created in earlier years pertain to broader and more popular topics. This conjecture is based
on the list of articles created in each year (see Table (B4) in the appendix) as well as the fact
that articles created in earlier years are edited more heavily, as was documented in section
(2.3). We therefore use article vintage as a cross-sectional proxy for the size of the pool of
potential contributors. More specifically, we investigate effect heterogeneity across articles by
including a set of interaction effects of article vintage (i.e., the year of creation) and current
article length. We report the results from this regression in column (2) of Table (7). For easier
reference, we replicate our baseline regression in the first column. We find a large amount
of heterogeneity across article vintages, with a significant coefficient of 0.455 for the earliest
articles created in 2002, which is substantially larger than our baseline effect of 0.199. As
the model predicts, the magnitude of the externality decreases almost monotonically across
vintages, with an insignificant effect for articles created in 2007 and 2008.
To analyze changes in the magnitude of the spillover effect over time, we proceed to
interact article length with a set of vintage as well as calendar-year dummies. Because both
sets of dummies add up to one, we have to exclude one interaction term. We therefore
omit the interaction of article length with the calendar year 2006, but keep the full set of
vintage interactions. When doing so, we find even stronger spillover effects for some vintages,
which can be interpreted as the vintage-specific effect in 2006 (the peak year in terms of
the magnitude of the spillover effect). The decline across vintages is more modest for this
specification, and we find positive and significant effects for all vintages. In terms of the
calendar-year interactions, we find an inverse U-shape with a peak in 2006 and substantially
lower spillovers in other years. As outlined above and in our model, a likely explanation for
this pattern is variation in the total user pool, which also varies in an inverted-U shape over
time, as we saw in section (2.2) and in particular in column (2) of Table (2).
Taken together, the heterogeneity in the effect magnitude across articles of different vintage
as well as over time suggests the size of the user pool influences the size of the spillover. In
terms of our model, a larger pool of potential contributors will lead to a higher arrival rate
λ1j and thus magnify the inspiration effect of past contributions on current editing activity.
As outlined in the model in section (3.2), the spillover effect can in principle become
negative in case of a crowding-out effect of past contributions, in particular, if the article
19
content is already more mature in terms of the current knowledge on the topic. The crowding-
out effect provides an alternative explanation for why the magnitude of the spillover effect
decreases across vintages as well as over time after 2006. In the cross-sectional dimension,
the narrowness of the topics of articles created in later years (see Table (B4)) is likely to lead
to an article approaching content maturity earlier. Similarly, in the time dimension, later
years might see the negative crowding-out effect becoming stronger relative to the positive
inspiration effect. However, if the crowding-out effect were an important driver, article length
would possibly have a non-linear effect on contributions, which would capture a decrease
in the spillover when an article is closer to a state of content maturity. We test for such
patterns by including higher-order terms of article length in our baseline regression. When
doing so, we find little evidence of non-linearity in the spillover effect, and the coefficients
on both a square and a cubic term on article length turn out to be insignificant. Given the
strong and persistent growth patterns even for early vintage articles, we might simply be
“too far away” from content maturity on most articles to identify non-linearities using the
article length variation we observe in our data. We therefore conclude that user pool variation
driving the effect magnitude is the more likely explanation for the observed patterns of effect
heterogeneity.
5.2 Impact on the Type of Edits
To dig deeper into the nature of edits triggered by the spillover effect, we analyze both edit
intensity, that is, the length of the edits, as well as what type of edits are made. In order to
quantify the latter, we look at the extent of deletion/replacement of content versus addition of
new content. We also analyze the extent to which the triggered edits are later reverted, that is,
whether article length increases lead to edits that have a lasting impact on the article or only
editing activity that does not ultimately survive. Finally, we decompose the spillover effect
into edits by new and returning users. We report results regarding these different dimensions
of editing behavior in Table (8).21
We first test whether the length of edits changes as a function of article length. This test
is particularly important for our purpose, because we focused on the number of users as our
main measure of editing activity. Although we found that longer articles are edited by more
users, this effect might be counteracted by users making shorter edits, which would weaken
the spillover effect. First, remember that in columns (2) and (3) of Table (4), we show that
article length has a significant effect when using (capped) edit distance instead of the number
of weekly users as the dependent variable. Second, to more explicitly relate edit distance
and the number of users to each other, we analyze directly whether editing activity per user
reacts to changes in article length and find it does not. We use the same setup as our baseline
regression, except that we are only able to use article-week pairs that contain at least one edit.
For these weeks, we compute edit distance per user and regress it on article length. Doing
so, we obtain a coefficient that is insignificant and small in magnitude. We report the results
21Note that we are stepping outside of the framework of our simple theoretical model in this section, becausethe model has little to say about what kind of edits the spillover triggers.
20
in column (1) of Table (8). To be sure the noisiness induced by outlier values is not the only
reason for not finding an effect, we also rerun the regression using capped edit distance per
user as the dependent variable in column (2). Again, we find no significant effect.
Next, we analyze whether longer articles are characterized by edits that contain relatively
more or less addition versus deletion of content. For this purpose, we use our measure of
content addition / deletion introduced earlier (∆Length/EditDistance ∈ [−1, 1]) as the de-
pendent variable. When running the regression, we find a negative and significant coefficient
of -0.019, which implies that edits on longer articles are more likely to delete a larger portion
of the previous content. However, the magnitude of the effect is small compared to the mean
(standard deviation) of the variable, which is 0.408 (0.621). As a further point of reference,
note that the metric falls by about 0.2 for 2002 vintage articles between 2002 and 2009 as
shown in Table (B2). This decrease is an order of magnitude larger than the 0.025 change
induced by an increase of 10,000 characters in article length (remember, the average article
in 2009 is only 7,500 characters long).
A similar pattern emerges when using the fraction of reverted edits as the dependent
variable. We run this regression to test whether the spillover triggers edits that are latter
reverted, that is, that do not have a lasting impact on an article’s content. We find a positive
and significant effect of 0.010, which shows that edits on longer articles are more likely to be
overturned by subsequent edits of other users. However, the magnitude is again quite small
compared to the variable’s mean (0.083) and standard deviation (0.246) as well as the increase
in the metric over time (see Table (B2)).
Finally, we analyze the extent to which the edits triggered by the spillover effect are due
to contributions from new users versus ones that previously edited the same article. If a
disproportionate fraction of edits originated from returning users, we might be worried that
they reflect disagreement about content more than inspiration between users. In addition to
directly testing for the extent of content deletion / addition above, looking at the fraction of
edits by new users constitutes another way of assessing the degree of truly new content being
provided. We assess the effect on new and returning users in two ways. First, we regress
the fraction of new users on article length and the usual control variables from our baseline
regression. The results from this regression are reported in column (5) of Table (8) and yield
a significant coefficient of -0.016. Compared to an average fraction of 0.814 and a standard
deviation of 0.357 this constitutes a small effect. Furthermore, we document a substantially
larger decrease of about -0.6 in the fraction of new users over time in the bottom panel Table
(B2) for articles of the earliest vintages. Second, we also run our main regression for the full
sample using both the number of new users and the number of returning users separately as
dependent variables. We find an effect of 0.152 of article length on the number of new users
as well as an effect of 0.047 on the number of returning users. Both effects are statistically
significant. In other words, about 75% of the edits triggered by the spillover originate from
new users. Consistent with the small effect on the fraction of new users, this split is similar
to the average fraction of new users across our sample.
In summary, we find the spillover induced edits are similar to the average edit in the
21

sample. The triggered edits are of similar length, involve only slightly more deletions, and are
marginally more likely to be reverted. About 75% of the edits are attributed to new users,
which is similar to the average share of new users over the sample period.
5.3 Quantification of the Spillovers
To assess the overall relevance of the spillover effect, we use the predictions implied by our lin-
ear regression relationship in equation (2). Specifically, expected growth for article j between
time period t = 0 and t = τ is given by
E(UserNumjt=0 − UserNumjt=τ ) = β(ArticleLengthjt=0 −ArticleLengthjt=τ ) + (ψ0 − ψτ )
= β∆0τArticleLengthj + ∆0τψ
In other words, we can decompose content growth into a part that is driven by changes in
article length and a remainder that is due to the general time-trend captured by the week fixed
effects. As a benchmark for the quantitative importance of the spillover, we shut down the
former channel, which allows us to quantify the extent to which the absence of the externality
would have slowed down the growth process. In the absence of the spillover effect, editing
activity would have grown over time, only due to the overall growth trend, which is captured
by the set of weekly dummies, the second term in the equation above. Because we use the first
weeks as the omitted category in our estimation,22 the fixed-effect estimates can be interpreted
as the change in user numbers for each week (relative to t = 0) predicted by the general growth
trend. When plotting the dummies over time in Figure (1), we find an initial increase and a
modest slow-down in later years, which unsurprisingly is a very similar pattern to the category
level growth rates in activity reported earlier in Table (2). When considering the whole sample
period from 2002 to 2010, we find the number of weekly users increased by about 0.4. To
compare the magnitude of the general growth trend to the spillover-induced growth, we select
all articles created in 2002, which are the only ones the category level growth trend affected
over the whole sample period. The average length change for those articles between 2002 and
2010 is equal to 19,000 characters. Using the first term in the prediction equation above and
an estimated coefficient β = 0.199, we compute an increase of 0.199 ∗ 1.9 = 0.38 in terms of
weekly users due to the spillover effect. In other words, the category level growth-trend and
the spillover effect contribute roughly equally to the increase in editing activity over time. For
articles at higher percentiles of the length distribution, the spillover effect can even dominate.
For instance, the length of articles created in 2002 at the 75th percentile is equal to 23,000
characters, making the magnitude of the spillover effect larger than the general growth trend.
This quantification suggests a substantial spillover effect on editing behavior on Wikipedia.
Without it, the growth in editing activity for early vintage articles would have been lowered by
about 50%. Furthermore, the content creation caused by the spillover effect is likely to lead to
22More specifically, as mentioned in the estimation section, we define the first 20 weeks of the sample as theomitted category.
22

an increase in site traffic, thereby increasing the pool of potential editors. Part of the aggregate
growth trend is therefore likely caused by past spillover-induced editing activity. Our model
of editing activity captures exactly this channel by making the article-visit probability λ2jt
a function of aggregate category level content Xt in section (3.1). Therefore, the cumulative
of all contributions on individual articles that were triggered by the spillover will lead to a
feedback effect on content growth via increasing the user pool. In this case, our estimate
represents a lower bound on the importance of the editing externality.
6 Conclusion
In this paper, we studied the growth process of open source content by analyzing a large set
of Wikipedia articles over an eight-year time span. Using detailed edit-level data, we find
substantial growth in editing activity in earlier years, with a modest slow-down toward the
end of our sample period. Articles that were created earlier receive significantly more edits
than later vintages at any point during their lifetime, which is most likely due to the fact that
they concern broader topics. We quantify the importance of one key driver of content growth:
a spillover effect of past edits on current editing activity. We find that article length has a
positive effect on the number of weekly users as well as total weekly contributions as measured
by the cumulative edit distance, while controlling for article popularity as well as a flexible
category level growth trend. The result is robust to a whole battery of robustness checks,
suggesting that we are able to identify a causal effect of the content stock on editing activity.
The magnitude of the effect is economically important, with the externality causing about
half of the growth in editing activity over time. We find that the type of edits induced by
the spillover involve relatively more deletions and are more likely to be subsequently reverted.
Both effects are, albeit statistically significant, of very small magnitude. Finally, we find that
the contributions made by new users are the primary driver of the spillover effect.
The finding is significant because it suggests that commons-based peer production benefits
from a type of externality that is not available, at least to a similar degree, in the context
of market and firm-based transactions (see Benkler (2006), Shirky (2008), or Tapscott and
Williams (2006)). Although researchers broadly believe people draw inspiration from each
others’ work in Wikipedia (e.g., Hansen, Berente, and Lyytinen (2009), Johnson (2008), and
Nov (2007)), the current study is the first rigorous attempt to quantify the editing externality.
Our findings also more broadly inform the design of open source platforms. The presence of
the externality implies that platforms might want to incentivize users to contribute or pre-
populate articles with content in order to trigger further edits via the spillover effect. The
results also suggest that a large pool of potential editors is important in order to benefit from
the externality. The fact that years with a larger category level user pool are characterized by
bigger spillover effects, as are articles on topics with a broader appeal, supports this assertion.
The extent to which the spillover can be harnessed might therefore depend to a large extent
on the focus and scope of the project in question.
23

References
Almeida, R., B. Mozafar, and J. Cho (2007): “On the Evolution of Wikipedia,” in
Proceedings of the ICWSM, Boulder, Co.
Arazy, O., O. Nov, R. Patterson, and L. Yeo (2011): “Information Quality in
Wikipedia: The Effects of Group Composition and Task Conflict,” Journal of Manage-
ment Information Systems, 27, 71–98.
Belenzon, S. (2012): “Cumulative Innovation and Market Value: Evidence from Patent
Citations,” Economic Journal, 122(559), 265–285.
Benkler, Y. (2006): The Wealth of Networks: How Social Production Transforms Markets
and Freedom. Yale University Press, New Haven, CT.
Bragues, G. (2007): “Wiki-Philosophizing in a Marketplace of Ideas: Evaluating
Wikipedia’s Entries on Seven Great Minds,” MediaTropes eJournal, 2(1), 117–158.
Brown, A. R. (2011): “Wikipedia As a Data Source for Political Scientists: Accuracy and
Completeness of Coverage,” Political Science & Politics, 44, 339–343.
Devereux, M., and S. Greenstein (2009): “The Crisis at Encyclopeadia Britannica,”
Kellogg School of Management Case 5-306-504.
Devgan, L., N. Powe, B. Blakey, and M. Makary (2007): “Wiki-surgery? Internal
validity of Wikipedia as a medical and surgical reference,” Journal of the American College
of Surgeons, 205, S76–S77.
Furman, J., and S. Stern (2011): “Climbing Atop the Shoulders of Giants: The Impact of
Institutions on Cumulative Knowledge Production,” American Economic Review, 101(5),
1933–63.
Giles, J. (2005): “Internet encyclopaedias go head to head,” Nature, 438, 900–901.
Gorbatai, A. (2011): “Aligning Collective Production with Social Needs: Evidence from
Wikipedia,” unpublished manuscript.
Greenstein, S., and F. Zhu (2012a): “Collective Intelligence and Neutral Point of View:
The Case of Wikipedia,” NBER working paper 18167.
(2012b): “Is Wikipedia biased?,” American Economic Review, Papers and Proceed-
ings, 102(3), 343–348.
Halfaker, A., A. Kittur, R. Kraut, and J. Riedl (2009): “A Jury of Your Peers:
Quality, Experience and Ownership in Wikipedia,” in Proceedings of the 5th International
Symposium on Wikis and Open Collaboration, Orlando, Florida.
Hansen, S., N. Berente, and K. Lyytinen (2009): “Wikipedia, Critical Social Theory,
and the Possibility of Rational Discourse,” The Information Society, 25(1), 38–59.24

Henderson, R., A. Jaffe, and M. Trajtenberg (1993): “Geographic Localization of
Knowledge Spillovers as Evidenced by Patent Citations,” Quarterly Journal of Economics,
119(434), 578–598.
Jaffe, A. (1986): “Technological Opportunity and Spillovers of R&D: Evidence from Firms’
Patents, Profits and Market Value,” American Economic Review, 76, 984–1001.
Jaffe, A., and M. Trajtenberg (1999): “International Knowledge Flows: Evidence from
Patent Citations,” Economics of Innovation and New Technology, 8, 105–136.
Johnson, B. K. (2008): “Incentives to Contribute in Online Collaboration: Wikipedia as
Collective Action,” Presented at 58th Annual Conference of the International Communica-
tion Association, Montreal, Quebec.
Jones, C. I. (1995): “R&D-Based Models of Economic Growth,” Journal of Political Econ-
omy, 103(4), 759–784.
Kittur, A., and R. E. Kraut (2008): “Harnessing the Wisdom of Crowds in Wikipedia:
Quality through Coordination,” in Computer Supported Cooperative Work, Proceedings of
the 2008 ACM Conference on Computer Supported Cooperative Work, pp. 37–46, New York.
Kortum, S. S. (1997): “Research, Patenting, and Technological Change,” Econometrica,
65(6), 1389–1419.
Levenshtein, V. I. (1966): “Binary Codes Capable of Correcting Deletions, Insertions, and
Reversals,” Cybernetics and Control Theory, 10(8), 707–710.
Malone, T. W., R. Laubacher, and C. Dellarocas (2009): “Harnessing Crowds: Map-
ping the Genome of Collective Intelligence,” MIT Sloan Research Paper No. 4732-09.
Myers, E. W. (1986): “An O(ND) Difference Algorithm and Its Variations,” Algorithmica,
1(2), 251–266.
Nagaraj, A. (2013): “Does Copyright Affect Creative Reuse? Evidence from the Digitization
of Baseball Digest,” unpublished manuscript.
Navarro, G. (2001): “A Guided Tour to Approximate String Matching,” ACM Computing
Surveys, 33(1), 31–88.
Nov, O. (2007): “What Motivates Wikipedians?,” Communications of the ACM, 50(11),
60–64.
Olivera, F., P. S. Goodman, and S. S. Tan (2008): “Contribution Behaviors in Dis-
tributed Environments,” MIS Quarterly, 32(1), 23–42.
Piskorski, M. J., and A. Gorbatai (2013): “Testing Coleman’s Social-Norm Enforcement
Mechanism: Evidence from Wikipedia,” Harvard Business School Working Paper.
25
Ransbotham, S., and G. C. Kane (2011): “Membership Turnover and Collaboration
Success in Online Communities: Explaining Rises and Falls from Grace in Wikipedia,”
MISQuarterly, 35(3), 613–627.
Romer, P. M. (1990): “Endogenous Technological Change,” Journal of Political Economy,
98(5), S71–102.
Scotchmer, S. (1991): “Standing On the Shoulders of Giants: Cumulative Research and
the Patent Law,” Journal of Economic Perspectives, 5(1), 29–41.
Shirky, C. (2008): Here Comes Everybody: The Power of Organizing Without Organizations.
Penguin Books, London, England.
Shriver, S. K., H. Nair, and R. Hofstetter (2012): “Social Ties and User Generated
Content: Evidence from an Online Social Network,” Management Science, 59(6), 1425–
1443.
Spiliopoulos, K., and S. Sofianopoulou (2007): “Calculating Distances for Dissimi-
lar Strings: The Shortest Path Formulation Revisited,” European Journal of Operational
Research, 177, 525–539.
Suh, B., G. Convertino, E. H. Chi, and P. Pirolli (2009): “The Singularity is not
Near: Slowing Growth of Wikipedia,” in Proceedings of the 5th International Symposium
on Wikis and Open Collaboration, Orlando, Florida.
Tapscott, D., and A. D. Williams (2006): Wikinomics: How Mass Collaboration Changes
Everything. Atlantic Books, London, England.
Toubia, O., and A. T. Stephen (2013): “Intrinsic versus Image-Related Utility in Social
Media: Why Do People Contribute Content to Twitter?,” Marketing Science, 32(3), 368–
392.
Vigas, F. B., M. Wattenberg, and K. Dave (2004): “Studying Cooperation and Conflict
between Authors with History Flow Visualizations,” CHI Letters, 6(1), 575–582.
Voss, J. (2005): “Measuring Wikipedia,” in Proceedings of the 10th International Conference
of the International Society for Scientometrics and Informetrics.
Weitzman, M. L. (1998): “Recombinant growth,” Quarterly Journal of Economics, 113(2),
331–360.
Zhang, M., and F. Zhu (2011): “Group Size and Incentives to Contribute: A Natural
Experiment at Chinese Wikipedia,” American Economic Review, 101(4), 1601–1615.
26
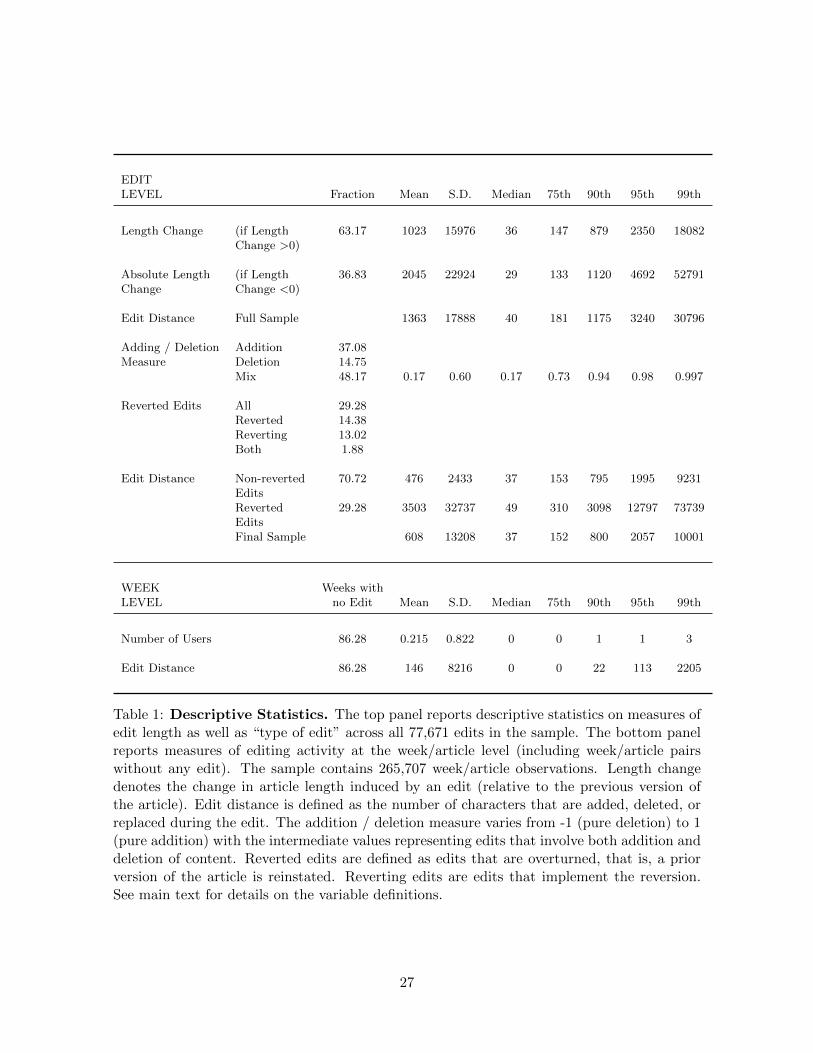
EDITLEVEL Fraction Mean S.D. Median 75th 90th 95th 99th
Length Change (if Length 63.17 1023 15976 36 147 879 2350 18082Change >0)
Absolute Length (if Length 36.83 2045 22924 29 133 1120 4692 52791Change Change <0)
Edit Distance Full Sample 1363 17888 40 181 1175 3240 30796
Adding / Deletion Addition 37.08Measure Deletion 14.75
Mix 48.17 0.17 0.60 0.17 0.73 0.94 0.98 0.997
Reverted Edits All 29.28Reverted 14.38Reverting 13.02Both 1.88
Edit Distance Non-reverted 70.72 476 2433 37 153 795 1995 9231EditsReverted 29.28 3503 32737 49 310 3098 12797 73739EditsFinal Sample 608 13208 37 152 800 2057 10001
WEEK Weeks withLEVEL no Edit Mean S.D. Median 75th 90th 95th 99th
Number of Users 86.28 0.215 0.822 0 0 1 1 3
Edit Distance 86.28 146 8216 0 0 22 113 2205
Table 1: Descriptive Statistics. The top panel reports descriptive statistics on measures ofedit length as well as “type of edit” across all 77,671 edits in the sample. The bottom panelreports measures of editing activity at the week/article level (including week/article pairswithout any edit). The sample contains 265,707 week/article observations. Length changedenotes the change in article length induced by an edit (relative to the previous version ofthe article). Edit distance is defined as the number of characters that are added, deleted, orreplaced during the edit. The addition / deletion measure varies from -1 (pure deletion) to 1(pure addition) with the intermediate values representing edits that involve both addition anddeletion of content. Reverted edits are defined as edits that are overturned, that is, a priorversion of the article is reinstated. Reverting edits are edits that implement the reversion.See main text for details on the variable definitions.
27
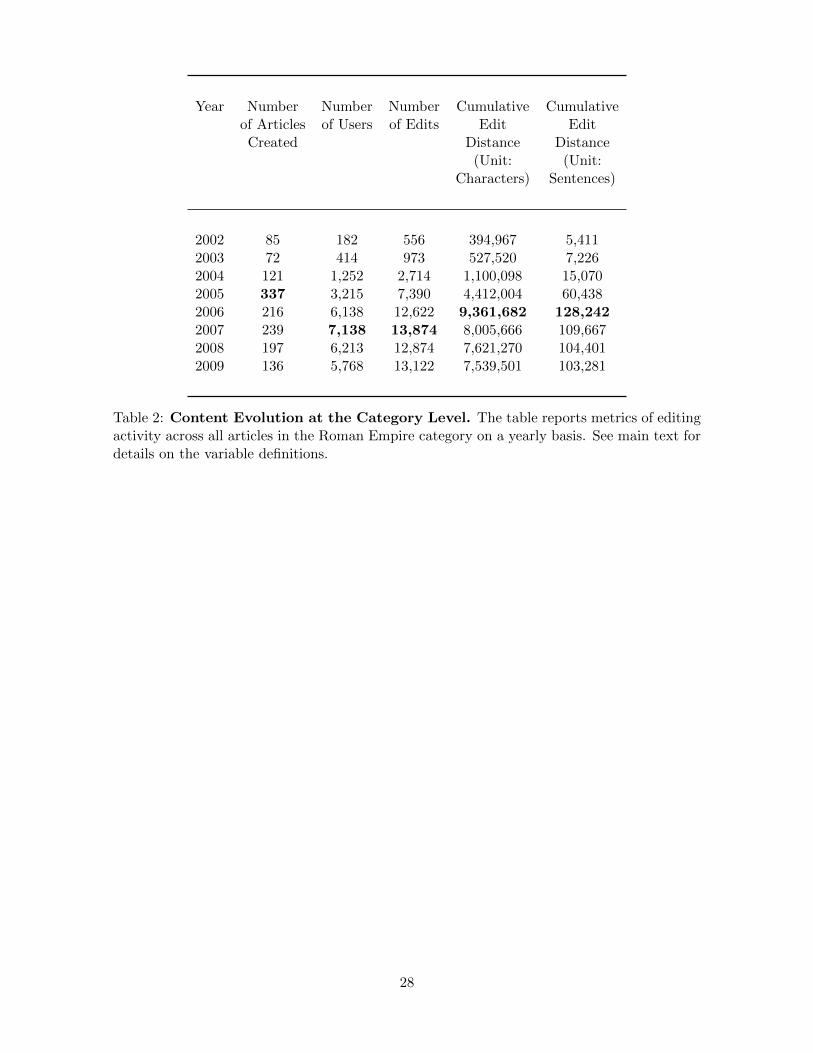
Year Number Number Number Cumulative Cumulativeof Articles of Users of Edits Edit EditCreated Distance Distance
(Unit: (Unit:Characters) Sentences)
2002 85 182 556 394,967 5,4112003 72 414 973 527,520 7,2262004 121 1,252 2,714 1,100,098 15,0702005 337 3,215 7,390 4,412,004 60,4382006 216 6,138 12,622 9,361,682 128,2422007 239 7,138 13,874 8,005,666 109,6672008 197 6,213 12,874 7,621,270 104,4012009 136 5,768 13,122 7,539,501 103,281
Table 2: Content Evolution at the Category Level. The table reports metrics of editingactivity across all articles in the Roman Empire category on a yearly basis. See main text fordetails on the variable definitions.
28

Year of Article Creation
2002 2003 2004 2005 2006 2007 2008 2009
NUMBER OF 2002 5.27USERS 2003 6.46 3.71
2004 15.71 7.06 3.802005 31.76 12.96 8.22 3.842006 52.53 15.67 12.07 5.47 4.84
Calendar 2007 57.41 15.52 11.51 5.35 5.86 3.26Year 2008 44.22 13.01 10.07 4.82 5.38 3.89 4.14
2009 39.48 13.14 8.59 5.21 4.80 4.56 5.21 4.01
EDIT 2002 4647DISTANCE 2003 3123 3726
2004 7825 1966 24532005 34524 5882 3094 21322006 31723 13746 36700 1841 3856
Calendar 2007 52793 6394 5062 2584 3803 3987Year 2008 17600 5941 4842 2760 2209 4731 14812
2009 31728 5608 5826 2166 1946 2682 4388 10142
ARTICLE 2002 2406LENGTH 2003 4012 3168
2004 6335 4511 20792005 9881 6904 3461 16992006 13084 7930 4755 2746 3024
Calendar 2007 17376 9845 6087 3915 4674 3214Year 2008 18738 11293 7720 5010 5716 4785 7352
2009 21414 12921 11059 5791 6319 6426 8573 7838
Table 3: Content Evolution at the Article Level. The table reports the average numberof users per article, edit distance, and article length for each article vintage (year of articlecreation) and calendar year. See main text for details on the variable definitions.
29

(1) (2) (3)
Dependent Number Edit CappedVariable of Users Distance Edit Dist.
S.D. of the DV 0.825 8286 1044
Article 0.199*** 221.653** 102.565**Length (0.052) (89.689) (41.830)
Article FE Yes Yes YesWeek FE Yes Yes Yes
Observations 259,729 259,729 259,729Articles 1267 1267 1267Weeks 433 433 433
Table 4: The Effect of Article Length on Editing Activity. The unit of observation isa week/article pair. Standard errors are clustered at the article level.
30

(1) (2) (3) (4) (5) (6)
Sample Full Full Full Full Large Edits FullSample Sample Sample Sample Only Sample
Dependent Number Number Number Number ∆ Number NumberVariable of Users of Users of Users of Users of Users of Users
Article Length 0.199*** 0.124*** 0.141*** 0.074*** 0.181***(Unit: 10,000 characters) (0.052) (0.033) (0.047) (0.018) (0.046)
∆ Article Length 0.205***(Unit: 10,000 characters) (0.054)
Cumulative 0.007Edit Distance (0.005)(Unit: 100,000 characters)
Article-Specific Time Trend:Linear No Yes Yes Yes No NoSquare No No Yes Yes No NoCubic No No No Yes No No
Article FEs Yes Yes Yes Yes No YesWeeks FEs No No No No No Yes
Observations 259,729 244,985 244,985 244,985 2,227 259,729Articles 1267 1070 1070 1070 690 1267Weeks 433 433 433 433 335 433
Table 5: Robustness Check: Article-specific Time Trends. The unit of observation isa week/article pair. Standard errors are clustered at the article level. In columns (2) to (4),we exclude articles that were created in 2008, because of their short lifespan makes fittingarticle-specific time trends difficult. This exclusion reduces the sample from 1,267 to 1,070articles relative to our baseline regression. Column (5) uses only the sub-sample of large (morethan 1,000 characters) edits, which reduces the sample size.
31

(1) (2) (3) (4) (5) (6) (7)
Baseline 3-month lag 6-month lag
Estimation OLS OLS IV IV OLS IV IVMethod 1st Stage 2nd Stage 1st Stage 2nd Stage
Dependent # Users # Users Article # Users # Users Article # UsersVariable Length Length
Article Length 0.199*** 0.194*** 0.194*** 0.185*** 0.202***(0.052) (0.051) (0.058) (0.050) (0.065)
Lagged Article 0.838***Length (3 Months) (0.051)
Lagged Article 0.687***Length (6 Months) (0.105)
First Stage 267.98 43.03F-statArticle FE Yes Yes Yes Yes Yes Yes YesWeek FE Yes Yes Yes Yes Yes Yes Yes
Observations 259,729 243,258 243,258 243,258 226,787 226,787 226,787Articles 1267 1267 1267 1267 1267 1267 1267Weeks 433 420 420 420 407 407 407
Table 6: Robustness Check: Correlated Information Shocks The unit of observationis a week/article pair. Standard errors are clustered at the article level. Lagged instrumentsare used in all IV specifications. This exclusion reduces the sample size because lagged valuesare not defined for a set observations in the beginning of each article’s time series. The OLSis replicated each time for the reduced sample for which the instrument is available.
32
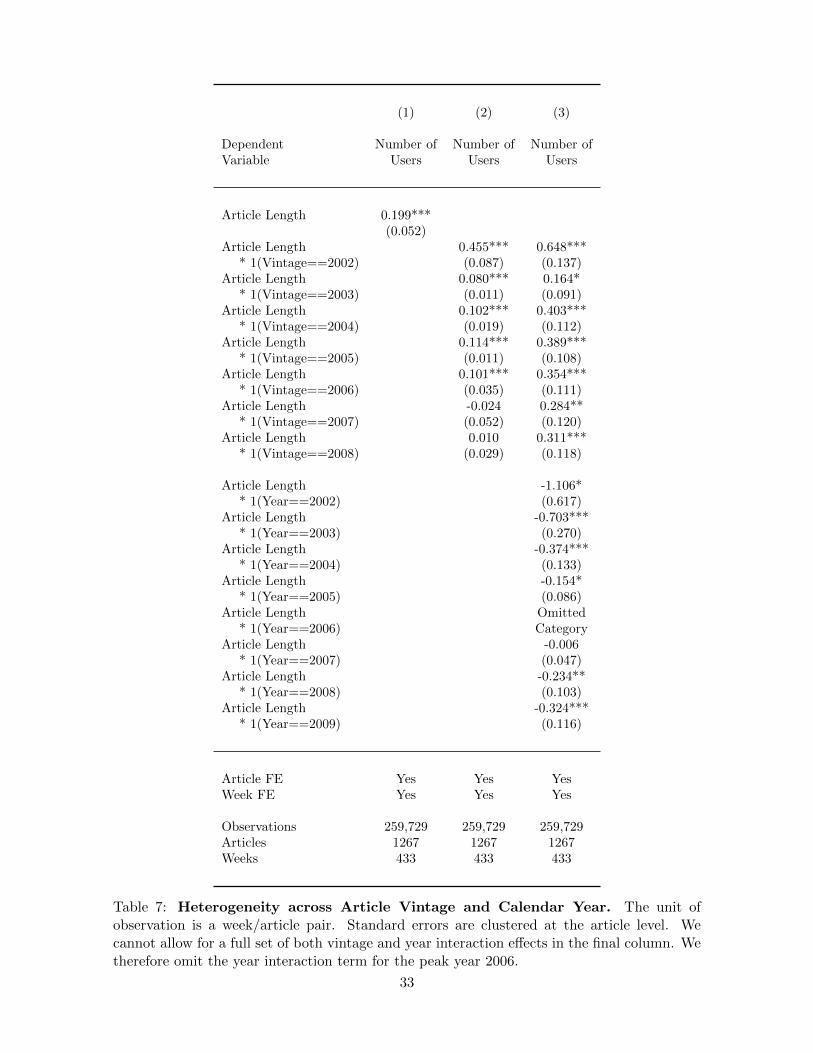
(1) (2) (3)
Dependent Number of Number of Number ofVariable Users Users Users
Article Length 0.199***(0.052)
Article Length 0.455*** 0.648**** 1(Vintage==2002) (0.087) (0.137)
Article Length 0.080*** 0.164** 1(Vintage==2003) (0.011) (0.091)
Article Length 0.102*** 0.403**** 1(Vintage==2004) (0.019) (0.112)
Article Length 0.114*** 0.389**** 1(Vintage==2005) (0.011) (0.108)
Article Length 0.101*** 0.354**** 1(Vintage==2006) (0.035) (0.111)
Article Length -0.024 0.284*** 1(Vintage==2007) (0.052) (0.120)
Article Length 0.010 0.311**** 1(Vintage==2008) (0.029) (0.118)
Article Length -1.106** 1(Year==2002) (0.617)
Article Length -0.703**** 1(Year==2003) (0.270)
Article Length -0.374**** 1(Year==2004) (0.133)
Article Length -0.154** 1(Year==2005) (0.086)
Article Length Omitted* 1(Year==2006) Category
Article Length -0.006* 1(Year==2007) (0.047)
Article Length -0.234*** 1(Year==2008) (0.103)
Article Length -0.324**** 1(Year==2009) (0.116)
Article FE Yes Yes YesWeek FE Yes Yes Yes
Observations 259,729 259,729 259,729Articles 1267 1267 1267Weeks 433 433 433
Table 7: Heterogeneity across Article Vintage and Calendar Year. The unit ofobservation is a week/article pair. Standard errors are clustered at the article level. Wecannot allow for a full set of both vintage and year interaction effects in the final column. Wetherefore omit the year interaction term for the peak year 2006.
33

(1) (2) (3) (4) (5) (6) (7)
Edit Capped Addition/ Fraction of Fraction of Number of Number ofDistance Edit Dist. Deletion Reverted Edit by New ReturningPer User Per User Metric Edits New Users Users Users
Mean 4141 353 0.408 0.083 0.814 0.172 0.039S.D. 2554 1363 0.621 0.246 0.357 0.720 0.229
Article -53.616 -76.540 -0.019*** 0.010** -0.016*** 0.152*** 0.047***Length (129.327) (69.255) (0.005) (0.005) (0.005) (0.044) (0.010)
Article FE Yes Yes Yes Yes Yes Yes YesWeek FE Yes Yes Yes Yes Yes Yes Yes
Observations 34,680 34,680 34,680 34,680 34,680 259,729 259,729Articles 1261 1261 1261 1261 1261 1267 1267Weeks 415 415 415 415 415 433 433
Table 8: Change in Editing Behavior as a Function of Article Length. The unitof observation is a week/article pair. Standard errors are clustered at the article level. Thedependent variable is defined only for article/week combinations with at least one edit inall regressions (except for the last two columns). The number of observations is accordinglysmaller than in our baseline regression.
34

-0.6
-0.4
-0.2
0
0.2
0.4
0.6
0.8
1
2002 2003 2004 2005 2006 2007 2008 2009
Co
eff
ieci
en
t o
n W
ee
k-FE
(D
V:
Nu
mb
er
of
Use
rs)
Figure 1: Estimates of the Effect of Time (Week Fixed Effects) on the Numberof Users. The graph plots the estimated week fixed effects from our baseline regressionover time for the corresponding weeks. The estimated coefficients can be interpreted as theaverage change in the number of weekly users in a given week relative to the first 20 weeks(the omitted category) of the sample.
35

A Appendix: Data Construction
A.1 Article Selection
To define articles that belong into the Roman Empire category, we first select all 1,571 articles
that have links to the Roman Empire category page. However, Wikipedia does not classify
articles into mutually exclusive categories. Instead, articles can be categorized under multiple
categories. We therefore manually reviewed the titles of those 1,571 articles and eliminated
the ones that only tangentially pertain to the Roman Empire. Note that identifying a set of
related articles is not of major importance to our analysis, we simply need a set of articles
for which we can assume the stock of human knowledge to be relatively stable. Through this
process, we identified 168 articles that were incorrectly categorized. The main goal of our
selection was to eliminate articles that involve more recent events that do not pertain to the
Roman Empire in a more narrow sense. The reason for such elimination was to end up with
a set of articles that contained purely historic content and therefore would not be subject to
major changes in the knowledge regarding the topics covered. We therefore maintain articles
on historical figures, for instance, that one might primarily assign to a different category,
for example, religious figures such as Saint Peter. Also, we keep articles both on Antique
Rome as well as the Holy Roman Empire. We eliminate all articles on video games, movies,
and books (e.g., the movie “Monty Python’s Life of Brian” appears in the Roman Empire
category and receives a substantial amount of edits). Furthermore, our original list contains
many geographic locations (cities, counties, etc.). We maintain all denominations that have
ceased to exist, but drop all locations whose name is still in use. For example, we drop the
article on Bremen (the city in Germany) but keep Archbishopric of Bremen (a region that
existed during the Holy Roman Empire). Through this process, we eliminate 168 articles and
are left with a final set of 1,403 articles.
A.2 Edit Distance Calculation
We measure the difference between two consecutive versions of article content using an edit
distance metric. Measuring edit distance is a general approach for string-matching problems,
which has applications in fields such as computational biology, signal processing, and infor-
mation retrieval (Myers (1986), Navarro (2001), Spiliopoulos and Sofianopoulou (2007)). For
instance, in computing, edit-distance calculations are used to correct spelling mistakes, patch
(update) files, and to cleanse and de-duplicate database entries. The edit distance metric
can be understood as the cost of transforming a string to another string or a measure of
dissimilarity between strings.
A number of edit distance algorithms are optimized for different data and conditions. We
use a simple edit distance calculation that is defined as “the minimal number of insertions,
deletions and substitutions to make two strings equal” with the cost of each operation being
equal to 1 (see Navarro (2001) and Levenshtein (1966)). This calculation is also known as
the Levenshtein distance. The value of this metric is zero if and only if the compared strings
are equal and otherwise strictly positive. At the maximum, the edit distance is equal to the36
number of characters in the longer string.
We implement the calculation of edit distances using Python code from the google-diff-
match-patch (see https://code.google.com/p/google-diff-match-patch/) software package that
provides a set of mature and well-tested tools. The package is based on an algorithm pre-
sented in Myers (1986). The initial transformation of the raw XML records to a tabulated
data set includes 87,346 edit distance calculations (for all edits on Roman Empire articles in-
cluding edits made by bots), which took about 15 hours to complete using a relatively modest
multiprocessor environment.
A.3 Bot Activity
We have to deal with the fact that a certain amount of activity on Wikipedia comes from
automatic “bots” rather than human contributors. These bots are user accounts controlled
by software programs that are primarily used to fulfill tasks that can be automatized, such
as correcting spelling and punctuation mistakes. Bots are also used to detect vandalism
(i.e., attempts to intentionally destroy content) and to revert the vandalized article to its pre-
vandalism state. Bot activity needs to be declared and the Wikipedia community might block
users that use their account for undeclared bot activity. Bot activity can therefore usually be
identified from user accounts. We use both the Wikipedia bot “User-Group”, which contains
a list of bot user-account ids, and manually investigate contributors with very large amounts
of edits to check whether their user account declares them as a bot. Although we might be
missing some undeclared bot activity, we do believe we are able to capture the majority of bot
activity in our data.23 For the empirical analysis, we do not consider contributions by bots
as part of editing activity. However, we do keep track of the aggregate article length at every
point in time regardless of whether the article has been edited by bots or human users. In
other words, we are only looking at human-user contributions to the individual articles and
will ignore bot contributions when computing our dependent variable, editing activity. The
current knowledge stock captured by the articles’ length instead will reflect cumulative edits
by both humans and bots.
A.4 Additional Descriptive Statistics
To complement the analysis of Wikipedia growth trends, we provide several additional tables
describing various dimensions of content growth. At the category level, Table (B1) provides
several key measures of editing activity and their evolution over time. The table specifically
provides additional evidence supporting the notion that an increase in the number of users
drives most of the growth process. The number of edits per user on a yearly basis is very stable
with roughly two edits per user, with the possible exception of the first year, with roughly
three edits per user. Edit distance per edit does fluctuate more over the years, but without
showing any clear time trend. Because a few very “heavy” edits can strongly affect cumulative
23As one would expect, we find that the average edit distance of a bot edit is only about 10% of the averageedit distance for human contributors. This finding excludes cases in which a bot is reverting a vandalizedarticle to a previous version. Edit distance in those cases can be very large.
37
edit distance, we also report a version of the edit distance that caps individual edits at 10,000
characters (roughly the 98th percentile of the edit distance distribution). The capped metric
exhibits a similar growth pattern over the years as the other measures of editing activity.
At the article level, we investigate how the amount of reverted edits as well as the degree of
deletion and replacement of content evolved over time. In Table (B2), we document that edits
involved more deletion of content over time, particularly for the earlier vintages. More specif-
ically, our measure of content addition/deletion (∆Length/EditDistance ∈ [−1, 1]) drops
from an average of 0.53 to 0.36 for 2002 vintage articles over time. The relative proportion
of addition of content versus deletion decreases over time for all vintages. Also, in any given
calendar year, older vintages tend to have more deletions. Similarly, the amount of reverted
edits increases over time and more strongly affects earlier vintages. In 2009, 28% of edits on
2002 vintage articles were reverted compared to 13% for the 2003 vintage and even less for
later vintages. An alternative way to look at this phenomenon is to compare total cumulative
edit distance over an article’s lifetime with its length. We compute such a measure for each
article in the last week of our sample in January 2010 and report the results grouped by article
vintage in Table (B3). In line with the findings above, we find that the ratio of length to
cumulative edit distance is as low as 25% for 2002 vintage articles and increases for younger
vintages with a ratio of 67% for 2005 articles and 91% for the youngest articles created in
2009. We also investigate the fraction of edits made by new users rather than users that
previously edited the same article in the bottom panel of Table (B2). We find a slight decline
from 0.8 to about 0.75 for 2002 vintage articles and similar patterns for latter vintages.
38

B Appendix: Tables
Year Number Number Number Cumulative CAPPED Edits Edit CAPPEDof Articles of Users of Edits Edit Edit per Distance E.Dist.Created Distance Distance User per per
(Unit: (Unit: User UserCharacters) Characters)
2002 85 182 556 394,967 338,981 3.05 710 6102003 72 414 973 527,520 486,815 2.35 542 5002004 121 1,252 2,714 1,100,098 949,354 2.17 405 3502005 337 3,215 7,390 4,412,004 3,000,223 2.30 597 4062006 216 6,138 12,622 9,361,682 4,436,502 2.06 742 3512007 239 7,138 13,874 8,005,666 5,166,570 1.94 577 3722008 197 6,213 12,874 7,621,270 6,445,102 2.07 592 5012009 136 5,768 13,122 7,539,501 5,727,252 2.27 575 436
Table B1: Content Evolution at the Category Level: More Descriptive Statistics.The cap for the “capped edit distance” variable is implemented at 10,000 characters; 97.5%of edits are below this threshold.
39

Year of Article Creation
2002 2003 2004 2005 2006 2007 2008 2009
ADDITION / 2002 0.53DELETION 2003 0.57 0.64METRIC 2004 0.49 0.54 0.63
2005 0.41 0.55 0.49 0.652006 0.40 0.50 0.40 0.48 0.57
Calendar 2007 0.39 0.42 0.41 0.50 0.46 0.58Year 2008 0.37 0.36 0.42 0.46 0.41 0.37 0.47
2009 0.36 0.35 0.44 0.44 0.46 0.43 0.43 0.56
SHARE OF 2002 0.01REVERTED 2003 0.02 0.01EDITS 2004 0.06 0.02 0.01
2005 0.09 0.03 0.05 0.012006 0.23 0.06 0.16 0.04 0.03
Calendar 2007 0.30 0.11 0.22 0.10 0.09 0.03Year 2008 0.31 0.13 0.25 0.07 0.07 0.04 0.04
2009 0.28 0.13 0.13 0.06 0.07 0.05 0.06 0.02
SHARE OF 2002 0.81EDITS BY 2003 0.82 0.76NEW USERS 2004 0.81 0.83 0.81
2005 0.79 0.74 0.73 0.732006 0.75 0.71 0.69 0.78 0.752007 0.76 0.78 0.74 0.78 0.64 0.652008 0.77 0.75 0.77 0.72 0.74 0.59 0.572009 0.75 0.75 0.72 0.76 0.75 0.75 0.66 0.57
Table B2: Content Evolution: Type of Edit and Share of New Users. The tablereports the average values per article for various characteristics of edits by article vintage (yearof article creation) and calendar year. See main text for details on the variable definitions.
40

Year of Article Fraction S.D. Number ofCreation Articles
2002 0.26 0.17 852003 0.40 0.22 722004 0.54 0.22 1212005 0.67 0.22 3372006 0.68 0.22 2162007 0.75 0.19 2392008 0.78 0.21 1972009 0.91 0.15 136
Table B3: Article Length Relative to Cumulative Edit Distance at the End of theSample Period. The table reports the cumulative edit distance at the article level acrossall edits relative to the article length at the end of the sample period across all articles of aparticular vintage. If all edits constitute additions of content, the metric is equal to one. Ifsome edits replace or delete content, the cumulative editing distance will exceed article length.
41
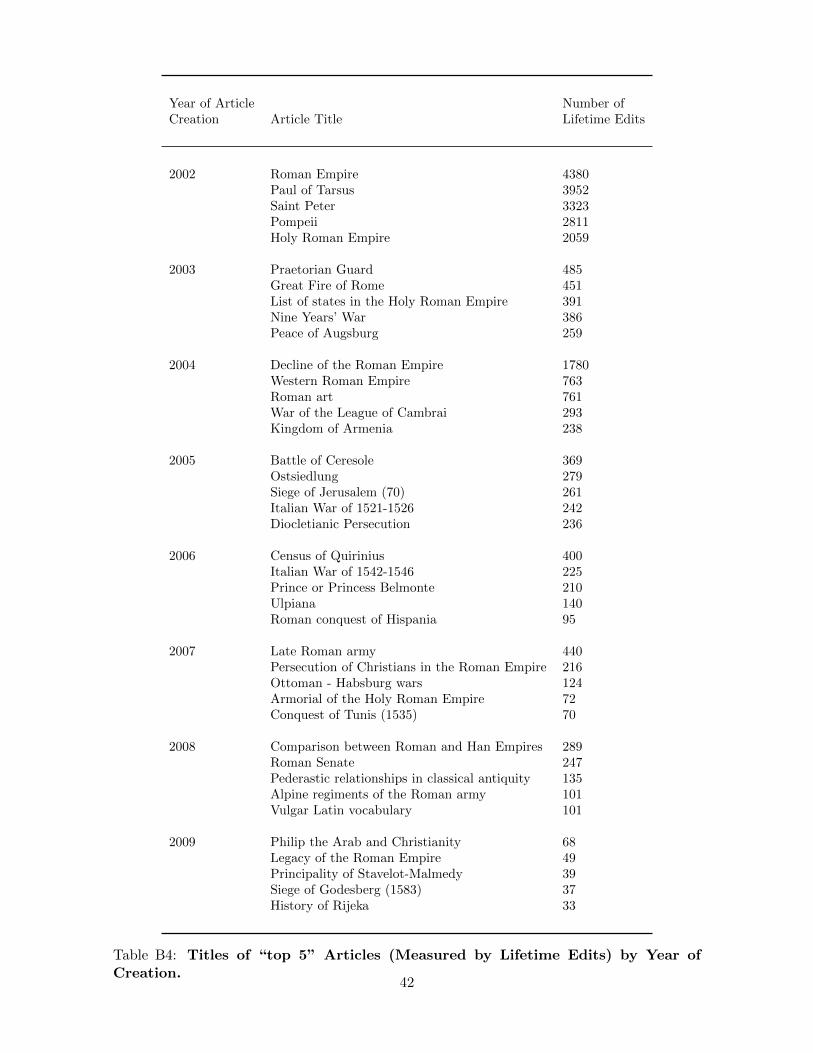
Year of Article Number ofCreation Article Title Lifetime Edits
2002 Roman Empire 4380Paul of Tarsus 3952Saint Peter 3323Pompeii 2811Holy Roman Empire 2059
2003 Praetorian Guard 485Great Fire of Rome 451List of states in the Holy Roman Empire 391Nine Years’ War 386Peace of Augsburg 259
2004 Decline of the Roman Empire 1780Western Roman Empire 763Roman art 761War of the League of Cambrai 293Kingdom of Armenia 238
2005 Battle of Ceresole 369Ostsiedlung 279Siege of Jerusalem (70) 261Italian War of 1521-1526 242Diocletianic Persecution 236
2006 Census of Quirinius 400Italian War of 1542-1546 225Prince or Princess Belmonte 210Ulpiana 140Roman conquest of Hispania 95
2007 Late Roman army 440Persecution of Christians in the Roman Empire 216Ottoman - Habsburg wars 124Armorial of the Holy Roman Empire 72Conquest of Tunis (1535) 70
2008 Comparison between Roman and Han Empires 289Roman Senate 247Pederastic relationships in classical antiquity 135Alpine regiments of the Roman army 101Vulgar Latin vocabulary 101
2009 Philip the Arab and Christianity 68Legacy of the Roman Empire 49Principality of Stavelot-Malmedy 39Siege of Godesberg (1583) 37History of Rijeka 33
Table B4: Titles of “top 5” Articles (Measured by Lifetime Edits) by Year ofCreation.
42
CENTRE FOR ECONOMIC PERFORMANCE Recent Discussion Papers
1274 Chiara Criscuolo Peter N. Gal Carlo Menon
The Dynamics of Employment Growth: New Evidence from 18 Countries
1273 Pablo Fajgelbaum Stephen J. Redding
External Integration, Structural Transformation and Economic Development: Evidence From Argentina 1870-1914
1272 A. Bryson J. Forth L. Stokes
Are Firms Paying More For Performance?
1271 Alex Bryson Michael White
Not So Dissatisfied After All? The Impact of Union Coverage on Job Satisfaction
1270 Cait Lamberton Jan-Emmanuel De Neve Michael I. Norton
Eliciting Taxpayer Preferences Increases Tax Compliance
1269 Francisco Costa Jason Garred João Paulo Pessoa
Winners and Losers from a Commodities-for-Manufactures Trade Boom
1268 Seçil Hülya Danakol Saul Estrin Paul Reynolds Utz Weitzel
Foreign Direct Investment and Domestic Entrepreneurship: Blessing or Curse?
1267 Nattavudh Powdthavee Mark Wooden
What Can Life Satisfaction Data Tell Us About Discrimination Against Sexual Minorities? A Structural Equation Model for Australia and the United Kingdom
1266 Dennis Novy Alan M. Taylor
Trade and Uncertainty
1265 Tobias Kretschmer Christian Peukert
Video Killed the Radio Star? Online Music Videos and Digital Music Sales
1264 Diego Battiston Richard Dickens Alan Manning Jonathan Wadsworth
Immigration and the Access to Social Housing in the UK
1263 Alexandre B. Cunha Emanuel Ornelas
Political Competition and the Limits of Political Compromise
1262 Alexander C. Lembcke The Impact of Mandatory Entitlement to Paid Leave on Employment in the UK

1261 Nicholas Bloom Paul M. Romer Stephen J. Terry John Van Reenen
Trapped Factors and China’s Impact on Global Growth
1260 Alexander C. Lembcke Home Computers and Married Women's Labor Supply
1259 Michael Carter John Morrow
The Political Economy of Inclusive Rural Growth
1258 Nicholas Bloom Erik Brynjolfsson Lucia Foster Ron Jarmin Megha Patnaik Itay Saporta-Eksten John Van Reenen
IT and Management in America
1257 David W. Johnston Grace Lordan
When Work Disappears: Racial Prejudice and Recession Labour Market Penalties’
1256 A. Chevalier O. Marie
Economic Uncertainty, Parental Selection and the Criminal Activity of the ‘Children of the Wall’
1255 W. David Bradford Paul Dolan Matteo M. Galizzi
Looking Ahead: Subjective Time Perception and Individual Discounting
1254 Marc J. Melitz Stephen J. Redding
Missing Gains from Trade?
1253 Charlotte Cabane Andrew E. Clark
Childhood Sporting Activities and Adult Labour-Market Outcomes
1252 Andrew E. Clark Emanuela D'Angelo
Upward Social Mobility, Well-being and Political Preferences: Evidence from the BHPS
1251 Juliano Assunção, João Paulo Pessoa Leonardo Rezende
Flex Cars and Competition in Ethanol and Gasoline Retail Markets
1250 Oriana Bandiera Andrea Prat Raffaella Sadun
Managing the Family Firm: Evidence from CEOs at Work
The Centre for Economic Performance Publications Unit Tel 020 7955 7673 Fax 020 7404 0612
Email [email protected] Web site http://cep.lse.ac.uk