ceo-director connections and corporate fraud: not just ... · pdf fileceo-director connections...
TRANSCRIPT

CEO-Director Connections and Corporate Fraud
Not just whether you are connected but how lowast
N K Chidambaran
Simi Kedia
Nagpurnanand R Prabhala
This Version March 2012
JEL Classification G30 G32 G34 G38
lowast Chidambaran is at Fordham University (chidambaranfordhamedu) Kedia is at Rutgers University (skeshydiabusnessrutgersedu) and Prabhala is at the University of Maryland (prabhalaumdedu) We appreciate the detailed feedback from Benjamin Cole Larry Fauver Eli Fich Shane Johnson Clive Lennox Angie Low Lalitha Naveen Antionette Schoar Howard Tuckman Vijaya Venkatramani Adam Yore Merih Sevilir and Denis Sosyura We thank seminar participants at Fordham University Korea University Business School London Business School NTU SMU Tsinghua University University of Tilburg and participants at the 2011 European Finance Association Meetings the 2011 Financial Intermediation Research Society Conference the 2010 Financial Management Assoshyciation Meetings and the 2010 Summer Research Conference at ISB for their comments All errors remain ours Chidambaran acknowledges support from a Fordham University Faculty Research Grant Kedia acknowledges supshyport from the Whitcomb Center and Prabhala acknowledges support from the Center for Financial Policy University of Maryland and the Judy Olian award for research support
CEO-Director Connections and Corporate Fraud
Not just whether you are connected but how
ABSTRACT
We study the relation between fraud and CEO-director connectedness focusing on the type of
CEO-director connection While nonprofessional connections due to shared non-business service
or alma mater increase fraud probability professional connections from employment overlaps
lower the incidence of fraud The benefits of professional connectedness are pronounced when
individuals share service as executives rather than as directors or as director and executive
The results are robust to firm-specific controls industry and time period controls coopted
directors and measures of director quality and heterogeneity While frauds have led regulators
to (successfully) push for independent directors our results suggest that independence is only
necessary not sufficient Heterogeneity within the set of independent directors seems to be at
least as important as independence per se
1 Introduction
The end of the dot com bubble in 2000 was punctuated by several high profile cases of corposhy
rate fraud These frauds raised suspicions that the governance systems in the US had become
dysfunctional and resulted in a swift and sweeping regulatory response in the form of the 2002
Sarbanes-Oxley Act (SOX) While the eleven titles of SOX targeted several stakeholders of firms a
key target was the board of directors Frauds seem to manifest a basic failure of the board oversight
function perhaps due to excessively cozy relationships between CEOs and directors Thus regushy
lators institutional shareholders and proxy advisory services aimed to reform boards primarily by
stressing director independence1
The current standards for director independence focus on the economic relationships between
directors and top executives NASDAQ Rule 4200 a(15) and Section 303A of NYSE listing rules
define a director of a firm as independent only if (s)he has no material economic relationships with
the firm or its executives directly or through immediate family The regulations also target indirect
economic relationships For instance a firmrsquos director is not considered independent if the firmrsquos
CEO serves on the compensation committee of another firm where the director is an executive By
constraining the economic ties between independent directors and top executives the reforms aim
to facilitate independent judgment by directors
Economic ties represent only one source of CEO-director connections Directors can have no
economic ties to CEOs according to legal standards but could share ties to the CEO through comshy
mon educational service or employment experiences These connections reflect social interactions
that can also exert influence on board functioning As Adams Hermalin and Weisbach (2009) note
1For example NYSE and NASDAQ listed firms require at least 50 of the boards of directors to consist of inshydependent directors Besides overall board independence the governance regulations can also set norms for board committees NYSE rules require the CEO to recuse herself from director nominations See Beasley Carcello Hershymanson and Neal (2009) Chhaochharia and Grinstein (2007)) See Dahya and McConnell (2007) on similar Cadbury commission norms in the UK
1
a large part of a directorrsquos job involves interactions with or assessments of CEOsPrior connections
can influence the nature of these interactions The economic effect could be positive or negative
depending on whether the connection type constrains or facilitates opportunistic behavior2
We study whether CEO-director connections explain fraud If we include a measure that agshy
gregates all types of connections we find that CEO-director connections lower the probability of
fraud This finding is surprising It suggests that CEO-director connections are beneficial as they
mitigate fraud counter to the regulatory thrust towards an arms-length relationship between CEOs
and directors We show this overall result reflects important and economically sensible heterogeneshy
ity based on the connection type Professional ldquoLinkedInrdquo connections derived from employment
overlaps lower the likelihood of fraud In contrast nonprofessional ldquoFacebookrdquo ties of nonprofesshy
sional origin are positively related to fraud3 The results especially the differences in the economic
effects of different connection types are new to the literature
While we motivate the tests in more detail below it is useful to briefly consider why nonproshy
fessional and professional connections could have different effects Ties of all kinds can predispose
individuals towards cutting slack For instance connections can predispose individuals towards
making favorable judgments in situations of ambiguity (McPherson Smith-Lovin and Cook 2001)
which can compromise monitoring and increase fraud However there could be countervailing efshy
fects for professional connections For example one channel is that a director who has worked with
a CEO has witnessed the CEOrsquos functioning actions and choices in work settings These insights
can make the director a better judge of a CEOrsquos actions They can also foster better professional
advisory relationships with the CEO4 On the other hand nonprofessional connections through
2See eg Granovetter (1985) Coleman (1990) or Uzzi (1996)
3We use the phrase ldquoFacebookrdquo and ldquoLinkedInrdquo as metaphors Facebook was formed in 2004 to establish ties between students at similar universities and is now a site connecting people based on informal family and friendship ties mainly of a nonprofessional nature LinkedIn establishes professional connections arising out of employment
4For the effect of director characteristics on accounting conservatism see Klein (2002) and Ahmed and Duellman (2007) Adams and Ferreira (2003) Adams (2005) and Raheja (2005) discuss the advising function of boards a
2
common service on the board of an orchestra or a common alma mater are unlikely to endow
business skills that help a director do a better job The differential effects should be especially
manifest in vigilance about fraud which has large negative consequences for the human capital of
independent directors
Our first tests consider nonprofessional ties We use data on CEO-director connectedness from
the ldquoBoardexrdquo database compiled by Management Diagnostics Limited Boardex contains bioshy
graphic data on over 60000 executives serving at over 76000 private public and not-for-profit
organizations One source of nonprofessional connections studied by Cohen Frazzini and Malloy
(2008 2010) is a common alma mater As Cohen et al argue these connections endow individuals
with shared experiences a common culture and a common alumni network While these comshy
monalities can foster trust and aid teamwork their effects can be less benign when the task is to
monitor the CEO For instance friendships can foster status-based homophily due to loyalty and
trust (Lazarsfeld and Merton (1954) Marsden (1987) McPherson Smith-Lovin and Cook (2001))
The resulting under-monitoring could start a slide down a slope towards fraud
To further clarify the role of nonprofessional ties we conduct holdout tests that exploit the
ldquoother activitiesrdquo in the Boardex dataset These are nonprofessional connections formed through
overlaps at not-for-profit organizations such as service as trustees on charities non-profit organishy
zations universities or joint memberships of clubs Such ties are unlikely to endow a director any
expertise in monitoring a CEO in a business setting ndash just as belonging to a common alma mater
confers no advantage in executing the fiduciary responsibilities of a director The informal non-
business connections have gained notoriety in the popular press For instance in the well known
case of Enron the firm donated hundreds of millions of dollars to the MD Andersen Cancer Center
literature dating back to Mace (1971) Other work includes Fischer (1982) Rosen (1983) Westphal (1999) Coles Daniel and Naveen (2007) and Linck Netter and Yang (2009)
3
whose president John Mendelsohn sat on Enronrsquos board as an (ostensibly) independent director
Consistent with such anecdotal evidence non-business connections significantly elevate fraud
Our next tests consider professional connections These connections can be related to fraud
through several channels First professionally connected directors are individuals who have intershy
acted with and observed the CEOs closely in work settings The connections endow the director
insights on a CEOrsquos work attributes strengths and weaknesses This knowledge can improve a
directorrsquos monitoring capability Second a prior working relationship sets up a channel for CEOs
to get professional counsel and advice from the board Third prior work in the same team offers
a director the opportunity to gain private information about a CEOrsquos traits Directors may be
more willing to join a board when their assessment of a CEO indicates that malfeasance is unlikely
These effects could result in professional connections lowering fraud probability Alternatively proshy
fessional relationships could act as a source of personal friendships which could increase rather
than decrease opportunistic behavior and fraud We let the data speak to the net effect We find
that the beneficial effects dominate professional connections lower fraud probability
The subject of fraud is of considerable interest to the accounting and finance literature dating
back to at least Dechow Sloan and Sweeney (1995) and Beasley (1996) While our primary
contribution to this literature is to show that connections explain fraud asymmetrically depending
on connection type we also introduce other new evidence We introduce new explanatory variables
relating to CEO and board attributes and also use the opportunity to refresh the evidence about
other fraud determinants studied in prior work For instance the evidence on board independence
is mixed (eg Beasley (1996) Agrawal and Chadha (2005) Karpoff Lee and Martin (2008a))
We find that independence is significantly negatively related to fraud probability Among firm
characteristics larger firms growth firms less profitable firms and firms raising external finance
are more likely to commit fraud Following Agrawal and Chadha (2005) we also find that financial
4
misconduct is less likely with the presence of financial expertise Nevertheless expertise becomes
insignificant when we add year dummy variables suggesting that financial expertise has diffused
across boards over time Turning to other board attributes busy directors who serve on multiple
boards attenuate fraud probability This is consistent with the idea that busy directors have
incentives to protect reputational capital5
We consider endogeneity issues The key endogeneity question in our context is unobserved
covariates that can explain fraud specifically whether there are other explanatory variables that we
omit but should reasonably enter our specification6 We examine several candidates and in doing so
introduce new evidence on fraud determinants to the literature One possibility is that professional
connections perhaps pick up omitted director quality attributes For instance prestigious companies
such as GE IBM or McKinsey that serve as breeding grounds for corporate talent We find
that the presence of directors from these firms does lower the probability of fraud but professional
connectedness remains significant We also test the hypothesis that professional connections matter
more when there are more meaningful professional interactions which arise when individuals work
together as employees rather than as director and employee We find support for this view The
effect of professional connections is greater when directors overlap as employees rather than as
director and employee or director and director Finally we control for unobserved heterogeneity in
director quality through director fixed effects We find similar even stronger results
Another possibility is that connectedness manifests omitted measures of executive ability Folshy
lowing Chevalier and Ellison (1999) we include a dummy for the quality of a CEOrsquos undergraduate
institution Individuals from prestigious schools may have higher ability or face greater costs of
5Recent work on busy directors includes Ferris Jagannathan and Pritchard (2003) Yermack (2004) and Fich and Shivdasani (2007) See also Srinivasan (2005)on labor market consequences for directors after restatements Kaplan and Reishus (1990) on dividend cuts Brickley Coles and Linck (1999) on performance and Coles and Hoi (2003) on opting out of takeover provisions
6See Roberts and Whited (2011) for a review of the types of endogeneity issues in empirical research
5
social stigma so they are less likely to commit fraud We find that fraud is less likely when a firmrsquos
CEO has attended a prestigious undergraduate school but there is little effect on the connectedness
variable Bertrand and Schoar (2003) point out that CEOs with MBAs tend to take aggressive
strategies which could lead them to cross the line into fraudulent behavior These assertions are
not supported by the data and have little effect on connection variables7 Finally CEO ability is
likely to be manifested in larger rolodexes and better overall connectedness Our results are robust
to the CEO rolodex measures In any event our focus is on the different signed results for different
types of connections a result that remains robust
We also consider the possibility that CEOs with intent to commit malfeasance endogenously
coopt amenable directors who may monitor the CEO less and appoint them to the board We
include as an explanatory variable the portion of the board appointed by the current CEO The
variable is also interesting because the appointments made after a CEO assumes office should pick
up any primary or residual effects from pliable directors in the spirit of Yermack (2004) or Coles
Daniel and Naveen (2007) We find that this variable does not alter the effect of connectedness
As a further test we also examine the effect of directors appointed after a CEO assumes office and
connected to the CEO This variable also has little effect on the results We also incorporate the
role of incentive compensation Cheng and Warfield (2005) Burns and Kedia (2006) and Erickson
Hanlon and Maydew (2006) examine the role of equity and option compensation on fraud with
mixed results While including equity-based compensation shrinks the sample by over 60 due to
data requirements it does not materially affect the role of CEO-director connections
We also examine the variation introduced by the 2002 Sarbanes-Oxley Act (SOX) SOX provides
an interesting setting for testing the effects of connectedness on fraud as it aimed to distance boards
7Thus while it may be tempting to draw conclusions from the Enron fraud case in which the CEO and several executives are Harvard MBAs neither the ldquoHarvardrdquo nor the ldquoMBArdquo moniker seems to be a significant feature of frauds This finding may be of interest given the increasing stress on ethics education by several business schools in the wake of the financial crisis See eg ldquoEconomic Crisis Leads Business Schools to Meld Ethics Into MBArdquo (Jennifer Epstein USA Today May 5 2010)
6
from CEOs by increasing director independence Increasing the distance between CEOs and boards
should lower the effects of all types of connections which we find in the data In fact nonprofessional
connections become insignificant Professional connectedness continues to matter While its effect
is lower after SOX like that of all other variables the magnitude increases relative to firm size the
most significant determinant of fraud in the literature
In sum connectedness matters even after including an exhaustive set of variables used in the
governance literature and does so in somewhat unexpected ways While nonprofessional connections
elevate fraud in line with the traditional agency viewpoint of connections professional connections
are related to lower fraud probability These results make three major points First connections
matter At the minimum they appear to pick up unobserved aspects of governance that convenshy
tional board variables do not Second connections matter at least as much as independence Thus
while the regulatory push towards director independence is useful our results say that indepenshy
dence is perhaps not enough Heterogeneity within independent directors deserves more attention
Finally we emphasize a bright side of CEO-director connections Not all forms of connections are
necessarily bad Professional connections lower fraud probability even before SOX when boards
and connections faced relatively less scrutiny
The rest of the paper is organized as follows Section 2 reviews the related literature Section 3
discusses the data Sections 4 and 5 present the empirical results including several robustness tests
and a detailed discussion of alternate interpretations of our key results Section 6 concludes
Related Literature
We contribute to a growing literature on the design and role of the boards of directors in the modern
corporation Hermalin and Weisbach (2007) and Adams Hermalin and Weisbach (2009) present
recent surveys of the literature The topic of special interest since the 2002 Sarbanes-Oxley Act
7
2
and related rules that place substantial restrictions on the composition and functioning of boards
mainly to avoid a repetition of the fraud waves of the post dot com era We contribute to the
debate by offering new evidence on the aspects of boards that contribute positively or negatively
to the board oversight function In particular we analyze the board attributes that explain fraud
Frauds are an extremal example of the failure of board oversight and the main contributory factor
for SOX the most aggressive regulatory intervention in the governance of public firms
Our findings add to a growing literature on fraud Beasley (1996) presents early evidence that
board independence matters based on a sample of 75 fraud firms between 1982 and 1991 More
recently Agrawal and Chadha (2005) find little effect of independence but show that financial exshy
perts on boards lowers the propensity to restate Erickson Hanlon and Maydew (2006) Cheng
and Warfield (2005) and Burns and Kedia (2006) study the role of equity incentives on the likelishy
hood of misreporting8 We add to this literature by highlighting the role played by CEO-director
connections Additionally we introduce and find evidence of new board attributes that matter
For instance we show that fraud is less likely when directors have more external appointments so
reputational incentives appear to enhance director attention (Ferris Jagannathan and Pritchard
(2003) Yermack (2004) Fich and Shivdasani (2007))
It is worth considering the economic and empirical merits of focusing on how to measure fraud
Our study employs the SEC and DOJ actions dataset of Karpoff Lee and Martin (2008a)9 We
echo their point about the need to carefully measure fraud The GAO restatements database
from 2002 to 2006 can be used as a fraud indicator but it contains several technical errors and
misclassifications The noise in the unfiltered data can be significant For instance in the finance
8Other studies examining different dimensions of frauds include Bergstresser and Philippon (2006) Dechow Sloan and Sweeney (1996) Johnson Ryan and Tian (2009) Kedia and Philippon (2009) Desai Hogan and Wilkins (2006) Lennox and Pittman (2010) Li (2010) Peng and Roell (2008) Povel Singh and Winton (2007) and Wang (2008)Karpoff Lee and Martin (2008a 2008b)
9We thank them for graciously sharing their dataset with us
8
literature Fracassi and Tate (2009) use GAO restatements as proxies for fraud but Hennes Leone
and Miller (2008) suggest that 76 of GAO restatements are erroneous This problem is well known
in the accounting literature Hennes et al suggest refinements that result in what is essentially our
empirical strategy of focusing on enforcements10
Given our focus on the beneficial effects of professional connections it is useful to consider
why professional CEO-director connections can alleviate fraud One channel is heterogeneity in
monitoring capability between independent directors that is not always picked up by observable
traits of directors or managers (see Coles and Li (2010)) Connections can contribute towards
explaining inter-director heterogeneity Peers who have worked with the CEO in a professional
capacity in the past may be better monitors of CEOs as they may find it easier to judge a CEOrsquos
professional choices or the content of information flows from the CEO Thus the misstep and the
snowballing effect culminating in fraud is averted Alternatively it is also plausible that the insights
that directors have gained from prior work with a CEO influences their decision to accept a board
position Directors may be more willing to join a board when their prior assessment of a CEO
indicates that malfeasance is unlikely Either channel predicts and motivates the hypothesis that
fraud is negatively related to professional CEO-director connectedness
For a complementary view it is useful to consider how fraud could arise It is unlikely that the
CEO asks his board for advice on whether he should commit fraud or not (and receives affirmative
assent) Indeed we know of no such cases where boards are actively and willfully complicit in this
manner An alternative view is that most frauds begin small For instance Schrand and Zechman
(2011) report that 75 of violations start small and eventually develop into intentional criminal
10Class action litigations have the limitations that lawsuits could be biased towards firms with deep pockets or frivolous lawsuits (Easterbrook and Fischel (1985) and Thakor Nielson and Gulley (2005)) For within-GAAP earnings management see eg Bruynseels and Cardinaeles (2011)
9
malfeasance Real-life anecdotal evidence is provided in the case of the company Satyam Inc The
CEO says ldquowhat began as a small discrepancy continued to grow over the yearsrdquo11
The first and possibly minor misstep is less likely when there is an active counsel and advising
relation with back and forth between the CEO and directors which is more likely when there
are professionally connected directors whose business judgment the CEO respects The sociology
literature suggests that different types of networks are activated in different situations and may
therefore have different effects on the boardrsquos monitoring and advising roles Saint-Charles and
Mongeau (2009) show that ldquoadvice networksrdquo consisting of people or specialists that are consulted
for work-related matters are activated at different times relative to ldquofriendship networksrdquo In
particular ldquoadvice networksrdquo based on ldquocompetence trustrdquo are called upon at times of organization
uncertainty and such networks are more readily accessible when the board comprises professional
colleagues Plickert Ct and Wellman (2007) suggest that a notion of reciprocity might also be at
work Having professional peers on board may more likely be associated with professional quid pro
quo rather than non-pecuniary kinship utility that might be derived from having nonprofessional
friends on boards that permit lax monitoring of CEOs
We join a burgeoning literature on CEO social connections much of it spawned by Cohen
Frazzini and Malloy (2008) and Cohen Frazzini and Malloy (2010)12 We add to their work in two
ways First we present new evidence on the dark side of connections not only the undergraduate
alma mater connections of Cohen et al but also nonprofessional connections generated through
non-business service Perhaps more importantly we also show evidence on the bright side of
connections Our finding that professional connections lower fraud probability support work in
the mergers and acquisitions area by Cai and Sevilir (2009) and Schmidt (2009) who point out
11See ldquoSatyam Chief admits huge fraudrdquo by Heather Timmons and Bettina Wassener The New York Times January 7 2009
12Related work includes Westphal and Zajac (1995) Nguyen (2008) Subrahmanyam (2008) and Hwang and Kim (2009) Engelberg Gao and Parsons (2009) Fracassi and Tate (2011) and Liu (2009)
10
3
that connections benefit firms by facilitating acquisitions Finally our result that different types of
connections have different-signed effects is new to the literature In subsequent work in accounting
Bruynseels and Cardinaeles (2011) use our approach to study audit committee effectiveness Like
us they report asymmetric effects for professional and non-professional connections
A parallel literature on social connections analyzes the aggregate measures of overall network
architecture of connections that is derived from pairwise connections between individuals In the
venture capital context Hochberg Ljungqvist and Lu (2007) show the benefits of sourcing financing
from venture capitalists with high aggregate connectedness While we control for these measures
our work stresses a rather different economic point Our focus is on different types of connections
Our point is that besides the numerical count of connections or their structural strength the
nature of the economic interaction generating the connection is also important Connections born
out of different interactions between agents can have different economic effects The role played
by interactions is often stressed by sociologists such as Granovetter (2005) but is less known or
explored in the finance literature We provide some of the first evidence in this regard
Data and Descriptive Statistics
The primary data source on the Board of Directors and the CEO is the BoardEx database provided
by Management Diagnostic Limited The fraud data come from the SEC Enforcement action
database of Karpoff Lee and Martin (2008a) updated to September 2009 The charges filed by the
SEC against the firm identifies the ldquoviolation periodrdquo ie the period over which the firm allegedly
engaged in financial misconduct We classify as fraud years the violation period in which the firm
engaged in financial misconduct Stock return and accounting data are from CRSPCOMPUSTAT
while the Executive compensation data is from EXECUCOMP
11
Table 1 provides descriptive statistics on the fraud years Between fiscal years 2000 and 2006
there are 560 fraud years representing about 26 of the sample firm-years The fraction of the
firms subject to enforcement actions is 507 in 2000 rising to about 568 in 2002 and dropping
to less than 1 in 2006 The declining rate of misrepresentation after 2002 could be due to tighter
regulatory framework under Sarbanes-Oxley Act of 200213 These data suggest that year fixed
effects should be included when predicting fraud Table 2 displays the variation in frauds across
the Fama-French 48 industry categories There is some evidence on industry effects in fraud For
instance fraud appears more likely in computer hardware sector These data suggest that industry
fixed effects may be needed as controls while predicting fraud We do so in the empirical analysis
31 CEO-Director Connections
BoardEx collects biographical information of corporate directors and senior managers from a wide
variety of public domain sources We sort and code the data at the individual officer and director
level and then aggregate data at the firm level for each fiscal year The raw data needs to be
filtered for screening out errors and inconsistencies and needs to be manually matched with the
other databases that we use We describe this process in detail before turning to the distribution of
the connectedness variables and various attributes and characteristics used in the empirical analysis
BoardEx covers all individuals who have ever been an officer or a director ie a disclosed
earner in US and European public firms since 1999 The biographical data included in BoardEx
covers educational qualifications employment history including the type of service (director or
executive or both) as well as service on not-for-profit organizations The personal biographical
information collated by BoardEx dates back to as early as 1926 Our base dataset consists of
two main files containing the employment records and education records respectively downloaded
13A small fraction of fraud in 2006 might also be due to the fact that firms that were choosing to misrepresent in 2006 may have not been discovered by September 2009 the last date for data collection
12
from BoardEx on August 1 2008 The key firm identification variable in BoardEx is companyid
the key individual identification variable is directorid and the key variable to identify educational
or certifying institutions attended by individual officers and directors is universityid The August
1 2008 download from BoardEx has 61119 individuals who have served as directors or disclosed
earners with employment or service histories over a total of 76572 unique organizations
BoardEx coverage includes public private and non-profit companies in the US and foreign
countries Since our unit of analysis is a firm we begin by identifying publicly listed US firms both
active and inactive BoardEx provided us with a field for whether the coverage of a firm is complete
or not We found that BoardEx coverage is not complete for several firms prior to 2000 There is
yet another data consideration The list of complete coverage firms encompasses about 1500-1900
firms from 2000-2002 roughly corresponding to firms in the EXECUCOMP database This expands
significantly to incorporate over 3000 firms after 2003 Boardex confirms that coverage expands
after 2003 We account for this expansion in our empirical analysis We match firms in BoardEx to
the merged CRSP-COMPUSTAT database through a combination of machine and hand-matching
methods to get GVKEY and PERMNO identifiers
For each firm for which we have a valid GVKEY and PERMNO we first identify the CEO for
the firm The employment records in BoardEx give the starting and ending dates of each job in the
employment history of the officer and director We use the dates to identify the individual serving
as the CEO at the end of the fiscal year We next identify an annual snapshot of all officers and
directors at the end of the fiscal year for a given firm We scroll through the employment records
for each individual officer and director and determine whether they were employed by the firm and
whether the fiscal year end of the company falls between the start and end dates for a job with
the firm If the individual was employed by the firm at fiscal year-end we further mark them as
officers (who do not serve on boards but are disclosed earners) executive directors (executives on
13
boards) or supervisory directors (outside directors not otherwise employed by the firm) based on
the position description in BoardEx
32 Professional Connections
We classify a CEO as having a professional employment connection with an outside director if they
are employed at the same time in a firm excluding the service at the current firm Empirically
we define professional connectedness between the board and the CEO in a firm PROF FRAC
as the fraction of the board of directors that is connected to the CEO through prior common
employment antecedents We find that about 413 of firm years in our sample were classified as
having an employment connection between the CEO and an outside director As shown in Table
3 the average value of PROF FRAC for misreporting firms is 844 which is significantly lower
than the 1361 for non misreporting firms We grade the connections further by the nature of
the underlying professional job and by the type of firm at which the connections were formed We
return to this point after introducing the main logit results
33 Nonprofessional Connections
Nonprofessional connections between CEOs and directors can arise from common service at not-forshy
profit institutions or through commonalities in educational institutions Neither the common alma
mater nor the shared service in non-business activities are likely to make directors more capable
in their fiduciary role as board members We analyze the two sources of non-business connections
individually and together in some specifications
Inferring educational institution connectedness requires screening with considerable manual
intervention The names of the degree granting institutions are not necessarily coded in a consistent
way We manually match the names of educational institutions taking care to identify multiple
14
versions of the names (eg Harvard University and Harvard) There is a similar variation in the
specification of the degrees earned by the officer and director in the biographies We manually
sort through the degrees received and categorize them into the following six categories Bachelors
Masters MD MBA JD and PhD Given our focus on nonprofessional connections we examine
connections derived from a common undergraduate alma mater In any event graduate connections
add very little As in Cohen Frazzini and Malloy (2008) we do not emphasize common years of
attendance As they argue trust and information flows from education ties capture shared beliefs
common culture and a sense of belonging that can arise from a common institution14 The fraction
of board members with educational ties to the CEO is referred to as EDU FRAC The average
EDU FRAC is is 137 for misreporting firms versus 111 for other firms and the univariate
difference is not significant as shown in Table 3
One issue with educational connections is about possible gaps in coverage by Boardex either
because disclosures were less complete in earlier years or because transcription became more accushy
rate over time These gaps could induce bias particularly for executives who are not covered in
later years because they drop out as executives or directors Two factors mitigate this concern in
our study First as discussed above we rely on the institution from which the executive obtains an
undergraduate degree and not the year of graduation We find that the undergraduate institution
field is well populated Second to the extent the data gaps reduce over time educational conshy
nectedness should have stronger effects in subsamples drawn from later years In contrast we find
diminishing effects in the post-SOX period after 2002 as discussed in Section 55 so it is unlikely
that measurement error in the education connections drives our results15
14A definition of connectedness based on the same institution and graduating within a +-2 year cohort may be argued to capture personal friendships rather that cultural origins picked up by common alma mater As a proxy for personal friendships it is both excessively inclusive (given the average cohort size of several thousand students per year) and simultaneously too exclusive because it does not capture personal friendships formed outside the college context Whether it is a useful proxy or not is an empirical issue it has little effect on its own and changes little else
15We thank (without implicating in any way) David Yermack for motivating the investigation of these data issues
15
BoardEx classifies non-business activities of individuals as ldquootherrdquo activities Based on the
data for individual directors and officers we develop data with respect to common service by
the CEO and directors at not-for-profit organizations such as trusts universities clubs and other
non-business associations As before we measure the fraction of board members connected with edshy
ucational ties to the CEO and refer to it as OTH FRAC As Table 3 shows the average OTH FRAC
is 952 for misreporting firms versus 632 for other firms and the univariate difference is signifshy
icant at 1 We combine the connections arising from these two nonprofessional sources into one
variable denoted as NONPROF FRAC which denotes the fraction of board members that have an
educational or non-business tie to the CEO The average NONPROF FRAC is is 1085 for fraud
firms versus 739 for other firms and the univariate difference is significant at 1
34 Other Explanatory Variables
We control for firm size using log of total assets (COMPUSTAT item data6) Profitable firms
may have less need to commit fraud To control for profitability we include the ratio of EBITDA
(earnings before interest taxes and depreciation COMPUSTAT item data13) to total assets
Leverage a proxy for closeness to debt covenant violations or financial distress may be more likely
to be associated with fraud We define leverage as the ratio of Total Liabilities (Compustat item
data 181) to total assets Povel Singh and Winton (2007) show that high-growth firms facing
reduced growth opportunities are most likely to engage in financial misrepresentation To control
for growth opportunities we include Q following Davis Fama and French (2000) Firms with
a greater need to access external capital markets are more likely to misreport in order to reduce
the cost of external financing (Dechow Sloan and Sweeney (1996) and Beneish (1999)) Thus we
construct a dummy variable ISSUANCE that equals 1 if the firm issues stock (COMPUSTAT item
data108 gt 0) or increases debt (COMPUSTAT item data111 gt 0) and zero otherwise
16
The univariate statistics in Table 3 suggest that size is a significant predictor of misreporting
The unconditional comparisons must be read with caution given the size effect Leverage and
issuance also matter perhaps due to correlation with size Among the board characteristics are
board size BSIZE which is the number of directors on the board and INDEP FRAC which is
the ratio of outside or supervisory directors to board size Following Fich and Shivdasani (2007)
we count the number of other directorships held by each director of the firm We then average
across all directors to create a measure BUSY that captures the incidence of busy directors at the
firm level BoardEx carries information on whether a director is classified as a financial expert
Following Agrawal and Chadha (2005) we create a variable FINEXP which takes the value one
when the board has a director who is classified as a financial expert and zero otherwise
On a univariate basis misreporting firms have about one more board member an equal degree
of independence slightly greater outside appointments and lesser financial expertise We also
consider some elements of CEO educational background following Chevalier and Ellison (1999)
We create the variable CEOIVY which is a dummy variable that takes the value one when the
CEO attended a high quality undergraduate institution which is the ldquoIvyrdquo definition proposed by
Zawel (2005) Following Chevalier and Ellison (1999) this could serve as a proxy for quality or it
could reflect the need to preserve reputation by a CEO 2748 of CEOs are classified as having an
Ivy league degree in misreporting firms versus 2522 in non-misreporting firms We also create
a variable CEOMBA which takes the value of 1 if the CEO has an MBA degree 264 of fraud
firms have MBA CEOs compared to 227 in non-fraud firms
While the univariate comparisons are useful descriptors little can be inferred from them alone
because of correlations between variables This is more than a mere theoretical possibility because
of the dominant role played by firm size in explaining fraud For instance large firms with large
boards may be more likely to employ directors holding more outside appointments so any differences
17
in BUSY might reflect differences in firm size We examine these and the other univariate differences
using a multivariate logit specification
4 Logit Estimates
In this section we present the main logit estimates that explain fraud The dependent variable is
a dummy variable that equals 1 if the firm misreports during the year and zero otherwise In a
specification that aggregates all types of connections we find that CEO-director connections lower
the probability of fraud Given our focus on different types of connections and space constraints
we omit this specification and go directly to ones that disaggregate connections by their origin
Section 41 begins with a baseline model that incorporates firm and board characteristics studied
in prior work Sections 42 and 43 expand the specification to include CEO-director connectedness
We also conduct many robustness tests As not all fit due to space constraints we omit some All
unreported results are available from us upon request
41 Baseline Specification
Table 4 displays estimates of baseline logit models to explain financial fraud Among firm charshy
acteristics firm size is significant in all specifications and is positively related to fraud Growth
firms are more likely to commit fraud as predicted by Povel Singh and Winton (2007) and Wang
(2008) Profitable firms are less likely to misrepresent while leverage is insignificant Firms that
access external capital markets are more likely to engage in fraud consistent with the view that
one motivation for fraud is to temporarily inflate security prices and lower costs of external finance
The other variables included in model (1) represent selected characteristics of a firmrsquos board of
directors drawn from prior work Although board size is significant in the univariate comparisons
of Table 3 it is insignificant in all logit models The explanatory power of board size is essentially
18
absorbed by firm size Board independence matters in all specifications More outside directors tend
to reduce the probability of fraud The differences between the logit estimates and the univariate
comparisons in Table 3 are worth stressing Board size matters in the univariate results but is
insignificant in the logit while independence is insignificant in univariate comparisons but matters
in the logit model The differences in results largely reflect the confounding effect of size Little
can be read into the univariate comparisons absent a control for size
Among the other board variables we find that fraud is less likely when outside directors have
more external appointments The results support the view in Yermack (2004) and Fich and Shivshy
dasani (2007) that reputational concerns matter for individuals active in the market for directors
In line with Agrawal and Chadha (2005) we find that financial expertise on the board reduces the
probability of financial misrepresentation This result is however not robust to the inclusion of year
fixed effects Including these makes the coefficient for financial expertise insignificant as shown
in specification (2) The likely explanation for this difference is that financial expertise on boards
has increased over time so its effect on fraud is largely absorbed by year fixed effects Consistent
with Table 1 the year fixed effects are themselves significant for each year after 2002 and have a
negative sign indicating a reduction in fraud in the post-SOX period Finally motivated by the
industry patterns noted in Table 2 we include industry fixed effects in specification (3) Several of
these are significant so we include them in all the logit specifications to follow
42 Nonprofessional Connections
We next examine the relation between CEO-director connections and fraud We start by examining
the effects of nonprofessional connections We consider the educational ties together with the other
educational attributes that we examine In Table 5 specification (1) includes nonprofessional
ties between directors and CEOs derived through non-business activities such as common club
19
memberships or shared service at not-for-profit organizations through the variable OTH FRAC
This represents the fraction of board members connected to the CEO through such non-business
activities The coefficient for OTH FRAC is positive and significant at 5 Non-business CEO-
board connections elevate fraud probability
We also introduce CEO personal attributes to the first specification in Table 5 The first proxy
is a dummy variable for the quality of the degree-granting undergraduate institution attended by
the CEO as listed by Zawel (2005) CEOs attending high quality undergraduate institutions are
less likely to commit fraud consistent with these CEOs having greater ability Alternatively they
could have greater concerns for reputation and other penalties from fraud A second variable
is CEOMBA which is a dummy for whether the CEO has an MBA degree The coefficient for
CEOMBA is negative although it is not significantCEOs with MBAs are not especially prone and
perhaps even less prone to fraudulent behavior compared to non-MBA CEOs16
Specification (2) in Table 4 introduces nonprofessional connections arising out of common educashy
tional antecedents Following Cohen Frazzini and Malloy (2008) and Cohen Frazzini and Malloy
(2010) the measure of CEO-director education connectedness is EDU FRAC ie the fraction
of the board that comes from the same undergraduate institution as the CEO The coefficient for
EDU FRAC is positive so educational overlaps tend to increase fraud probability but the coefficient
falls short of being significant at conventional levels (t-statistic = 155 p=012) In specification
(3) we add the educational and non-business connections to form an index of nonprofessional
connections between board members and the CEO This variable effectively aggregates and comshy
bines all ties of an informal non-business origin between CEOs and directors The coefficient for
NONPROF FRAC is positive and significant
16We also experimented with conventional attributes such as CEO tenure and age which can reflect horizon effects Neither variable is significant
20
In unreported results we further investigate CEO-director educational connectedness First
we further condition the connections by the prestige of the institution whose empirical definition
is made precise in Section 3 We find no evidence that more prestigious (or less prestigious) conshy
nections matter more Second we consider educational connections in which graduation dates or
CEO-director age differences (for connected directors) are within a 2 year span in the spirit of
Hwang and Kim (2009) These have little effect In our view the results are not particularly
surprising As Cohen Frazzini and Malloy (2008) and Cohen Frazzini and Malloy (2010) point
out the important component of educational ties likely relate to cultural origins from belonging to
similar institutions and sharing similar alumni networks We support this view Finally besides
undergraduate ties we also examine connections between CEOs and directors formed during gradshy
uate school either by virtue of a common school or a common school and program or a common
school program and year These connections have little independent explanatory power and do
not affect the other coefficients if educational connections matter the ones that do come from a
common undergraduate alma mater as proposed by Cohen Frazzini and Malloy (2008 2009)
43 Professional Connections
We next examine the role of professional connections between CEOs and directors The measure of
CEO-director employment connections is PROF FRAC which is the fraction of individuals on the
board of directors who were professionally employed at the same firm as the CEO at some point
of time in the past prior to the CEOrsquos current employment Table 6 explores its relation to fraud
The coefficient for PROF FRAC is negative and significant at 1 so professional connectedness
between CEOs and boards lowers the likelihood of fraud The beneficial effect could reflect better
monitoring capacity of a director who has worked with a CEO before in conjunction with or in
addition to better advisory relationships between individuals who have worked before or because
21
5
directors use knowledge of the CEO in work interactions to decide what boards they will join
While it is possible that professional connections can act as a source of personal friendships and
result in more lax monitoring this is clearly not the dominant effect in the data
We assess a more mechanical explanation for the effects of professional connectedness Specifishy
cally we test the hypothesis that the professional connectedness effect is really the effect of whether
the CEO is internally or externally sourced CEOs who build their career within a firm may have
few outside professional connections Thus the lower propensity to commit fraud of professionshy
ally connected CEOs could manifest the greater likelihood of fraud committed by internally hired
CEOs We find that internally hired CEOs are in fact less likely to commit fraud Furthermore the
coefficient for professional connections remains significant even after including a dummy variable
for internal hires CEOINTERNAL
Specification (2) in Table 6 examines whether the effect of professional connectedness of the
CEOs and directors is diluted when we add the nonprofessional connectedness between the CEOs
and directors Nonprofessional connectedness has little effect on the coefficients for professional
connections It is also worth stressing that the signs and significance of the different forms of
connectedness remain consistent across specification and do not rely on a particular configuration
of explanatory variables The basic result appears to be a robust feature of the full sample
More Tests
As discussed in Section 1 the main endogeneity issue that arises in our study is whether connectshy
edness picks up an unspecified attribute that is omitted from our main specifications To address
this issue we consider several additional specifications as well as additional variables whose effects
may be picked up by connectedness We also consider the possibility that CEOs with intent to
22
commit malfeasance endogenously coopt pliant directors and the variation introduced by the 2002
Sarbanes-Oxley Act The last section offers an overall perspective of the findings
51 Strength of Professional Connectedness
Our basic proxy for the strength of the connections exploits the nature of the past professional
overlap between CEOs and directors To further assess the economic meaning of the variable
we consider additional variation that plausibly reflects the type and intensity of the interaction
between the CEO and the director in their past job17
We classify the professional connections as being formed when the CEO and directors were
executives or into connections formed when the pair served as directors at another firm (or one was a
director while the other was an executive) Interactions between individuals employed as executives
at the same firm are likely to be more substantive These likely involve more frequent discussions
on substance and under environments varying in the levels and nature of the professional issues
facing firms This type of involvement is likely to lead to a greater understanding of an executiversquos
knowledge and style of functioning In contrast directors at the same firm tend to meet less
frequently and the interactions are likely to be at the same depth Thus the effects of professional
connection are likely to be the most pronounced when it is derived through common service as
executives of the same team Model (1) of Table 7 supports this view Connections formed at
the executive level (PROF FRAC E) have a significant negative effect on misconduct while those
formed through shared directorships are insignificant
17We considered overlaps without conditioning on dates of overlap These represent less than 2 of the professional connections sample 98 of CEO-director professional connections display overlap in firm and time
23
52 Director Quality and Director Heterogeneity
We next consider the possibility that professional connections are a proxy for director quality For
instance firms such as General Electric Pepsico Procter and Gamble and IBM serve as breeding
grounds for high quality business professional (see eg ldquoBreeding Grounds for New CEOsrdquo in
BusinessWeek April 30 2009) Professional connections are perhaps more likely when executives
have prior work experience at these firms Thus connections may be picking up the effects of
executives trained at these ldquodirectorrdquo factories We identify firms as ldquodirector factoriesrdquo if the
number of executives with employment histories in these firms are among the top 10 of all firms
These firms include IBM GE consulting firms such as Ernst and Young Andersen and McKinsey
as well as financial firms such as Goldman Sachs
We include as an independent variable the fraction of directors that are from these director
factories To control for CEOs who also originate from one of the director factories we also include
a dummy for whether the CEO is from a director factory Model (2) in Table 7 reports the
results We find that greater the fraction of directors from director factories the smaller is the
likelihood of fraud The CEOrsquos being from a director factory is not significant possibly because we
already control for CEO ability More interestingly the effect of professional connections remains
significant Thus professional connections in all forms attenuate fraud probability regardless of
ndash or more precisely in addition to ndash the professional origins of the directors We also examine
whether the connections formed between the CEO and directors at ldquodirector factoriesrdquo are special
These connections have a negative but insignificant coefficients so the the benefit of professional
connections is not exclusive to connections formed at director factories18
18Following Engelberg Gao and Parsons (2009) we examine if the CEOrsquos rolodex or the overall connectedness of the CEO subsumes the CEO-board professional and nonprofessional connections Our main results are robust to measures of aggregate connectedness including centrality and eigenvector centrality
24
We also consider director fixed effects to control for unobserved director heterogeneity Identishy
fication relies on variation in fraud propensity across subsamples of firms in which directors hold
multiple appointments some with and some without connections Thus the sample of usable firms
shrinks and we likely lose power Nevertheless specification (5) in Table 7 shows that professional
connections lower fraud This result is not likely to be driven by unobserved director heterogeneity
We next consider the possibility that pliable directors are set in place by a CEO who already
has intent to commit fraud These directors may be lax monitors as they are obligated to the CEO
for their appointment An interesting proxy for co-option is suggested by the board literature
Following Yermack (2004) and Coles Daniel and Naveen (2007) we proxy captured directors as
the fraction of the board appointed after the current CEO assumes office As seen in model (3) of
Table 7 AFTER CEO FRAC is not significant Nor does it alter the coefficients for professional
connections As a further refinement of this test we also estimate the fraction of the board of
directors who are appointed after the CEO takes office and have nonprofessional connections
Model (4) includes this additional variable The variable is not significant and it does not affect
the other coefficients in any material way
53 Compensation
Existing literature finds that the structure of executive compensation significantly affects the
propensity for financial misconduct In particular Bergstresser and Philippon (2006) Burns and
Kedia (2006) Cheng and Warfield (2005) and Erickson Hanlon and Maydew (2006) examine the
effect of equity incentives on discretionary accruals and restatements We obtain equity incentive
data from the EXECUCOMP database Perhaps the biggest issue that arises with this subsample
is the reduction in sample size by more than 50 to 7595 observations Additionally the sample
25
is concentrated among larger firms that comprise the EXECUCOMP database We conduct tests
in this subsample to assess the robustness of our results
Specification (1) in Table 8 presents the logit estimates for the full logit specification reported
in Table 6 plus non-cash compensation variable Following Karpoff Lee and Martin(2008b) non-
cash compensation is the ratio of the compensation paid through non-cash means (ie excluding
salary and bonus) to the total direct compensation (TDC1 in ExecuComp) We find that non-
cash compensation is positively associated with fraud The key connectedness variables remain
significant in the compensation subsample Professional connectedness mitigates fraud while nonshy
professional CEO-director connections are positively related to fraud Both measures matter as
much as conventional measures of independence19
Most other variables are not materially altered by the restriction to the compensation subsample
or by the inclusion of the compensation variable For instance we find that board independence is
associated with lower fraud probability CEOs attending prestigious undergraduate programs and
those with an MBA degree are less likely to be associated with fraud as are internally hired CEOs
The number of outside directorships held loses significance in this sample perhaps due to the lack
of variation when the sample is constrained to include only the larger firms with ExecuComp data
In any event controlling for compensation does not materially affect our main inferences about
CEO-director connections or the asymmetry between professional and nonprofessional connections
54 SOX
Our sample period 2000 to 2006 spans the passage of the Sarbanes Oxley Act in 2002 The Act
aimed to put distance between CEOs and boards by tilting boards towards (economically) indepenshy
dent directors and diminishing executive roles in key aspects of board functioning These measures
19Other specifications of the compensation variable do not alter these conclusions
26
coupled with intense public scrutiny increased the pressure on boards to act independently While
captured directors might have felt comfortable asking few questions of a CEO prior to 2002 the
passage of SOX may make such support less forthcoming If so the positive relation between nonshy
professional connectedness and fraud could weaken after 2002 A more armrsquos length regime could
also create greater distance between the professionally connected directors and the CEO If such
connections have beneficial effects in lowering fraud they should be less affected by SOX
To test for the SOX effects we examine the effect of connections both nonprofessional and
professional on the propensity of misconduct before and after the passage of SOX We estimate
logit models separately for the pre-SOX period defined as years 2000-2002 and the post-SOX period
defined as years 2003-2006 Specification (2) and (3) of Table 8 present the logit estimates for the
pre-SOX and the post-SOX period respectively As before both forms of connectedness matter in
the pre-SOX period but not in the post-SOX period The coefficient for non-professional connections
declines by 50 in the post-SOX period and it is not significant compared to a 17 decline for
the professional connections coefficient which remains significant Thus while SOX does distance
CEOs from boards it does not eliminate the beneficial effects of professional connectedness20
55 Marginal Effects
In this section we examine the logit marginal effects Table 9 reports the marginal effect estimates
and significance for the logit estimates reported in Table 8 For discrete variables such as CEOMBA
or CEOIVY the marginal effects show the effect on logit probability of changing the variable from
zero to one and for continuous variables we report the effect of a one standard deviation change
To put the marginal effects in perspective the overall probability of fraud in the Table 9 sample is
20Boardex increases data coverage over this period so there are several new firms in the post SOX period A proper examination of the effect of SOX requires us to observe the firm both before and after the passage of SOX As BoardEx coverage of large firms ie those covered in ExecuComp is steady over this period we report the SOX results for the ExecuComp sample The results are materially unchanged if we use the full sample
27
394 While fraud attracts significant attention from regulators and policy makers and has resulted
in some of the most expansive intervention into corporative governance of public corporations it
is a relatively rare event
As in prior work firm size has the largest marginal effect Model (1) shows that it has a (one
standard deviation) marginal effect of 193 Of the remaining variables professional connectedness
is the most significant with a (one standard deviation) marginal effect of -081 Perhaps the more
interesting comparison is between professional connections and board independence which has
been a major focus of received regulations Board independence has a marginal effect of -035
so professional connections have roughly twice the marginal effect of independence in attenuating
fraud Nonprofessional connections also matter and model (1) suggests that these marginal effects
also exceed that of board independence in the full sample A similar ranking emerges for the pre-
SOX estimates reported in model (2) In sum social connections matter at least as much as and
perhaps more than board independence in explaining fraud
The marginal effects for all variables decline after SOX consistent with the lower fraud probabilshy
ity in the post-SOX period reported in model (3) For instance the marginal effect for size declines
from 414 to 167 As in Table 8 there is an asymmetric decline across the different types of
connectedness Nonprofessional connectedness declines from 111 to 020 The economic effect
of professional connectedness declines from 159 to 060 It is also informative to compare the
economic effect of connections to those of firm size The economic effect of non-professional conshy
nectedness is about 25 of that of size in the pre-SOX period and about 21 in the post-SOX
period However the effect of professional connections is about 60 of that of size after SOX up
from about 40 of the size effect in the pre-SOX period The results for professional connections
are also interesting in view of the significant scrutiny regulations and discipline imposed on direcshy
tors after SOX While these could substitute for and render other effects redundant professional
28
connections continue to matter Finally CEO attributes also matter in Table 9 The significance
of the marginal effects of CEOMBA and CEOIVY suggest the importance of considering CEO
attributes in a broader discussion of fraud and perhaps board composition and effectiveness
56 Discussion
We consider the collective implications of our results and the additional tests described above The
main result is what while nonprofessional connections are positively related to fraud professional
connections lower the probability of fraud in all specifications The result on the bright side of
connections is new so the finding and its interpretation perhaps warrant more discussion
A candidate explanation for our results is that professional connections are proxies for director
ability Perhaps professional connections between CEOs and directors reflect the supply-side effects
of well regarded firms that spawn large numbers of directors We find evidence for this view Nevshy
ertheless professional connectedness remains significant even after including this control Directors
appointed after a CEO assumes office may be less assiduous monitors because they are beholden to
the CEO This variable has little effect on connections Thus the most conservative interpretation
of our results is that professional CEO-director connectedness pick up otherwise unobserved aspects
of board quality not reflected in other board attributes The finding that professional connections
can act as a positive quality attribute is new to the literature The finding suggests that armrsquos
length independence between boards and CEOs is perhaps just a good starting point for board
reforms Variation within independent directors that speaks to a directorrsquos professional knowledge
can also matter and matters more than independence per se in our models21
21A related question is whether professional connectedness reflects CEO ability Proxies for ability suggested in the literature such as the undergraduate institution or the overall rolodex do not alter the importance of professional connections which appear to contain orthogonal information
29
Next we turn to the role of fraud detection Our dependent variable is a compound probability
that of committing fraud pf and of detecting this committed fraud pd Thus our estimates must
be divided by the probability of fraud detection to arrive at the probability of committing fraud
Full econometric estimation with cross-sectional variables in both probabilities is attempted by
Li (2010) She finds that to a first order there is a pure scale effect with little cross-sectional
shift in coefficients In fact no cross-sectional variable is materially altered by modeling detection
but each probability is scaled up as the composite probability must be divided by the probability
of fraud detection to estimate committed fraud The true probabilities and the marginal effects
are likely even greater than what our estimates indicate It also seems economically implausible
that boards with professional connections may aid and abet fraud by helping CEOs hide fraud
and that this effect continues even after the stringent restrictions imposed after SOX or that
nonprofessional connections aid detection22 Finally there is no evidence that the SEC detection
technology depends on connectedness and that we are picking up this dependence This would
require that the SEC looks closer at firms with professional connected CEO-boards while looking
askance at firms in which the CEO and directors have nonprofessional connections We are unaware
of any evidence to this effect
To summarize CEO-director connections matter even after including an exhaustive set of varishy
ables used in the governance literature In particular professional connections appear to have a
beneficial effect in all specifications suggesting a bright side to this particular source of connecshy
tions It is unlikely that connections are a proxy for detection CEO ability director ability or CEO
influence over the board Thus at a minimum our results indicate that CEO-director connections
pick up an orthogonal dimension of governance that conventional variables do not and they do so
with asymmetric signs for connections that have professional and nonprofessional origins
22In fact the Enron case cited in the introduction suggests the opposite
30
6 Conclusion
The high profile cases of fraud at the end of the dot com era have led to one of the most sweeping
regulatory interventions into corporate America the 2002 Sarbanes Oxley Act (SOX) At the
center of the financial misconduct are the CEO and the firmrsquos board of directors who have fiduciary
responsibility towards shareholders Frauds seem to reflect a failure of this basic governance function
of boards perhaps because directors are compromised through their nexus to CEOs Thus breaking
the CEO-board nexus has been a key focus of regulators policy makers and institutional investors
We contribute new evidence to the debate by investigating the relation between fraud and a
broad vector of board attributes While we control for traditional board measures our focus is
on newer metrics based on CEO-director connectedness Using an extensive dataset on executive
biographies we find that the CEO-director connectedness matters and is at least as important as
ndash and typically more important than ndash board independence Perhaps more interestingly different
types of connections have different-signed effects Connections of non-business origins such as
those from common alma mater and non-business activities elevate fraud probability This is the
traditional agency viewpoint of connections However fraud probability is reliably lower when
CEOs and directors have professional connections originating in shared employment experiences
especially when the connected individuals serve as employees rather than as directors or director
and employee The result on the bright side of connections is new to the finance literature
We also examine several other attributes that could explain fraud Having an MBA degree
does not increase and sometimes significantly decreases fraud probability We find that fraud is
less likely when CEOs are internally hired educated at reputed schools when board members have
more external appointments or when they are drawn from prestigious ldquodirector factoryrdquo firms
The last result suggests that there is value in the training realized at firms that have historically
been a breeding ground for executive talent in corporate America
31
Our results reinforce the value of studying the ldquomultiplexrdquo of connections in social network analshy
ysis Connections with different institutional origins operate through different channels and have
different economic effects The possibility of different effects is worth stressing Sociologists and
social network researchers argue that any one type of network could have positive or negative effects
(see eg Coleman (1990) p 302 and Putnam (2000) chapter 22) Our point is that different types
of connections could result in different economic outcomes It is therefore not always appropriate to
sum the different types of connections to form a single aggregate connectedness index We do not
say that this practice is always incorrect When all types of connections contribute similarly (and
positively) eg in searching for merger targets summing up connections may be reasonable and
even desirable to gain statistical power However this practice may not be empirically appropriate
when different connections have different-signed effects on economic outcomes
Finally our study also informs a broader debate on board design The evidence suggests that the
commonly studied attributes of board effectiveness such as board size independence or financial
expertise can be enriched by incorporating broader metrics related to CEO-board connections
Our results certainly support the growing consensus that CEO-board connections deserve closer
scrutiny as part of the governance process However the mere existence of connectedness is not bad
Connections do not necessarily indicate unhealthy boards or governance systems in dysfunction
The genesis of the connections matters
The more general point emphasized by our results is that not all independent directors are
equal Thus independence is reasonable but only a useful first step Researching the heterogeneity
within independent directors is a profitable avenue for further investigation We regard our research
as one step in this direction
32
References
Adams R 2005 What do Boards do Evidence from Board Committee and Director Compensashy
tion Data Working Paper Stockholm School of Economics
Adams R and D Ferreira 2003 A Theory of Friendly Boards The Journal of Finance 62217ndash
250
Adams R B Hermalin and M Weisbach 2009 The Role of Board of Directors in Corporate
Governance A Conceptual Framework and Survey Working Paper Ohio University
Agrawal A and S Chadha 2005 Corporate Governance and Accounting Scandals Journal of
Law and Economics 48371ndash406
Ahmed A and S Duellman 2007 Accounting Conservatism and Board of Director Characterisshy
tics An Empirical Analysis Working Paper
Beasley M J Carcello D Hermanson and T Neal 2009 The Audit Committee Oversight
Process Contemporary Accounting Research 2665ndash122
Beasley M A 1996 An Empirical Analysis of the Relation between the Board of Director Comshy
position and Financial Statement Fraud Accounting Review 71433ndash465
Beneish M 1999 Incentives and penalties related to earnings overstatements that violate GAAP
Accounting Review 74425ndash457
Bergstresser D and T Philippon 2006 CEO Incentives and Earnings Management Journal of
Financial Economics 80
Bertrand M and A Schoar 2003 Managing with Style The Effect of Managers on Firm Policies
Quarterly Journal of Economics 118
33
Brickley J J Coles and J Linck 1999 What Happens To CEOs After They Retire New
Evidence on Career Concerns Horizon Problems and CEO Incentives Journal of Financial
Economics 52341ndash377
Bruynseels L and E Cardinaeles 2011 Audit Committees Management Watchdogs or Personal
Friend of the CEO Working Paper Tilburg University
Burns N and S Kedia 2006 The Impact of CEO Incentives on Misreporting Journal of Financial
Economics 7935ndash67
Cai Y and M Sevilir 2009 Board Connections and MampA Transactions Journal of Financial
Economics forthcoming
Cheng Q and T Warfield 2005 Equity Incentives and Earnings Management Accounting Review
80441ndash476
Chevalier J and G Ellison 1999 Are Some Mutual Fund Managers Better Than Others Cross-
Sectional Patterns in Behavior and Performance The Journal of Finance 54875ndash899
Chhaochharia V and Y Grinstein 2007 Corporate Governance and Firm Value The Impact of
the 2002 Governance Rules The Journal of Finance 621789ndash1825
Cohen L A Frazzini and C Malloy 2008 The Small World of Investing Board Connections
and Mutual Fund Returns Journal of Political Economy 116951ndash979
Cohen L A Frazzini and C Malloy 2010 Sell Side School Ties The Journal of Finance 651409ndash
1437
Coleman J S 1990 Foundations of Social Theory The Belknap Press of Harvard University
Cambridge MA
34
Coles J N Daniel and L Naveen 2007 Co-Opted Boards Costs Benefits Causes and Conseshy
quences Working Paper Arizona State University
Coles J and S Hoi 2003 New Evidence on the Market for Directors Board Membership and
Pennsylvania Senate Bill 1310 Journal of Finance 58197ndash230
Coles J and Z Li 2010 Managerial Attributes Incentives and Performance Working Paper
Arizona State University
Dahya J and J McConnell 2007 Board composition corporate performance and the Cadbury
Committee recommendation Journal of Financial and Quantitative Analysis 42535ndash564
Davis J E Fama and K French 2000 Characteristics Covariances and Average Returns 1929shy
1997 The Journal of Finance 55389ndash406
Dechow P R Sloan and A Sweeney 1995 Detecting Earnings Management Accounting Review
79193ndash225
Dechow P M R G Sloan and A P Sweeney 1996 Causes and Consequences of Earnings
Manipulation An Analysis of Firms Subject to Enforcement Actions by the SEC Contemporary
Accounting Research 131ndash37
Desai H C Hogan and M Wilkins 2006 The Reputational Penalty for Aggressive Accounting
Earnings Restatements and Management Turnover Accounting Review 8183ndash112
Easterbrook F and D R Fischel 1985 Optimal Damages in Securities Cases University of
Chicago Law Review 611639ndash640
Engelberg J P Gao and C Parsons 2009 The Value of a Rolodex CEO Pay and Personal
Networks Review of Financial Studies forthcoming
35
Erickson M M Hanlon and E Maydew 2006 Is There a Link Between Executive Equity Incenshy
tives and Accounting Fraud Journal of Accounting Research 44113ndash143
Ferris S M Jagannathan and A C Pritchard 2003 Too Busy to Mind The Business Monitoring
by Directors with Multiple Board Appointments The Journal of Finance 58 (3)1087ndash1111
Fich E and A Shivdasani 2007 Financial Fraud Director Reputation and Shareholder Wealth
Journal of Financial Economics 86306ndash336
Fischer C S 1982 What do we mean by friend An Inductive Study Social Networks 3287ndash306
Fracassi C and G Tate 2011 External Networking and Internal Firm Governance The Journal
of Finance 67153ndash194
Granovetter M 1985 Economic action and social structure The problem of embeddedness
American Journal of Sociology 91481ndash510
Granovetter M 2005 The Impact of social Structure on Economic Outcomes Journal of Economic
Perspectives 1933ndash50
Hennes K A Leone and B Miller 2008 The importance of distinguishing errors from irregularishy
ties in restatement research The case of restatements and CEOCFO turnover The Accounting
Review 881487ndash1519
Hermalin B and M Weisbach 2007 Transparency and Corporate Governance Working Paper
available at httpssrncomabstract=958628
Hochberg Y A Ljungqvist and Y Lu 2007 Whom You Know Matters Venture Capital Netshy
works and Investment Performance The Journal of Finance 62251ndash301
Hwang B and S Kim 2009 It Pays to have Friends Journal of Financial Economics 93138ndash158
36
Johnson S H Ryan and Y Tian 2009 Managerial Incentives and Corporate Fraud The Sources
of Incentives Matter Review of Finance 13115ndash145
Kaplan S and D Reishus 1990 Outside directorships and corporate performance Journal of
Financial Economics 27389ndash410
Karpoff J D S Lee and G Martin 2008a The Consequences to Managers of Financial Misrepshy
resentation Journal of Financial Economics 88193ndash215
Karpoff J D S Lee and G Martin 2008b The Cost to Firms of Cooking the Books Journal of
Financial and Quantitative Analysis 43581ndash612
Kedia S and T Philippon 2009 The Economics of Fraudulent Accounting Review of Financial
Studies 222169ndash2199
Klein A 2002 Audit Committee Board of Director Characteristics and Earnings Management
Journal of Accounting and Economics 33375ndash400
Lazarsfeld P and R Merton 1954 Friendship as a social process a substantive and methodshy
ological analysis Freedom and Control in Modern Society M Berger (ed) Van Nostrand New
York1866
Lennox C and J Pittman 2010 Big Five Audits and Accounting Fraud Contemporary Accountshy
ing Research 27209ndash247
Li S 2010 Corporate Financial Fraud An Application of Detection Controlled Estimation Wilshy
fred Laurier University Working Paper
Linck J J Netter and T Yang 2009 Effects and Unintended Consequences of Sarbanex-Oxley
Act on Boards Review of Financial Studies 223287ndash3328
37
Liu Y 2009 Employment Networks and the CEO Labor Market Working Paper University of
California Riverside SSRN httpssrncomabstract=1361776
Mace M 1971 Directors Myth and Reality Harvard Business School Press Boston
Marsden P 1987 Core Discussion Network of Americans American Sociological Review 52122ndash
313
McPherson M L Smith-Lovin and J Cook 2001 Birds of a Feather Homophily in Social
Networks Annual Review of Sociology 27415ndash444
Nguyen B 2008 Does the Rolodex Matter Corporate Elites Small World and the Effectiveness
of Boards of Directors Working Paper Judge Business School
Peng L and A Roell 2008 Executive Pay Earnings Manipulation and Shareholder Litigation
Review of Finance 12141ndash184
Plickert G R Ct and B Wellman 2007 Itrsquos Not Who You Know Itrsquos How You Know Them
Who Exchanges What With Whom Social Networks 29405ndash429
Povel P R Singh and A Winton 2007 Booms bust and fraud Review of Financial Studies
201219ndash1254
Putnam R 2000 Bowling Alone The collapse and revival of American community Simon and
Schuster New York
Raheja C 2005 Determinants of Board Size and Composition A Theory of Corporate Boards
Journal of Financial and Quantitative Analysis 40283306
Roberts M and T Whited 2011 Endogeneity in Empirical Corporate Finance Working Paper
University of Pennsylvania and University of Rochester
38
Rosen S 1983 Perceived Inadequacy and Help Seeking in New Directions in Helping Eds J
Fischer B DePaulo and A Nadler Academic Press New York
Saint-Charles J and P Mongeau 2009 Different Relationships for Coping with Ambiguity and
Uncertainty in Organizations Social Networks 31
Schmidt B 2009 Costs and Benefits of Friendly Boards during Mergers and Acquisitions Working
Paper Emory University
Schrand C and S Zechman 2011 Executive Overconfidence and the Slippery Slope to Financial
Misreporting Working Paper Wharton School Unversity of Pennsylvania
Srinivasan S 2005 Consequences of Financial Reporting Failure for Outside Directors Evidence
from Accounting Restatements and Audit Committee Members Journal of Accounting Research
43291ndash334
Subrahmanyam A 2008 Social Networks and Corporate Governance European Financial Manshy
agement 14633ndash662
Thakor A V J S Nielson and D A Gulley 2005 US Chamber Institute for Leshy
gal Reform The Economic Reality of Securities Class Action Litigation Working Paper
httpwwwinstituteforlegalreformcompdfs
Uzzi B 1996 The Sources and Consequences of Embeddedness for the Economic Performance of
Organizations The Network Effect American Sociological Review 61(4)674ndash698
Wang T 2008 Real Investment and Corporate Securities Fraud Working Paper University of
Minnesota
Westphal J 1999 Collaboration in the Boardroom Behavioral and Performance Consequences
of CEO-Board Social Ties The Academy of Management Journal 427ndash24
39
Westphal J and E Zajac 1995 Who Shall Govern CEOBoard Power Demographic Similarity
and New Director Selection Administrative Science Quarterly 4060ndash83
Yermack D 2004 Remuneration Retention and Reputation Incentives for Outside Directors
The Journal of Finance 592281ndash2308
Zawel M 2005 Untangling the Ivy League College Prowler
40
Table 1 Distribution of Fraud and Non Fraud Firms
Table 1 displays the distribution of firms in the fraud and the non-fraud sample over the period 2000-2006 Firms in the fraud sample are those that were subject to SEC enforcement actions for misreporting their financials Firms in the non-fraud sample consist of all other firms that have complete data on board of directors in BoardEx and coverage in CRSPCompustat
Year Fraud Non-Fraud Total Fraud not firms firms firms Firms
2000 1424 76 1500 507 2001 1739 102 1841 554 2002 1809 109 1918 568 2003 3443 104 3547 293 2004 4226 87 4313 202 2005 4514 55 4569 120 2006 4138 27 4165 065 Total 21293 560 21853 26
41
Table 2 Industry Distribution of Financial Fraud
Table 2 displays the distribution of firms in the fraud and non-fraud sample for the 48 Fama-French industries in the period from 2000-2006
Industry Industry Name
Non-Fraud Firms
Fraud Frims
Fraud Firms
1 Agriculture 37 11 229 2 Food products 260 17 61 3 Soda 36 0 00 4 Beer 61 0 00 5 Smoke 32 0 00 6 Toys amp Recreation 114 5 42 7 Fun Entertainment 261 2 08 8 Printing amp Publishing 97 6 30 9 Household Consumer Goods 255 3 12 10 Clothes Apparel 266 1 04 11 Healthcare 353 1 30 12 Medical equipment 670 2 03 13 Pharmaceutical Products 1301 20 15 14 Chemicals 382 6 15 15 Rubber amp Plastic Products 113 4 34 16 Textiles 39 0 00 17 Construction Material 294 2 07 18 Construction 246 14 54 19 Steel works etc 236 0 00 20 Fabricated Products 41 0 00 21 Machinery 571 40 65 22 Electrical Equipment 285 4 14 23 Automobiles and Trucks 262 15 54 24 Aircraft 106 5 45 25 Shipbuilding amp Railroad Equip 47 6 113 26 Defense 38 0 00 27 Precious Metals 32 0 00 28 Non Metallic amp Metal mining 57 0 00 29 Coal 60 0 00 30 Petroleum and Natural gas 722 14 19 31 Utilities 637 21 32 32 Communication 574 17 29 33 Personal Services 226 5 22 34 Business Services 2387 73 30 35 Computer Hardware 760 50 62 36 Computer Software 1298 52 39 37 Electronic Equipment 460 11 23 38 Measuring amp Control Equip 229 4 17 39 Business Supplies 64 0 00 40 Shipping Containers 482 13 26 41 Transportation 621 25 39 42 Wholesale 1011 27 26 43 Retail 323 5 15 44 Rest Hotels amp Motels 2584 21 08 45 Banking 760 27 34 46 Insurance 108 5 44 47 Real Estate 1292 16 12 48 Trading 103 0 00
Total 21293 560 26
42
Table 3 Descriptive Statistics
Table 3 displays summary statistics for explanatory variables for firms in the fraud and non-fraud samples from fiscal
2000 to fiscal 2006 PROF FRAC denotes the number of supervisory directors who worked together professionally at
a firm prior to the CEOrsquos current assignment NON PROF FRAC denotes the number of directors who either share
a common undergraduate alma mater or who share service in a nonprofessional capacity with the CEO EDU FRAC
denotes the number of supervisory directors who attended the same undergraduate school as the CEO OTH FRAC
is the number of directors that share nonprofessional service with the CEO All connection variables are scaled by
the number of directors in the firmrsquos board SIZE denotes the book value of assets TOBINQ is market value to book
value EBITDA is earnings before interest taxes and depreciation scaled by total assets ISSUANCE equals 1 if the
firm issues equity or debt in the fiscal year and zero otherwise BSIZE board size is the number of directors and
INDEP FRAC is the percentage of outside directors on the board BUSY is the average number of other directorships
held by directors FINEXP equals 1 if the board has a designated financial expert and zero otherwise CEOMBA
equals 1 if the CEO has an MBA and zero otherwise CEOIVY equals 1 if the CEOrsquos undergraduate degree is from
a prestigious school as defined in Zawel (2005) and zero otherwise The table presents the mean and median for each
sample the t-statistic for the difference in the mean and the Wilcoxon-z statistic for the difference in the median
The superscripts c b and a indicate significance at the 10 5 and 1 levels respectively using robust standard
errors
Variable Non-Fraud Fraud t-statistic Wilcoxon z Professional Connections PROF FRAC 1361 000 844 000 5342a 2817a
Education and Other Connections NONPROF FRAC 739 00 1085 00 -642a -595a
EDU FRAC 111 000 137 00 -1360 -1507 OTH FRAC 632 000 952 00 -654a -568a
Firm Characteristics SIZE 6607 658 39991 2213 -1534a -1435a
TOBINQ 2113 1492 2169 1424 -0659 1180 EBITDA 623 932 87 944 -2402a -1706lowast
LEVERAGE 2221 1705 253 2254 -2956a -4299a
ISSUANCE 097 099 -3396a
CEO and Board characteristics BSIZE 858 800 939 900 -6849a -6349a
INDEP FRAC 7956 8333 7973 8333 -0339 -0176 BUSY 143 100 160 10 -4926a -5030a
FINEXP 293 178 -5629a
CEOMBA 227 264 0490 0498 CEOIVY 2522 2748 1473 1470
43
Table 4 Base Model For Financial Misconduct
Table 4 displays estimates of logit models The dependent variable is 1 if the firm engages in fraud in the fiscal year
and is zero otherwise The data are from 2000 to 2006 LSIZE is the logarithm of the book value of assets TOBINQ
is the ratio of firm market value to book value EBITDA is earnings before interest taxes and depreciation scaled
by total assets ISSUANCE equals 1 if the firm issues equity or debt in the fiscal year and zero otherwise BSIZE
is the number of total directors on the board INDEP FRAC is the percentage of outside directors on the board
BUSY is the average number of other directorships held by directors FINEXP is a dummy which is equal to 1 if the
board has a designated financial expert CEOMBA equals 1 if the CEO has an MBA and zero otherwise CEOIVY
equals 1 if the CEOrsquos undergraduate degree is from a prestigious school as defined in Zawel (2005) and zero otherwise
Coefficients for time and industry fixed effects are not shown The superscripts c b and a indicate significance at
the 10 5 and 1 levels respectively using robust standard errors
Model 1 Model 2 Model 3 LSIZE 0414a 0405a 0471a
(14436) (13641) (14509) TOBINQ 0055lowastlowast 005b 0037
(2384) (2184) (1382) EBITDA -0700a -0807a -0714a
(3434) (3767) (2825) LEVERAGE -0263 -0266 0018
(1439) (1469) (0105) ISSUANCE 1138b 1094b 1051lowastlowast
(2241) (2164) (2067) BSIZE -0013 -003 -0015
(0598) (1402) (0676) INDEP FRAC -1028a -0451 -0938b
(2948) (1224) (2417) BUSY -0088c -0125b -0143a
(1725) (2432) (271) FINEXP -0253 0033 0058
(2815)a (0318) (0539) INTERCEPT -6263a -6076a -3553a
(11456) (10831) (5424) Year Fixed Effects No Yes Yes Industry Fixed Effects No No Yes Observations 18503 18503 17712 Pseudo-R2 0068 0099 0149
44
Table 5 Financial Misconduct and CEO-Director Nonprofessional Connectedness
Table 5 displays estimates of logit models The dependent variable is 1 if the firm engages in fraud in the fiscal year
and is zero otherwise The data are from 2000 to 2006 LSIZE is the logarithm of the book value of assets TOBINQ
is the ratio of firm market value to book value EBITDA is earnings before interest taxes and depreciation scaled
by total assets ISSUANCE equals 1 if the firm issues equity or debt in the fiscal year and zero otherwise BSIZE
is the number of total directors on the board INDEP FRAC is the percentage of outside directors on the board
BUSY is the average number of other directorships held by directors FINEXP is a dummy which is equal to 1 if the
board has a designated financial expert CEOMBA equals 1 if the CEO has an MBA and zero otherwise CEOIVY
equals 1 if the CEOrsquos undergraduate degree is from a prestigious school as defined in Zawel (2005) and zero otherwise
EDU FRAC denotes the number of supervisory directors who attended the same undergraduate school as the CEO
The variable OTH FRAC is the number of supervisory directors that share nonprofessional service with the CEO
and NONPROF FRAC denotes the number of supervisory directors who either share a common undergraduate alma
mater or who share service in a nonprofessional capacity with the CEO All connectedness variables are scaled by c b aboard size Coefficients for time and industry fixed effects are not shown The superscripts and indicate
significance at the 10 5 and 1 levels respectively using robust standard errors
Model 1 Model 2 Model 3 LSIZE 0474a 0476a 0473a
(142) (14215) (14188) TOBINQ 0041 004 0041
(1553) (1527) (153) EBITDA -0705a -0693a -0697a
(2705) (2631) (2662) LEVERAGE 0012 0016 0016
(0069) (0088) (0089) ISSUANCE 102b 1016b 102b
(2011) (2013) (2017) BSIZE -0017 -0017 -0018
(0779) (0755) (0787) INDEP FRAC -1013 -102 -1022
(2518)b (2529)b (2539)b
BUSY -0142a -0141a -0144a
(2643) (2622) (2677) FINEXP 0061 0063 0062
(0563) (0583) (0572) OTH FRAC 0756b 0706b
(2108) (1961) EDU FRAC 1636
(1554) NONPROF FRAC 0839
(2515)b
CEOMBA -0165 -0162 -0163 (1567) (1539) (1554)
CEOIVY -0272b -0288a -0281a
(-2593) (-2732) (268) INTERCEPT -3328a -3373a -3331a
(5111) (5177) (5124) Year Fixed Effects Yes Yes Yes Industry Fixed Effects Yes Yes Yes Observations 17363 17363 17363 Pseudo-R2 0152 0153 0153
45
Table 6 Financial Misconduct and CEO-Director Professional Connectedness
Table 6 displays estimates of logit models The dependent variable is 1 if the firm engages in fraud in the fiscal
year and is zero otherwise The data are from 2000 to 2006 LSIZE is the logarithm of the book value of assets
TOBINQ is the ratio of firm market value to book value EBITDA is earnings before interest taxes and depreciation
scaled by total assets ISSUANCE equals 1 if the firm issues equity or debt in the fiscal year and zero otherwise
BSIZE is the number of total directors on the board INDEP FRAC is the percentage of outside directors on the
board BUSY is the average number of other directorships held by directors FINEXP is a dummy which is equal
to 1 if the board has a designated financial expert CEOINTERNAL equals 1 if the CEO is internally hired and
zero otherwise CEOMBA equals 1 if the CEO has an MBA and zero otherwise CEOIVY equals 1 if the CEOrsquos
undergraduate degree is from a prestigious school as defined in Zawel (2005) and zero otherwise NONPROF FRAC
denotes the number of supervisory directors who either share a common undergraduate alma mater or who share
service in a nonprofessional capacity with the CEO PROF FRAC denotes the number of supervisory directors who
worked together professionally at a firm prior to the CEOrsquos current assignment All connectedness variables are scaled
by board size Coefficients for time and industry fixed effects are not shownThe superscripts c b and a indicate
significance at the 10 5 and 1 levels respectively using robust standard errors
Model 1 Model 2 LSIZE 0473a 0487a
(14524) (14399) TOBINQ 0034 0039
(1248) (1483) EBITDA -0757a -0722a
(3002) (2683) LEVERAGE 0018 003
(01) (0164) ISSUANCE 1034b 0995b
(2035) (1973) BSIZE -0019 -0016
(084) (072) INDEP FRAC -0804b -0879b
(2061) (2185) BUSY -0098c -0104b
(1885) (1969) FINEXP 0066 0072
(0612) (0669) CEOINTERNAL -0362a
(3633) CEOMBA -0172
(1618) CEOIVY -0287a
(272) NONPROF FRAC 0993a
(2932) PROF FRAC -1149a -1443a
(4126) (506) INTERCEPT -3606a -3418a
(5471) (5162) Year Fixed Effects Yes Yes Industry Fixed Effects Yes Yes Observations 17708 17363 Pseudo-R2 0152 0159
46
47
Tab
le 7
R
obus
tnes
s of
Pro
fess
iona
l C
onne
cted
ness
Table
7 d
ispla
ys
esti
mate
s of lo
git
model
s T
he
dep
enden
t va
riable
is
1 if th
efirm
engages
in
fra
ud
in
the
fisc
al yea
r and
is
zero
oth
erw
ise
The
data
are
fro
m 2
000
to
2006
Contr
ol va
riable
s th
at
are
incl
uded
but
whose
coeffi
cien
ts a
re s
uppre
ssed
incl
ude
LSIZ
E T
OB
INQ
E
BIT
DA
LE
VE
RA
GE
IS
SU
AN
CE
B
SIZ
E FR
AC
IN
DE
P
BU
SY
and
FII
NE
XP C
EO
INT
ER
NA
L e
quals
1 if th
e C
EO
is
inte
rnally
hir
ed a
nd
zer
o o
ther
wis
e C
EO
MB
A e
quals
1 if th
e C
EO
has
an
MB
A a
nd
zer
o o
ther
wis
e
CE
OIV
Y e
quals
1 i
f th
e C
EO
rsquos u
nder
gra
duate
deg
ree
is f
rom
a p
rest
igio
us
school
as
defi
ned
in
Zaw
el (
2005)
and
zer
o o
ther
wis
e
NO
NP
RO
F F
RA
C d
enote
s th
e
num
ber
of su
per
vis
ory
dir
ecto
rs w
ho
eit
her
share
a c
om
mon
under
gra
duate
alm
a m
ate
r or
who
share
ser
vic
e in
a n
onpro
fess
ional ca
paci
ty w
ith
the
CE
O P
RO
F F
RA
C
den
ote
s th
e num
ber
of su
per
vis
ory
dir
ecto
rs w
ho
work
ed t
oget
her
pro
fess
ionally
at
afirm
pri
or
to t
he
CE
Orsquos
curr
ent
ass
ignm
ent
PR
OF
FR
AC
E d
enote
s th
e sa
me
quanti
ty b
ut
wher
e th
e pri
or
emplo
ym
ent
is s
uch
that
both
the
CE
O a
nd
the
dir
ecto
r w
ere
emplo
yed
as
exec
uti
ves
P
RO
F F
RA
C D
den
ote
s th
ese
connec
tions
der
ived
fro
m c
om
mon
dir
ecto
rship
s at
the
sam
e board
C
EO
FA
CT
ORY
and
FR
AC
FA
CT
OR
IES
den
ote
a C
EO
or
the
fract
ion
of
a b
oard
form
erly
em
plo
yed
by
one
of
the
top
10
of
supplier
s of
dir
ecto
rs
resp
ecti
vel
y
AFT
ER
CE
O F
RA
C d
enote
s th
e pro
port
ion
of
dir
ecto
rs a
ppoin
ted
aft
er t
he
CE
O a
ssum
es o
ffice
and
AFT
ER
CE
O F
RA
C N
ON
PR
OF
den
ote
s th
e su
bse
t of su
ch d
irec
tors
wit
h a
pri
or
nonpro
fess
ional ov
erla
p w
ith
the
CE
O A
ll c
onnec
tednes
s va
riable
s are
sca
led
by
board
siz
e M
odel
5 is
a d
irec
tor-
level
spec
ifica
tion
wit
h d
irec
tor
fixed
effec
ts
Coeffi
cien
ts f
or
tim
e and
indust
ryfixed
effec
ts a
re n
ot
show
n
The
super
scri
pts
c
b
and
a in
dic
ate
sig
nifi
cance
at
the
10
5
and
1
lev
els
res
pec
tivel
y u
sing
robust
sta
ndard
err
ors
Mod
el 1
M
odel
2
Mod
el 3
M
odel
4
Mod
el 5
C
EO
INT
ER
NA
L
-03
35a
-0
358
a
-03
54a
-0
356
a
-01
650b
(33
3)
(35
8)
(35
3)
(35
5)
(-2
37)
CE
OM
BA
-0
154
-0
149
-0
148
-0
146
-0
102
5 (1
46)
(1
39)
(1
37)
(1
35)
(-
134
) C
EO
IVY
-0
305
a
-02
8a
-02
82a
-0
282
a
-01
84b
(28
9)
(26
6)
(26
6)
(26
6)
(-2
37)
NO
NP
RO
F F
RA
C
091
4a
108
2a
107
4a
119
8a
105
97a
(27
0)
(32
1)
(31
7)
(43
5)
PR
OF
FR
AC
-1
439
a
-14
33a
-1
439
a
-12
89a
(-5
06)
(-5
04)
(-5
06)
(-5
29)
FR
AC
FA
CT
OR
IES
-08
41a
-0
844
a
-08
44a
-1
430
7a
(-3
53)
(-3
55)
(-3
55)
(-6
26)
PR
OF
FR
AC
E
-30
75a
(35
89)
PR
OF
FR
AC
D
019
8(0
20)
C
EO
FAC
TO
RY
0
007
000
8 0
008
(02
3)
(02
6)
(02
7)
AFT
ER
CE
O F
RA
C
005
6 0
071
(03
4)
(04
3)
AFT
ER
CE
O F
RA
C N
ON
PR
OF
-0
761
(07
2)
Yea
r Fix
ed E
ffect
s Y
es
Yes
Y
es
Yes
Y
es
Indu
stry
Fix
ed E
ff ect
s Y
es
Yes
Y
es
Yes
Y
es
O
bser
vati
ons
173
63
173
63
173
63
173
63
138
42
Pse
udo-
R2
0
157
016
1 0
161
016
1 0
290
Table 8 Compensation Subsample and SOX
Table 8 displays results of Logit estimations where the dependent variable is a dummy that takes the value one when
the firm engages in fraud The data are from 2000 to 2006 LSIZE is the log of total assets TOBINQ is the ratio
of firm market value to its book value EBITDA is scaled by Total Assets ISSUANCE is a dummy variable if the
firm issues equity or debt in the fiscal year BSIZE is the number of total directors on the board INDEP FRAC
is the percentage of outside directors on the board BUSY is the average number of other directorships held by
directors FINEXP is a dummy which is equal to 1 if the board has a designated financial expert NONCASH is the
percentage of non-cash compensation in the pay packages of the firmrsquos executive team as reported in the ExecuComp
database CEOMBA is a dummy variable that equals one when the CEO has an MBA degree CEOIVY area is
a dummy variable that equals one if the CEO has an Ivy League undergraduate CEOINTERNAL equals 1 if the
CEO is internally hired and zero otherwise NONPROF FRAC is the fraction of the board that have nonprofessional
ie education or other social connections with the CEO and PROF FRAC is the fraction of the board that has
employment connections with the CEO Time and Industry fixed effects not shown for brevity The superscripts c b and a indicate significance at the 10 5 and 1 levels respectively using robust standard errors
Full Sample Pre-SOX Post-SOX LSIZE 0464a 0631a 0311a
(916) (8073) (4609) TOBINQ -0055 -0087 0066
(1279) (123) (0925) EBITDA -1377a -2912a -1195a
(3175) (2909) (2658) LEVERAGE 0592c 0759a 0622
(1849) (2145) (1375) ISSUANCE 0541 0227 0842
(0984) (0362) (0849) BSIZE -0029 -0052 000
(0988) (1356) (001) INDEP FRAC -1462a -1434a -1238
(2656) (2061) (1244) BUSY -0098 -013 -0047
(1555) (1532) (0456) FINEXP 0066 -0033 027
(0493) (0178) (1166) NONCASH 072b 0178 1399a
(2518) (0505) (3048) CEOMBA -0327b -0134 -0563a
(2456) (0736) (2738) CEOIVY -0493a -0709a -031
(3666) (3734) (1582) CEOINTERNAL -0417a -0502a -0356a
(3372) (2943) (1931) NONPROF FRAC 1435a 1952a 0954
(3726) (3757) (1546) PROF FRAC -1826a -2122a -1765a
(5167) (4171) (35) INTERCEPT -1731b -2376 -3559
(2012) (2148) (2551) Year Fixed Effects Yes Yes Yes Industry Fixed Effects Yes Yes Yes Observations 7595 2545 4682 Pseudo-R2 0165 0188 0146
48
Table 9 Marginal Effects
Table 9 displays marginal effects of logit estimates The dependent variable is 1 if the firm engages in fraud in the
fiscal year and is zero otherwise The full sample is from 2000-2006 and the pre-SOX and post-SOX periods cover
subperiods until 2000 and after 2003 respectively LSIZE is the logarithm of the book value of assets TOBINQ
is the ratio of firm market value to book value EBITDA is earnings before interest taxes and depreciation scaled
by total assets ISSUANCE equals 1 if the firm issues equity or debt in the fiscal year and zero otherwise BSIZE
is the number of total directors on the board INDEP FRAC is the percentage of outside directors on the board
BUSY is the average number of other directorships held by directors FINEXP is a dummy which is equal to 1 if the
board has a designated financial expert CEOINTERNAL equals 1 if the CEO is internally hired and zero otherwise
CEOMBA equals 1 if the CEO has an MBA and zero otherwise CEOIVY equals 1 if the CEOrsquos undergraduate
degree is from a prestigious school as defined in Zawel (2005) and zero otherwise NONPROF FRAC denotes the
number of supervisory directors who either share a common undergraduate alma mater or who share service in
a nonprofessional capacity with the CEO PROF FRAC denotes the number of supervisory directors who worked
together professionally at a firm prior to the CEOrsquos current assignment All connectedness variables are scaled by
board size NONCASH is equity compensation to total compensation for the top 5 executive officers Coefficients for
time and industry fixed effects are not shown Superscripts c b and a indicate significance at the 10 5 and 1
levels respectively using robust standard errors
Full Sample Pre-SOX Post-SOX LSIZE 193a 416a 104a
(952) (880) (508) TOBINQ -015 -054 013
(-106) (-126) (-074) EBITDA -048a -114a -034a
(-470) (-289) (-333) LEVERAGE 018 057c 000
(128) (178) (-002) ISSUANCE 095 073 097
(116) (036) (111) BSIZE -017 -059 000
(-091) (-132) (000) INDEP FRAC -035b -064b -018
(-244) (-198) (-098) BUSY -021 -050 -006
(-152) (-152) (-039) FINEXP 017 -011 048
(053) (-015) (133) NONCASH 056b 014 093a
(234) (040) (295) CEOMBA -072a -050 -092a
(-254) (-074) (-292) CEOIVY -105a -243a -049
(-401) (-415) (-156) INTERNAL -096a -188a 062c
(-332) (-292) (-186) NONPROF FRAC 047a 111a 022
(368) (361) (146) PROF FRAC -081a -159a -060a
(-493) (-394) (-334) Year Fixed Effects Yes Yes Yes Industry Fixed Effects Yes Yes Yes Observations 7595 2545 4682
49
5
directors use knowledge of the CEO in work interactions to decide what boards they will join
While it is possible that professional connections can act as a source of personal friendships and
result in more lax monitoring this is clearly not the dominant effect in the data
We assess a more mechanical explanation for the effects of professional connectedness Specifishy
cally we test the hypothesis that the professional connectedness effect is really the effect of whether
the CEO is internally or externally sourced CEOs who build their career within a firm may have
few outside professional connections Thus the lower propensity to commit fraud of professionshy
ally connected CEOs could manifest the greater likelihood of fraud committed by internally hired
CEOs We find that internally hired CEOs are in fact less likely to commit fraud Furthermore the
coefficient for professional connections remains significant even after including a dummy variable
for internal hires CEOINTERNAL
Specification (2) in Table 6 examines whether the effect of professional connectedness of the
CEOs and directors is diluted when we add the nonprofessional connectedness between the CEOs
and directors Nonprofessional connectedness has little effect on the coefficients for professional
connections It is also worth stressing that the signs and significance of the different forms of
connectedness remain consistent across specification and do not rely on a particular configuration
of explanatory variables The basic result appears to be a robust feature of the full sample
More Tests
As discussed in Section 1 the main endogeneity issue that arises in our study is whether connectshy
edness picks up an unspecified attribute that is omitted from our main specifications To address
this issue we consider several additional specifications as well as additional variables whose effects
may be picked up by connectedness We also consider the possibility that CEOs with intent to
22
commit malfeasance endogenously coopt pliant directors and the variation introduced by the 2002
Sarbanes-Oxley Act The last section offers an overall perspective of the findings
51 Strength of Professional Connectedness
Our basic proxy for the strength of the connections exploits the nature of the past professional
overlap between CEOs and directors To further assess the economic meaning of the variable
we consider additional variation that plausibly reflects the type and intensity of the interaction
between the CEO and the director in their past job17
We classify the professional connections as being formed when the CEO and directors were
executives or into connections formed when the pair served as directors at another firm (or one was a
director while the other was an executive) Interactions between individuals employed as executives
at the same firm are likely to be more substantive These likely involve more frequent discussions
on substance and under environments varying in the levels and nature of the professional issues
facing firms This type of involvement is likely to lead to a greater understanding of an executiversquos
knowledge and style of functioning In contrast directors at the same firm tend to meet less
frequently and the interactions are likely to be at the same depth Thus the effects of professional
connection are likely to be the most pronounced when it is derived through common service as
executives of the same team Model (1) of Table 7 supports this view Connections formed at
the executive level (PROF FRAC E) have a significant negative effect on misconduct while those
formed through shared directorships are insignificant
17We considered overlaps without conditioning on dates of overlap These represent less than 2 of the professional connections sample 98 of CEO-director professional connections display overlap in firm and time
23
52 Director Quality and Director Heterogeneity
We next consider the possibility that professional connections are a proxy for director quality For
instance firms such as General Electric Pepsico Procter and Gamble and IBM serve as breeding
grounds for high quality business professional (see eg ldquoBreeding Grounds for New CEOsrdquo in
BusinessWeek April 30 2009) Professional connections are perhaps more likely when executives
have prior work experience at these firms Thus connections may be picking up the effects of
executives trained at these ldquodirectorrdquo factories We identify firms as ldquodirector factoriesrdquo if the
number of executives with employment histories in these firms are among the top 10 of all firms
These firms include IBM GE consulting firms such as Ernst and Young Andersen and McKinsey
as well as financial firms such as Goldman Sachs
We include as an independent variable the fraction of directors that are from these director
factories To control for CEOs who also originate from one of the director factories we also include
a dummy for whether the CEO is from a director factory Model (2) in Table 7 reports the
results We find that greater the fraction of directors from director factories the smaller is the
likelihood of fraud The CEOrsquos being from a director factory is not significant possibly because we
already control for CEO ability More interestingly the effect of professional connections remains
significant Thus professional connections in all forms attenuate fraud probability regardless of
ndash or more precisely in addition to ndash the professional origins of the directors We also examine
whether the connections formed between the CEO and directors at ldquodirector factoriesrdquo are special
These connections have a negative but insignificant coefficients so the the benefit of professional
connections is not exclusive to connections formed at director factories18
18Following Engelberg Gao and Parsons (2009) we examine if the CEOrsquos rolodex or the overall connectedness of the CEO subsumes the CEO-board professional and nonprofessional connections Our main results are robust to measures of aggregate connectedness including centrality and eigenvector centrality
24
We also consider director fixed effects to control for unobserved director heterogeneity Identishy
fication relies on variation in fraud propensity across subsamples of firms in which directors hold
multiple appointments some with and some without connections Thus the sample of usable firms
shrinks and we likely lose power Nevertheless specification (5) in Table 7 shows that professional
connections lower fraud This result is not likely to be driven by unobserved director heterogeneity
We next consider the possibility that pliable directors are set in place by a CEO who already
has intent to commit fraud These directors may be lax monitors as they are obligated to the CEO
for their appointment An interesting proxy for co-option is suggested by the board literature
Following Yermack (2004) and Coles Daniel and Naveen (2007) we proxy captured directors as
the fraction of the board appointed after the current CEO assumes office As seen in model (3) of
Table 7 AFTER CEO FRAC is not significant Nor does it alter the coefficients for professional
connections As a further refinement of this test we also estimate the fraction of the board of
directors who are appointed after the CEO takes office and have nonprofessional connections
Model (4) includes this additional variable The variable is not significant and it does not affect
the other coefficients in any material way
53 Compensation
Existing literature finds that the structure of executive compensation significantly affects the
propensity for financial misconduct In particular Bergstresser and Philippon (2006) Burns and
Kedia (2006) Cheng and Warfield (2005) and Erickson Hanlon and Maydew (2006) examine the
effect of equity incentives on discretionary accruals and restatements We obtain equity incentive
data from the EXECUCOMP database Perhaps the biggest issue that arises with this subsample
is the reduction in sample size by more than 50 to 7595 observations Additionally the sample
25
is concentrated among larger firms that comprise the EXECUCOMP database We conduct tests
in this subsample to assess the robustness of our results
Specification (1) in Table 8 presents the logit estimates for the full logit specification reported
in Table 6 plus non-cash compensation variable Following Karpoff Lee and Martin(2008b) non-
cash compensation is the ratio of the compensation paid through non-cash means (ie excluding
salary and bonus) to the total direct compensation (TDC1 in ExecuComp) We find that non-
cash compensation is positively associated with fraud The key connectedness variables remain
significant in the compensation subsample Professional connectedness mitigates fraud while nonshy
professional CEO-director connections are positively related to fraud Both measures matter as
much as conventional measures of independence19
Most other variables are not materially altered by the restriction to the compensation subsample
or by the inclusion of the compensation variable For instance we find that board independence is
associated with lower fraud probability CEOs attending prestigious undergraduate programs and
those with an MBA degree are less likely to be associated with fraud as are internally hired CEOs
The number of outside directorships held loses significance in this sample perhaps due to the lack
of variation when the sample is constrained to include only the larger firms with ExecuComp data
In any event controlling for compensation does not materially affect our main inferences about
CEO-director connections or the asymmetry between professional and nonprofessional connections
54 SOX
Our sample period 2000 to 2006 spans the passage of the Sarbanes Oxley Act in 2002 The Act
aimed to put distance between CEOs and boards by tilting boards towards (economically) indepenshy
dent directors and diminishing executive roles in key aspects of board functioning These measures
19Other specifications of the compensation variable do not alter these conclusions
26
coupled with intense public scrutiny increased the pressure on boards to act independently While
captured directors might have felt comfortable asking few questions of a CEO prior to 2002 the
passage of SOX may make such support less forthcoming If so the positive relation between nonshy
professional connectedness and fraud could weaken after 2002 A more armrsquos length regime could
also create greater distance between the professionally connected directors and the CEO If such
connections have beneficial effects in lowering fraud they should be less affected by SOX
To test for the SOX effects we examine the effect of connections both nonprofessional and
professional on the propensity of misconduct before and after the passage of SOX We estimate
logit models separately for the pre-SOX period defined as years 2000-2002 and the post-SOX period
defined as years 2003-2006 Specification (2) and (3) of Table 8 present the logit estimates for the
pre-SOX and the post-SOX period respectively As before both forms of connectedness matter in
the pre-SOX period but not in the post-SOX period The coefficient for non-professional connections
declines by 50 in the post-SOX period and it is not significant compared to a 17 decline for
the professional connections coefficient which remains significant Thus while SOX does distance
CEOs from boards it does not eliminate the beneficial effects of professional connectedness20
55 Marginal Effects
In this section we examine the logit marginal effects Table 9 reports the marginal effect estimates
and significance for the logit estimates reported in Table 8 For discrete variables such as CEOMBA
or CEOIVY the marginal effects show the effect on logit probability of changing the variable from
zero to one and for continuous variables we report the effect of a one standard deviation change
To put the marginal effects in perspective the overall probability of fraud in the Table 9 sample is
20Boardex increases data coverage over this period so there are several new firms in the post SOX period A proper examination of the effect of SOX requires us to observe the firm both before and after the passage of SOX As BoardEx coverage of large firms ie those covered in ExecuComp is steady over this period we report the SOX results for the ExecuComp sample The results are materially unchanged if we use the full sample
27
394 While fraud attracts significant attention from regulators and policy makers and has resulted
in some of the most expansive intervention into corporative governance of public corporations it
is a relatively rare event
As in prior work firm size has the largest marginal effect Model (1) shows that it has a (one
standard deviation) marginal effect of 193 Of the remaining variables professional connectedness
is the most significant with a (one standard deviation) marginal effect of -081 Perhaps the more
interesting comparison is between professional connections and board independence which has
been a major focus of received regulations Board independence has a marginal effect of -035
so professional connections have roughly twice the marginal effect of independence in attenuating
fraud Nonprofessional connections also matter and model (1) suggests that these marginal effects
also exceed that of board independence in the full sample A similar ranking emerges for the pre-
SOX estimates reported in model (2) In sum social connections matter at least as much as and
perhaps more than board independence in explaining fraud
The marginal effects for all variables decline after SOX consistent with the lower fraud probabilshy
ity in the post-SOX period reported in model (3) For instance the marginal effect for size declines
from 414 to 167 As in Table 8 there is an asymmetric decline across the different types of
connectedness Nonprofessional connectedness declines from 111 to 020 The economic effect
of professional connectedness declines from 159 to 060 It is also informative to compare the
economic effect of connections to those of firm size The economic effect of non-professional conshy
nectedness is about 25 of that of size in the pre-SOX period and about 21 in the post-SOX
period However the effect of professional connections is about 60 of that of size after SOX up
from about 40 of the size effect in the pre-SOX period The results for professional connections
are also interesting in view of the significant scrutiny regulations and discipline imposed on direcshy
tors after SOX While these could substitute for and render other effects redundant professional
28
connections continue to matter Finally CEO attributes also matter in Table 9 The significance
of the marginal effects of CEOMBA and CEOIVY suggest the importance of considering CEO
attributes in a broader discussion of fraud and perhaps board composition and effectiveness
56 Discussion
We consider the collective implications of our results and the additional tests described above The
main result is what while nonprofessional connections are positively related to fraud professional
connections lower the probability of fraud in all specifications The result on the bright side of
connections is new so the finding and its interpretation perhaps warrant more discussion
A candidate explanation for our results is that professional connections are proxies for director
ability Perhaps professional connections between CEOs and directors reflect the supply-side effects
of well regarded firms that spawn large numbers of directors We find evidence for this view Nevshy
ertheless professional connectedness remains significant even after including this control Directors
appointed after a CEO assumes office may be less assiduous monitors because they are beholden to
the CEO This variable has little effect on connections Thus the most conservative interpretation
of our results is that professional CEO-director connectedness pick up otherwise unobserved aspects
of board quality not reflected in other board attributes The finding that professional connections
can act as a positive quality attribute is new to the literature The finding suggests that armrsquos
length independence between boards and CEOs is perhaps just a good starting point for board
reforms Variation within independent directors that speaks to a directorrsquos professional knowledge
can also matter and matters more than independence per se in our models21
21A related question is whether professional connectedness reflects CEO ability Proxies for ability suggested in the literature such as the undergraduate institution or the overall rolodex do not alter the importance of professional connections which appear to contain orthogonal information
29
Next we turn to the role of fraud detection Our dependent variable is a compound probability
that of committing fraud pf and of detecting this committed fraud pd Thus our estimates must
be divided by the probability of fraud detection to arrive at the probability of committing fraud
Full econometric estimation with cross-sectional variables in both probabilities is attempted by
Li (2010) She finds that to a first order there is a pure scale effect with little cross-sectional
shift in coefficients In fact no cross-sectional variable is materially altered by modeling detection
but each probability is scaled up as the composite probability must be divided by the probability
of fraud detection to estimate committed fraud The true probabilities and the marginal effects
are likely even greater than what our estimates indicate It also seems economically implausible
that boards with professional connections may aid and abet fraud by helping CEOs hide fraud
and that this effect continues even after the stringent restrictions imposed after SOX or that
nonprofessional connections aid detection22 Finally there is no evidence that the SEC detection
technology depends on connectedness and that we are picking up this dependence This would
require that the SEC looks closer at firms with professional connected CEO-boards while looking
askance at firms in which the CEO and directors have nonprofessional connections We are unaware
of any evidence to this effect
To summarize CEO-director connections matter even after including an exhaustive set of varishy
ables used in the governance literature In particular professional connections appear to have a
beneficial effect in all specifications suggesting a bright side to this particular source of connecshy
tions It is unlikely that connections are a proxy for detection CEO ability director ability or CEO
influence over the board Thus at a minimum our results indicate that CEO-director connections
pick up an orthogonal dimension of governance that conventional variables do not and they do so
with asymmetric signs for connections that have professional and nonprofessional origins
22In fact the Enron case cited in the introduction suggests the opposite
30
6 Conclusion
The high profile cases of fraud at the end of the dot com era have led to one of the most sweeping
regulatory interventions into corporate America the 2002 Sarbanes Oxley Act (SOX) At the
center of the financial misconduct are the CEO and the firmrsquos board of directors who have fiduciary
responsibility towards shareholders Frauds seem to reflect a failure of this basic governance function
of boards perhaps because directors are compromised through their nexus to CEOs Thus breaking
the CEO-board nexus has been a key focus of regulators policy makers and institutional investors
We contribute new evidence to the debate by investigating the relation between fraud and a
broad vector of board attributes While we control for traditional board measures our focus is
on newer metrics based on CEO-director connectedness Using an extensive dataset on executive
biographies we find that the CEO-director connectedness matters and is at least as important as
ndash and typically more important than ndash board independence Perhaps more interestingly different
types of connections have different-signed effects Connections of non-business origins such as
those from common alma mater and non-business activities elevate fraud probability This is the
traditional agency viewpoint of connections However fraud probability is reliably lower when
CEOs and directors have professional connections originating in shared employment experiences
especially when the connected individuals serve as employees rather than as directors or director
and employee The result on the bright side of connections is new to the finance literature
We also examine several other attributes that could explain fraud Having an MBA degree
does not increase and sometimes significantly decreases fraud probability We find that fraud is
less likely when CEOs are internally hired educated at reputed schools when board members have
more external appointments or when they are drawn from prestigious ldquodirector factoryrdquo firms
The last result suggests that there is value in the training realized at firms that have historically
been a breeding ground for executive talent in corporate America
31
Our results reinforce the value of studying the ldquomultiplexrdquo of connections in social network analshy
ysis Connections with different institutional origins operate through different channels and have
different economic effects The possibility of different effects is worth stressing Sociologists and
social network researchers argue that any one type of network could have positive or negative effects
(see eg Coleman (1990) p 302 and Putnam (2000) chapter 22) Our point is that different types
of connections could result in different economic outcomes It is therefore not always appropriate to
sum the different types of connections to form a single aggregate connectedness index We do not
say that this practice is always incorrect When all types of connections contribute similarly (and
positively) eg in searching for merger targets summing up connections may be reasonable and
even desirable to gain statistical power However this practice may not be empirically appropriate
when different connections have different-signed effects on economic outcomes
Finally our study also informs a broader debate on board design The evidence suggests that the
commonly studied attributes of board effectiveness such as board size independence or financial
expertise can be enriched by incorporating broader metrics related to CEO-board connections
Our results certainly support the growing consensus that CEO-board connections deserve closer
scrutiny as part of the governance process However the mere existence of connectedness is not bad
Connections do not necessarily indicate unhealthy boards or governance systems in dysfunction
The genesis of the connections matters
The more general point emphasized by our results is that not all independent directors are
equal Thus independence is reasonable but only a useful first step Researching the heterogeneity
within independent directors is a profitable avenue for further investigation We regard our research
as one step in this direction
32
References
Adams R 2005 What do Boards do Evidence from Board Committee and Director Compensashy
tion Data Working Paper Stockholm School of Economics
Adams R and D Ferreira 2003 A Theory of Friendly Boards The Journal of Finance 62217ndash
250
Adams R B Hermalin and M Weisbach 2009 The Role of Board of Directors in Corporate
Governance A Conceptual Framework and Survey Working Paper Ohio University
Agrawal A and S Chadha 2005 Corporate Governance and Accounting Scandals Journal of
Law and Economics 48371ndash406
Ahmed A and S Duellman 2007 Accounting Conservatism and Board of Director Characterisshy
tics An Empirical Analysis Working Paper
Beasley M J Carcello D Hermanson and T Neal 2009 The Audit Committee Oversight
Process Contemporary Accounting Research 2665ndash122
Beasley M A 1996 An Empirical Analysis of the Relation between the Board of Director Comshy
position and Financial Statement Fraud Accounting Review 71433ndash465
Beneish M 1999 Incentives and penalties related to earnings overstatements that violate GAAP
Accounting Review 74425ndash457
Bergstresser D and T Philippon 2006 CEO Incentives and Earnings Management Journal of
Financial Economics 80
Bertrand M and A Schoar 2003 Managing with Style The Effect of Managers on Firm Policies
Quarterly Journal of Economics 118
33
Brickley J J Coles and J Linck 1999 What Happens To CEOs After They Retire New
Evidence on Career Concerns Horizon Problems and CEO Incentives Journal of Financial
Economics 52341ndash377
Bruynseels L and E Cardinaeles 2011 Audit Committees Management Watchdogs or Personal
Friend of the CEO Working Paper Tilburg University
Burns N and S Kedia 2006 The Impact of CEO Incentives on Misreporting Journal of Financial
Economics 7935ndash67
Cai Y and M Sevilir 2009 Board Connections and MampA Transactions Journal of Financial
Economics forthcoming
Cheng Q and T Warfield 2005 Equity Incentives and Earnings Management Accounting Review
80441ndash476
Chevalier J and G Ellison 1999 Are Some Mutual Fund Managers Better Than Others Cross-
Sectional Patterns in Behavior and Performance The Journal of Finance 54875ndash899
Chhaochharia V and Y Grinstein 2007 Corporate Governance and Firm Value The Impact of
the 2002 Governance Rules The Journal of Finance 621789ndash1825
Cohen L A Frazzini and C Malloy 2008 The Small World of Investing Board Connections
and Mutual Fund Returns Journal of Political Economy 116951ndash979
Cohen L A Frazzini and C Malloy 2010 Sell Side School Ties The Journal of Finance 651409ndash
1437
Coleman J S 1990 Foundations of Social Theory The Belknap Press of Harvard University
Cambridge MA
34
Coles J N Daniel and L Naveen 2007 Co-Opted Boards Costs Benefits Causes and Conseshy
quences Working Paper Arizona State University
Coles J and S Hoi 2003 New Evidence on the Market for Directors Board Membership and
Pennsylvania Senate Bill 1310 Journal of Finance 58197ndash230
Coles J and Z Li 2010 Managerial Attributes Incentives and Performance Working Paper
Arizona State University
Dahya J and J McConnell 2007 Board composition corporate performance and the Cadbury
Committee recommendation Journal of Financial and Quantitative Analysis 42535ndash564
Davis J E Fama and K French 2000 Characteristics Covariances and Average Returns 1929shy
1997 The Journal of Finance 55389ndash406
Dechow P R Sloan and A Sweeney 1995 Detecting Earnings Management Accounting Review
79193ndash225
Dechow P M R G Sloan and A P Sweeney 1996 Causes and Consequences of Earnings
Manipulation An Analysis of Firms Subject to Enforcement Actions by the SEC Contemporary
Accounting Research 131ndash37
Desai H C Hogan and M Wilkins 2006 The Reputational Penalty for Aggressive Accounting
Earnings Restatements and Management Turnover Accounting Review 8183ndash112
Easterbrook F and D R Fischel 1985 Optimal Damages in Securities Cases University of
Chicago Law Review 611639ndash640
Engelberg J P Gao and C Parsons 2009 The Value of a Rolodex CEO Pay and Personal
Networks Review of Financial Studies forthcoming
35
Erickson M M Hanlon and E Maydew 2006 Is There a Link Between Executive Equity Incenshy
tives and Accounting Fraud Journal of Accounting Research 44113ndash143
Ferris S M Jagannathan and A C Pritchard 2003 Too Busy to Mind The Business Monitoring
by Directors with Multiple Board Appointments The Journal of Finance 58 (3)1087ndash1111
Fich E and A Shivdasani 2007 Financial Fraud Director Reputation and Shareholder Wealth
Journal of Financial Economics 86306ndash336
Fischer C S 1982 What do we mean by friend An Inductive Study Social Networks 3287ndash306
Fracassi C and G Tate 2011 External Networking and Internal Firm Governance The Journal
of Finance 67153ndash194
Granovetter M 1985 Economic action and social structure The problem of embeddedness
American Journal of Sociology 91481ndash510
Granovetter M 2005 The Impact of social Structure on Economic Outcomes Journal of Economic
Perspectives 1933ndash50
Hennes K A Leone and B Miller 2008 The importance of distinguishing errors from irregularishy
ties in restatement research The case of restatements and CEOCFO turnover The Accounting
Review 881487ndash1519
Hermalin B and M Weisbach 2007 Transparency and Corporate Governance Working Paper
available at httpssrncomabstract=958628
Hochberg Y A Ljungqvist and Y Lu 2007 Whom You Know Matters Venture Capital Netshy
works and Investment Performance The Journal of Finance 62251ndash301
Hwang B and S Kim 2009 It Pays to have Friends Journal of Financial Economics 93138ndash158
36
Johnson S H Ryan and Y Tian 2009 Managerial Incentives and Corporate Fraud The Sources
of Incentives Matter Review of Finance 13115ndash145
Kaplan S and D Reishus 1990 Outside directorships and corporate performance Journal of
Financial Economics 27389ndash410
Karpoff J D S Lee and G Martin 2008a The Consequences to Managers of Financial Misrepshy
resentation Journal of Financial Economics 88193ndash215
Karpoff J D S Lee and G Martin 2008b The Cost to Firms of Cooking the Books Journal of
Financial and Quantitative Analysis 43581ndash612
Kedia S and T Philippon 2009 The Economics of Fraudulent Accounting Review of Financial
Studies 222169ndash2199
Klein A 2002 Audit Committee Board of Director Characteristics and Earnings Management
Journal of Accounting and Economics 33375ndash400
Lazarsfeld P and R Merton 1954 Friendship as a social process a substantive and methodshy
ological analysis Freedom and Control in Modern Society M Berger (ed) Van Nostrand New
York1866
Lennox C and J Pittman 2010 Big Five Audits and Accounting Fraud Contemporary Accountshy
ing Research 27209ndash247
Li S 2010 Corporate Financial Fraud An Application of Detection Controlled Estimation Wilshy
fred Laurier University Working Paper
Linck J J Netter and T Yang 2009 Effects and Unintended Consequences of Sarbanex-Oxley
Act on Boards Review of Financial Studies 223287ndash3328
37
Liu Y 2009 Employment Networks and the CEO Labor Market Working Paper University of
California Riverside SSRN httpssrncomabstract=1361776
Mace M 1971 Directors Myth and Reality Harvard Business School Press Boston
Marsden P 1987 Core Discussion Network of Americans American Sociological Review 52122ndash
313
McPherson M L Smith-Lovin and J Cook 2001 Birds of a Feather Homophily in Social
Networks Annual Review of Sociology 27415ndash444
Nguyen B 2008 Does the Rolodex Matter Corporate Elites Small World and the Effectiveness
of Boards of Directors Working Paper Judge Business School
Peng L and A Roell 2008 Executive Pay Earnings Manipulation and Shareholder Litigation
Review of Finance 12141ndash184
Plickert G R Ct and B Wellman 2007 Itrsquos Not Who You Know Itrsquos How You Know Them
Who Exchanges What With Whom Social Networks 29405ndash429
Povel P R Singh and A Winton 2007 Booms bust and fraud Review of Financial Studies
201219ndash1254
Putnam R 2000 Bowling Alone The collapse and revival of American community Simon and
Schuster New York
Raheja C 2005 Determinants of Board Size and Composition A Theory of Corporate Boards
Journal of Financial and Quantitative Analysis 40283306
Roberts M and T Whited 2011 Endogeneity in Empirical Corporate Finance Working Paper
University of Pennsylvania and University of Rochester
38
Rosen S 1983 Perceived Inadequacy and Help Seeking in New Directions in Helping Eds J
Fischer B DePaulo and A Nadler Academic Press New York
Saint-Charles J and P Mongeau 2009 Different Relationships for Coping with Ambiguity and
Uncertainty in Organizations Social Networks 31
Schmidt B 2009 Costs and Benefits of Friendly Boards during Mergers and Acquisitions Working
Paper Emory University
Schrand C and S Zechman 2011 Executive Overconfidence and the Slippery Slope to Financial
Misreporting Working Paper Wharton School Unversity of Pennsylvania
Srinivasan S 2005 Consequences of Financial Reporting Failure for Outside Directors Evidence
from Accounting Restatements and Audit Committee Members Journal of Accounting Research
43291ndash334
Subrahmanyam A 2008 Social Networks and Corporate Governance European Financial Manshy
agement 14633ndash662
Thakor A V J S Nielson and D A Gulley 2005 US Chamber Institute for Leshy
gal Reform The Economic Reality of Securities Class Action Litigation Working Paper
httpwwwinstituteforlegalreformcompdfs
Uzzi B 1996 The Sources and Consequences of Embeddedness for the Economic Performance of
Organizations The Network Effect American Sociological Review 61(4)674ndash698
Wang T 2008 Real Investment and Corporate Securities Fraud Working Paper University of
Minnesota
Westphal J 1999 Collaboration in the Boardroom Behavioral and Performance Consequences
of CEO-Board Social Ties The Academy of Management Journal 427ndash24
39
Westphal J and E Zajac 1995 Who Shall Govern CEOBoard Power Demographic Similarity
and New Director Selection Administrative Science Quarterly 4060ndash83
Yermack D 2004 Remuneration Retention and Reputation Incentives for Outside Directors
The Journal of Finance 592281ndash2308
Zawel M 2005 Untangling the Ivy League College Prowler
40
Table 1 Distribution of Fraud and Non Fraud Firms
Table 1 displays the distribution of firms in the fraud and the non-fraud sample over the period 2000-2006 Firms in the fraud sample are those that were subject to SEC enforcement actions for misreporting their financials Firms in the non-fraud sample consist of all other firms that have complete data on board of directors in BoardEx and coverage in CRSPCompustat
Year Fraud Non-Fraud Total Fraud not firms firms firms Firms
2000 1424 76 1500 507 2001 1739 102 1841 554 2002 1809 109 1918 568 2003 3443 104 3547 293 2004 4226 87 4313 202 2005 4514 55 4569 120 2006 4138 27 4165 065 Total 21293 560 21853 26
41
Table 2 Industry Distribution of Financial Fraud
Table 2 displays the distribution of firms in the fraud and non-fraud sample for the 48 Fama-French industries in the period from 2000-2006
Industry Industry Name
Non-Fraud Firms
Fraud Frims
Fraud Firms
1 Agriculture 37 11 229 2 Food products 260 17 61 3 Soda 36 0 00 4 Beer 61 0 00 5 Smoke 32 0 00 6 Toys amp Recreation 114 5 42 7 Fun Entertainment 261 2 08 8 Printing amp Publishing 97 6 30 9 Household Consumer Goods 255 3 12 10 Clothes Apparel 266 1 04 11 Healthcare 353 1 30 12 Medical equipment 670 2 03 13 Pharmaceutical Products 1301 20 15 14 Chemicals 382 6 15 15 Rubber amp Plastic Products 113 4 34 16 Textiles 39 0 00 17 Construction Material 294 2 07 18 Construction 246 14 54 19 Steel works etc 236 0 00 20 Fabricated Products 41 0 00 21 Machinery 571 40 65 22 Electrical Equipment 285 4 14 23 Automobiles and Trucks 262 15 54 24 Aircraft 106 5 45 25 Shipbuilding amp Railroad Equip 47 6 113 26 Defense 38 0 00 27 Precious Metals 32 0 00 28 Non Metallic amp Metal mining 57 0 00 29 Coal 60 0 00 30 Petroleum and Natural gas 722 14 19 31 Utilities 637 21 32 32 Communication 574 17 29 33 Personal Services 226 5 22 34 Business Services 2387 73 30 35 Computer Hardware 760 50 62 36 Computer Software 1298 52 39 37 Electronic Equipment 460 11 23 38 Measuring amp Control Equip 229 4 17 39 Business Supplies 64 0 00 40 Shipping Containers 482 13 26 41 Transportation 621 25 39 42 Wholesale 1011 27 26 43 Retail 323 5 15 44 Rest Hotels amp Motels 2584 21 08 45 Banking 760 27 34 46 Insurance 108 5 44 47 Real Estate 1292 16 12 48 Trading 103 0 00
Total 21293 560 26
42
Table 3 Descriptive Statistics
Table 3 displays summary statistics for explanatory variables for firms in the fraud and non-fraud samples from fiscal
2000 to fiscal 2006 PROF FRAC denotes the number of supervisory directors who worked together professionally at
a firm prior to the CEOrsquos current assignment NON PROF FRAC denotes the number of directors who either share
a common undergraduate alma mater or who share service in a nonprofessional capacity with the CEO EDU FRAC
denotes the number of supervisory directors who attended the same undergraduate school as the CEO OTH FRAC
is the number of directors that share nonprofessional service with the CEO All connection variables are scaled by
the number of directors in the firmrsquos board SIZE denotes the book value of assets TOBINQ is market value to book
value EBITDA is earnings before interest taxes and depreciation scaled by total assets ISSUANCE equals 1 if the
firm issues equity or debt in the fiscal year and zero otherwise BSIZE board size is the number of directors and
INDEP FRAC is the percentage of outside directors on the board BUSY is the average number of other directorships
held by directors FINEXP equals 1 if the board has a designated financial expert and zero otherwise CEOMBA
equals 1 if the CEO has an MBA and zero otherwise CEOIVY equals 1 if the CEOrsquos undergraduate degree is from
a prestigious school as defined in Zawel (2005) and zero otherwise The table presents the mean and median for each
sample the t-statistic for the difference in the mean and the Wilcoxon-z statistic for the difference in the median
The superscripts c b and a indicate significance at the 10 5 and 1 levels respectively using robust standard
errors
Variable Non-Fraud Fraud t-statistic Wilcoxon z Professional Connections PROF FRAC 1361 000 844 000 5342a 2817a
Education and Other Connections NONPROF FRAC 739 00 1085 00 -642a -595a
EDU FRAC 111 000 137 00 -1360 -1507 OTH FRAC 632 000 952 00 -654a -568a
Firm Characteristics SIZE 6607 658 39991 2213 -1534a -1435a
TOBINQ 2113 1492 2169 1424 -0659 1180 EBITDA 623 932 87 944 -2402a -1706lowast
LEVERAGE 2221 1705 253 2254 -2956a -4299a
ISSUANCE 097 099 -3396a
CEO and Board characteristics BSIZE 858 800 939 900 -6849a -6349a
INDEP FRAC 7956 8333 7973 8333 -0339 -0176 BUSY 143 100 160 10 -4926a -5030a
FINEXP 293 178 -5629a
CEOMBA 227 264 0490 0498 CEOIVY 2522 2748 1473 1470
43
Table 4 Base Model For Financial Misconduct
Table 4 displays estimates of logit models The dependent variable is 1 if the firm engages in fraud in the fiscal year
and is zero otherwise The data are from 2000 to 2006 LSIZE is the logarithm of the book value of assets TOBINQ
is the ratio of firm market value to book value EBITDA is earnings before interest taxes and depreciation scaled
by total assets ISSUANCE equals 1 if the firm issues equity or debt in the fiscal year and zero otherwise BSIZE
is the number of total directors on the board INDEP FRAC is the percentage of outside directors on the board
BUSY is the average number of other directorships held by directors FINEXP is a dummy which is equal to 1 if the
board has a designated financial expert CEOMBA equals 1 if the CEO has an MBA and zero otherwise CEOIVY
equals 1 if the CEOrsquos undergraduate degree is from a prestigious school as defined in Zawel (2005) and zero otherwise
Coefficients for time and industry fixed effects are not shown The superscripts c b and a indicate significance at
the 10 5 and 1 levels respectively using robust standard errors
Model 1 Model 2 Model 3 LSIZE 0414a 0405a 0471a
(14436) (13641) (14509) TOBINQ 0055lowastlowast 005b 0037
(2384) (2184) (1382) EBITDA -0700a -0807a -0714a
(3434) (3767) (2825) LEVERAGE -0263 -0266 0018
(1439) (1469) (0105) ISSUANCE 1138b 1094b 1051lowastlowast
(2241) (2164) (2067) BSIZE -0013 -003 -0015
(0598) (1402) (0676) INDEP FRAC -1028a -0451 -0938b
(2948) (1224) (2417) BUSY -0088c -0125b -0143a
(1725) (2432) (271) FINEXP -0253 0033 0058
(2815)a (0318) (0539) INTERCEPT -6263a -6076a -3553a
(11456) (10831) (5424) Year Fixed Effects No Yes Yes Industry Fixed Effects No No Yes Observations 18503 18503 17712 Pseudo-R2 0068 0099 0149
44
Table 5 Financial Misconduct and CEO-Director Nonprofessional Connectedness
Table 5 displays estimates of logit models The dependent variable is 1 if the firm engages in fraud in the fiscal year
and is zero otherwise The data are from 2000 to 2006 LSIZE is the logarithm of the book value of assets TOBINQ
is the ratio of firm market value to book value EBITDA is earnings before interest taxes and depreciation scaled
by total assets ISSUANCE equals 1 if the firm issues equity or debt in the fiscal year and zero otherwise BSIZE
is the number of total directors on the board INDEP FRAC is the percentage of outside directors on the board
BUSY is the average number of other directorships held by directors FINEXP is a dummy which is equal to 1 if the
board has a designated financial expert CEOMBA equals 1 if the CEO has an MBA and zero otherwise CEOIVY
equals 1 if the CEOrsquos undergraduate degree is from a prestigious school as defined in Zawel (2005) and zero otherwise
EDU FRAC denotes the number of supervisory directors who attended the same undergraduate school as the CEO
The variable OTH FRAC is the number of supervisory directors that share nonprofessional service with the CEO
and NONPROF FRAC denotes the number of supervisory directors who either share a common undergraduate alma
mater or who share service in a nonprofessional capacity with the CEO All connectedness variables are scaled by c b aboard size Coefficients for time and industry fixed effects are not shown The superscripts and indicate
significance at the 10 5 and 1 levels respectively using robust standard errors
Model 1 Model 2 Model 3 LSIZE 0474a 0476a 0473a
(142) (14215) (14188) TOBINQ 0041 004 0041
(1553) (1527) (153) EBITDA -0705a -0693a -0697a
(2705) (2631) (2662) LEVERAGE 0012 0016 0016
(0069) (0088) (0089) ISSUANCE 102b 1016b 102b
(2011) (2013) (2017) BSIZE -0017 -0017 -0018
(0779) (0755) (0787) INDEP FRAC -1013 -102 -1022
(2518)b (2529)b (2539)b
BUSY -0142a -0141a -0144a
(2643) (2622) (2677) FINEXP 0061 0063 0062
(0563) (0583) (0572) OTH FRAC 0756b 0706b
(2108) (1961) EDU FRAC 1636
(1554) NONPROF FRAC 0839
(2515)b
CEOMBA -0165 -0162 -0163 (1567) (1539) (1554)
CEOIVY -0272b -0288a -0281a
(-2593) (-2732) (268) INTERCEPT -3328a -3373a -3331a
(5111) (5177) (5124) Year Fixed Effects Yes Yes Yes Industry Fixed Effects Yes Yes Yes Observations 17363 17363 17363 Pseudo-R2 0152 0153 0153
45
Table 6 Financial Misconduct and CEO-Director Professional Connectedness
Table 6 displays estimates of logit models The dependent variable is 1 if the firm engages in fraud in the fiscal
year and is zero otherwise The data are from 2000 to 2006 LSIZE is the logarithm of the book value of assets
TOBINQ is the ratio of firm market value to book value EBITDA is earnings before interest taxes and depreciation
scaled by total assets ISSUANCE equals 1 if the firm issues equity or debt in the fiscal year and zero otherwise
BSIZE is the number of total directors on the board INDEP FRAC is the percentage of outside directors on the
board BUSY is the average number of other directorships held by directors FINEXP is a dummy which is equal
to 1 if the board has a designated financial expert CEOINTERNAL equals 1 if the CEO is internally hired and
zero otherwise CEOMBA equals 1 if the CEO has an MBA and zero otherwise CEOIVY equals 1 if the CEOrsquos
undergraduate degree is from a prestigious school as defined in Zawel (2005) and zero otherwise NONPROF FRAC
denotes the number of supervisory directors who either share a common undergraduate alma mater or who share
service in a nonprofessional capacity with the CEO PROF FRAC denotes the number of supervisory directors who
worked together professionally at a firm prior to the CEOrsquos current assignment All connectedness variables are scaled
by board size Coefficients for time and industry fixed effects are not shownThe superscripts c b and a indicate
significance at the 10 5 and 1 levels respectively using robust standard errors
Model 1 Model 2 LSIZE 0473a 0487a
(14524) (14399) TOBINQ 0034 0039
(1248) (1483) EBITDA -0757a -0722a
(3002) (2683) LEVERAGE 0018 003
(01) (0164) ISSUANCE 1034b 0995b
(2035) (1973) BSIZE -0019 -0016
(084) (072) INDEP FRAC -0804b -0879b
(2061) (2185) BUSY -0098c -0104b
(1885) (1969) FINEXP 0066 0072
(0612) (0669) CEOINTERNAL -0362a
(3633) CEOMBA -0172
(1618) CEOIVY -0287a
(272) NONPROF FRAC 0993a
(2932) PROF FRAC -1149a -1443a
(4126) (506) INTERCEPT -3606a -3418a
(5471) (5162) Year Fixed Effects Yes Yes Industry Fixed Effects Yes Yes Observations 17708 17363 Pseudo-R2 0152 0159
46
47
Tab
le 7
R
obus
tnes
s of
Pro
fess
iona
l C
onne
cted
ness
Table
7 d
ispla
ys
esti
mate
s of lo
git
model
s T
he
dep
enden
t va
riable
is
1 if th
efirm
engages
in
fra
ud
in
the
fisc
al yea
r and
is
zero
oth
erw
ise
The
data
are
fro
m 2
000
to
2006
Contr
ol va
riable
s th
at
are
incl
uded
but
whose
coeffi
cien
ts a
re s
uppre
ssed
incl
ude
LSIZ
E T
OB
INQ
E
BIT
DA
LE
VE
RA
GE
IS
SU
AN
CE
B
SIZ
E FR
AC
IN
DE
P
BU
SY
and
FII
NE
XP C
EO
INT
ER
NA
L e
quals
1 if th
e C
EO
is
inte
rnally
hir
ed a
nd
zer
o o
ther
wis
e C
EO
MB
A e
quals
1 if th
e C
EO
has
an
MB
A a
nd
zer
o o
ther
wis
e
CE
OIV
Y e
quals
1 i
f th
e C
EO
rsquos u
nder
gra
duate
deg
ree
is f
rom
a p
rest
igio
us
school
as
defi
ned
in
Zaw
el (
2005)
and
zer
o o
ther
wis
e
NO
NP
RO
F F
RA
C d
enote
s th
e
num
ber
of su
per
vis
ory
dir
ecto
rs w
ho
eit
her
share
a c
om
mon
under
gra
duate
alm
a m
ate
r or
who
share
ser
vic
e in
a n
onpro
fess
ional ca
paci
ty w
ith
the
CE
O P
RO
F F
RA
C
den
ote
s th
e num
ber
of su
per
vis
ory
dir
ecto
rs w
ho
work
ed t
oget
her
pro
fess
ionally
at
afirm
pri
or
to t
he
CE
Orsquos
curr
ent
ass
ignm
ent
PR
OF
FR
AC
E d
enote
s th
e sa
me
quanti
ty b
ut
wher
e th
e pri
or
emplo
ym
ent
is s
uch
that
both
the
CE
O a
nd
the
dir
ecto
r w
ere
emplo
yed
as
exec
uti
ves
P
RO
F F
RA
C D
den
ote
s th
ese
connec
tions
der
ived
fro
m c
om
mon
dir
ecto
rship
s at
the
sam
e board
C
EO
FA
CT
ORY
and
FR
AC
FA
CT
OR
IES
den
ote
a C
EO
or
the
fract
ion
of
a b
oard
form
erly
em
plo
yed
by
one
of
the
top
10
of
supplier
s of
dir
ecto
rs
resp
ecti
vel
y
AFT
ER
CE
O F
RA
C d
enote
s th
e pro
port
ion
of
dir
ecto
rs a
ppoin
ted
aft
er t
he
CE
O a
ssum
es o
ffice
and
AFT
ER
CE
O F
RA
C N
ON
PR
OF
den
ote
s th
e su
bse
t of su
ch d
irec
tors
wit
h a
pri
or
nonpro
fess
ional ov
erla
p w
ith
the
CE
O A
ll c
onnec
tednes
s va
riable
s are
sca
led
by
board
siz
e M
odel
5 is
a d
irec
tor-
level
spec
ifica
tion
wit
h d
irec
tor
fixed
effec
ts
Coeffi
cien
ts f
or
tim
e and
indust
ryfixed
effec
ts a
re n
ot
show
n
The
super
scri
pts
c
b
and
a in
dic
ate
sig
nifi
cance
at
the
10
5
and
1
lev
els
res
pec
tivel
y u
sing
robust
sta
ndard
err
ors
Mod
el 1
M
odel
2
Mod
el 3
M
odel
4
Mod
el 5
C
EO
INT
ER
NA
L
-03
35a
-0
358
a
-03
54a
-0
356
a
-01
650b
(33
3)
(35
8)
(35
3)
(35
5)
(-2
37)
CE
OM
BA
-0
154
-0
149
-0
148
-0
146
-0
102
5 (1
46)
(1
39)
(1
37)
(1
35)
(-
134
) C
EO
IVY
-0
305
a
-02
8a
-02
82a
-0
282
a
-01
84b
(28
9)
(26
6)
(26
6)
(26
6)
(-2
37)
NO
NP
RO
F F
RA
C
091
4a
108
2a
107
4a
119
8a
105
97a
(27
0)
(32
1)
(31
7)
(43
5)
PR
OF
FR
AC
-1
439
a
-14
33a
-1
439
a
-12
89a
(-5
06)
(-5
04)
(-5
06)
(-5
29)
FR
AC
FA
CT
OR
IES
-08
41a
-0
844
a
-08
44a
-1
430
7a
(-3
53)
(-3
55)
(-3
55)
(-6
26)
PR
OF
FR
AC
E
-30
75a
(35
89)
PR
OF
FR
AC
D
019
8(0
20)
C
EO
FAC
TO
RY
0
007
000
8 0
008
(02
3)
(02
6)
(02
7)
AFT
ER
CE
O F
RA
C
005
6 0
071
(03
4)
(04
3)
AFT
ER
CE
O F
RA
C N
ON
PR
OF
-0
761
(07
2)
Yea
r Fix
ed E
ffect
s Y
es
Yes
Y
es
Yes
Y
es
Indu
stry
Fix
ed E
ff ect
s Y
es
Yes
Y
es
Yes
Y
es
O
bser
vati
ons
173
63
173
63
173
63
173
63
138
42
Pse
udo-
R2
0
157
016
1 0
161
016
1 0
290
Table 8 Compensation Subsample and SOX
Table 8 displays results of Logit estimations where the dependent variable is a dummy that takes the value one when
the firm engages in fraud The data are from 2000 to 2006 LSIZE is the log of total assets TOBINQ is the ratio
of firm market value to its book value EBITDA is scaled by Total Assets ISSUANCE is a dummy variable if the
firm issues equity or debt in the fiscal year BSIZE is the number of total directors on the board INDEP FRAC
is the percentage of outside directors on the board BUSY is the average number of other directorships held by
directors FINEXP is a dummy which is equal to 1 if the board has a designated financial expert NONCASH is the
percentage of non-cash compensation in the pay packages of the firmrsquos executive team as reported in the ExecuComp
database CEOMBA is a dummy variable that equals one when the CEO has an MBA degree CEOIVY area is
a dummy variable that equals one if the CEO has an Ivy League undergraduate CEOINTERNAL equals 1 if the
CEO is internally hired and zero otherwise NONPROF FRAC is the fraction of the board that have nonprofessional
ie education or other social connections with the CEO and PROF FRAC is the fraction of the board that has
employment connections with the CEO Time and Industry fixed effects not shown for brevity The superscripts c b and a indicate significance at the 10 5 and 1 levels respectively using robust standard errors
Full Sample Pre-SOX Post-SOX LSIZE 0464a 0631a 0311a
(916) (8073) (4609) TOBINQ -0055 -0087 0066
(1279) (123) (0925) EBITDA -1377a -2912a -1195a
(3175) (2909) (2658) LEVERAGE 0592c 0759a 0622
(1849) (2145) (1375) ISSUANCE 0541 0227 0842
(0984) (0362) (0849) BSIZE -0029 -0052 000
(0988) (1356) (001) INDEP FRAC -1462a -1434a -1238
(2656) (2061) (1244) BUSY -0098 -013 -0047
(1555) (1532) (0456) FINEXP 0066 -0033 027
(0493) (0178) (1166) NONCASH 072b 0178 1399a
(2518) (0505) (3048) CEOMBA -0327b -0134 -0563a
(2456) (0736) (2738) CEOIVY -0493a -0709a -031
(3666) (3734) (1582) CEOINTERNAL -0417a -0502a -0356a
(3372) (2943) (1931) NONPROF FRAC 1435a 1952a 0954
(3726) (3757) (1546) PROF FRAC -1826a -2122a -1765a
(5167) (4171) (35) INTERCEPT -1731b -2376 -3559
(2012) (2148) (2551) Year Fixed Effects Yes Yes Yes Industry Fixed Effects Yes Yes Yes Observations 7595 2545 4682 Pseudo-R2 0165 0188 0146
48
Table 9 Marginal Effects
Table 9 displays marginal effects of logit estimates The dependent variable is 1 if the firm engages in fraud in the
fiscal year and is zero otherwise The full sample is from 2000-2006 and the pre-SOX and post-SOX periods cover
subperiods until 2000 and after 2003 respectively LSIZE is the logarithm of the book value of assets TOBINQ
is the ratio of firm market value to book value EBITDA is earnings before interest taxes and depreciation scaled
by total assets ISSUANCE equals 1 if the firm issues equity or debt in the fiscal year and zero otherwise BSIZE
is the number of total directors on the board INDEP FRAC is the percentage of outside directors on the board
BUSY is the average number of other directorships held by directors FINEXP is a dummy which is equal to 1 if the
board has a designated financial expert CEOINTERNAL equals 1 if the CEO is internally hired and zero otherwise
CEOMBA equals 1 if the CEO has an MBA and zero otherwise CEOIVY equals 1 if the CEOrsquos undergraduate
degree is from a prestigious school as defined in Zawel (2005) and zero otherwise NONPROF FRAC denotes the
number of supervisory directors who either share a common undergraduate alma mater or who share service in
a nonprofessional capacity with the CEO PROF FRAC denotes the number of supervisory directors who worked
together professionally at a firm prior to the CEOrsquos current assignment All connectedness variables are scaled by
board size NONCASH is equity compensation to total compensation for the top 5 executive officers Coefficients for
time and industry fixed effects are not shown Superscripts c b and a indicate significance at the 10 5 and 1
levels respectively using robust standard errors
Full Sample Pre-SOX Post-SOX LSIZE 193a 416a 104a
(952) (880) (508) TOBINQ -015 -054 013
(-106) (-126) (-074) EBITDA -048a -114a -034a
(-470) (-289) (-333) LEVERAGE 018 057c 000
(128) (178) (-002) ISSUANCE 095 073 097
(116) (036) (111) BSIZE -017 -059 000
(-091) (-132) (000) INDEP FRAC -035b -064b -018
(-244) (-198) (-098) BUSY -021 -050 -006
(-152) (-152) (-039) FINEXP 017 -011 048
(053) (-015) (133) NONCASH 056b 014 093a
(234) (040) (295) CEOMBA -072a -050 -092a
(-254) (-074) (-292) CEOIVY -105a -243a -049
(-401) (-415) (-156) INTERNAL -096a -188a 062c
(-332) (-292) (-186) NONPROF FRAC 047a 111a 022
(368) (361) (146) PROF FRAC -081a -159a -060a
(-493) (-394) (-334) Year Fixed Effects Yes Yes Yes Industry Fixed Effects Yes Yes Yes Observations 7595 2545 4682
49
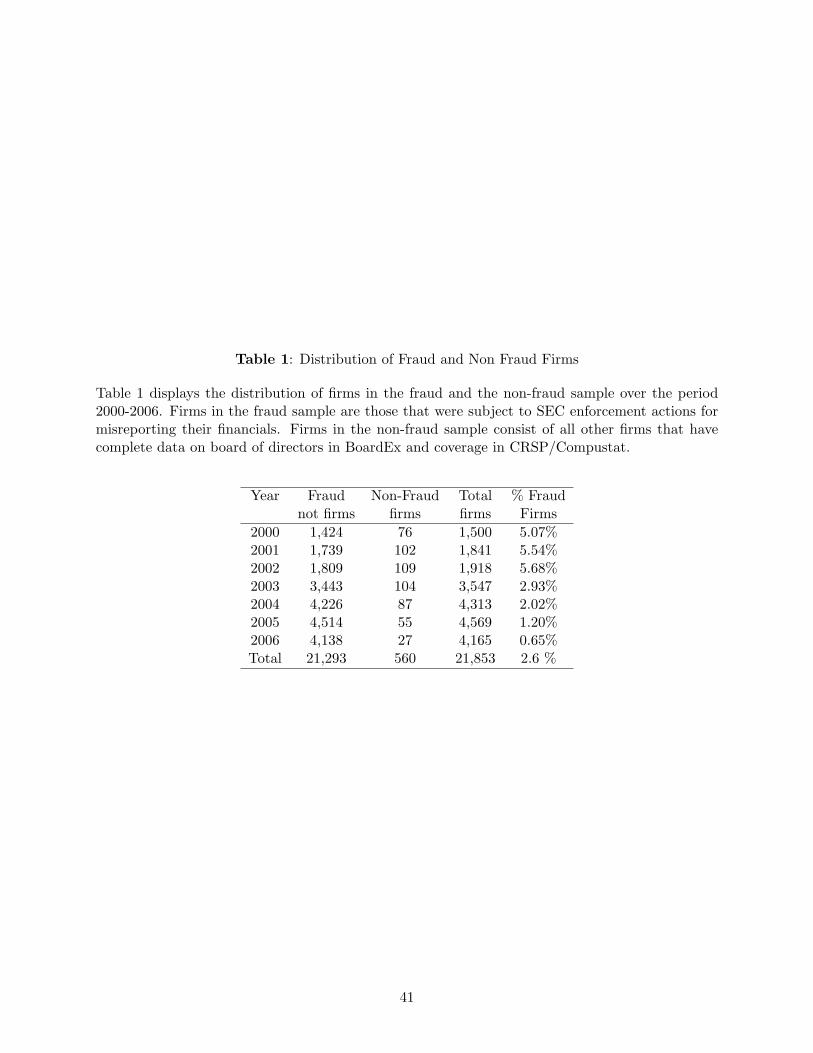
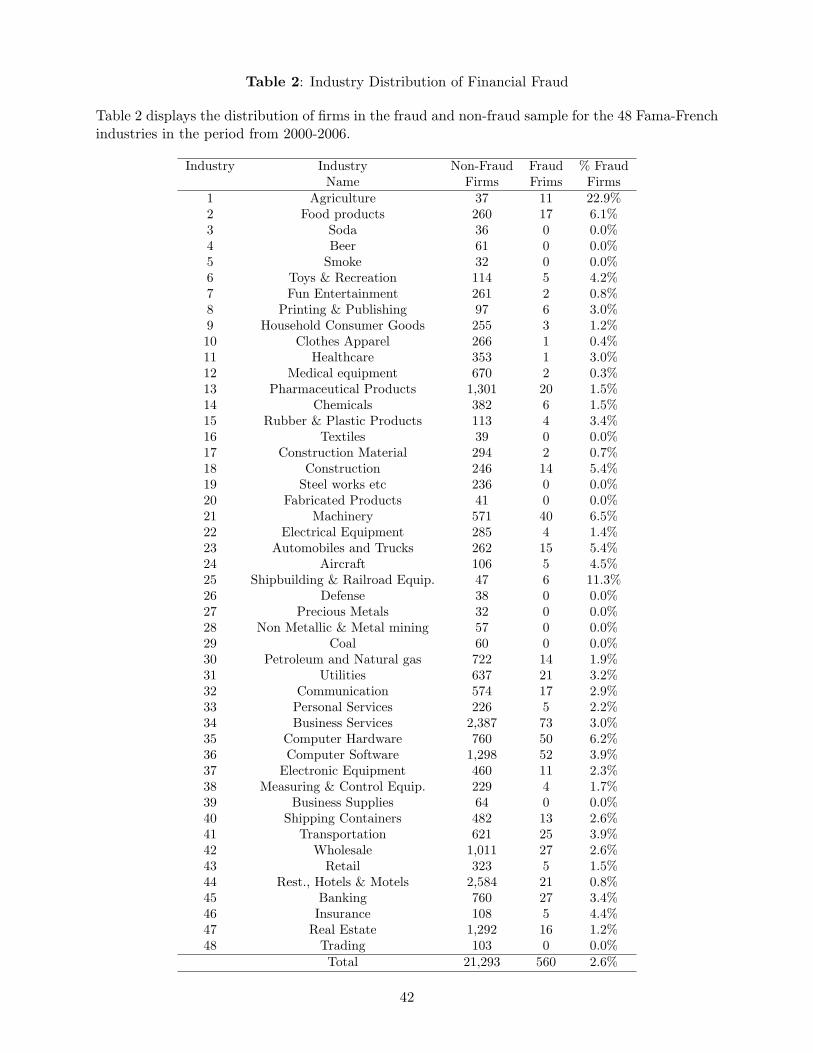
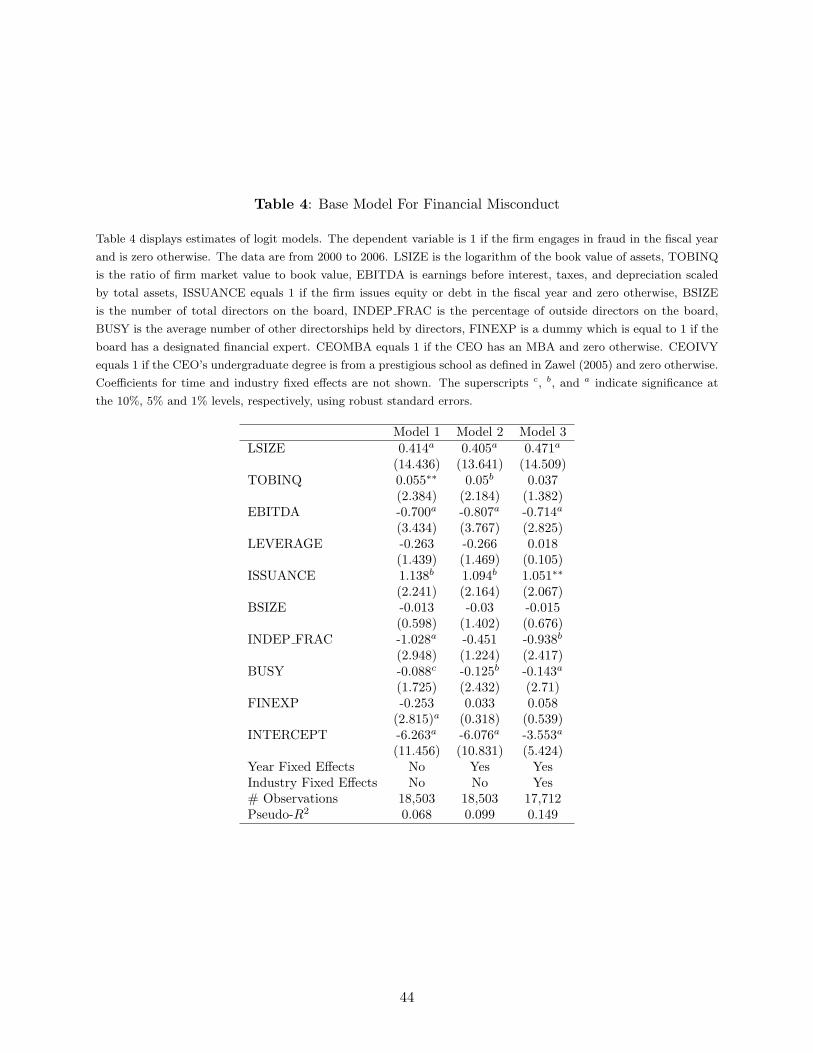
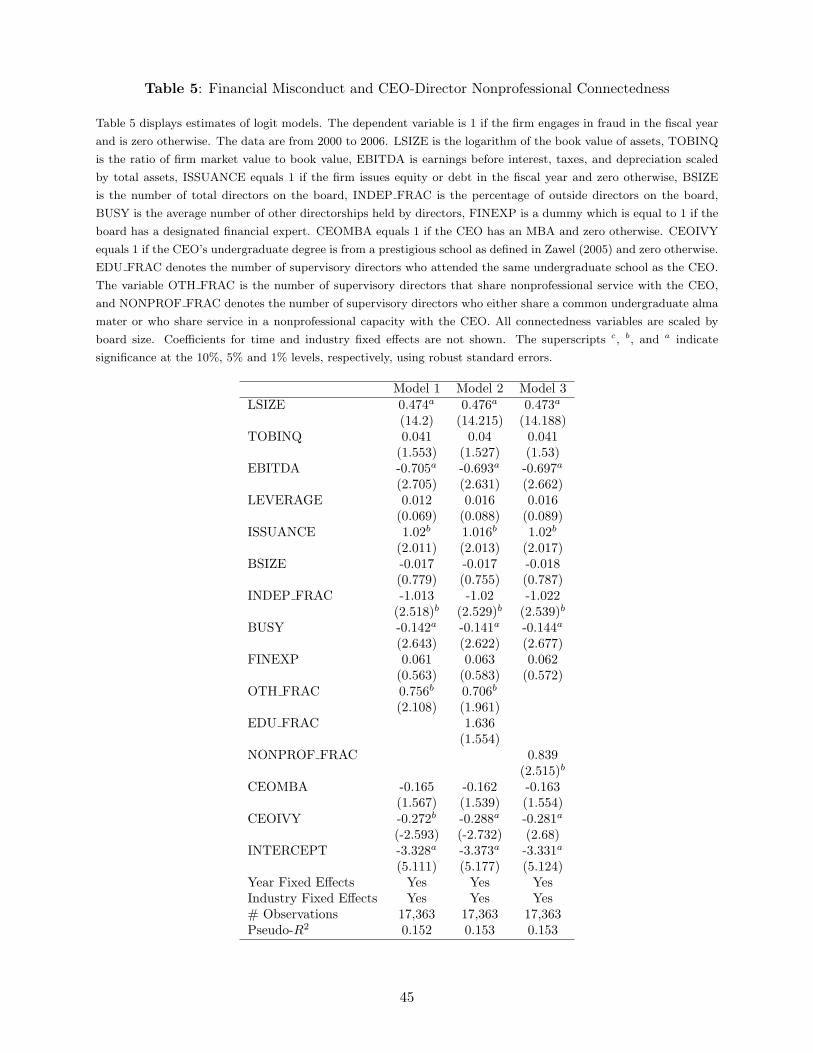
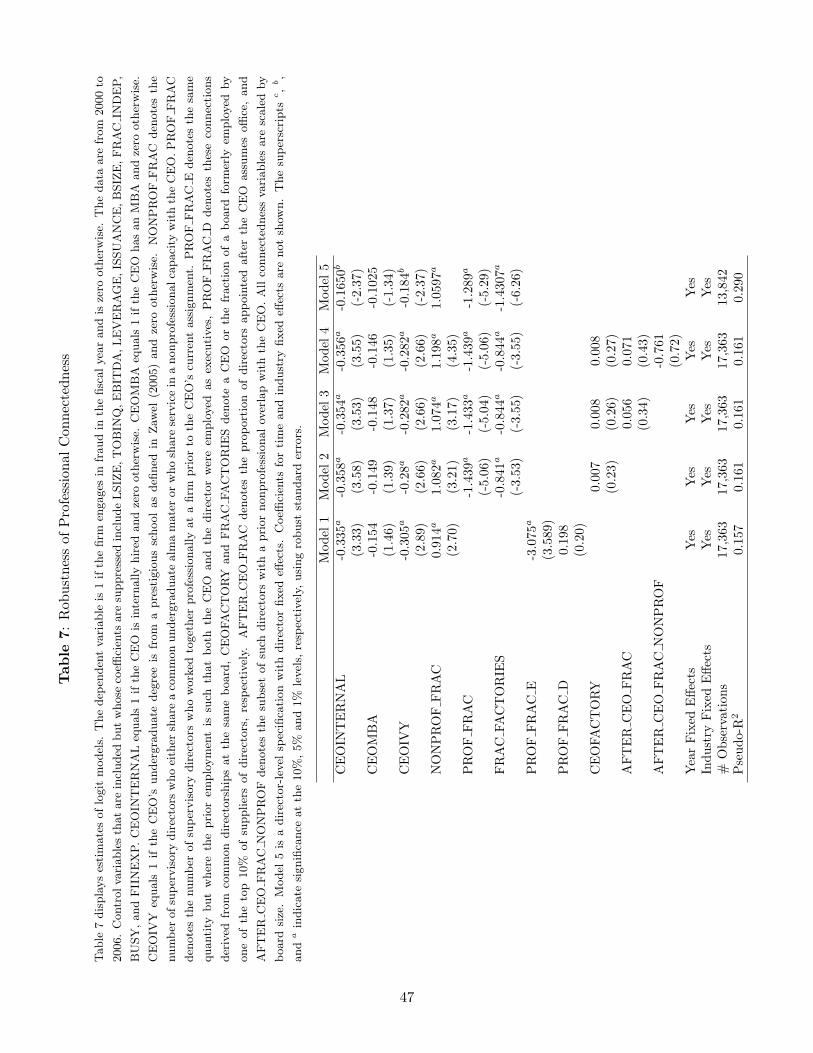
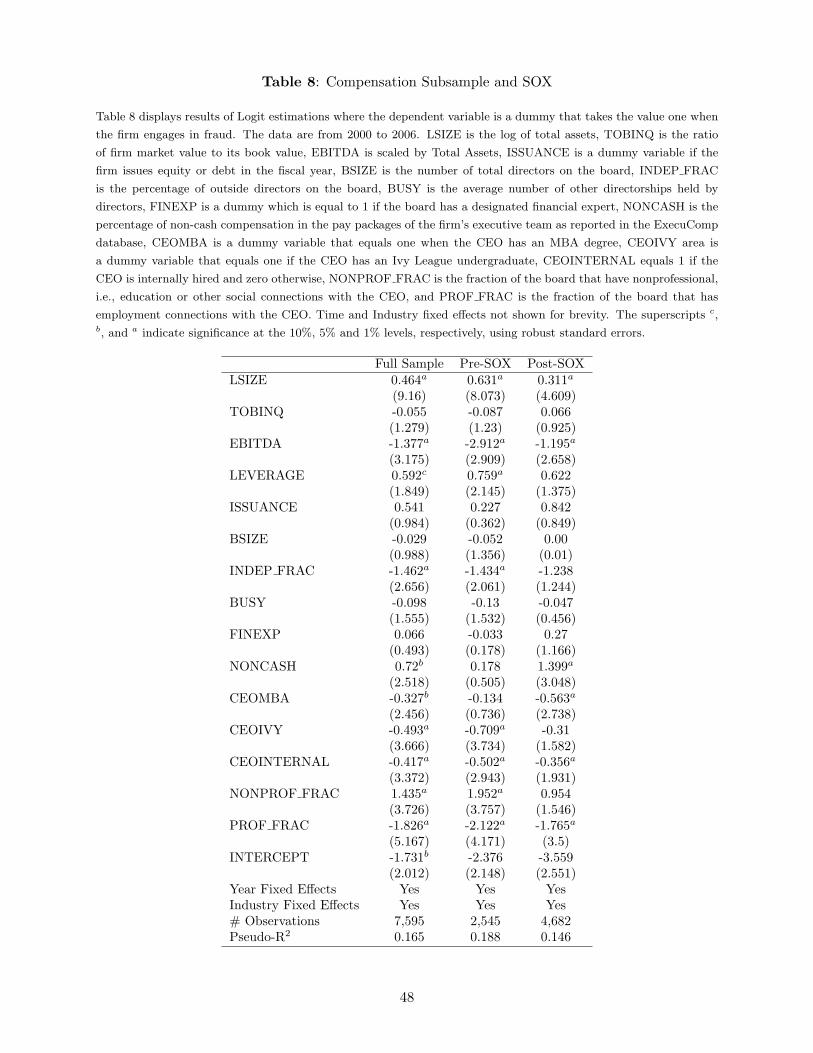
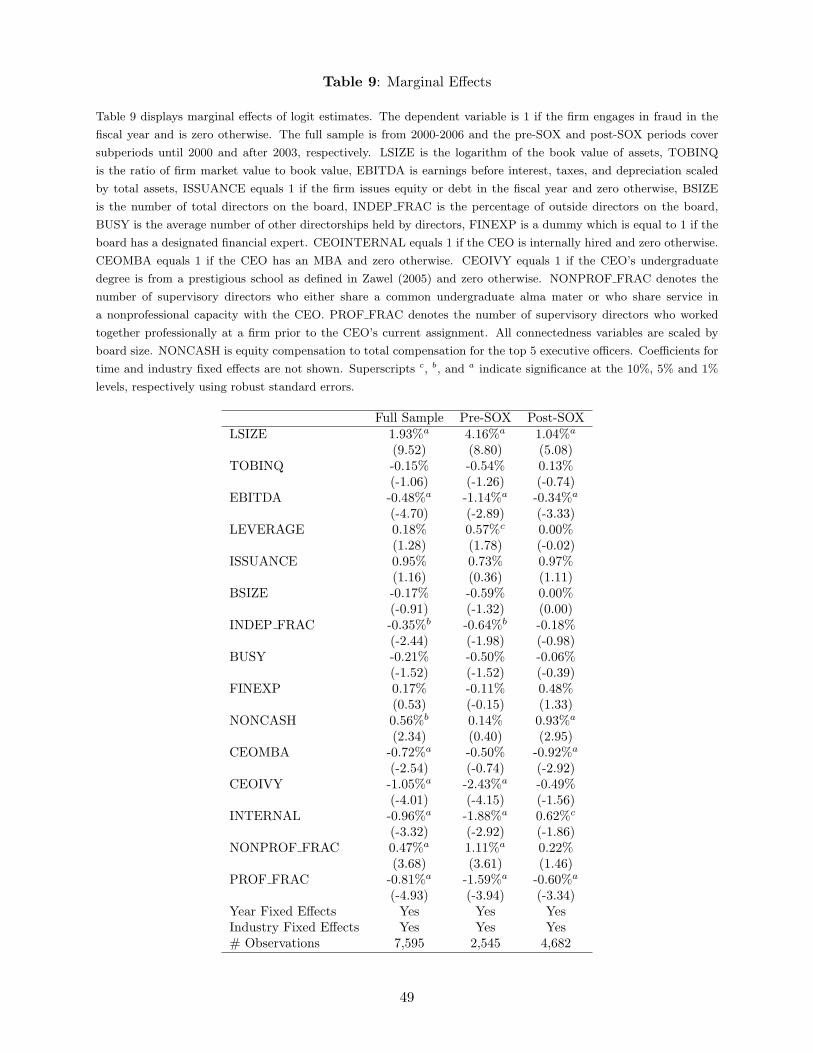