centrifugal pump application and optimization - energy design
TRANSCRIPT

energydesignresources
design briefCENTRIFUGAL PUMP APPLICATION AND OPTIMIZATION
A pump that is well-sized,
-specified, and -selected, and is
operated in a manner that reflects
the design intent will be more
efficient and often costs less
than a pump that does not fit the
needs of the system it serves.
Who Should Read This Brief?This brief presents practical pump theory, selection and application
principles. The concepts discussed will be of interest to:
Design professionals who want to better understand how pump
theory and design practice apply to day-to-day operating
environments
Commissioning providers who wish to better understand pumps,
pumping systems, and the evolution of design intent for hydronic
systems
Facilities engineering professionals who want to better understand
the fundamental design and application principles behind the
equipment they operate
Key points for each of these areas of professional practice are emphasized
in checklists at the end of each major topic. Summary 2
Pump Energy 3
Selecting Pumps 22
Optimizing Performance 37
Specifying Pumps 44
Conclusion 46
References 47
c o n t e n t s

Page 2 A Field Perspective: Centrifugal Pump Application and Optimization
Summary
Centrifugal pumps perform many important functions to control the built envi-
ronment. The physics and basic mechanics of pumps have not changed substan-
tially in the last century. However, the state of the art in the application of pumps
has improved dramatically in recent years. Even so, pumps are still often not well
applied, and become common targets in retrocommissioning projects where field
assessment and testing can reveal significant energy savings potential from opti-
mizing pump performance. Typically, retrocommissioning finds that pump flow
rates do not match their design intent and that reducing flow rates to match load
requirements or eliminating unnecessary pressure drops can save energy. As the ex-
ample below illustrates, decisions made during the design phase have implications
throughout the operating life of the building.
Although fully optimizing any design will require some effort after installation, the
prevalence and magnitude of the savings that are commonly found in retrocommis-
sioning and ongoing commissioning begs the larger question: How much greater
would the savings be if pumps were selected and applied optimally during the
design phase?
The pumping application shown below illustrates a typical less-
than-optimal design that often translates into a retrocommissioning
opportunity later on.
The pump selected for the application was rated for 40 feet water
column (ft. w.c.) of head at the design flow rate, even though the
piping circuit it served was very short with very few fittings. Field
testing revealed that only 13 to 14 ft. w.c. of head was actually
required. During RCx, the pump was optimized to the requirements
of the system via an impeller trim and minor throttling. However,
many other opportunities were missed because the system perfor-
mance was not optimized during the design phase. If it had been,
the pump selection would have more closely matched the needs of
the system and would:
� Operate at its best efficiency point in the as-built system;
� Be smaller and cost less to purchase and pipe;
� Require a 10 hp motor and electrical service instead of 20 hp.
A Common RCx Problem Reveals Missed Opportunity for Rightsizing
1200 gpm @ 40 ft.w.c.; 20 hp motor
Centrifugal seperator

Page 3A Field Perspective: Centrifugal Pump Application and Optimization
This brief tries to answer that question by exploring the theory and reality behind
the selecting and applying centrifugal pumps in commercial buildings. You will
learn that if a pump is carefully specified during the design process and is installed
in a manner that reflects the design intent, it will be more efficient and will most
likely cost less than a pump that does not fit the needs of its system. This is es-
pecially true when the “ripple effect” savings in the supporting drive and power
systems are taken into account.
This brief describes how pumps use energy, and discusses various efficiency con-
siderations. It then describes how the entire system affects the performance of the
pump, and discusses how to select the best pump and components. A section on
optimizing the performance of a pump system describes important considerations
in sizing pumps, as well as how to adjust the pump’s flow initially and over time to
ensure optimal performance over a range of conditions.
Pump Energy
Pumps provide the energy to move water through piping systems including equip-
ment, piping, and fittings, and through elevation changes in open systems. If the
flow rate, head requirement, and efficiency for a pump are known, then the pump-
power equation can be used to calculate the brake horsepower required to perform
the task as follows:
××
=Pump
H Q BHPη3,960
Where:
BHP = Brake horsepower required at the pump shaftQ = Pump flow rate in gpmH = Pump head in feet of water columnηpump = Pump efficiency (typical range = 0.45 to 0.85)
Dividing the result of the pump-power equation by the motor efficiency converts
the brake horsepower requirement at the motor output shaft into horsepower input
to the motor. Multiplying the motor horsepower by 0.746 kW per horsepower
converts this input power to electrical power. This value can then be multiplied
by the hours of operation to determine how much energy the pump consumes in
kilowatt-hours (kWh) for constant flow systems. The different terms used for power

Page 4 A Field Perspective: Centrifugal Pump Application and Optimization
in pumps are summarized in .
Figure 1 shows that the amount of power that exits a pump in the form of flow
and pressure is less than the power that enters the pump from the utility system,
due to losses in the drive system and the pump. These losses include drive-system
losses, mechanical losses, leakage losses, and hydraulic losses. These losses, and op-
portunities to minimize them through proper selection, application, and specifica-
tion are described below.
Power Terms Used in Pump SystemsSeveral related terms are used to describe the power used by
or generated by a pump:
� Brake Horsepower (BHP): Brake horsepower is the power
required as an input to the pump shaft to deliver the
indicated flow and head. Brake horsepower takes pump
efficiency into account but not motor efficiency. To account
for losses in the motor and drive system, it is necessary
to take the brake horsepower requirement and divide it
by the motor and drive efficiencies at the designated oper-
ating point.
� Motor Power: The output power delivered by a motor
shaft to a driven device. This is the motor “size”, e.g.,
“1/2 horsepower motor”
� Input power to motor: The amount of electricity that is drawn
by the motor, which shows up on the electric meter in kW.
Figure 1: Efficiency Losses Through a Pump and Its Drive

Page 5A Field Perspective: Centrifugal Pump Application and Optimization
Drive System Losses
The components most commonly found in the drive system serving commercial
building pumps are the motor (or other prime movers, such as a steam turbine)
and a variable-speed drive. The drive system is the first place that efficiency losses
occur as power moves from the utility system to the fluid stream.
Motor Efficiency Losses
Several phenomena cause losses in motor efficiency:
Spinning shafts must be supported by bearings and even the best bearings offer
some resistance to motion.
Current flowing through the windings in an electric motor experiences
resistance, generating heat that performs no useful work. A similar effect
occurs with the flux flowing in the motor’s magnetic circuit.
Efficiency losses in electric motors become heat which must be removed.
The cooling fan mounted on the end of the motor shaft performs work on the
air used to cool the motor, extracting power from the shaft beyond that used
by the driven machine.
The efficiency of a motor depends on several factors.
Efficiency Varies with Load: For most motors, the peak efficiency occurs at conditions
other than full load; for example, 110% of full load for a common 1-hp motor and
90% of full load for a common 25-hp motor. The shape of the efficiency and other
characteristic curves associated with a motor is a function of the details of its design.
shows how the efficiency of a motor varies with load.
Efficiency Varies with Motor Size: Generally, larger motors are more efficienct than
smaller motors if all other things are equal. This is because some of the factors
affecting efficiency are not directly related to motor size. For example, bearing
resistances for 1-hp and 25-hp motors are similar. But, when compared to the rated
power, bearing resistance is a bigger percentage of the output for the 1-hp mo
tor. shows how the relationship between efficiency and oad is different for two
different-size motors.

Page 6 A Field Perspective: Centrifugal Pump Application and Optimization
Efficiency Varies with Motor Quality: The added cost associated with a
Efficiency Varies with Motor Quality: The added cost associated with a
premium-efficiency motor corresponds to an added value. Most of the
improvement is achieved through higher-quality materials in the electric and
magnetic circuits that reduce their resistance and thus improve efficiency.
Improvements in the magnetic circuit also improve the power factor, which
affects efficiency as discussed below.
Efficiency is Relatively Constant from 50% to 100% Load: While efficiency
varies with load, it does not vary significantly until the load drops below 40-
50% of full load. This means that running a motor at less than full load does
Figure 2: Motor Efficiency Varies with Size
Power factor is a number used by electrical engineers to represent the
phase shift that occurs between voltage and current when an alternating
current power supply (AC) is connected to a capacitive or inductive load.
The motors commonly found on pumps represent an inductive load
on a typical utility system and thus have a power factor associated
with them. While most of the current drawn by a motor becomes
work or real power at the output shaft, some of it is used to create the
motor’s magnetic fields and is termed reactive power. Power factor is
simply the ratio of real power to apparent power, which includes both
the real power and the reactive power. The number will never exceed
one, and a higher number is more optimal than a lower number.
Reactive power is never really consumed. Rather, it is simply “shuf-
fled” around the distribution system as the inductive and capacitive
fields expand and collapse with the AC cycle. Because conductors
and transformers have a resistance associated with them, some of
the reactive and real current flowing through them is dissipated as a
heat loss. Motors with high power factors draw less reactive current.
Thus, the losses due to the system resistance are minimized when
high power factor motors are employed and less reactive current
flows through the distribution system.
Power Factor; Stored Energy with Efficiency Implications
Page 7A Field Perspective: Centrifugal Pump Application and Optimization
not have a major effect on overall efficiency until the load drops significantly.
This has some implications that will be explored in the section that discusses
non-overloading motor selections for pumps.
All motors are not created equal. Recent research shows a potential variation of
7-17% in efficiency for motors with identical horsepower ratings (UPPCO, 2005).
It is important to recognize the difference between a manufacturer who supplies a
motor that meets the minimum standard specified (for example, the minimum mo-
tor efficiency requirements of California’s Title 24) compared with a manufacturer
who exceeds the minimum standard efficiency requirements. The cost difference be-
tween the two selections can be insignificant; the owner stands to lose a significant
opportunity for energy savings by choosing a motor with the lowest first cost.
Despite the obvious advantages, tight budgets and timelines can make it difficult
for designers and facilities personnel to do much more than specify compliance
with a minimum efficiency standard. Fortunately, software-based tools that allow
designers to develop tighter specifications and facility engineers to make better pur-
chases are becoming available. One such software tool is the U.S. DOE MotorMas-
ter. This free program lets you quickly compare different motor options and pricing
from a database of motors from 18 manufacturers.
Variable Speed Drives (VSDs)
Variable-frequency drives (VFDs) are the most common form of variable-speed
drive (VSD) currently found in commercial pumping applications. However, VSD
technologies like eddy-current clutches, hydraulic clutches, and variable-pitch-
diameter-belt systems may be found in retrofit applications.
Regardless of the technology, properly applied VSDs can improve the overall ef-
ficiency of the system served by the pump. However, VSDs do introduce some cost.
A typical VFD has semiconductors along with cooling fans which reduce the effi-
ciency of a pump’s drive system. Also, not all motors are rated for use with a VSD.
The implications of these issues are discussed in the section on pump optimization.
Motors that are controlled by VFDs are subject to stresses that are created by the
non-sinusoidal waveform of a VFD. Specifics vary with the technology used by the
Page 8 A Field Perspective: Centrifugal Pump Application and Optimization
drive, but in general, the harmonic content associated with the modified wave form
can affect the motor in several ways:
Heat generated by the harmonic losses associated with the motor’s iron
laminations and copper windings raises the motor temperature, shortening its
life (Houdek, n.d).
Motor efficiency is reduced by the losses generated by the harmonics (Houdek, n.d.).
Audible noise generated by the high-frequency harmonic content can annoy
occupants and tenants situated near the drive (Houdek, n.d.).
Voltage spikes stress the insulation in the motor, leading to premature failures
in motors not designed for use with VFDs (Stone, et al. 1999).
Eddy currents induced in the laminations and shaft of the motor cause pitting
and premature bearing failures as they flow through the bearings to ground
(Boyanton, n.d.).
Fortunately, VFD technology is constantly moving forward to address these prob-
lems. Where concerns exist, non-drive technologies can be applied to deal with the
issues. Most of these features are best accommodated during the design phase of a
project.
Load reactors can be installed on the load side of the drive to mitigate the
harmonic problems.
Pulse-width-modulated drives allow the carrier frequency to be adjusted as a
way of dealing with audible noise.
Motors can be equipped with shaft-grounding systems to allow eddy currents
to reach ground without going through the bearings.
Specifying that the motors be rated for use with variable-speed drives is recom-
mended for any project where drives will be applied. Requiring coordination with
motor and drive suppliers will also ensure compatibility and minimize problems.
Page 9A Field Perspective: Centrifugal Pump Application and Optimization
Mechanical Losses
Mechanical efficiency losses similar to those encountered in the prime mover occur
within the pump itself. Most of the losses result from friction in the bearings and
the drag induced on the impeller as it rotates in the fluid in the pump volute.
Leakage Losses
Because the pump is composed of a rotating impeller inside the fixed volute, clear-
ances must be maintained between the two to accommodate:
Manufacturing tolerances for the impeller and volute;
Expansion and contraction of materials associated with operating temperatures
that differ from those at the time of assembly;
Eccentricities in the shaft;
Flexing and lateral motion of the shaft related to the operating loads
experienced by the impeller.
Since the pressure at the discharge of the impeller is higher than the pressure at the
inlet, water circulates from the discharge through the clearances to the inlet. This
represents an efficiency loss since the water is moved by the impeller but is never
circulated to the system served by the pump.
Minimizing and controlling these clearances is a key efficiency factor of pump
design. Ensuring that they remain within the design tolerance helps ensure the
pump’s efficiency, so most manufacturers incorporate wear rings at one or more lo-
cations in the volute. These components provide an easily replaced surface between
the impeller and volute at key locations in the leakage path, allowing tight toler-
ances to be established, maintained, and eventually restored when contact with the
spinning impeller increases the clearance and reduces efficiency.
Wear rings are an optional rather than a standard feature with some manufacturers.
This allows a competitive advantage to be gained in a bidding environment where
minor differences in cost can determine who gets the job. Thus, the project specifi-
cations should require wear rings to ensure the persistence of the pump’s efficiency
Page 10 A Field Perspective: Centrifugal Pump Application and Optimization
and minimize the cost of maintaining that efficiency over time. Over the course of
the pump’s operating life, wear rings should be inspected and replaced, if necessary,
any time the pump is opened for service or if the performance level has decreased.
Hydraulic and Churning Losses
The complex flow patterns that occur as the pumped fluid changes direction, ac-
celerates, and decelerates while passing through a pump’s impeller cause hydraulic
and churning energy losses.
Interaction between the fluid and the walls of the chambers in the impeller and
volute causes frictional losses that vary with flow.
The velocity change that occurs as the fluid moves from the impeller to the
volute causes a shock loss that varies with flow.
Water exiting the impeller into the volute undergoes several similar changes, com-
plicated by the fact that the motion of the water in the volute creates a spinning
velocity field that accelerates the flow toward the pump discharge.
The Cumulative Effect of Pump Efficiency Losses
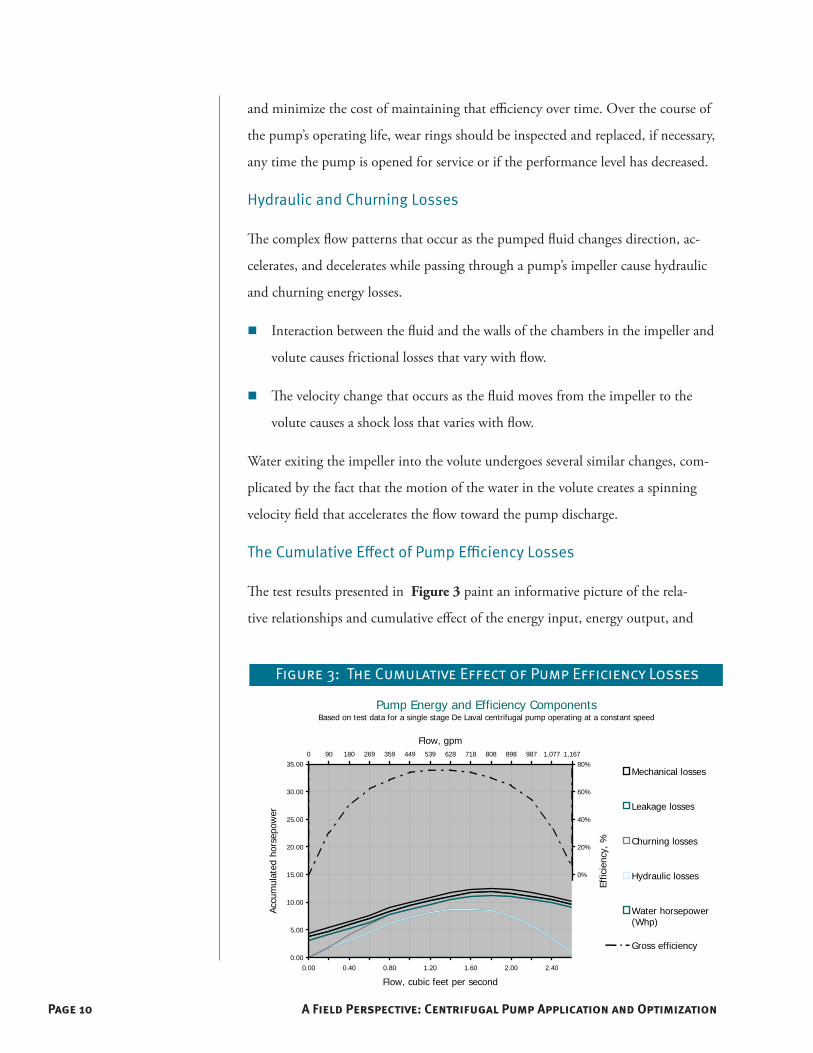
The test results presented in Figure 3 paint an informative picture of the rela-
tive relationships and cumulative effect of the energy input, energy output, and
Figure 3: The Cumulative Effect of Pump Efficiency Losses
Pump Energy and Efficiency ComponentsBased on test data for a single stage De Laval centrifugal pump operating at a constant speed
0.00
5.00
10.00
15.00
20.00
25.00
30.00
35.00
0.00 0.40 0.80 1.20 1.60 2.00 2.40
Flow, cubic feet per second
Accu
mul
ated
hor
sepo
wer
-60%
-40%
-20%
0%
20%
40%
60%
80%0 90 180 269 359 449 539 628 718 808 898 987 1,077 1,167
Flow, gpm
Effic
ienc
y, %
Mechanical losses
Leakage losses
Churning losses
Hydraulic losses
Water horsepower(Whp)
Gross efficiency
Page 11A Field Perspective: Centrifugal Pump Application and Optimization
efficiency losses for a centrifugal pump (Daugherty, 1915). Note that items like
leakage and mechanical losses are fairly constant regardless of flow while hydraulic
losses and power vary with flow. For a given pump, there will be only one specific
operating point associated with the pump’s peak efficiency.
Pump Performance
To optimize the performance of pumps and pumping systems, one must first under-
stand how performance is characterized. The performance of a pump is described and
communicated graphically by a pump curve. This pump curve is matched to a system
curve, which describes the performance of the piping system, to determine the point
at which the pump and system will operate. Both the pump and system curves can be
manipulated to ensure that the operating point will be optimal.
Pump Curves
Pump performance is typically portrayed with a pump curve plotting head (the dif-
ferential pressure developed across the pump) on the vertical axis against flow on the
horizontal axis. A specific relationship will exist between head and flow for a fixed
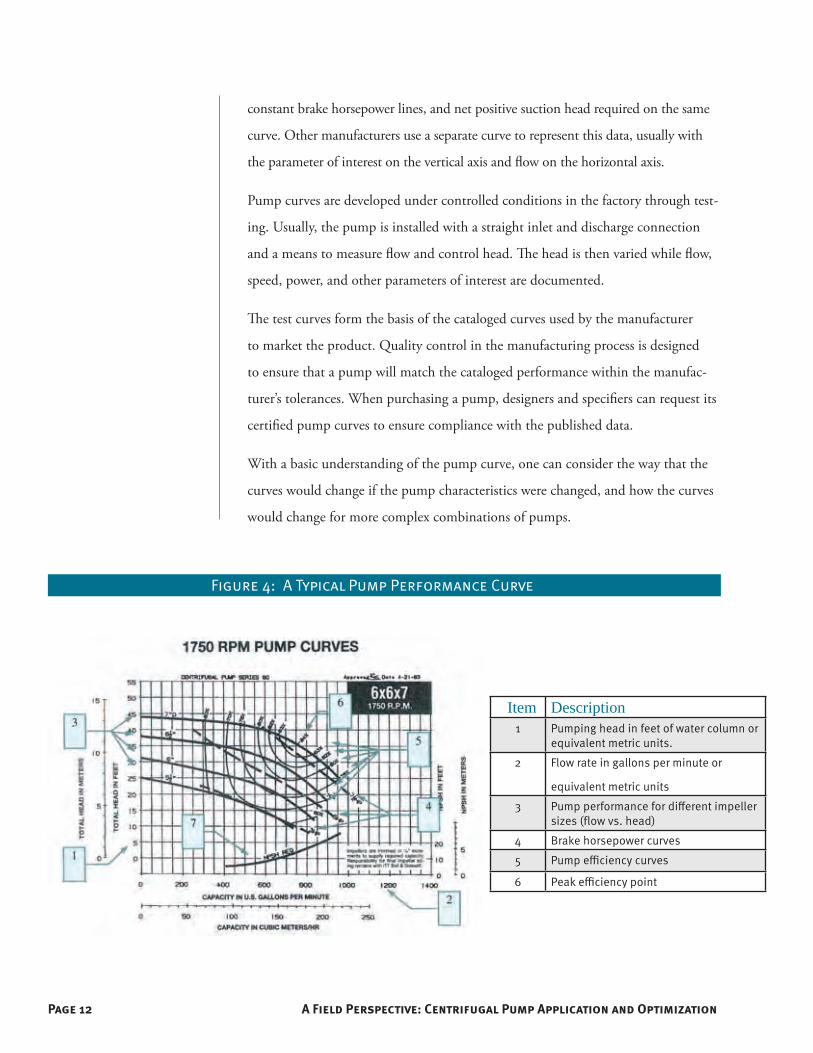
pump speed and a given impeller size. Figure 4 illustrates a typical pump curve. A
family of curves for different impeller sizes are shown together for a given size pump
operating at a given speed. Some manufacturers also plot constant efficiency lines,
Throughout this design brief, an example will be used to illustrate the optimization
principles that are described.
This building, located in San Francisco, was originally intended to be a relatively
efficient building. However, subsequent retrocommissioning revealed a host of
lost opportunities for efficiency, some of which were addressed through retrocom-
missioning, and others of which can never be recaptured.
Content related to the example will be highlighted in light blue, just like this side-
bar, to make it easy to distinguish from the more general content in the guideline.
A Pump Optimization Example
Page 12 A Field Perspective: Centrifugal Pump Application and Optimization
constant brake horsepower lines, and net positive suction head required on the same
curve. Other manufacturers use a separate curve to represent this data, usually with
the parameter of interest on the vertical axis and flow on the horizontal axis.
Pump curves are developed under controlled conditions in the factory through test-
ing. Usually, the pump is installed with a straight inlet and discharge connection
and a means to measure flow and control head. The head is then varied while flow,
speed, power, and other parameters of interest are documented.
The test curves form the basis of the cataloged curves used by the manufacturer
to market the product. Quality control in the manufacturing process is designed
to ensure that a pump will match the cataloged performance within the manufac-
turer’s tolerances. When purchasing a pump, designers and specifiers can request its
certified pump curves to ensure compliance with the published data.
With a basic understanding of the pump curve, one can consider the way that the
curves would change if the pump characteristics were changed, and how the curves
would change for more complex combinations of pumps.
Figure 4: A Typical Pump Performance Curve
Item Description1 Pumping head in feet of water column or
equivalent metric units.
2 Flow rate in gallons per minute or
equivalent metric units
3 Pump performance for different impeller sizes (flow vs. head)
4 Brake horsepower curves
5 Pump efficiency curves
6 Peak efficiency point
Page 13A Field Perspective: Centrifugal Pump Application and Optimization
Pump Affinity Laws
Curves for different impeller sizes can be developed from the test data for a single impel-
ler size because there is a mathematical relationship between all the properties of a pump,
referred to as the “Pump Affinity Laws.” The pump affinity laws can be used to predict the
performance of pump at a different speed or with a different impeller diameter if the perfor-
mance is known at a specific speed and with a specific impeller diameter. The laws state that:
Pump flow will vary directly with speed or impeller diameter:
Pump head varies directly with the square of the flow, speed, or impeller diameter:
Pump brake horsepower varies directly with the cube of the flow, speed, or
impeller diameter:
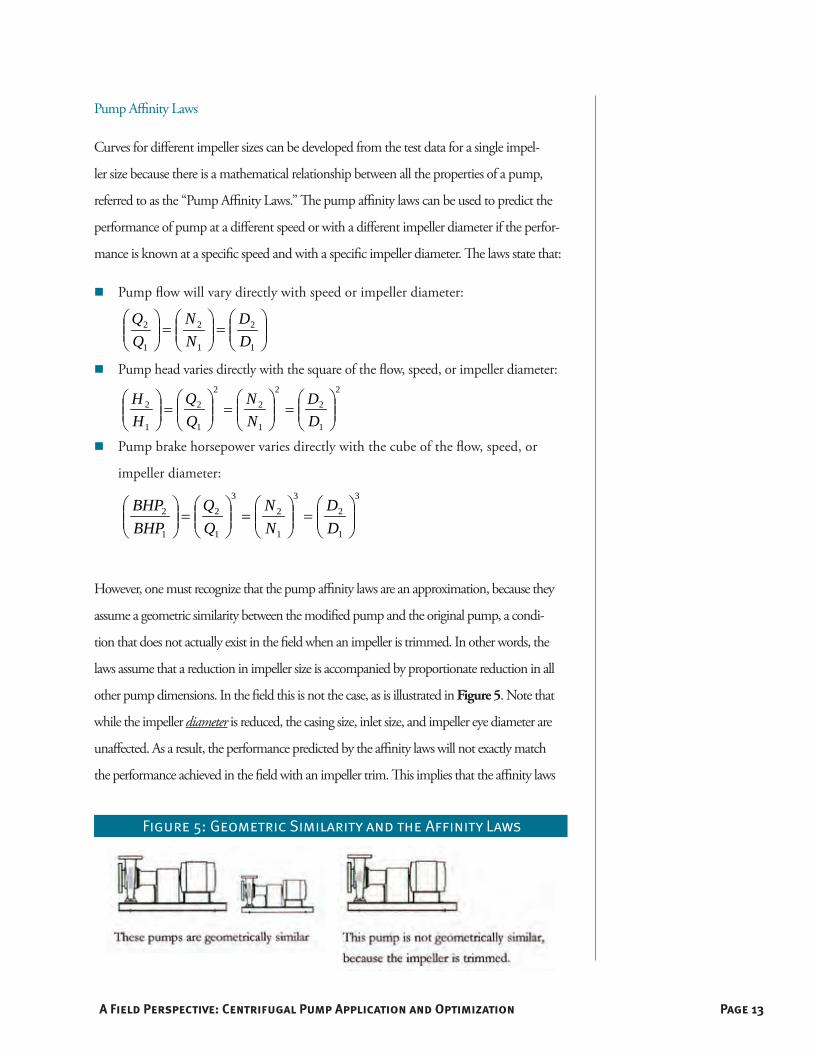
However, one must recognize that the pump affinity laws are an approximation, because they
assume a geometric similarity between the modified pump and the original pump, a condi-
tion that does not actually exist in the field when an impeller is trimmed. In other words, the
laws assume that a reduction in impeller size is accompanied by proportionate reduction in all
other pump dimensions. In the field this is not the case, as is illustrated in Figure 5. Note that
while the impeller diameter is reduced, the casing size, inlet size, and impeller eye diameter are
unaffected. As a result, the performance predicted by the affinity laws will not exactly match
the performance achieved in the field with an impeller trim. This implies that the affinity laws
=
=
1
2
1
2
1
2
DD
NN
2
1
2
2
1
2
2
1
2
1
2
=
=
=
DD
NN
HH
3
1
2
3
1
2
3
1
2
1
2
=
=
=
DD
NN
BHPBHP
Figure 5: Geometric Similarity and the Affinity Laws

Page 14 A Field Perspective: Centrifugal Pump Application and Optimization
should be used with caution only to make modest changes to the pump from a published
pump curve, and that the revised operating point should be verified by testing. Some manufac-
turers test their pumps with all available impeller sizes to address this issue.
Density, Temperature, and Viscosity Impacts
When pump curves are plotted as foot-pounds of energy per pound of fluid
pumped (or simply head in feet), the impeller curves are independent of fluid
temperature and density. However, density will affect the brake horsepower require-
ment in direct proportion to the ratio of the specific gravity of the fluid that will be
pumped and the specific gravity of the fluid used to test the pump (typically water
at standard conditions with a specific gravity of 1.0).
Viscosity will also affect pump performance. For most HVAC applications, the
effect of viscosity will only have to be considered if the viscosity of the fluid is
significantly different from the viscosity of water between 40 and 400°F. Viscosity
effects should be considered for systems with fluids whose viscosities are consider-
ably different than water, such as glycol solutions often used for freeze protection.
Increased viscosity tends to shift the high flow end of the pump curve down and
to the left due to the increased shear forces associated with the more viscous fluid.
Higher viscosity will also increase the pumping horsepower requirement due to the
increased drag of the rotating parts of the pump, although the effect is not linear.
If viscosity is to be considered, correction factors can be used (using nomographs
published by the Hydraulic Institute, as described, for example, in Bell and Gossett
1992, Buffalo Pumps 1959, durion Company 1976, and Karassick 1976).
In addition to these direct effects on performance, consideration of density, tem-
perature, and viscosity should include:
Pump characteristics—motor insulation class, lubricant, and material
choices—should all reflect expected operating temperatures,
Net Positive Suction Head requirements: higher temperatures affect the vapor
pressure of the fluid, resulting in the potential for cavitation at lower suction pressures,
Flow-rate requirements: differences in density and specific heat relative to
Page 15A Field Perspective: Centrifugal Pump Application and Optimization
water will often require a higher flow rate to convey the same amount of en
ergy, and
Head requirements: piping friction varies between fluids, so the pumping head
requirement will vary if a fluid other than water is used.
Low Flow Limitations
Pumps encounter limiting conditions when operating at both ends of the pump
curve. At the low-flow end, the limiting condition is the head associated with no
flow, commonly called the shut-off head of the pump. This operating point can be
measured by fully closing the pump’s discharge valve and documenting the differ-
ential pressure generated by the pump while moving no water. This can be accom-
plished safely for a centrifugal pump because it relies on centrifugal force to move
water through the impeller rather than a positive displacement mechanism like a
piston. However, the following cautions should be observed:
Before testing, verify that the peak pressure that could be generated by the
pump with its largest impeller is lower than the rated pressure of the pump
casing and all components between the casing and the throttling valve.
Minimize the duration of the test because even though the pump is not
moving any water (beyond what is recirculated through clearances) it is doing
work on the water confined in the pump casing. Eventually, this work will
appear as heat, and prolonged operation with the discharge valve closed could
produce temperatures high enough to boil the liquid, and damage the pump.
The test works because, for a given impeller size at a given speed, there is a very
specific shut-off head. If the impeller size is unknown but the tester is reasonably
confident that the wear rings and impeller are in good shape, then the differential
pressure generated by the test identifies the 0 gpm flow rate produced by the impel-
ler and thus its size. If the tester knows the impeller size, then the test can be used
to assess the condition of the wear rings and impeller; if the pump fails to deliver
the pressure associated with 0 gpm, then excessive clearance at the wear rings or
pitting of the impeller might exist, indicating a loss of pump efficiency.
Page 16 A Field Perspective: Centrifugal Pump Application and Optimization
High Flow Limitations
The limiting conditions at the high-flow end of the pump curve are related to
noise, cavitation, and the potential for overloading the motor serving the pump.
The noise and cavitation issues are related to the net positive suction head issue
discussed in As the flow rate increases, the fluid velocity increases and its pressure
decreases, creating the potential for cavitation at the eye of the impeller.
Addressing Limiting Conditions
Pump design and operation should consider the limits of the pump curve on sys-
tem operation. Systems that operate for sustained periods at or near shut-off head
may require recirculation lines with regulating valves to limit maximum pressures.
Pumps serving variable-flow systems are examples of this situation. Another option
for limiting the detrimental effect of operating at or near shut-off head is to install
thermal relief valves on the pump casing. These valves open and allow a small
quantity of water to flow through the pump when their setpoint temperature is
reached. They are often found on booster pumps serving domestic-water systems.
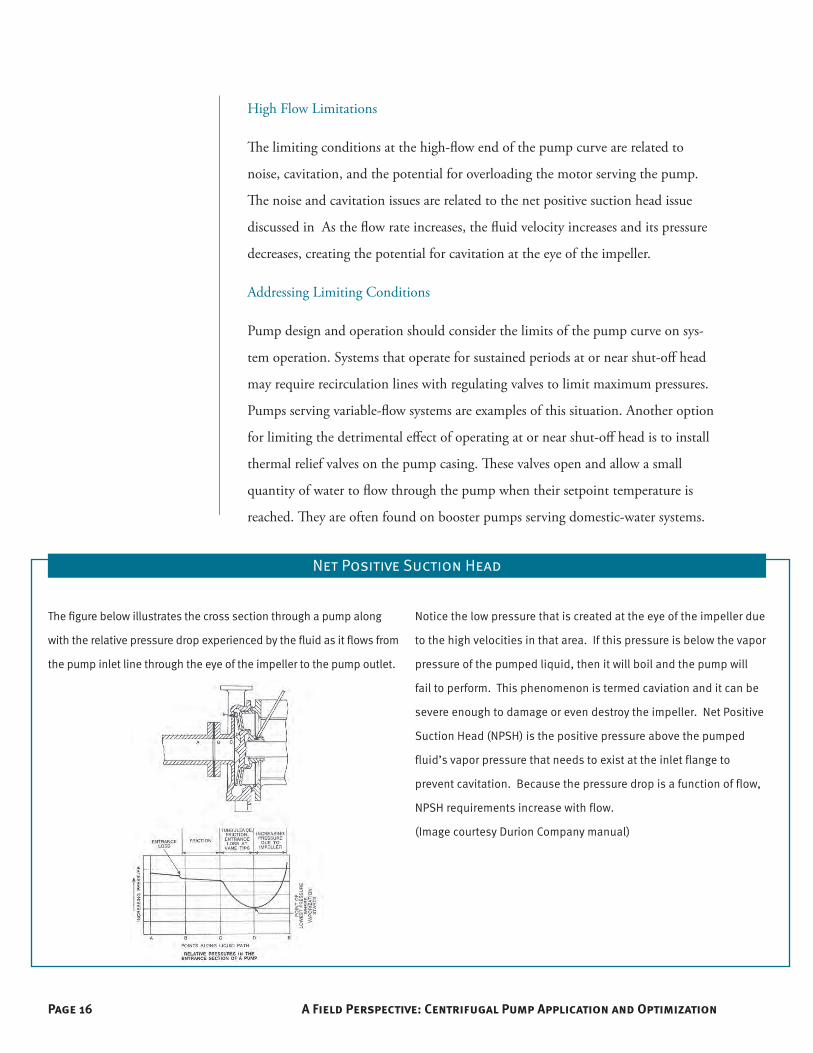
The figure below illustrates the cross section through a pump along
with the relative pressure drop experienced by the fluid as it flows from
the pump inlet line through the eye of the impeller to the pump outlet.
Notice the low pressure that is created at the eye of the impeller due
to the high velocities in that area. If this pressure is below the vapor
pressure of the pumped liquid, then it will boil and the pump will
fail to perform. This phenomenon is termed caviation and it can be
severe enough to damage or even destroy the impeller. Net Positive
Suction Head (NPSH) is the positive pressure above the pumped
fluid’s vapor pressure that needs to exist at the inlet flange to
prevent cavitation. Because the pressure drop is a function of flow,
NPSH requirements increase with flow.
(Image courtesy Durion Company manual)
Net Positive Suction HeadThe figure below illustrates the cross section through a pump along with the relative pressure

Page 17A Field Perspective: Centrifugal Pump Application and Optimization
High flow rates can occur if the head in the system is lower than anticipated, for
example when pumps are piped in parallel and only one pump is operating. In this
case, the pump will “run out the curve,” that is, the operating point will shift down
and to the right on the impeller line. When this occurs, the required horsepower
can exceed the motor’s capacity, causing the motor to trip its overloads. To avoid
this problem, a larger motor can be installed that will sustain the operation of the
pump at any point on its curve: a “non-overloading” motor. Because this higher-ca-
pacity motor will run not fully loaded even under design conditions, there will be a
minor efficiency penalty. But the part-load efficiency curve for most motors is fairly
flat until about 50% load, so the penalty may not be significant. In addition, the
efficiency of larger motors is typically a few points higher than that of smaller mo-
tors. Essentially, selecting a non-overloading motor prevents operational problems
and only slightly reduces efficiency.
System Curves
For a fixed-piping network, there will be a specific relationship between the flow
through the network and the head or pressure required to produce the flow, regard-
less of the pump used. Plotting the system head requirement against system flow
generates a system curve that defines how the pump will interact with the system.
If the system curve is plotted on the same axes as the pump curve, the point where the sys-
tem curve and the pump curve intersect will be the resulting system operating point. One
of the primary goals of a pumping-system design is to select a pump so that the system
curve and the pump curve intersect at or very near the peak-efficiency point of the pump.
Figure 6 shows the pump curves from Figure 4 with a system curve superimposed.
The “Design” point shows a pump that was selected to deliver 550 gpm at about
40ft.w.c. Note the following about the conditions at the design point, all of which
can be read from the pump curve by interpolating between the data lines:
The required impeller size is 7 inches
The pump efficiency is about 78%.
The required brake horsepower is just under 7.5.

Page 18 A Field Perspective: Centrifugal Pump Application and Optimization
After one operating point is established, the entire system curve can obtained by
plotting points using the following equation, often referred to as the “square law.” 2
1
2
1
2
=
HH
Although by coincidence the equation is the same as one of the pump affinity
laws, it actually has its roots in the Darcy-Weisbachequation for flow in pipes.
The exponent of 2 assumes fully developed turbulent flow. This condition does
not exist at all times in HVAC systems and recent research suggests that an ex-
ponent of 1.85 is more appropriate. However, using an exponent of 2 is often
close enough for field analysis, and also allows the curve to be quickly plotted
from the design point.
The system curve only applies to a fixed-piping network. If a valve is throttled
or a component in the system is changed, then a new system curve is estab-
lished. Variable-flow systems actually operate over a range of system curves.
For these systems, considering the movement of the operating point along the
pump curve as operating conditions change is important during design.
Figure 6: Typical Pump Performance Curve and System Curve
Page 19A Field Perspective: Centrifugal Pump Application and Optimization
Developing and analyzing system curves can provide insight into how a pumping system
will perform (or why it is failing to perform as intended). The Bell and Gossett Pump Engi-
neering Manual discusses system curves in depth and is an excellent resource for understand-
ing pump curves, system curves, and their applications in engineering design and analysis.
The next sections describe how system curves differ for a couple of special situa-
tions frequently seen in HVAC systems.
Open Systems
The system curve discussed above is based on a closed system; that is, a system that
is not open to atmosphere. Chilled and hot-water systems for commercial buildings
are typically (but not always) closed systems and their pumps only need to provide
the energy necessary to overcome the resistance due to flow. Changes in elevation
have no impact on the pump energy requirement because the weight of the water
in the supply riser to the top of the building is balanced by the weight of the water
in the return riser coming back down.
Open systems have a break in the piping circuit that opens them to atmosphere.
Pumps serving these systems must also provide the energy to lift the water through
any unbalanced changes in elevation in addition to the energy to overcome resis-
tance due to flow. The static lift in a cooling-tower circuit is a good example. The
system curve for this application will not pass through 0 ft.w.c. at 0 flow.; rather,
the curve is created by adding the static lift to the friction-related head at all oper-
ating points. A fixed resistance like a pressure regulator or flow-control valve will
also shift a system curve from the 0-0 point by an amount equal to the constant
resistance it generates in the system.

Page 20 A Field Perspective: Centrifugal Pump Application and Optimization
The pump and system curve shown here are for the example system, designed to
deliver 1,100 gpm at 40.5 ft.w.c. at design. Note the following:
� At design, each pump will be delivering 550 gpm at 40.5 ft.w.c. at 78%
efficiency using approximately 6.5 bhp each (Points A and B).
� The design flow rate is delivered for approximately 13 bph (2 times 6.5).
� If one pump fails, the system performance shifts to point C, providing 82% of
design flow using only one pump which will draw something in excess of 7.5
bhp.
If the required performance with one pump running is only 50% of the design
requirement, then this condition could be met using less than 3 bhp (point D). A
situation like this is common in HVAC applications where parallel chillers or boilers
are piped to a common header to serve a common distribution system. In another
example, the pump was sized to serve one chiller delivering a nominal 2,800 gpm
at 120 ft.w.c. Field testing revealed that it could in fact deliver nearly 4,300 gpm at
80 ft.w.c. when operated against the wide open system. This pump may be able
serve both chillers on its own, saving significant pump energy over the original
design intent that involved running two pumps.
Example of Pumps in Parallel

Page 21A Field Perspective: Centrifugal Pump Application and Optimization
Series and Parallel Pumping Systems
When two pumps are piped in parallel, the suction and discharge connections for
the two pumps reference the same pressure. Thus, the points on the pump curve
for two parallel pumps are created by adding the flow of the individual pumps at a
constant head. Figure 7 illustrates pump curves for two identical pumps in parallel.
Arranging pumps in series is less common in HVAC applications. When two
pumps are piped in series, all of the water that flows through one must flow
through the other. Thus, the points on the pump curve for two series pumps are
created by adding the head of the individual pumps at constant flow (see Figure 7).
The faded teal line is the
curve for one pump. The
dark teal line is the curve
for two of those pumps
piped in parallel.
The faded teal line is the
curve for one pump. The
dark teal line is the curve
for two of those pumps
piped in series.
Figure 7: Creating a Curve for Series and Parallel Pumps
Constant Head
Constant Flow
A Curve for Dissimilar Pumps in Parallel
Page 22 A Field Perspective: Centrifugal Pump Application and Optimization
The interaction of parallel pumps with the system creates challenges but also
provides unique opportunities to the design and operating team. Due diligence
must be exercised when applying pumps with dissimilar characteristic curves in
parallel. Under some operating conditions, the pump with the higher head rating
can generate sufficient pressure to shut off flow from the other pump. When the
system geometry hides the parallel arrangement, mysterious, intermittent operating
problems can occur. Similar considerations apply to pumps in series.
Selecting Pumps
Designers identify the needs of their system, and try to select a matching pump
from a manufacturer’s product line. The key to specifying an efficient pump is to
do so in terms of fundamentals including the required flow and head, the mini-
mum acceptable pump and motor efficiency and motor power factor, and the
maximum acceptable brake horsepower and speed, as well as configuring other
factors such as inlet diffusers and balancing valves. Specifications prepared this
way ensure that the efficiency envisioned by the design is realized at bid time while
leaving manufacturers free to exploit their strong point. Section 144 (a) of 2008
Title 24 talks about prescriptive requirements in general for sizing building HVAC
equipment and section 144 (j) talks about pump sizing in particular.
Establishing the Flow Requirement
Pumps should be selected based on the amount of head necessary to produce the
flow required by the load when it is served by the piping network. The piping net-
work is defined by the physical arrangement of the pump and the system.
The flow rate can be mandated by an equipment manufacturer to ensure proper
performance of their machinery, or it can be determined by the designer. In
HVAC, the flow is typically provided to handle some sort of heat-transfer process
and will generally be a function of:
the energy released or absorbed by the heat-transfer process,
the physical properties of the fluid that is circulated by the pump, and
the heat-transfer characteristics of the equipment served by the pump used
Page 23A Field Perspective: Centrifugal Pump Application and Optimization
to handle the load.
If water is being circulated through one side of a heat exchanger in an HVAC process,
then the following equation can be used to solve for gpm—the required flow rate:
where: Q = the thermal energy transferred to or from the water stream in Btu/hr, 500 = a units conversion constant to account for the properties of water at the conditions normally encountered in HVAC systems, gpm = the water flow rate in gallons per minute, and ΔT = the temperature change created by the energy transfer to or from the water stream within the heat exchanger.
Once the load is known, designers will manipulate the characteristics of the heat-transfer
equipment to establish an optimum performance for both the pumping system and
the system it serves. For example, the circuiting and/or fin spacing associated with a
chilled-water coil might be manipulated while air- and water-side flow rates and entering
temperature are held constant. This is done to achieve a water-side temperature rise that
matches the design criteria associated with the chiller plant while providing a leaving-air
condition that meets the cooling and dehumidification loads on the air handling unit.
Similar considerations apply to the tube bundles associated with the condensers
and evaporators in chillers, the heat exchangers used to transfer heat from steam to
water in heating hot water systems, and the heat exchangers used to transfer heat
from boilers to the air or other fluid streams they serve.
Establishing the Head Requirement
The head required from a pump is determined by assessing the amount of energy
needed to move the flow circulating through the piping network from the pump to
the load and back again. For most systems, establishing the load and the physical
arrangement of the system occurs before establishing the head.
There are several techniques for assessing the required pumping head once the
required flow rate has been determined, including:
Q = 500 * gpm * ΔT

Page 24 A Field Perspective: Centrifugal Pump Application and Optimization
approximation (for early design consideration only),
A resort hotel water feature serves as a good example
of a pumping system with elevation changes in ad-
dition to other head requirements. The table below
illustrates the similarities and differences between the
different pump head estimating techniques described
in the text when applied to the water feature illustrated
here. Note how irrespective of technique, the pressure
loss through the centrifugal strainer and the head re-
quired to lift the water to the upper pools predominate.
Generally, this is true for most HVAC systems; i.e. the
equipment and, for open systems, elevation changes,
will dominate the pressure drop requirements unless
the piping network is extensive and operating at a high
flow rate relative to the line size.
Comparison of Pump Head Assessment Techniques
Field Estimate Manual Calculation PSIM ModelElevation change (30-40 ft)
30-40 Estimate based on observation
36 Based on drawing elevations between pools
37 Based on drawing elevations between pools plus distance above upper pool to top outlet
Pipe to pump suction (20-30 ft)
1-1 Distances paced off in the field and assessed at the 4 ft.w.c. per 100 lineal feet of pipe design rule
1 Scaled from the drawings 1 Scaled from the drawings
Fittings to pump suction (10-30 equivalent ft)
0-1 Added 50-100% more equiva-lent feet to the linear feet of pipe based on industry rule of thumb
1 Based on the piping isomet-ric and manufacturer’s data for valve losses
With above
Based on the piping isometric and program parameters for valve and fitting losses
Pipe to centrifugal seperator (10-15 ft)
0-1 Distances paced off in the field and assessed at the 4 ft.w.c. per 100 lineal feet of pipe design rule
1 Scaled from the drawings 5 Scaled from the drawings
Fittings to centifugal seperator (5-15 equivalent ft)
0-1 Added 50-100% more equiva-lent feet to the linear feet of pipe based on industry rule of thumb
3 Based on the piping isomet-ric, tables in the ASHRAE pocket handbook and manufacturer’s data for valve losses when available
With above
Based on the piping isometric and program parameters for valve and fitting losses
Centrifugal seperator
15-20 Estimate based on past experi-ence
12 Based on manufacturer’s data
12 Based on manufacturer’s data
Pipe to upper pool (100-120 ft)
4-5 Estimate based on observation 1 Scaled from the drawings 6 Scaled from the drawings
Fittings to up-per pool (10-15 equivalent ft)
0-1 Added 50-100% more equiva-lent feet to the linear feet of pipe based on industry rule of thumb
4 Based on the piping isomet-ric and manufacturer’s data for valve losses
With above
Based on the piping isometric and program parameters for valve and fitting losses

Page 25A Field Perspective: Centrifugal Pump Application and Optimization
take-off and manual calculation,
computer modeling, and
re-evaluation of head assessments in the field.
Approximation
Approximating pump head is useful in the early phases of design to establish
approximate pump sizes and electrical loads, as well as in the field to assess the
suitability of an existing pump given the existing conditions. It is often possible
to estimate the required head in a matter of minutes based only on the physical
distances between the components in the system. Refer to the HPAC article “Right-
sizing Pumping Systems” for an example of this technique (Sellers, 2005). When
using this approach, it is common to anticipate a range in which the pumping
head requirement might lie. Of course, more detailed methods of establishing head
requirements should always be used in later design phases.
Take-off and Manual Calculation
Before computers, a common approach to establishing the pumping head required
by an HVAC pumping system was to tabulate:
the lineal feet of pipe,
the number and type of fittings, and
the number, type and characteristics of the heat transfer and other
equipment elements.
Each element in the tabulation was assigned a pressure drop based on manufactures
data, published charts, and tables of flow coefficients. Adding up the pressure drops
associated with the various elements established the pump requirements. Chapter
36 in the 2005 ASHRAE Handbook of Fundamentals contains the tables and charts
needed for such a calculation.
Computer Modeling
There are several computer programs that let you model and assess simple piping

Page 26 A Field Perspective: Centrifugal Pump Application and Optimization
networks. One such program is the Pumping System Improvement Modeling Tool,
available at no cost from the Pump Systems Matter Initiative website, (www.Pump-
SystemsMatter.org). There are also commercially available programs like Pipe-Pro™
which let you assess more complex piping networks in great detail.
Re-evaluation of Head Assessments in the Field
During construction, the facility staff and commissioning provider can use a copy
of the pump head calculation to assess and verify design intent. Construction ob-
servation can verify that the installed piping configuration matches the design, so
that any discrepancy can be addressed before the installation has progressed too far.
If construction-phase testing reveals that performance does not match expecta-
tions, the pressures in the piping circuit can be measured and compared to those
used during design. Significant deviations often indicate the source of the problem,
which can include a fabricated fitting instead of a factory fitting, debris caught
inside of the pipe, or a field arrangement that differs from the design intent.
Selecting the Pump
Knowing the head and flow rate required at the design operating point, you can select a pump.
Review the pump curves for pumps with the desired characteristics, and a select a pump with
a design operating point that achieves maximum efficiency. This point will not necessarily lie
neatly on one of the shown impeller curves, so you may need to select the next largest impeller
size (and throttle the pump discharge slightly to achieve the required flow rate).
Selecting the Motor
You can use the pump power equation to select the required motor size. The brake
horsepower at the maximum expected flow is the power that the motor must be
able to supply. In most instances, the result of this calculation will not exactly
match one of the commercially available incremental motor sizes (1 hp, 1.5 hp,
2 hp, 3 hp, 5 hp, etc.) and the pump will be equipped with the next larger standard
motor size. In some situations, the motor may be two or even three sizes larger than
the calculations suggest, which results in non-overloading performance (described
earlier, under “Addressing Limiting Conditions”).
Page 27A Field Perspective: Centrifugal Pump Application and Optimization
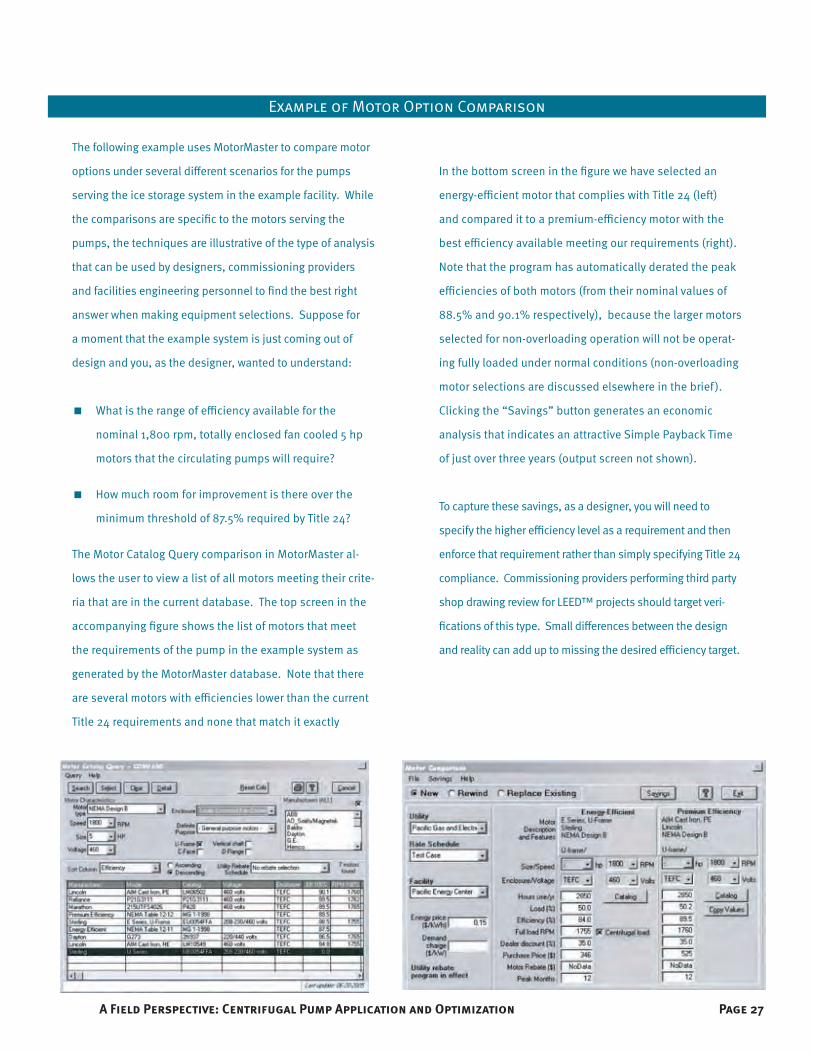
Example of Motor Option Comparison
The following example uses MotorMaster to compare motor
options under several different scenarios for the pumps
serving the ice storage system in the example facility. While
the comparisons are specific to the motors serving the
pumps, the techniques are illustrative of the type of analysis
that can be used by designers, commissioning providers
and facilities engineering personnel to find the best right
answer when making equipment selections. Suppose for
a moment that the example system is just coming out of
design and you, as the designer, wanted to understand:
� What is the range of efficiency available for the
nominal 1,800 rpm, totally enclosed fan cooled 5 hp
motors that the circulating pumps will require?
� How much room for improvement is there over the
minimum threshold of 87.5% required by Title 24?
The Motor Catalog Query comparison in MotorMaster al-
lows the user to view a list of all motors meeting their crite-
ria that are in the current database. The top screen in the
accompanying figure shows the list of motors that meet
the requirements of the pump in the example system as
generated by the MotorMaster database. Note that there
are several motors with efficiencies lower than the current
Title 24 requirements and none that match it exactly
In the bottom screen in the figure we have selected an
energy-efficient motor that complies with Title 24 (left)
and compared it to a premium-efficiency motor with the
best efficiency available meeting our requirements (right).
Note that the program has automatically derated the peak
efficiencies of both motors (from their nominal values of
88.5% and 90.1% respectively), because the larger motors
selected for non-overloading operation will not be operat-
ing fully loaded under normal conditions (non-overloading
motor selections are discussed elsewhere in the brief).
Clicking the “Savings” button generates an economic
analysis that indicates an attractive Simple Payback Time
of just over three years (output screen not shown).
To capture these savings, as a designer, you will need to
specify the higher efficiency level as a requirement and then
enforce that requirement rather than simply specifying Title 24
compliance. Commissioning providers performing third party
shop drawing review for LEED™ projects should target veri-
fications of this type. Small differences between the design
and reality can add up to missing the desired efficiency target.

Page 28 A Field Perspective: Centrifugal Pump Application and Optimization
Pump Options
Well thought-out pump sizing is only part of pump selection. Equally crucial are
the configuration and features of the connections between the pump and the pip-
ing network, equipment, and system it serves. For the trim and fittings, “the devil is in
the details” where cost/benefit and functionality are concerned. Knowledge of the oper-
ating criteria associated with the system is also key. Most manufacturers have lists of op-
tional features for their stock offerings that allow the application engineer to influence
pump design—features like seals, coupling, and wear rings. By selecting the features
and options that are appropriate to their project, application engineers can influence
some parameters of the pump design in a way that will ensure its long-term efficiency
and operability, without having direct control over the details of the pump design.
Valves
Virtually every pump installation will require some sort of isolation and throttling
device on the pump discharge. For parallel pumps, preventing backflow is also
necessary. One approach to providing these functions is to install a service valve, a
balancing valve, and a check valve. Such an approach uses off-the-shelf items but
requires that each device be installed separately. In the larger pipe sizes, this means
that each device will require a set of flanges and the associated welds, bolts, and
gaskets that can be costly and labor intensive. To improve economy, several manu-
facturers have developed combined valves that provide all three functions. Some
manufacturers use one set for all functions while others provide a separate valve seat
for the check-valve function. The “one seat does it all” approach (illustrated in ) has
advantages and disadvantages. On one hand, it minimizes the size and number of
components required to fabricate the valve and thus, its cost. On the other hand,
if the seat fails, then all functionality is lost, including the isolation function. As a
result, repairing a seat failure that causes backflow through the standby pump in a
parallel pump application will require a system outage, in contrast to a system that
uses a valve with a separate seat and disc to provided the isolation function. The use
of independent components also addresses this problem.

Page 29A Field Perspective: Centrifugal Pump Application and Optimization
Figure 8: Options for Valves
This is a picture of a combined
function valve prior to installation.
Combined Function Valve
This is a close-up of the dis-
charge showing the check valve
spring and valve actuating
handle.
Discharge Connection
This is a close-up of the inlet
showing the valve disc situated
in the valve seat.
Inlet Connection

Page 30 A Field Perspective: Centrifugal Pump Application and Optimization
Figure 8 compares pressure loss vs. flow for 4-inch combined-function valves from different
manufacturers and compares a wide-open butterfly valve (which can serve as an isolation
valve and a throttling valve) with a globe-type check valve. The dashed lines show the normal
operating range in terms of flow for a 4-inch line. Note that there are significant differences
between the manufacturers. Also note that a similar analysis for another line size would result
in a different ranking for the manufacturers in terms of lowest to highest pressure drop.
The table in Figure 8 illustrates the difference in operating costs. Data for 10-inch
valves with similar pressure drop characteristics at the low and high end of their appli-
cation range area also shown. Note that the difference in pressure drop can result in
a significant difference in operating cost for two equivalent valves if the only require-
ments are function (isolation/throttling/check valve) and size. The pressure difference
could also mean the pump selection misses the peak-efficiency point on its curve and,
in an extreme case, may even mean the pump can not deliver design flow.
Suction Diffusers
Pumps require a uniform velocity profile entering the impeller to ensure factory-rated
Example of The Impact of Pump Components
Field inspection of the pump at the example facility revealed
that the pump was furnished with both a suction diffuser
and a strainer. Since the suction diffuser accomplishes the
strainer function, the strainer represents a first and operat-
ing cost that could have been avoided. Specifically, a more
detailed design review or construction observation process
could have saved the owner approximately $500 in first
cost and over $1,000 in operating costs by eliminating the
strainers from both pumps in the system. These savings
alone would have paid for the time necessary for a commis-
sioning provider to perform design review.
When the strainer and suction diffuser were opened up to in-
spect their screens and eliminate the screen from the strainer
(and thus the energy burden associated with its pressure
drop) the commissioning team discovered that the fine mesh
start-up screens were still in place. While desirable during
initial flushing, fine meshed screens in a closed system that
has been thoroughly flushed and cleaned typically represent
an unnecessary pressure drop. Eliminating the fine screen
while retaining the coarse screen in the strainer or suction
diffuser subsequent to initial system flushing will ensure that
things like valve plugs and other large items that might come
loose during the operating life of the system are intercepted
before they can damage the pump. Even in an open system,
some facilities engineering teams find it desirable to run with
only the coarse screens once the initial clean-up process has
been completed since the fine screens can become plugged
with sediment and other fine debris that would otherwise
circulate freely and could be dealt with by some other means.

Page 31A Field Perspective: Centrifugal Pump Application and Optimization
performance. Generally, this can be achieved by installing the pump with 5-10 equiva-
lent diameters of straight pipe leading up to the inlet connection. Unfortunately, this
requirement can consume a considerable amount of space in the equipment room. Suc-
tion diffusers allow the space to be reclaimed while ensuring design performance. Most
manufacturers will guarantee their cataloged performance if their pump is used with the
appropriate suction diffuser from their product line. This assurance is generally achieved
by three suction-diffuser design characteristics.
The portion of the device where the water makes the turn is generally enlarged
relative to the line size and incorporates a strainer. The enlargement reduces the
water velocity and thus the pressure drop while the strainer element acts as a diffuser.
The outlet of the chamber with the strainer includes a straightening vane
designed, to ensure that a uniform velocity profile enters the eye of the pump’s impeller.
The strainer included with the device eliminates the need for a separate
strainer, providing a modest cost savings by eliminating a part and a pair of
flan ges on larger pipe sizes. illustrates a typical suction diffuser
installed in a piping system as well as its internal construction.
Figure 9: Suction Diffusers
This is a picture of a
suction diffuser in-
stalled in the field.
Installed Suction DiffuserThe screen occupies
the area indicated by
the shading. Flow is as
indicated by the arrow.
Suction Diffuser Strainer
Straightening vanes
(circled) ensure a uni-
form velocity profile into
the impeller eye.
Suction Diffuser Guide Vanes

Page 32 A Field Perspective: Centrifugal Pump Application and Optimization
Flange Taps
Pump performance should be measured in a manner that matches the technique
used at the factory to develop the pump curves. Flange taps ensure that the mea-
surement point duplicates the point used for the factory test, so installing flange
taps is crucial in meeting this goal. Locating the taps in the piping ahead of and
after the pump will not provide identical results, especially if there are fittings be-
tween the tap and the pump flange. Since pump performance is based on differen-
tial pressure, one gauge is actually better for assessing the operating point because
the gauge error will be canceled out when the readings are subtracted. This provides
an opportunity for value engineering that also adds rather than detracts from its
operational value. illustrates how one gauge can be piped to pick up the necessary
pressures, including the pressure ahead of the strainer. Note how three ¼-inch ball
valves (circled) and a piping network allow one gauge to read multiple pressures.
Figure 10: Flange Taps to Measure Pressure
Page 33A Field Perspective: Centrifugal Pump Application and Optimization
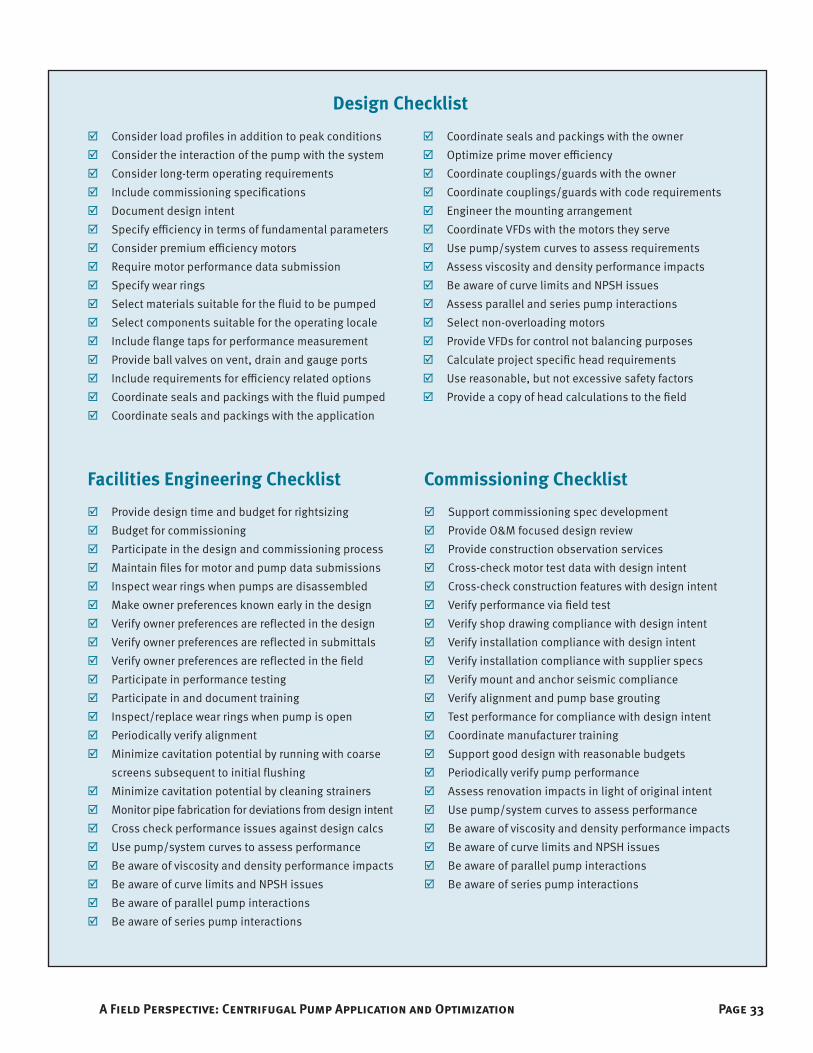
; Consider load profiles in addition to peak conditions
; Consider the interaction of the pump with the system
; Consider long-term operating requirements
; Include commissioning specifications
; Document design intent
; Specify efficiency in terms of fundamental parameters
; Consider premium efficiency motors
; Require motor performance data submission
; Specify wear rings
; Select materials suitable for the fluid to be pumped
; Select components suitable for the operating locale
; Include flange taps for performance measurement
; Provide ball valves on vent, drain and gauge ports
; Include requirements for efficiency related options
; Coordinate seals and packings with the fluid pumped
; Coordinate seals and packings with the application
; Coordinate seals and packings with the owner
; Optimize prime mover efficiency
; Coordinate couplings/guards with the owner
; Coordinate couplings/guards with code requirements
; Engineer the mounting arrangement
; Coordinate VFDs with the motors they serve
; Use pump/system curves to assess requirements
; Assess viscosity and density performance impacts
; Be aware of curve limits and NPSH issues
; Assess parallel and series pump interactions
; Select non-overloading motors
; Provide VFDs for control not balancing purposes
; Calculate project specific head requirements
; Use reasonable, but not excessive safety factors
; Provide a copy of head calculations to the field
Commissioning Checklist
; Support commissioning spec development
; Provide O&M focused design review
; Provide construction observation services
; Cross-check motor test data with design intent
; Cross-check construction features with design intent
; Verify performance via field test
; Verify shop drawing compliance with design intent
; Verify installation compliance with design intent
; Verify installation compliance with supplier specs
; Verify mount and anchor seismic compliance
; Verify alignment and pump base grouting
; Test performance for compliance with design intent
; Coordinate manufacturer training
; Support good design with reasonable budgets
; Periodically verify pump performance
; Assess renovation impacts in light of original intent
; Use pump/system curves to assess performance
; Be aware of viscosity and density performance impacts
; Be aware of curve limits and NPSH issues
; Be aware of parallel pump interactions
; Be aware of series pump interactions
Facilities Engineering Checklist
; Provide design time and budget for rightsizing
; Budget for commissioning
; Participate in the design and commissioning process
; Maintain files for motor and pump data submissions
; Inspect wear rings when pumps are disassembled
; Make owner preferences known early in the design
; Verify owner preferences are reflected in the design
; Verify owner preferences are reflected in submittals
; Verify owner preferences are reflected in the field
; Participate in performance testing
; Participate in and document training
; Inspect/replace wear rings when pump is open
; Periodically verify alignment
; Minimize cavitation potential by running with coarse
screens subsequent to initial flushing
; Minimize cavitation potential by cleaning strainers
; Monitor pipe fabrication for deviations from design intent
; Cross check performance issues against design calcs
; Use pump/system curves to assess performance
; Be aware of viscosity and density performance impacts
; Be aware of curve limits and NPSH issues
; Be aware of parallel pump interactions
; Be aware of series pump interactions
Design Checklist

Page 34 A Field Perspective: Centrifugal Pump Application and Optimization
Other Features
Figure 11 details other pump features and configurations. The table in the figure shows
that application considerations can have a significant effect on efficiency, ease of mainte-
nance, and pump life. This implies that system designers and operating personnel can
have a significant effect in these areas even though they have no direct control over the
Figure 11: Pump Arrangements and Construction Features
End Suction
Horizontal Split Case
Vertical Split Case
Pump Construction Features
Component Application Impacts Notes
h O&M Life
1 - Volute/Casing 2, 3
2 - End Suction Impeller 3, 4, 11
3 - Double Suction Impeller 3, 4
4 - Vent 5
5 - Drain 6
6 - Wear Ring 4
7 - Mechanical Seal 3, 7
8 - Packing 3, 7
9 - Flushing Line 3, 8
10 - Bearings 3, 9
11 - Shaft and Slinger 3, 10, 11
12 - Gauge Taps 12
13 - Prime Mover 4
14 - Couplings and Gaurds 13
15 - Mount/Base 14
End Suction with Mechanical SealEnd Suction with Packing
Page 35A Field Perspective: Centrifugal Pump Application and Optimization
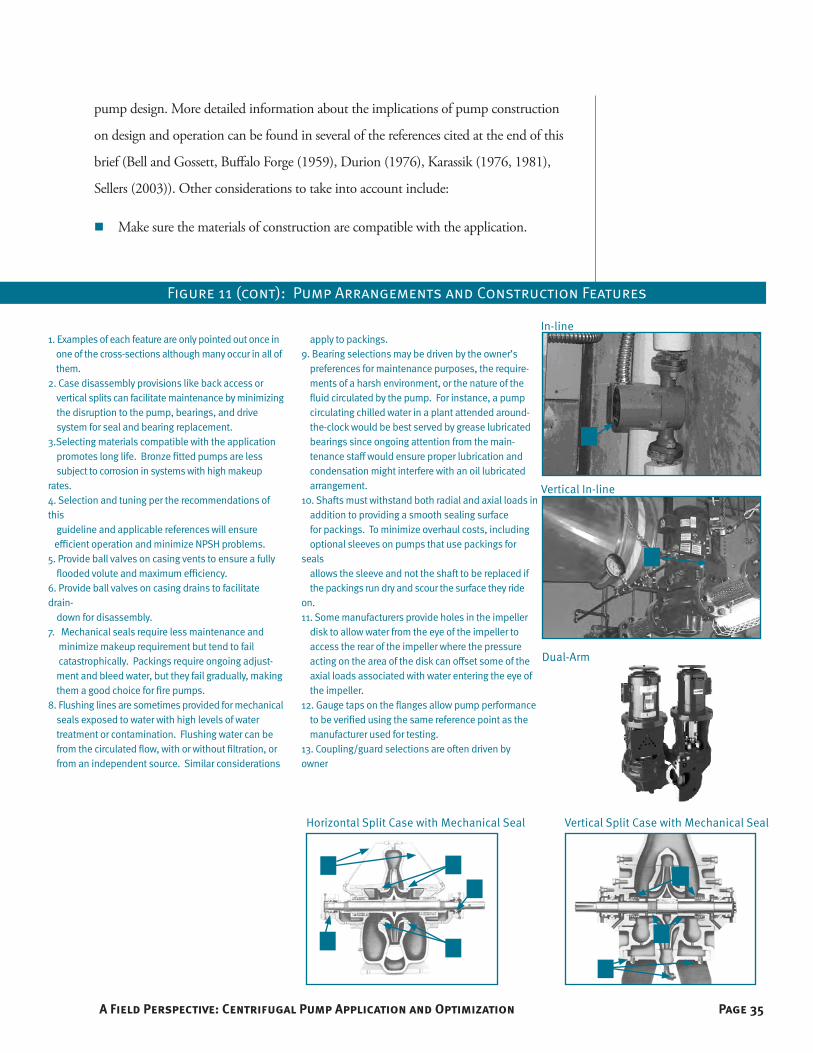
pump design. More detailed information about the implications of pump construction
on design and operation can be found in several of the references cited at the end of this
brief (Bell and Gossett, Buffalo Forge (1959), Durion (1976), Karassik (1976, 1981),
Sellers (2003)). Other considerations to take into account include:
Make sure the materials of construction are compatible with the application.
In-line
Vertical In-line
Dual-Arm
Figure 11 (cont): Pump Arrangements and Construction Features
Vertical Split Case with Mechanical SealHorizontal Split Case with Mechanical Seal
1. Examples of each feature are only pointed out once in one of the cross-sections although many occur in all of them. 2. Case disassembly provisions like back access or vertical splits can facilitate maintenance by minimizing the disruption to the pump, bearings, and drive system for seal and bearing replacement.3.Selecting materials compatible with the application promotes long life. Bronze fitted pumps are less subject to corrosion in systems with high makeup rates.4. Selection and tuning per the recommendations of this guideline and applicable references will ensure efficient operation and minimize NPSH problems.5. Provide ball valves on casing vents to ensure a fully flooded volute and maximum efficiency.6. Provide ball valves on casing drains to facilitate drain- down for disassembly.7. Mechanical seals require less maintenance and minimize makeup requirement but tend to fail catastrophically. Packings require ongoing adjust- ment and bleed water, but they fail gradually, making them a good choice for fire pumps.8. Flushing lines are sometimes provided for mechanical seals exposed to water with high levels of water treatment or contamination. Flushing water can be from the circulated flow, with or without filtration, or from an independent source. Similar considerations
apply to packings.9. Bearing selections may be driven by the owner’s preferences for maintenance purposes, the require- ments of a harsh environment, or the nature of the fluid circulated by the pump. For instance, a pump circulating chilled water in a plant attended around- the-clock would be best served by grease lubricated bearings since ongoing attention from the main- tenance staff would ensure proper lubrication and condensation might interfere with an oil lubricated arrangement.10. Shafts must withstand both radial and axial loads in addition to providing a smooth sealing surface for packings. To minimize overhaul costs, including optional sleeves on pumps that use packings for seals allows the sleeve and not the shaft to be replaced if the packings run dry and scour the surface they ride on.11. Some manufacturers provide holes in the impeller disk to allow water from the eye of the impeller to access the rear of the impeller where the pressure acting on the area of the disk can offset some of the axial loads associated with water entering the eye of the impeller.12. Gauge taps on the flanges allow pump performance to be verified using the same reference point as the manufacturer used for testing.13. Coupling/guard selections are often driven by owner
Page 36 A Field Perspective: Centrifugal Pump Application and Optimization
Frequently, this involves assessing life-cycle cost rather than just first cost. For
example, the added costs associated with bronze-fitted construction will be money
well spent in the long term for systems with elevated oxygen levels and the potential
for corrosion. However, an uninformed owner may want to select materials based
on lowest first cost. Similarly, unless bronze fittings are clearly specified, competitive
bidding will most likely provide lower-cost but less-durable materials.
Ensure compatibility with the owner’s needs and capabilities. For example, grease-
lubricated bearings and packings may not be as attractive as permanently lubricated
bearings and mechanical seals to an owner with no in-house maintenance capability.
The operating environment, operating cycle, and system interactions that will be
imposed on a pump by the nature of its application are key design considerations.
For example, oil-lubricated bearings may be a poor choice for a pump handling
chilled water in an environment where condensation will occur. Figure 11 illustrates
different bearing arrangements and other pump-construction features with
operational considerations.
Several manufacturers have designed their pumps so that the internal components
can be accessed through the rear of the pump casing, thereby eliminating the need to
disassemble the piping when service is required. Close-coupled pumps with a back-
access feature should be mounted with capscrews instead of studs to allow the motor
to slide out of the way for service.
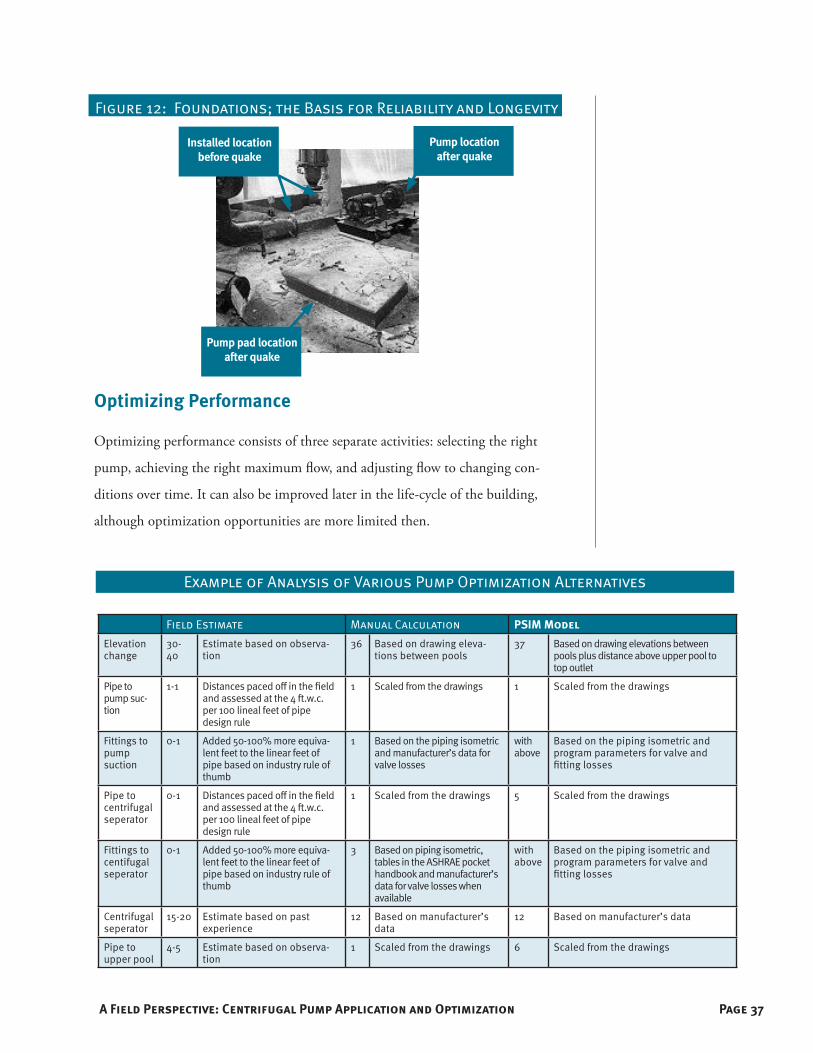
A pump’s foundation is essential for reliable performance and longevity: Factory
base frames should be leveled and anchored to the pad and the pad should be
anchored to structure. Failure to do so can compromise the integrity of the
installation during a seismic event, as illustrated in Figure 12.
Factory alignment does not guarantee field alignment. The pump should be re-
aligned after it is mated to its foundation. Subsequently, the base frame should be
filled with grout to improve rigidity. Alignment should be verified after final
connections are made for all systems and also after initial operation for systems that
operate at high temperatures. Doweling (drilling a hole into the base of the unit and
into the supporting frame, and inserting a steel pin) after verifying alignment can
help ensure that the pump will remained aligned.
Page 37A Field Perspective: Centrifugal Pump Application and Optimization
Optimizing Performance
Optimizing performance consists of three separate activities: selecting the right
pump, achieving the right maximum flow, and adjusting flow to changing con-
ditions over time. It can also be improved later in the life-cycle of the building,
although optimization opportunities are more limited then.
Figure 12: Foundations; the Basis for Reliability and Longevity
Example of Analysis of Various Pump Optimization Alternatives
Field Estimate Manual Calculation PSIM ModelElevation change
30-40
Estimate based on observa-tion
36 Based on drawing eleva-tions between pools
37 Based on drawing elevations between pools plus distance above upper pool to top outlet
Pipe to pump suc-tion
1-1 Distances paced off in the field and assessed at the 4 ft.w.c. per 100 lineal feet of pipe design rule
1 Scaled from the drawings 1 Scaled from the drawings
Fittings to pump suction
0-1 Added 50-100% more equiva-lent feet to the linear feet of pipe based on industry rule of thumb
1 Based on the piping isometric and manufacturer’s data for valve losses
with above
Based on the piping isometric and program parameters for valve and fitting losses
Pipe to centrifugal seperator
0-1 Distances paced off in the field and assessed at the 4 ft.w.c. per 100 lineal feet of pipe design rule
1 Scaled from the drawings 5 Scaled from the drawings
Fittings to centifugal seperator
0-1 Added 50-100% more equiva-lent feet to the linear feet of pipe based on industry rule of thumb
3 Based on piping isometric, tables in the ASHRAE pocket handbook and manufacturer’s data for valve losses when available
with above
Based on the piping isometric and program parameters for valve and fitting losses
Centrifugal seperator
15-20 Estimate based on past experience
12 Based on manufacturer’s data
12 Based on manufacturer’s data
Pipe to upper pool
4-5 Estimate based on observa-tion
1 Scaled from the drawings 6 Scaled from the drawings
Installed location before quake
Pump location after quake
Pump pad location after quake

Page 38 A Field Perspective: Centrifugal Pump Application and Optimization
Rightsizing to Optimize Pump and System Efficiency
Specifying the correct size pump (“rightsizing”) is one of the most fundamental
principles in designing pump systems. A pump that is carefully tailored to the
needs of the system has been rightsized. shows that an oversized pump can be
addressed after the system has been installed, over the course of its operational life.
Because of the increased efficiency of rightsized equipment, however, the benefit of
lower first and operating costs will be greater if a pump and the system it serves are
rightsized from the start.
Optimizing equipment and system efficiency, life cycle cost, and resources (material
and labor) are all interrelated. While the engineering required to incorporate rightsiz-
ing principles into the design process may cause a modest increase in the engineering
time and budget, the resulting installation savings at bid time will more than pay for
the effort. As the project moves into its operational life, these first-cost savings com-
bine with the operational savings delivered by rightsizing to greatly reduce life-cycle
cost. The lifetime benefits can be further enhanced by commissioning the project to:
bring operations and maintenance (O&M) into the design and installation
process,
facilitate verifying, testing, adjusting, and tuning the system, and
train the operators in the design intent and the associated O&M requirements.
The most obvious place to begin optimizing is machinery that operates at peak ef-
ficiency under the design conditions. However in most cases, peak-load conditions
represent only a small fraction of all operating hours. When considering the efficiency
of the pump over the entire range of the load profile, the best overall efficiency may
occur when the pump is selected for less-than-peak efficiency at design conditions.
Pumps are seldom sized optimally. In a 2005 survey of pump manufacturers, three
of the seven respondents estimated that at least 60% of the pumps they sold were
incorrectly specified by the contractor or owner/operator. Of that 60%, most er-
rors (one respondent estimated 90%) were a result of inaccurately specifying an
operating point, such as flow rate, required pressure, and net positive suction head.

Page 39A Field Perspective: Centrifugal Pump Application and Optimization
(Tutterow, 2005). Clearly, the way pumps are applied can be improved. Toward
that end, an association of pump manufacturers called the Hydraulic Institute
initiated a market-transformation initiative call Pump Systems Matter™ to change
and improve the process used to purchase pumps. To find out more and access
guidelines, tip sheets, and free pump-system-modeling software, visit their web-
site at www.PumpSystemsMatter.org.
One result of these issues is that pumps are oversized because unreasonably high
safety factors are used when assessing pumping head and flow. An experienced con-
tractor once observed, “I never got sued for putting in something that was too big.”
Properly applied, safety factors can help ensure the under all conceivable conditions
the pump will achieve its design intent. In addition, modest safety factors provide
the flexibility to adapt the performance of the pump and the system to the constantly
changing needs of the facility. However, unreasonably high safety factors can result
in an oversized pump. If undetected, an oversized pump would waste energy for its
entire operating life. If detected, it would need to be modified to operate efficiently,
but would most likely never operate as efficiently as a pump that was rightsized from
the start. Oversizing can have a ripple effect on the size of the pump trim and the
electrical equipment serving it, creating additional unnecessary first costs.
Balancing to Achieve the Right Maximum Flow
Pumps should be sized correctly. Even in the best of circumstances, however, the flow
provided by a pump will be somewhat higher than is needed because of safety factors,
providing for “room to grow,” and the imprecision in identifying the required system
head. In addition, if the system changes throughout the life of the building, the
pump may no longer optimally match the new conditions. There are several tech-
niques for optimizing the performance of an oversized pump in the field.
Throttling
Throttling is probably the fastest and most cost-effective way to optimize pump
performance. This is done by closing down the pump-discharge valve until the
required flow rate is achieved. The savings achieved will vary depending on the
relationship between the slope of the pump curve and the associated brake horse-

Page 40 A Field Perspective: Centrifugal Pump Application and Optimization
power curves. Figure 13 shows the original design point from Figure 6. After
installation, however, it was found that the system pressure drops were lower
than expected, and the flow rate was 650 gpm, rather than the 550 required. The
actual system curve is the one shown with the “Wide-Open” point on the 7”
impeller curve. The pump-discharge valve can be closed down to artificially in-
crease the system pressure drop and reduce the flow rate back to the design value.
shows that this reduced flow will slightly reduce the pump’s power requirements
(it crosses below the 7½ bhp line). (Note, however, that had it been throttled
from 900 gpm down to 700 gpm, the pump’s power requirements would actu-
ally have changed very little, since the pump curve is nearly parallel to the 7½
bhp curve). Throttling is often an immediately achievable, low-cost optimization
technique that can be the first step toward reducing pump energy consumption
while other more costly or complex techniques with greater savings potential are
being assessed.
Figure 13: Typical Pump Performance Curve and System Curve

Page 41A Field Perspective: Centrifugal Pump Application and Optimization
Impeller Trims
Impeller trimming is another way to reduce flow. Impeller trims allow the pump
performance to be shifted down the system curve to the required flow rate rather
than up the impeller curve. Figure 13 shows that throttling up the 7” impeller
curve from 650 gpm to 550 gpm will only reduce the required horsepower from
just over 7.5 to just under 7.5 bhp. Moving down the system curve by reducing the
impeller size to approximately 6”, however, will result in a power requirement of
only about 4 bhp to produce 550 gpm of flow. Note that moving down the system
curve due to an impeller trim moves the pump away from its peak efficiency point
down to about 75%, primarily due to the geometry changes between the impeller
and the pump casing and their effect on the hydraulic phenomenon occurring in
the pump. However, although the pump is actually operating less efficiently, it is
doing less work and thus there will be significant energy savings.
Example of an Impeller Trim
Based on the results of the assessment of the vari-
ous pump optimization alternatives, the owner of the
example facility elected to trim the pump impeller. The
pictures below illustrate the pump during the reassem-
bly stage of the modification and the pre- and post-trim
impeller size. After reassembly, the pump was retested
and the new operating point was as projected, based
on the original pump test. The end result was that the
owner optimized the system so that it was only neces-
sary to run one pump to produce 106 gpm of total flow
at approximately 58 ft.w.c. using 2.75 bph. In contrast,
the original design intent anticipated that both pumps
would run to produce 106 gpm of total flow at 102 ft.w.c.
using approximately 7 bhp. Testing demonstrated that
one pump was able to produce in excess of 130 gpm of
flow using 5.125 bhp prior to modification.
Before Trimming After Trimming
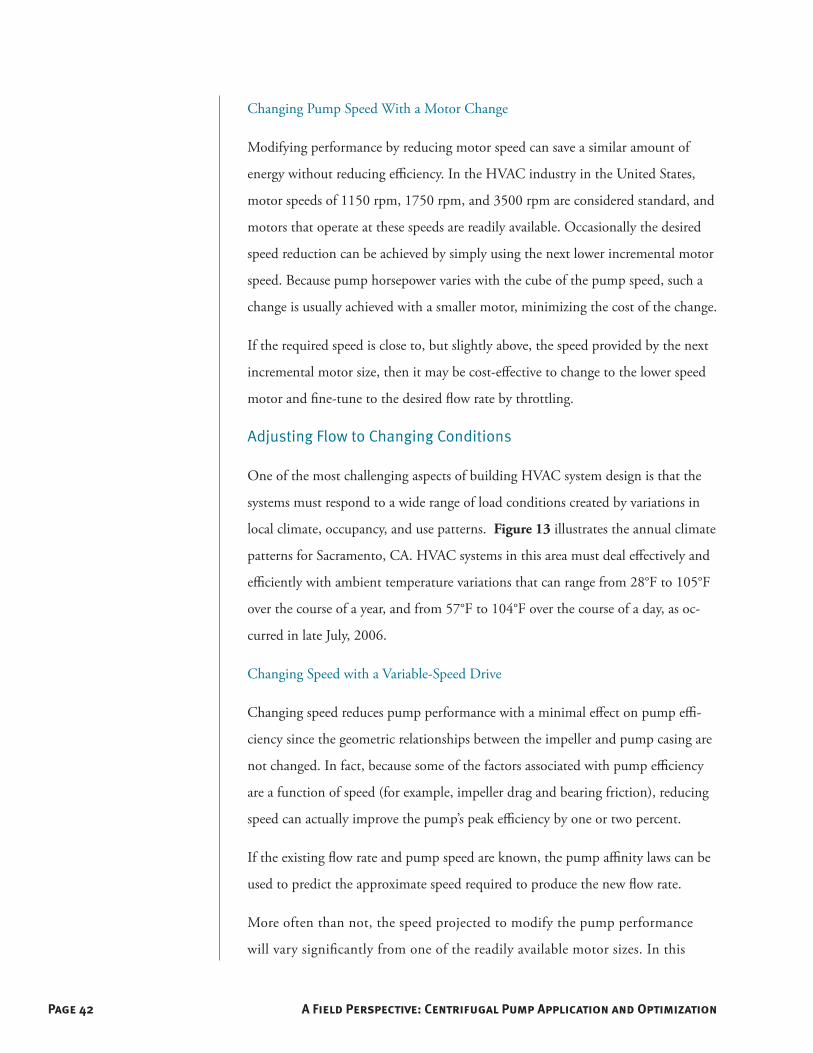
Page 42 A Field Perspective: Centrifugal Pump Application and Optimization
Changing Pump Speed With a Motor Change
Modifying performance by reducing motor speed can save a similar amount of
energy without reducing efficiency. In the HVAC industry in the United States,
motor speeds of 1150 rpm, 1750 rpm, and 3500 rpm are considered standard, and
motors that operate at these speeds are readily available. Occasionally the desired
speed reduction can be achieved by simply using the next lower incremental motor
speed. Because pump horsepower varies with the cube of the pump speed, such a
change is usually achieved with a smaller motor, minimizing the cost of the change.
If the required speed is close to, but slightly above, the speed provided by the next
incremental motor size, then it may be cost-effective to change to the lower speed
motor and fine-tune to the desired flow rate by throttling.
Adjusting Flow to Changing Conditions
One of the most challenging aspects of building HVAC system design is that the
systems must respond to a wide range of load conditions created by variations in
local climate, occupancy, and use patterns. Figure 13 illustrates the annual climate
patterns for Sacramento, CA. HVAC systems in this area must deal effectively and
efficiently with ambient temperature variations that can range from 28°F to 105°F
over the course of a year, and from 57°F to 104°F over the course of a day, as oc-
curred in late July, 2006.
Changing Speed with a Variable-Speed Drive
Changing speed reduces pump performance with a minimal effect on pump effi-
ciency since the geometric relationships between the impeller and pump casing are
not changed. In fact, because some of the factors associated with pump efficiency
are a function of speed (for example, impeller drag and bearing friction), reducing
speed can actually improve the pump’s peak efficiency by one or two percent.
If the existing flow rate and pump speed are known, the pump affinity laws can be
used to predict the approximate speed required to produce the new flow rate.
More often than not, the speed projected to modify the pump performance
will vary significantly from one of the readily available motor sizes. In this

Page 43A Field Perspective: Centrifugal Pump Application and Optimization
situation or in situations where the required system flow varies under normal
operating conditions, a variable-speed drive (VSD) can effectively optimize
pump performance.
Using a Variable Speed Drive for Balancing
It is important to recognize the difference between using a VSD to match the
pump performance to the system’s continuously varying operating requirements
and using a VSD to balance a pump (that is, providing a fixed reduction in operat-
ing speed to compensate for oversizing.)
In the former case, the drive is used to continuously vary the performance of the
pump to match the continuously varying requirements of the system. Applying
VSDs to pumps and their related HVAC systems to optimize performance over
the range of actual operating conditions can save a significant amount of energy.
Ideally, pumps for such applications will be selected so that they operate at full
speed to achieve design flow and at reduced speed as the demand for flow drops for
partial loads.
In contrast, a pump that is used for balancing provides a fixed, permanent reduc-
tion in pump speed because the performance provided by full-speed operation
is never required by the system. This reduction in performance, while generally
preserving the pump’s efficiency, is not achieved without cost due to the losses that
occur in a VSD. In addition, a VSD installation:
represents a significantly higher first cost compared to other options for permanently
reducing pump speed,
represents increased operating complexity that must be understood by the
operation and maintenance team, and;
introduces an additional point of failure that would not otherwise exist.
Thus, the first cost and efficiency of a VSD used for balancing should be taken into
account when considering alternatives. It is possible that the savings achieved at the
pump by reducing speed will be offset by the drive. This is not the case when throt-
tling or trimming an impeller.
Page 44 A Field Perspective: Centrifugal Pump Application and Optimization
Specifying Pumps
Ask for What You Need
Ultimately, specifying the performance requirement of a pump will depend on all
of the parameters discussed in this design brief when assessed in the dynamic con-
text of the system it serves. A detailed discussion of such an assessment is beyond
the scope of this brief, but can be found in a number of resources:
The Energy Design Resources website includes a number of briefs that cover
topics that will effect pump selection either directly or indirectly. Examples
include Design Details, Integrated Design, Drive Power, and Chiller Plant Efficiency.
The Cool Tools™ project provides a detailed overview of the design and
optimization of energy-efficient chiller plants, including the associated pumping
applications. Many of the pumping considerations apply to other processes
like distributing heating water. Cool Tools is hosted on the Pacific Energy
Center website (http://www.pge.com/pec/) under the HVAC link. It is also being
revised and will ultimately be moved to the Energy Design Resources website.
The ASHRAE Handbooks, articles in the ASHRAE Journal (www.ASHRAE.org),
and articles in industry publications like Heating, Piping and Air Conditioning
and Engineered Systems are continually updating resources that discuss pumping-
system applications and calculations. Many of these resources can be accessed
from the internet.
Don’t Ask for What You Don’t Need
Of critical importance is tailoring your pump specification to the specific needs of
the project. Boiler-plate specifications that ask for features that are unnecessary or
do not make sense for a project can drive up project costs, create confusion, and in
some cases, yield a product that is misapplied in the system it will serve. This can
also leave the impression that the specifications will not be enforced.
Enforce Your Requirements
Enforcing the requirements of a well-thought-out specification is critical for both
Page 45A Field Perspective: Centrifugal Pump Application and Optimization
short-term and long-term success. In the short term, the success of your project will de-
pend on verifying and ensuring that the engineering requirements you developed are met.
Efficiency, performance, and ongoing operating costs are all at risk without enforcement.
Misunderstandings, change orders, and scheduling problems could also ensue without en-
gineering oversight of the procurement process. Thoroughly reviewing shop drawings is a
key step in verification and enforcement, as discussed in the HPAC article titled “Installing
Variable Frequency Drives” (Sellers, 2006). Before approval, the pump is an idea expressed
in words and lines. After approval, it starts to become a physical reality.
In the long term, a designer’s credibility could be compromised if he or she consis-
tently fails to enforce the engineering details called out in the specifications.
Maintaining What Was Asked For
The continuing viability and adaptability of the design intent of the project is highly
dependent upon the understanding of the design intent by the operating staff. Thorough
training and documentation are essential in this process as is the periodic reassessment of
the pump’s performance against the original design criteria and commissioning results.

Page 46 A Field Perspective: Centrifugal Pump Application and Optimization
Conclusion
Research and experience indicates that pumps are often improperly applied and
oversized, wasting energy and resources. Fortunately, the knowledge and tools exist
to improve the situation. By understanding the details of pump construction and
its interface with the system, the designer can take the first step in wisely spending
the resources that come with installing a new pumping system. By requiring com-
missioning and training, the designer helps ensure that the system is optimized and
that the optimized performance will persist.
The commissioning and operating team can complement the efforts of the designer by
understanding and documenting the design intent of the pumping system and enhancing
it with an O&M perspective that will ensure it persists for the life of the system. Function-
al testing at start-up and throughout the life of the system will ensure that the optimized
performance envisioned by the design is realized and persists in the field.
Analysis of the pump and system curves developed for the example facility, revealed an
opportunity to shut off one of the pumps while still providing sufficient flow. The analy-
sis also showed an opportunity to trim the impeller of the operating pump to further
reduce the flow without throttling the discharge valve. The net result of these changes
resulted in 40% savings in annual pumping energy costs. The bottom line, however, is
that these savings could have been even greater, and could have been accompanied
with initial first cost savings from eliminating one pump and downsizing the other.
Pump Optimization Bottom Line
Page 47A Field Perspective: Centrifugal Pump Application and Optimization
References
Bell and Gossett. (1965 - 1992) Bell and Gossett Engineering Design Manual. ITT Bell and Gossett Fluid Handling Training and Education Department, Morton Grove, Illinois.
Boyanton, Hugh. (n.d.) “Electrical Discharge Machining Of Bearings.” Shaft Grounding Systems, Inc. Website: www.shaftgroundingsystems.com. Accessed Dec 2006.
Buffalo Pumps. (1959) “Centrifugal Pump Application Manual”. Buffalo Pumps, a Division of Buffalo Forge Company, Buffalo, New York.
Daugherty, R.L. (1915) Centrifugal Pumps. McGraw-Hill Book Company, Inc. First Edition.
Energy Design Resources. (1998) “Design Briefs: Drive Power.” Energy Design Resources website, www.energydesignresources.com. Accessed Dec 2006.
Durion Company. (1976) Pump Engineering Manual. The Durion Company Inc. Dayton, Ohio.
Houdek, John A. (n.d.) “Load Reactors Increase VFD System Performance & Reliability.” MTE Corporation.
Jackson, Stewart and Liggett, F. (2002) “How to Match Motors to Variable Speed Drives.” Plant Engineering., July 2002. http://www.reliance.com/pdf/misc/225412.pdf. Accessed Dec 2006.
Joliet Technologies. (n.d.) “Adjustable Speed Drives: What are they? How do they work?” Application Information. http://www.joliettech.com/adjustable_speed_drives-application_information.htm. Accessed Dec 2006.
Karassick, Igor, et.al. (1976) Pump Handbook. McGraw-Hill, Inc. New York, New York.
Karassik, Igor. (1981) “Centrifugal Pump Clinic.” Marcel Dekker, Inc. New York, New York.
Puttgen, Hans. B. (1991) “Adjustable Speed Drives Directory - Third Edition.” CU-7544, Research Projects 2951-9 and 2951-12. Georgia Institute of Technology, School of Electrical Engineering, Published by Electric Power Research Institute, December 1991.
Sellers, David A. (2006) “Installing Variable-Frequency Drives,” Heating, Piping and Air Conditioning (HPAC). November 2006.

Sellers, David A. (2005) “Right-sizing Pumping Systems,” Heating, Piping and Air Conditioning (HPAC). March 2005.
Sellers, David A. (2003) “Specifying Pumps,” Heating, Piping and Air Conditioning (HPAC). November 2003.
Stewart, Tom. (circa 1995) personal conversation with David Sellers, paraphrased.
Stone, G.C., Campbell, S.R., and Seddirw, H.G. (1999) “Adjustable Speed Drive Surges: How They Affect Motor Stator Windings,” IEEE Transactions, Paper 0-7803-5293-9/99.
Title 24 2008: “Appendix NA3: Fan Motor Efficiencies”, Table NA3-2, Page NA3-2.
Tutterow, Vestal, Asdal, Robert, and McKane, Aimee T. (2005) “Making Pump Systems Matter,” ACEEE Summer Study.
Upper Peninsula Power Company (UPPCO). (2005) “Motors: AC Induction Motors.” UPPCO website at http://www.uppco.com/business/eba_35.asp. Accessed Dec 2006.
Upper Peninsula Power Company (UPPCO). (2005) “Making Motor Repair/Replacement Decisions.” UPPCO website, http://www.uppco.com/business/eba_35.asp. Accessed Dec 2006.
U.S. D.O.E. The free MotorMaster software mentioned in the design brief can be downloaded from the U.S. Department of Energy’s Industrial Technologies Program website at: http://www1.eere.energy.gov/indus try/bestpractices/software.html#mm
Energy Design Resources provides information and design tools to architects, engineers, lighting designers, and building owners and developers. Energy Design Resources is funded by California utility customers and administered by Pacific Gas and Electric Co., Sacramento Municipal Utilities District, San Diego Gas and Electric, Southern California Edison, and Southern California Gas, under the auspices of the California Public Utilities Commission. To learn more about Energy Design Resources, please visit our web site at www.energydesign-resources.com.
Prepared for Energy Design Resources
by Portland Energy Conservation, Inc.
2007, Between January and April of
2010, an engineering review of this
document was conducted to update
passages affected by recent changes
in the California Building Energy
Efficiency Standards (Title 24 2008).
The original content creator was not
actively involved in this engineering
review, and therefore is not responsible
for the updates to the affected passages.
Page 48 A Field Perspective: Centrifugal Pump Application and Optimization