centre forapplied macroeconomic analysis · 2019-03-26 · 2 1. introduction inflation expectations...
TRANSCRIPT
| T H E A U S T R A L I A N N A T I O N A L U N I V E R S I T Y
Crawford School of Public Policy
CAMACentre for Applied Macroeconomic Analysis
Inflation Expectations: Review and Evidence
CAMA Working Paper 29/2019March 2019
M. Ayhan KoseWorld Bank, Development Prospects GroupBrookings InstitutionCEPRCentre for Applied Macroeconomic Analysis, ANU
Hideaki MatsuokaWorld Bank, Development Prospects Group
Ugo PanizzaGraduate Institute, GenevaCEPR
Dana VorisekWorld Bank, Development Prospects Group
AbstractThis paper presents a comprehensive examination of the determination and evolution of inflation expectations, with a focus on emerging market and developing economies (EMDEs). The results suggest that long-term inflation expectations in EMDEs are not as well anchored as those in advanced economies, despite notable improvements over the past two decades. Indeed, in EMDEs, long-term inflation expectations are more sensitive to both domestic and global inflation shocks. However, EMDEs tend to be more successful in anchoring inflation expectations in the presence of an inflation targeting regime, high central bank transparency, strong trade integration, and a low level of public debt.

| T H E A U S T R A L I A N N A T I O N A L U N I V E R S I T Y
Keywords
inflation, inflation expectations, monetary policy, emerging markets, developing economies
JEL Classification
E31, E37, E40, E50
Address for correspondence:
ISSN 2206-0332
The Centre for Applied Macroeconomic Analysis in the Crawford School of Public Policy has been established to build strong links between professional macroeconomists. It provides a forum for quality macroeconomic research and discussion of policy issues between academia, government and the private sector.The Crawford School of Public Policy is the Australian National University’s public policy school, serving and influencing Australia, Asia and the Pacific through advanced policy research, graduate and executive education, and policy impact.

1
IInflation Expectations: Review and Evidence
M. Ayhan Kose, Hideaki Matsuoka, Ugo Panizza, and Dana Vorisek
Abstract. This paper presents a comprehensive examination of the determination and evolution of inflation expectations, with a focus on emerging market and developing economies (EMDEs). The results suggest that long-term inflation expectations in EMDEs are not as well anchored as those in advanced economies, despite notable improvements over the past two decades. Indeed, in EMDEs, long-term inflation expectations are more sensitive to both domestic and global inflation shocks. However, EMDEs tend to be more successful in anchoring inflation expectations in the presence of an inflation targeting regime, high central bank transparency, strong trade integration, and a low level of public debt. JEL Classification: E31; E37; E40; E50. Keywords: inflation, inflation expectations, monetary policy, emerging markets, developing economies.
Kose (World Bank, Prospects Group; Brookings Institution; CEPR, and CAMA; [email protected]);
Hideaki Matsuoka (Prospects Group, World Bank; [email protected]); Ugo Panizza (Graduate Institute, Geneva; CEPR; [email protected]); Dana Vorisek (Prospects Group, World Bank; [email protected]). This paper is based on a chapter of the book, Inflation in Emerging and Developing Economies: Evolution, Drivers and Policies, edited by Jongrim Ha, M. Ayhan Kose, and Franziska Ohnsorge, published by the World Bank. We thank Yoki Okawa for his contributions to a country case study, and, Kevin Clinton, Erik Feyen, Hans Genberg, Jongrim Ha, Graham Hacche, Anna Ivanova, Alain Kabundi, Sergiy Kasyanenko, Gene Kindberg-Hanlon, Patrick Kirby, Wei Chian Koh, Graeme Littler, Tatsuyoshi Okimoto, Franz Ulrich Ruch, Modeste Some, Marc Stocker, Peter Pedroni, Christopher Towe, and seminar participants at many institutions for their comments. Xinyue Wang provided excellent research assistance. We gratefully acknowledge financial support from the PHRD fund. The findings, interpretations and conclusions expressed in this paper are entirely those of the authors and should not be attributed to the World Bank, its Executive Directors, or the countries they represent.

2
11. Introduction
Inflation expectations play a critical role in the effective implementation of monetary policy. A central bank is more likely to be successful in achieving low and stable inflation if it can anchor economic agents’ long-term inflation expectations close to its inflation objective. This is because inflation expectations are key in the transmission of monetary policy, as they affect current inflation through their impact on the setting of wages and prices (Bernanke et al. 2001). Measures of inflation expectations are therefore important yardsticks in assessing the credibility of a central bank in meeting its inflation objective.
Given the importance of inflation expectations for monetary policy, it is essential for central banks to have a good understanding of how they are affected by domestic and global shocks. This is especially critical for central banks in emerging market and developing economies (EMDEs), since these economies tend to experience more pronounced business and financial cycles than advanced economies, and therefore may face greater challenges in anchoring expectations.
There is a rich theoretical and empirical literature on inflation expectations. Theoretical studies have examined how public and private information is used by economic agents in formulating inflation expectations. A large body of empirical work has tested the predictions of theoretical models and assessed how firmly inflation expectations are anchored, by measuring the sensitivity of expectations to various shocks, such as macroeconomic news shocks or oil or other price shocks. The literature, however, has mainly focused on advanced economies.
This paper presents the first comprehensive analysis of the evolution and determinants of inflation expectations in EMDEs, with emphasis on three main questions. First, how does the degree of anchoring of inflation expectations differ between advanced economies and EMDEs? Second, how sensitive are inflation expectations to global and domestic shocks? Third, what are the main determinants of the degree of anchoring of inflation expectations?
The paper makes several contributions to the literature on inflation expectations. First, it employs a large and diverse sample of countries (24 advanced economies and 23 EMDEs) for a period of close to three decades. Second, it analyzes the sensitivity of long-term inflation expectations to global and domestic inflation shocks using a time-varying parameter regression model. Third, it examines the determinants of the degree of anchoring of expectations, using a dynamic panel regression framework. Fourth, it complements the empirical analysis with case studies that examine the role of inflation targeting in stabilizing inflation expectations in three EMDEs. In addition, it provides a summary of the literature with a special focus on empirical studies on the anchoring of inflation expectations in EMDEs.
The paper begins by discussing the measurement of inflation expectations, comparing survey-based and market-based measures. Survey-based measures have the advantage of being able to incorporate the views of large groups of economic agents and to canvass different types of agents. Market-based measures (that is, measures based on comparisons of certain yields in financial markets) have the advantage of being available at a higher

3
frequency and more extensive range of horizons than survey-based measures.1
The following section reviews the theoretical and empirical literature on the formation and anchoring of inflation expectations. Despite a lack of consensus on the theoretical framework that best captures the behavior of inflation expectations, the empirical literature has concluded that an inflation targeting regime helps improve the anchoring of expectations in both advanced economies and EMDEs.
The next section examines trends in long-term (five-year-ahead) inflation expectations in advanced economies and EMDEs, from the 1990s to the present. It then assesses the anchoring of inflation expectations. It finds that although expectations have become more firmly anchored during the past decade in both advanced economies and EMDEs, this has been less evident in EMDEs than in advanced economies. The section also reports that inflation expectations in EMDEs are more sensitive to both global and domestic shocks than are inflation expectations in advanced economies, although sensitivity to global shocks has fallen in both groups of economies and sensitivity to domestic shocks has fallen in EMDEs.
The subsequent section identifies the main factors that determine the anchoring of inflation expectations. It presents evidence that inflation expectations are better anchored in both advanced economies and EMDEs when the central bank employs an inflation targeting regime and is highly transparent. For EMDEs, low public debt and a high degree of trade openness are also associated with better anchoring of expectations, while the use of a fixed exchange rate regime is associated with weaker anchoring of expectations. These results suggest that the institutions and framework of monetary policy, the macroeconomic environment (including fiscal policy), and structural characteristics all matter for the anchoring of long-term inflation expectations in EMDEs.
The penultimate section presents case studies on the experience of inflation targeting in Brazil, Chile, and Poland. The conclusions of the case studies are in line with the empirical findings. In Brazil, less than ideal fiscal conditions and worsening central bank transparency during part of the inflation targeting period may have impeded the anchoring of expectations. By contrast, the combination of high central bank credibility and an effective fiscal framework may have helped anchor expectations in Chile. In Poland, the transition to a flexible exchange rate regime concurrent with the adoption of inflation targeting may have helped to anchor expectations.
The final section concludes with a summary of major findings and a discussion of future research directions.
2. Measuring inflation expectations
Robust measurement is key to evaluating inflation expectations, and typically two sources exist. Survey-based measures are derived from surveys of households, firms, or professional forecasters, in which respondents are asked about their expectations for inflation at various horizons. Market-based measures are calculated from the prices of assets linked
1 For background on market- and survey-based measures of inflation expectations, see Coibion et al. (2018) and Grothe and Meyler (2018) for the United States and the Euro Area, and Sousa and Yetman (2016) for EMDEs.

4
to prospective inflation. Each measure has advantages and drawbacks.
2.1. Survey-based measures
Surveys of households and firms. Among advanced economies, commonly referenced surveys of households’ inflation expectations include the University of Michigan’s Surveys of Consumers (monthly frequency for the United States), the European Commission’s consumer survey for the countries of the European Union (monthly), and the Bank of England’s consumer survey (quarterly) for the United Kingdom.2 High-frequency surveys of households’ or firms’ inflation expectations are also conducted by Australia, Canada, the Czech Republic, Italy, Japan, the Republic of Korea, New Zealand, and Sweden. Among EMDEs, survey-based measures of households’ or firms’ expectations are produced by central banks in East Asia (for example, Indonesia, the Philippines, and Thailand), Europe and Central Asia (for example, Kazakhstan and Turkey), and India and South Africa.3
Surveys of professional forecasters. The most commonly used survey of professional forecasters is produced by Consensus Economics, which incorporates the views of more than 700 professional forecasters in 85 advanced economies and EMDEs. Consensus Economics publishes short-term expectations at a monthly frequency and long-term expectations at a semi-annual or quarterly frequency.4 Other surveys of professional forecasters include the Survey of Professional Forecasters by the Federal Reserve Bank of Philadelphia, which provides data on expectations up to 10 years ahead, and the European Central Bank’s Survey of Professional Forecasters. Central banks in several other economies (for example, Argentina, Brazil, Iceland, Indonesia, Israel, Mexico, South Africa, and Turkey) also produce professional survey-based measures of inflation expectations. Surveys of inflation expectations in EMDEs typically have smaller samples than those in advanced economies, but the number of EMDEs included in Consensus Economics’ surveys has increased over time, from seven in 1990 to 52 in 2018.5
Differences between surveys of households or firms and surveys of professional forecasters. On average, households’ and firms’ inflation expectations are higher than professional forecasters’ expectations in advanced economies and EMDEs (Figure 1). The volatility of households’ inflation expectations is also larger than that of professional forecasters’ expectations. Households’ beliefs about past inflation are found to be a strong predictor of their inflation expectations (Jonung 1981; Malmendier and Nagel 2016). Households’ inflation expectations are thus more backward looking than professional forecasters’ expectations.6
2 Most survey results are presented as median responses. Discrepancies among respondents can be informative as a proxy of inflation uncertainty (Mankiw, Reis, and Wolfers 2003; Miles et al. 2017). 3 For the European Union, a data set on inflation expectations has been collected by the European Commission since 2003. Although it has been used for research purposes, it has not yet been published (Arioli et al. 2017). Some central banks (for example, those of China, Poland, and Romania) release survey results showing the percentage of respondents who expect inflation to change. 4 In addition, Germany’s Ifo Institute has provided data on five-year-ahead inflation expectations for more than 70 countries since the end of 2014. 5 The International Monetary Fund’s World Economic Outlook has the broadest country coverage of long-term inflation projections (39 advanced economies and 154 EMDEs). 6 Kumar et al. (2015) and Kabundi, Schaling, and Some (2015) document that in New Zealand and South Africa, some firms do not understand the central bank’s objective function. Hence, even if professional forecasters’ expectations are well anchored by inflation targeting in these countries, the same is not

5
Several reasons for these differences have been suggested. First, households’ and firms’ expectations are subject to “sticky information” and are updated more slowly than those of professional forecasts (Carroll 2003). Second, household surveys give the same weight to “informed” and “uninformed” consumers. Because uninformed consumers likely give excess weight to goods that are purchased frequently (for example, food) or have highly visible price changes (for example, gasoline), their assessment of inflation expectations can be biased upward when the prices of these products increase (Coibion and Gorodnichenko 2015; Coibion, Gorodnichenko, and Kamdar 2018a; Sousa and Yetman 2016). Yet, surveys of households and firms also have important advantages relative to surveys of professional forecasters—for instance, they can be designed to include a large number of respondents and have the flexibility to canvass different types of economic agents. For surveys of professional forecasters, bias may arise from respondents’ reluctance to reveal their expectations about inflation because they consider the information private (Cunningham, Desroches, and Santor 2010).
22.2. Market-based measures
The most commonly used market-based measure of inflation expectations is the break-even inflation rate—that is, the difference between yields on comparable nominal and inflation-indexed bonds. In general, however, this difference consists of four components: expected inflation, an inflation risk premium, a liquidity premium, and other factors (Hördahl 2009; Christiansen, Dion, and Reid 2004). Hence, extracting expected inflation requires the use of strong assumptions, and any estimate of expected inflation is necessarily imprecise (Galati, Heemeijer, and Moessner 2011).
Another common market-based measure is the inflation swap rate based on derivative instruments, which again includes not only inflation expectations, but also the inflation risk premium and liquidity premium. A key advantage of the swap rate is that, unlike for break-even inflation rates, liquidity has a limited impact on its movements (Grothe and Meyler 2018). Both types of market-based measures have the advantage of being available at very high frequencies, which may help policy makers develop an understanding of how inflation expectations are formed and may be calculated at a wider range of forecast horizons than is possible using surveys. However, swap markets in EMDEs are typically insufficiently developed to allow such a measure to be reliably extracted. Therefore, central banks in several large EMDEs (for example, Brazil, Chile, Colombia, Mexico, Peru, Poland, the Russian Federation, South Africa, Thailand, and Turkey) typically derive their market-based measures of inflation expectations from inflation-indexed government bonds (Sousa and Yetman 2016; De Pooter et al. 2014).
Differences between survey-based and market-based measures. In terms of the level of inflation expectations, those derived from surveys of professional forecasters are not systematically higher or lower than market-based measures (Figure 2). However, professional forecasters’ inflation expectations tend to be close to central bank inflation forecasts, as has been shown for New Zealand and the United States (Coibion and Gorodnichenko 2015). In addition, the volatility of professional forecaster-based expectations tends to be lower than that of market-based expectations. During periods of market stress, break-even inflation rates can be particularly volatile because “flight-to-
necessarily true of firms’ inflation expectations. The latter may be more important for actual inflation, because firms may incorporate expected marginal costs into their product prices.

6
liquidity” flows raise demand for government bonds sharply.7 This could push nominal yields to extremely low levels and put strong downward pressure on measured break-even inflation rates (Hördahl 2009). Relative to survey-based measures of inflation expectations, an advantage of market-based measures is that they cannot be influenced by poorly crafted surveys.
22.3. Expectations measures
Due to the breadth of its country coverage and length of its time coverage, the main long-term inflation expectations series used in this paper are the survey-based, five-year-ahead expectations produced on a semi-annual basis by Consensus Economics. In the empirical work, the change in long-term inflation expectations is measured as the difference between five-year-ahead inflation expectations in the current period and five-year-ahead inflation expectations in the previous period (that is, six months prior).
3. Literature on inflation expectations
Theories of inflation expectations have mainly focused on how expectations reflect public and private information. There remain different views on which conceptual framework is best.8 Empirical studies, most of which have focused on advanced economies, concentrate on testing the implications of the theoretical literature and evaluating the degree of anchoring of expectations.9
3.1. Conceptual considerations
The theoretical literature on the determinants of inflation expectations ranges from models that assume agents have “full-information rational expectations” (FIRE) to models that allow for constraints on agents’ ability to process information.10 There is still no consensus on an ideal framework to describe how inflation expectations are determined (Mankiw and Reis 2018).
With its simple formulation of the relationship between inflation and economic activity, the New Keynesian model has been used extensively in policy and academic circles. However, it has also been subject to criticism—in particular, that it does not take into account the constraints that economic agents typically face in forming their expectations about inflation. For example, Friedman (1979) argues that FIRE does not explain how “economic agents derive the knowledge which they then use to formulate expectations.”
FIRE models have also been criticized for their inability to explain the persistence of inflation that is usually found in the data. These criticisms have led to two alternate approaches in modeling the role of information in the formation of inflation expectations: the sticky-information model and the noisy-information model. In the sticky-information model, forecasts are updated slowly because acquiring information is costly (Mankiw and
7 During periods of market stress, investors may have a strong preference for holding very liquid securities, such as government bonds. This preference can lead to sharp movements in bond markets (that is, flight to liquidity), similar to market movements driven by flight to quality. 8 Coibion, Gorodnichenko, and Kamdar (2018a) and Mankiw and Reis (2018) survey the literature on the formation of expectations. Appendix 1 presents a brief overview of how views on the linkages between inflation expectations and monetary policy have evolved over time. 9 Appendix 2 lists a number of empirical studies on the evolution, determinants, and anchoring of inflation expectations in advanced economies and EMDEs. 10 Agents with FIRE are assumed to understand perfectly the structure and functioning of the economy and the policy makers’ objective function (Bernanke 2007).

7
Reis 2002). The assumption of sticky-information flow can be rationalized in terms of an “epidemic” model of news diffusion (Carroll 2003).11
Models of noisy information and rational inattention instead assume that economic agents continuously update their information but receive imperfect, “noisy” signals or do not pay attention to all news (Woodford 2002; Sims 2003; Maćkowiak and Wiederholt 2009; Coibion, Gorodnichenko, and Kamdar 2018b). Departures from the full-information assumption can also be rationalized in the context of “learning” models, which assume that agents need to use statistical methods to learn about the central bank’s objective function and the overall structure of the economy (Evans and Honkapohja 2009).12
On the operational side, the assumption that a fraction of firms is not fully rational and instead sets prices using a rule of thumb that depends on past inflation led to the development of the hybrid New Keynesian Phillips curve. In this specification, current inflation depends on both expected and lagged inflation (Fuhrer and Moore 1995; Galí and Gertler 1999). In particular, the model takes into account backward- and forward-looking inflation expectations (that is, inflation expectations are determined by past inflation and expectations about those variables viewed as determining actual inflation). Some specifications of the model also control for foreign inflation (for example, IMF 2016).
In addition to fitting the data better, the hybrid New Keynesian Phillips curve is well suited to the reality of constantly evolving economic structures. The standard New Keynesian Phillips curve implies that long-run inflation expectations do not respond to news because the public knows the long-run equilibrium. The hybrid curve is consistent with an environment in which the structure of the economy is not perfectly understood by policy makers or the public. The hybrid curve can also fit environments in which the central bank’s objective function is not completely known by economic agents or it is not optimal for all agents to update their information constantly (Bernanke 2007; Kumar et al. 2015).13
Learning models and models of noisy information also allow for a more sophisticated formalization of the drivers of expectation anchoring. For example, these types of models imply that long-run expectations will be well anchored—and thus will not respond to news—if private agents are confident about their estimates of future inflation. In an inflation targeting framework, the anchoring of expectations is therefore related to the public’s confidence that the central bank is willing and able to reach the target.14
33.2. Empirical evidence
Formation of expectations. One strand of studies examines the empirical relevance of the
11 In the “epidemic” model, households’ inflation forecasts are affected by media and professional inflation forecasts. 12 Coibion, Gorodnichenko, and Kamdar (2018a) discuss models featuring other departures from FIRE, including bounded rationality and adaptive learning models. Models with bounded rationality assume that agents build a simplified model of the world, paying attention to only some of the relevant variables. Adaptive learning models assume that agents behave like econometricians, using the available information at the time of the forecast and following a specific updating mechanism. 13 The presence of lagged inflation in the hybrid New Keynesian Phillips curve signifies that the central bank is not fully credible; this lack of credibility impairs the effectiveness of monetary policy (Ball 1995; Woodford 2005). 14 Demertzis and Viegi (2008) present a model in which a monetary policy regime with well-defined objectives (such as an inflation target) could help improve the anchoring of inflation expectations.

8
sticky-information and noisy-information models. Mean inflation forecasts from professional forecasters, consumers, firms, and central bankers have all been found to respond to macroeconomic shocks with a delay (Coibion and Gorodnichenko 2012). Because mean forecasts adjust gradually, it is possible to predict ex post forecast errors using ex ante changes in mean expectations (Coibion and Gorodnichenko 2015). Carroll (2003) shows that households’ inflation expectations are updated slowly and in part based on media coverage of professional forecasters’ inflation projections.
Another strand of studies examines the relevance of forward- and backward- looking expectations in the hybrid New Keynesian Phillips curve. Backward- looking inflation expectations have been shown not to matter (that is, the associated coefficient is not statistically significant) if the trend inflation is determined by the long-run inflation target (Cogley and Sbordone 2008).15 Similarly, if the New Keynesian model accounts for positive trend inflation, price-setting firms become more forward looking and the inflation rate becomes less sensitive to current economic conditions as trend inflation increases (Ascari and Sbordone 2014).
AAnchoring of inflation expectations in advanced economies. A transparent central bank communicates to the public its intent, strategy, assessments, procedures, and policies in an open, clear, and timely manner. An inflation targeting regime provides a disciplined framework that helps improve monetary policy transparency. Broadly, the empirical work on advanced economies suggests that monetary regimes that increase central bank transparency, including through inflation targeting, are associated with a decrease in the persistence of movements of inflation away from trend.
For example, in Canada, New Zealand, Sweden, and the United Kingdom, inflation persistence disappeared after the adoption of an inflation targeting regime (Benati 2008). In the United States, by contrast, where inflation targeting had not yet been adopted, the persistence parameter remained low but positive and statistically significant. These results are corroborated by Gürkaynak, Levin, and Swanson (2010), who show that the response of market-based inflation expectations to macroeconomic news was larger in the United States than in Sweden and the United Kingdom. They also show that in the United Kingdom, expectations became better anchored after the Bank of England’s monetary policy was made operationally independent in May 1997. Moreover, increased trust in the European Central Bank has been associated with a decline in uncertainty about future inflation in the Euro Area, thus contributing to the anchoring of inflation expectations (Christelis et al. 2016).16
Other research studies the conditions under which inflation may not be well anchored
15 Bernanke (2007) argues that the decline in the volatility of the trend component of inflation, as estimated by the approach of Stock and Watson (2007, 2016), is consistent with the view that inflation expectations have become better anchored. Employing the New Keynesian model, Ascari and Sbordone (2014) show that the inflation rate becomes less sensitive to current economic conditions when trend inflation makes price-setting firms more forward looking. Trend inflation could instead be measured with long-term inflation expectations (Clark and Nakata 2008; Garnier, Mertens, and Nelson 2015; Mertens 2016). 16 An alternative way to assess the anchoring of inflation expectations is to employ Stock and Watson’s (2007, 2016) approach, which decomposes the inflation process into trend and volatility components. Data for Japan, the United Kingdom, and the United States show that shocks to trend inflation are persistent (and can be modeled as a unit root process), but that the volatility of trend inflation declined markedly during the 1980s (Miles et al. 2017). These findings are consistent with the finding that inflation expectations have become more firmly anchored than in the past, although not perfectly so.

9
under an inflation targeting regime. For example, even with an inflation targeting framework, expectations were not well anchored in New Zealand when forecasters did not understand the central bank’s objective function (Kumar et al. 2015). Inflation expectations in 10 advanced economies were not as well anchored during periods of persistently below-target inflation as during periods when inflation was close to target (Ehrmann 2015).
Several studies have examined whether inflation expectations became unanchored during and after the global financial crisis, which was followed by a wave of unconventional monetary policy actions. During the period immediately following the crisis, market-based inflation expectations in the United States and the United Kingdom became more sensitive to macroeconomic news, but neither survey-based nor market-based long-term inflation expectations in the Euro Area became unanchored (Galati, Heemeijer, and Moessner 2011; Galati, Poelhekke, and Zhou 2011).
During a longer post-crisis period in the Euro Area, when inflation fell and was persistently below target, there is evidence that the anchoring of inflation expectations weakened (Grishchenko, Mouabbi, and Renne 2017; Garcia and Werner 2018). The findings, which are based on different methodologies and different measures of inflation expectations, are less consistent for the United States, where anchoring is alternately found to have improved and deteriorated significantly in the post-crisis period (Ciccarelli, Garcia, and Montes-Galdón 2017; Grishchenko, Mouabbi, and Renne 2017). Overall, given the size of the shocks during the crisis, expectations in advanced economies remained fairly well anchored (Miles et al. 2017).17
AAnchoring of inflation expectations in EMDEs. Evidence on the anchoring of inflation expectations in EMDEs is more limited, but some studies suggest that inflation targeting plays a role (Appendix 2). Using monthly survey data from Consensus Economics for a sample of 22 EMDEs and 14 advanced economies in a structural vector autoregressive model, Davis (2014) finds evidence that the introduction of inflation targeting is associated with a statistically significant reduction in the response of 12-month-ahead inflation expectations to shocks in both oil prices and observed inflation. Using market-based measures of inflation expectations for Brazil, Chile, and Mexico, De Pooter et al. (2014) document that long-term inflation expectations became better anchored in these countries over the preceding decade, especially in Chile and Mexico. Although they do not specifically test for the role of inflation targeting, they ascribe this result to recent improvements in the credibility of these countries’ central banks.
IMF (2016) estimates a hybrid New Keynesian Phillips curve using data from a large sample of countries (24 advanced economies and 20 EMDEs). It reports that although the coefficient on lagged inflation (backward-looking expectations) started declining in the early 2000s, there was a reversal in this trend in the aftermath of the Great Recession, with the coefficient returning close to its value in the early 1990s. This study also finds that the sensitivity of inflation expectations to macroeconomic news (proxied by the difference between expected and realized inflation) is negatively correlated with standard measures of central bank independence and transparency, and that expectations become
17 Strohsal and Winkelmann (2015) examine the anchoring of inflation expectations, as well as the sensitivity to news shocks, using a sample of four advanced economies. They find that the degree of anchoring did not change during the crisis.

10
better anchored when countries adopt an inflation targeting regime.18 IMF (2018) reports that multiple measures of the degree of anchoring of inflation expectations point to an improvement in the anchoring of expectations over the past two decades. However, there has been considerable heterogeneity in the extent of anchoring across emerging market economies.19
In the context of Brazil, the literature examines a wide range of factors that might diminish the beneficial effects of inflation targeting on anchoring, broadly concluding that central bank transparency, central bank credibility, and the country’s fiscal position are all important in shaping inflation expectations. De Mendonça and Galveas (2013) show that, when controlling for central bank transparency, the forward-looking and hybrid specifications of the Phillips curve are more suitable for explaining current inflation than the purely backward- looking specifications. Yet, inflation expectations react more strongly to actual inflation, exchange rate movements, and output shocks when there is a problem of central bank credibility (Cortes and Paiva 2017). A deterioration in the fiscal position could also impede the anchoring of inflation expectations because of fears that monetary policy will be constrained, especially in cases where high interest rates imply unstable public debt dynamics (Cerisola and Gelos 2009; de Mendonça and Veiga 2014).20
4. Inflation expectations: Trends and anchors
Inflation expectations can provide valuable evidence about the credibility of a central bank. As documented by many studies, there is a close link between inflation expectations and monetary policy effectiveness. The more credible households and firms consider the central bank, the more likely inflation expectations are well anchored. In turn, well-anchored inflation expectations are found to support the effectiveness of monetary policy. Assessing and improving the degree of anchoring of inflation expectations are thus critical tasks for monetary policy makers.
4.1. Evolution of inflation expectations
In both advanced economies and EMDEs, long-term (five-year-ahead) inflation expectations have fallen during the past two to three decades. After declining rapidly
18 Estimations that allow for time-varying coefficients indicate that, although inflation expectations are better anchored in advanced economies than in EMDEs, anchoring has improved in both groups over time (IMF 2016). Other studies offer similar findings. Capistrán and Ramos-Francia (2010) and Mehrotra and Yetman (forthcoming) conclude from data for a large sample of EMDEs that inflation targeting has affected inflation expectations. Studies of Mexico, Brazil, and South Africa find that the adoption of inflation targeting has helped anchor expectations in each case (Carrasco and Ferreiro 2013; Cerisola and Gelos 2009; and Reid 2009, respectively). However, Kabundi, Schaling, and Some (2015) show that, in South Africa, even with inflation targeting, expectations of price and wage setters (businesses and trade unions) were higher than the upper bound of the official target band, while expectations of analysts were within the target band. This study also finds that expectations of price and wage setters were substantially influenced by lagged inflation, but that those of analysts were not. 19 IMF (2018) focuses on four measures: absolute deviation of three-year-ahead inflation forecast from target, variability of inflation forecasts, dispersion of inflation forecasts, and sensitivity to inflation shocks. In the context of a small macroeconomic model, IMF (2018) also shows that better-anchored inflation expectations reduce inflation persistence and limit the pass-through of currency movements to domestic prices. 20 Using a dynamic stochastic general equilibrium model calibrated to the United States, Eusepi and Preston (2018a, 2018b) conclude that government liabilities can reduce the effectiveness of monetary policy in controlling inflation in economies with high government debt under imperfect knowledge.

11
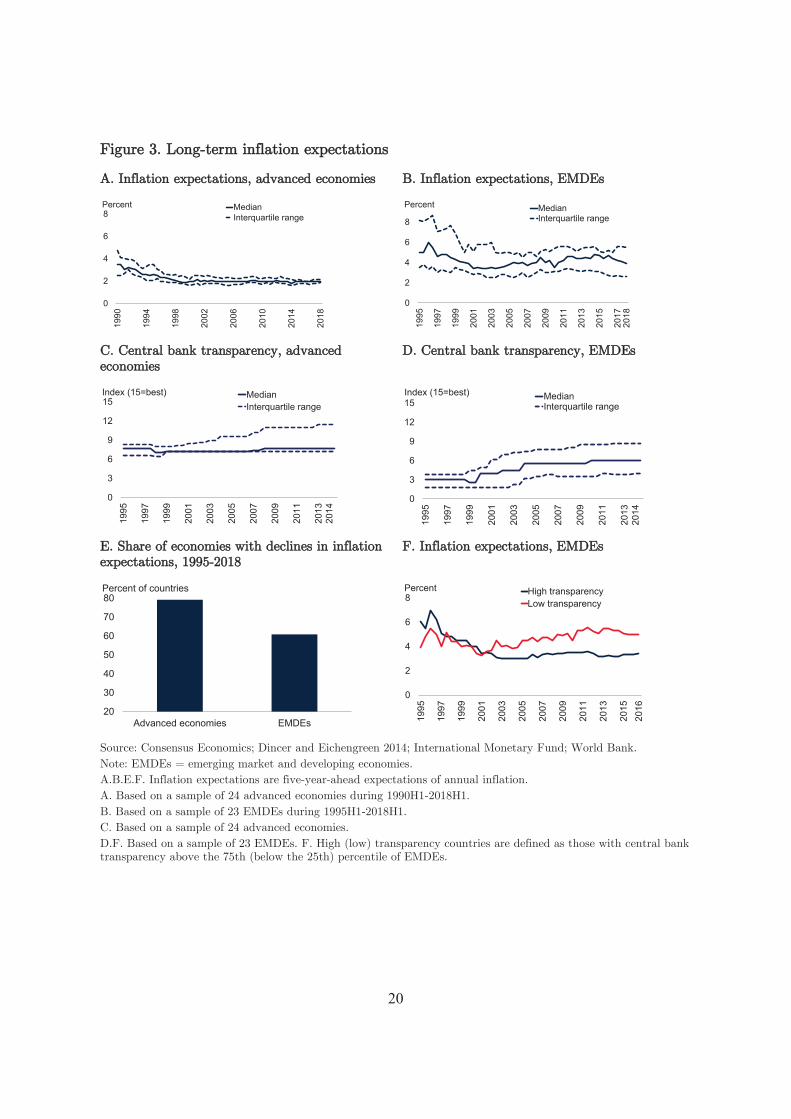
during the 1990s, inflation expectations in advanced economies have remained stable at around 2 percent per year since the mid-2000s, with very little cross-country variation (Figure 3). In EMDEs, inflation expectations decreased markedly in the second half of the 1990s. Although they have not regained their mid-1990s peak, expectations trended upward from 2005 to 2014, before retreating somewhat in recent years. Throughout the entire sample period, inflation expectations in EMDEs displayed wider cross-country dispersion than in advanced economies, as did measures of central bank transparency. However, the rise in inflation expectations during 2005-14 coincided with an improvement in central bank transparency in EMDEs as a group.
DDifferences in anchoring between advanced economies and EMDEs. If inflation expectations are well anchored, they should be relatively insensitive to news, because economic agents assume that transitory shocks do not affect inflation over the long run. The degree of anchoring can be assessed empirically by regressing changes in five-year-ahead inflation expectations on macroeconomic news.21 Relevant news can be proxied by inflation shocks—the difference between realized inflation and short-term inflation expectations in the previous period (that is, six months prior). Following earlier studies, this paper employs two simple empirical strategies to study the extent of anchoring inflation expectations: a panel regression model with country and time fixed effects, and a time-varying model that provides a flexible framework to track time variation in the degree of anchoring (Appendix 3). The first approach provides an overview of how well expectations are anchored in different country groups (for example, advanced economies versus EMDEs) and time periods. The second approach shows how country-specific and time-varying measures of the degree of anchoring have evolved.
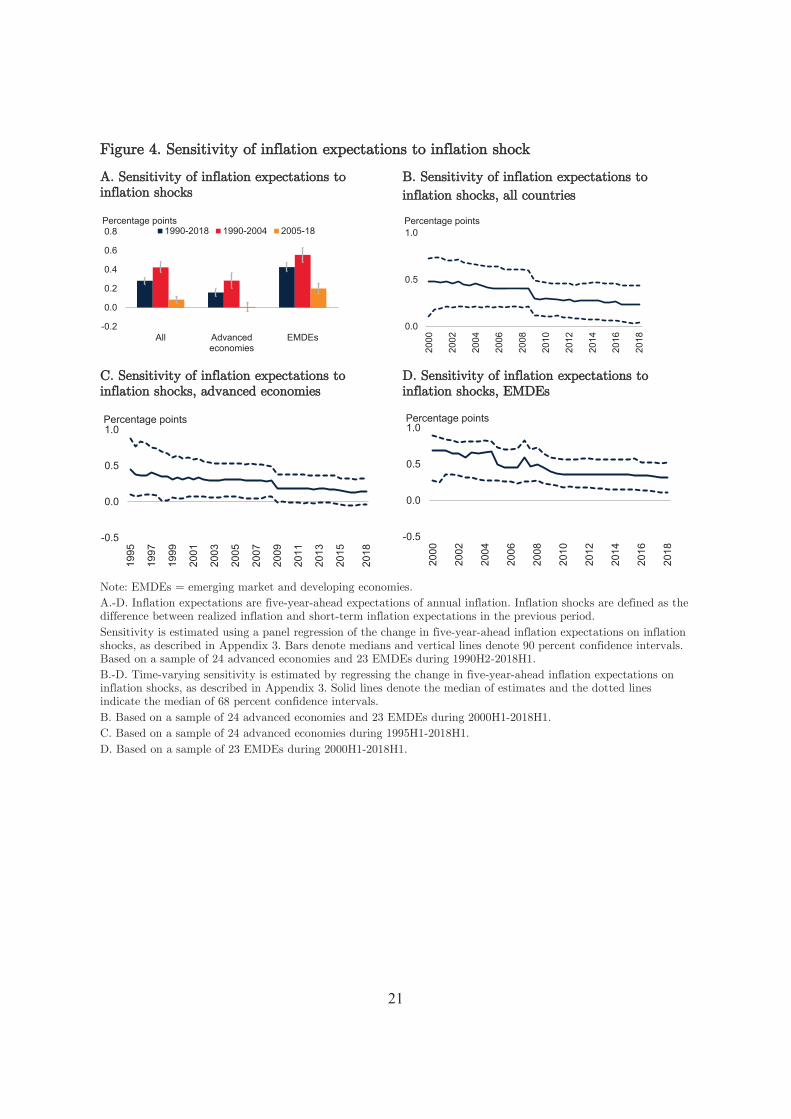
The empirical exercises produce three major results. First, the sensitivity of long- term (five-year-ahead) inflation expectations to inflation shocks in both advanced economies and EMDEs is greater than zero for 1990-2018, indicating imperfect anchoring of inflation expectations (Figure 4; Appendix 4). Second, the sensitivity is lower in advanced economies than in EMDEs, and the difference in sensitivity between these two groups is statistically significant. This finding, which indicates that expectations are better anchored in the advanced economies, is consistent with the view that monetary policy is less credible in EMDEs than in advanced economies.
Third, in both country groups, inflation expectations have become better anchored over time (that is, coefficients for both country groups are statistically significantly smaller in the latter time periods). Especially during 2005-18, expectations in advanced economies are found to have been very well anchored (the coefficient is not statistically significantly different from zero). In EMDEs, anchoring improved markedly during 2005-18, despite the slight increase in inflation expectations in these economies since 2005.
21 The sensitivity of long-term inflation expectations to inflation shocks is used in this paper to measure the degree of anchoring of inflation expectations. This measure is employed in several previous studies (Beechey, Johannsen, and Levin 2011; Galati, Poelhekke, and Zhou 2011; Gürkaynak, Levin, and Swanson 2010; IMF 2016; Garcia and Werner 2018; De Pooter et al. 2014). Other previous studies employ different measures of anchoring of inflation expectations: the deviation of long-term inflation expectations from an inflation target (Buono and Formai 2018; Bordo and Siklos 2017), variance of inflation expectations (Grishchenko, Mouabbi, and Renne, 2017), and dispersion of inflation forecasts (Capistrán and Ramos-Francia 2010). These measures are highly correlated (IMF 2018). The measure employed here is useful for at least three reasons: it is available for a large sample of countries; it can be used in a time-varying model; and the findings using it can be compared to others in the literature.

12
44.2. Roles of global and domestic shocks in anchoring inflation expectations
The time-varying model described above is extended to estimate the response of inflation expectations to shocks from two sources, global and domestic. Examples of domestic shocks include unexpected electoral outcomes, wage disputes, and currency movements. Global shocks (surprises) could stem from sudden movements in food prices, oil prices, global economic activity, and financial conditions in major advanced economies.22 In the model, a global inflation shock is defined as the first principal component of national inflation shocks for the full sample of countries (Appendix 3). A domestic inflation shock is defined as the residual from a regression of the national inflation shock on the global inflation shock.
The regressions produce four major results (Figure 5). First, for the median economy in each country group, the sensitivity of inflation expectations to both types of shocks is positive, indicating imperfect anchoring. Second, in the case of advanced economies, there was a gradual decline in the sensitivity of inflation expectations to global shocks from the 1990s to the late 2000s, followed by a large one-time drop during the global financial crisis. There was a much less pronounced downward trend in the sensitivity of inflation expectations to domestic shocks than to global shocks. These results imply that, in advanced economies, the improved anchoring of expectations has been partly driven by the reduction in the sensitivity of inflation expectations to global shocks.
Third, for EMDEs, the sensitivity of inflation expectations to domestic shocks gradually fell during 2005-12, and since 2012 has been stable. There has also been a slight decline in the sensitivity of expectations to global shocks since 2000. Finally, inflation expectations appear to be more sensitive to both global and domestic shocks in EMDEs than in advanced economies, implying weaker anchoring of expectations in the former group. The robustness of the results is tested by replacing the global shock, as described above, with an oil price shock, food price shock, global liquidity shock, and global output gap shock. These exercises lead to broadly consistent findings with the headline results.
5. Determinants of anchoring expectations
The improved anchoring of five-year-ahead inflation expectations over time in advanced economies and EMDEs, as suggested by the time-varying model in the previous section, may be associated with policy reforms aimed at increasing central bank credibility since the early 1990s (Mishkin 2007). Using the estimated sensitivity of inflation expectations as a dependent variable, panel regression models are used to assess which factors determine the degree of anchoring of expectations (Appendix 3). The explanatory variables in the models include the presence of an inflation targeting regime, central bank transparency, the presence of a fixed exchange rate regime, financial openness, trade openness, and fiscal sustainability.
Inflation targeting and central bank transparency. If central banks in advanced economies 22 De Pooter et al. (2014) examine how foreign and domestic news surprises affect (market-based) inflation expectations in Brazil, Chile, and Mexico, using daily data. In their framework, foreign news surprises stem from macroeconomic developments in the United States and China and fluctuations in oil and food prices. They report that U.S. nonfarm payroll data releases have a significant impact on long-term inflation expectations in Chile and Mexico, while there is no corresponding impact in Brazil. The impact of news related to oil and food prices is not statistically significant.
13
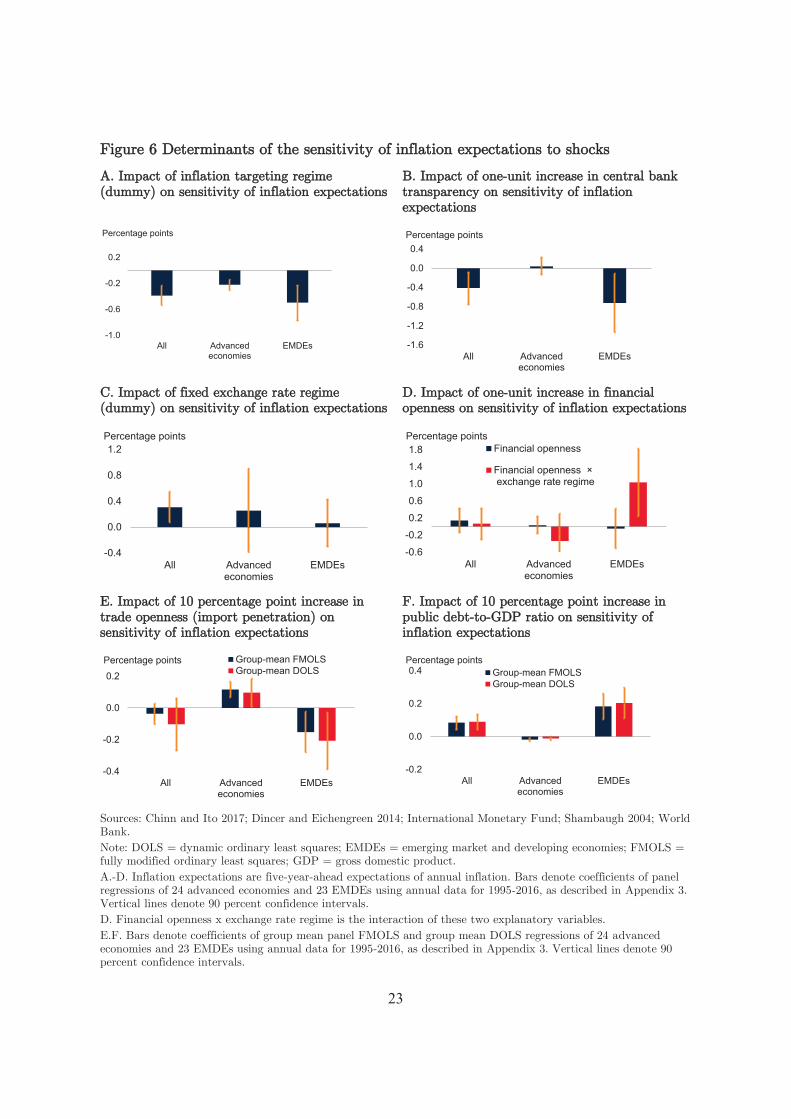
are perceived as credible, they can successfully anchor inflation expectations without explicit inflation targets or formal transparency rules. However, in EMDEs, where central banks still need to build credibility, explicit targets and transparency rules are more likely to be necessary to anchor expectations. The regression results show that the coefficient on inflation targeting is statistically significant and negative, meaning it is associated with lower sensitivity of inflation expectations to shocks (Figure 6).23 For central bank transparency, the coefficient is only statistically significant and negative for the full sample of countries and the EMDE subsample. Central bank transparency has improved in EMDEs over the past two decades. In advanced economies, although the degree of central bank transparency is higher than in EMDEs, it has not changed much during this period.
FFinancial integration and exchange rate regime. Financial integration appears to exert a disciplining effect on macroeconomic policy (Tytell and Wei 2004; Gupta 2008; Kose et al. 2010). For example, integration could raise the cost of loose monetary policy in the form of larger capital outflows. However, more financially open economies are more vulnerable to external shocks, which may make it more difficult for policy makers to anchor inflation expectations. The results indicate that the correlation between financial openness and the anchoring of inflation expectations is not statistically significant for the full sample of countries or the EMDE subsample. However, as documented above, long-term inflation expectations in EMDEs are more sensitive to global shocks. Hence, large external shocks could offset the benefits of financial integration to anchoring expectations in EMDEs.
The use of pegged exchange rates might be a signal for a credibility crutch in countries with limited monetary policy credibility (Levy Yeyati, Sturzenegger, and Reggio 2010). As is well-known from the impossible trinity argument, employing a fixed exchange rate regime when capital movements are free could hamper the independence of monetary policy.24 Although the exchange rate regime by itself does not appear to be relevant for anchoring inflation expectations, the results show that when financial openness is interacted with the fixed exchange rate regime dummy, the interaction term becomes significant. This result suggests that the exchange rate regime does matter for anchoring inflation expectations in more financially open economies.25
Trade integration. Trade integration could affect inflation expectations through competition in product markets that could increase the responsiveness of domestic prices to shocks. For example, one line of research finds that higher price flexibility steepens the Phillips curve, reducing the short-run output gain from a monetary expansion, and lowering the incentive for central banks to adopt inflationary policies (Romer 1993; Rogoff 23 Capistrán and Ramos-Francia (2010) also find that inflation targeting affects inflation expectations only in EMDEs, with no effect on the dispersion of inflation expectations in advanced economies. They argue that given the recent relative stability of inflation in advanced economies, professional forecasters may have homogeneous views about future inflation, so that the dispersion remains unchanged even after the introduction of an explicit inflation target. 24 The impossible trinity is the argument that a country cannot have more than two of the following: fixed exchange rate, free capital movement, and independent monetary policy. As a result, countries with inflation targeting regimes typically also operate with flexible exchange rates (De Gregorio 2009a). 25 The baseline regressions use Chinn and Ito’s (2017) de jure measure of financial openness and Shambaugh’s (2004) classification of exchange rate regimes. The baseline results do not change when a de facto measure of capital account liberalization (sum of foreign assets and liabilities as percentage of GDP) and an alternative measure of exchange rate regime classification (from Ilzetzki, Reinhart, and Rogoff 2017) are used as explanatory variables.
14
2006). Alternatively, outsourcing of labor through global value chains may reduce the responsiveness of wages to domestic labor market conditions and hence flatten the Phillips curve (Blanchard, Cerutti, and Summers 2015; Blanchard 2016; Miles et al. 2017). However, at least for the United States, lower marginal costs, rather than globalization, are the key driver of the flattening of the Phillips curve.26
The regression results show that the correlation between import penetration and sensitivity of inflation expectations to shocks is negative and statistically significant for the subsample of EMDEs. Thus, for EMDEs only, the anchoring of inflation expectations improves as import penetration rises, consistent with theories suggesting that globalization is associated with improved anchoring.27
FFiscal sustainability. Inflation expectations are unlikely to be well anchored if there are questions about fiscal sustainability because of fears that monetary policy will be constrained, especially in cases where high interest rates imply unstable public debt dynamics. The regression results for the full sample of countries, and for the EMDE subsample, are consistent with this prediction, showing a positive and statistically significant correlation between the ratio of public debt to GDP and the sensitivity of long-term inflation expectations to inflation shocks.28
6. Anchoring expectations: Country experiences
The findings from the empirical exercises on the degree and determinants of inflation anchoring in advanced economy and EMDE country groups are broadly consistent with the behavior of inflation expectations at the country level. Yet, there are still lessons to be learned from individual countries’ experiences.
Among advanced economies, the sensitivity of inflation expectations to inflation shocks tends to be lower under inflation targeting. Yet, at the country level, inflation targeting does not necessarily guarantee firm anchoring of inflation expectations (Figure 7). In Canada, New Zealand, and the United Kingdom, for instance, the sensitivity of expectations to inflation shocks has been close to zero since 2000. In these countries, the early introduction of inflation targeting may have helped anchor expectations.29 Japan has 26 The empirical literature examining whether globalization affects domestic inflation produces mixed results. For example, Calza (2009) and Ihrig et al. (2010) find no robust evidence that global slack affects the parameters of the inflation process. Gaiotti (2010) finds that the flattening of the Phillips curve is due to globalization. In contrast, Borio and Filardo (2007) argue that global slack may become a key driver of domestic inflation, while Auer, Borio, and Filardo (2017) show that the rise of global value chains has amplified the importance of global slack in driving domestic inflation. Forbes (2018) suggests that inflation models should allow key global factors, including global slack, to adjust over time. As a robustness check, government effectiveness (measured by the World Bank’s Worldwide Governance Indicators) is also included as an explanatory variable in the regressions here. It is not statistically significant. 27 Using a New Keynesian model, Martínez-García (2017) argues that the impact of globalization on monetary policy effectiveness is underestimated if the analysis uses the standard trade openness measures, and that what matters is the elasticity of substitution between locally produced and imported goods. 28 De Mendonça and Veiga (2014) argue that even under an inflation targeting regime, interest rate hikes to reach target inflation imply increases in the primary surplus required for stabilizing the public debt, and that this fiscal deterioration could constrain monetary policy. These authors also show that the public-debt-to-GDP ratio has a statistically significant relationship with the deviation between inflation and its target. 29 New Zealand, Canada, the United Kingdom, and Korea introduced inflation targeting in 1990, 1991, 1992, and 1998, respectively. Kumar et al. (2015) argue that expectations (based on firm-level data rather than

15
had difficulty anchoring expectations after introducing its inflation targeting regime in 2013, perhaps because of its recent history of persistently low inflation. Inflation expectations are not as well anchored under persistently below-target inflation as when inflation is close to target (Ehrmann 2015).
In the Euro Area, where the European Central Bank’s main objective since its inception in 1999 has been to maintain price stability (defined as inflation of less than, but close to, 2 percent in the medium term), the sensitivity of inflation expectations was lower than that in the United States in 2005 (Beechey, Johannsen, and Levin 2011). This pattern reversed in 2010-15, when sensitivity in the United States was close to zero—lower than that in the Euro Area—due in part to persistent undershooting of the European Central Bank’s target and perhaps also to the U.S. Federal Reserve’s adoption of an official inflation target in 2012.30
The record of EMDE central banks in anchoring inflation expectations under inflation targeting regimes has been mixed. Appendix 5 provides case studies for Brazil, Chile, and Poland. In Brazil, although long-term inflation expectations have been relatively stable under the inflation targeting regime that began in 1999, the sensitivity of expectations to shocks remains elevated relative to that in Chile and Poland. Less than ideal fiscal conditions and worsening central bank transparency during part of the inflation targeting period may have contributed to this outcome (Cerisola and Gelos 2009; de Mendonça and Galveas 2013; de Mendonça and Veiga 2014).
In contrast, Chile has had considerable success: the sensitivity of inflation expectations to shocks has for some years been close to the median for advanced economies. The gradual introduction of inflation targeting in the 1990s gave the central bank time to build its credibility. From the outset of the inflation targeting regime, the central bank pursued a robust communications effort that included the publication of a quarterly Monetary Policy Report with strong analytical content.31 Chile’s adoption of an inflation target as part of a comprehensive, credible macroeconomic policy framework may have helped generate favorable macroeconomic outcomes (De Gregorio, Tokman, and Valdés 2005; Valdés 2007).
Poland has also succeeded with inflation targeting, which it began in 1999, even though domestic financial markets were immature, and the central bank had limited knowledge of monetary policy transmission at the time of introduction. The transition to a flexible exchange rate regime concurrent with the adoption of inflation targeting may have helped to anchor expectations. Over time, inflation expectations fell, eventually settling near the policy target rate, and the sensitivity of expectations to shocks became quite low.
In India and South Africa, the sensitivity of inflation expectations to shocks fell markedly after the introduction of inflation targeting. In South Africa, the combination of inflation
those of professional forecasters) are not well anchored in New Zealand because forecasters do not understand the central bank’s objective function. Yetman (2017) and Beaudry and Ruge-Murcia (2017) find that the implementation of inflation targeting in Canada and the United Kingdom has been more successful than that in other inflation targeting countries. 30 Garcia and Werner (2018) find that there has been a decline in the extent of anchoring inflation expectations in the Euro Area since 2013. 31 For instance, the Central Bank of Chile’s quarterly inflation report included, from its inception, inflation forecasts with confidence intervals displayed in fan charts of the type pioneered by the Bank of England (Mishkin 2007).
16
targeting and consistently high central bank transparency may have been key to anchoring expectations.32 In India, however, lagged inflation, as well as current and lagged changes in fuel and food prices, have been found to have significantly affected inflation expectations (Benes et al. 2017; Patra and Ray 2010).
Mexico has been less successful than Chile in anchoring inflation expectations under an inflation targeting regime. The Bank of Mexico did not publish its own inflation forecasts for several years after adopting inflation targeting (Batini and Laxton 2006; De Pooter et al. 2014). Over time, however, the central bank’s communication strategy has improved, and it now publishes its inflation forecasts and releases the minutes of its monetary policy meetings (Carrasco and Ferreiro 2013). Finally, in Russia, high, positive sensitivity of inflation expectations to inflation shocks may reflect low central bank transparency (Dincer and Eichengreen 2014). However, Russia is relatively new to inflation targeting, having introduced the regime in 2015.
7. Conclusion
This paper contributes to the literature on inflation expectations in EMDEs by answering three questions. First, how does the degree of anchoring of long-term inflation expectations differ between advanced economies and EMDEs? Second, how sensitive are inflation expectations to global and domestic shocks? Third, what are the main determinants of the degree of anchoring of inflation expectations? The principal conclusions are the following:
First, long-term inflation expectations have declined and become more firmly anchored in the past two decades in both advanced economies and EMDEs. However, anchoring in EMDEs remains notably weaker than in advanced economies. This finding is consistent with the view that monetary policy is less credible in EMDEs than in advanced economies.
Second, long-term inflation expectations in EMDEs are more sensitive to both global and domestic shocks than are inflation expectations in advanced economies. The sensitivity of EMDE inflation expectations to domestic shocks gradually fell between 2005 and 2012 and has since been mostly stable, while the sensitivity of EMDE inflation expectations to global shocks has fallen slightly since 2000. In advanced economies, a large drop in the sensitivity of inflation expectations to global shocks in the wake of the global financial crisis followed a steady decline from the late 1990s to the late 2000s; there has been a much less pronounced downward trend in sensitivity to domestic shocks. These findings suggest that the improvement in the anchoring of inflation expectations in advanced economies is partly due to the decline in sensitivity to global shocks.
Third, the institutional and monetary policy environment matters for the anchoring of inflation expectations, as do the general macroeconomic environment and structural characteristics of the economy. The paper finds that the presence of an inflation targeting regime and a rise in central bank transparency are associated with better anchoring of
32 Kabundi, Schaling, and Some (2015) and Miyajima and Yetman (2018) show that, even in the presence of an inflation targeting framework, expectations of price setters (businesses and unions) in South Africa are higher than the upper bound of the official target band; the expectations of analysts are within the target band. In addition, expectations of price setters put a greater weight on past inflation, whereas analysts’ expectations are more forward looking.

17
long-term inflation expectations. For EMDEs, lower public debt and greater trade openness are also associated with better anchoring of expectations. This finding implies that the anchoring of inflation expectations in EMDEs depends not only on monetary policy, but also on structural factors and fiscal policy.
Case studies for Brazil, Chile, and Poland provide examples of these multiple factors at work. In Brazil, for instance, fiscal policy, together with backtracking on central bank transparency for a period, may have held back progress on improving the anchoring of inflation expectations. In Chile, a highly transparent central bank, together with a credible macroeconomic framework, may have contributed to the central bank’s success in achieving well-anchored inflation expectations. And in Poland, the simultaneous adoption of inflation targeting and a floating exchange rate regime may have helped anchor expectations.
Although inflation expectations have become significantly better anchored during the past decade, the results show that there is still room for improvement, especially in EMDEs. Although inflation targeting seems to have been useful in reducing the sensitivity of inflation expectations to shocks, inflation targeting should not be considered necessary or sufficient for improved anchoring of expectations. The overall macroeconomic policy framework, including fiscal conditions and the transparency of the central bank, is also important for success.
These findings point to several research avenues to explore. First, research could examine the determinants of a wider range of measures of inflation expectations in EMDEs. This research direction would be particularly worthwhile if data availability could be improved. Second, it would be useful to consider nonlinearities between institutional factors and the anchoring of inflation expectations. In addition, there is a need to investigate how complementarities between institutional factors and fiscal and monetary policy frameworks help improve the anchoring of inflation expectations.

18
FFigure 1.. SSurvey--bbased measures of inflation expectations: Country evidence
AA. 1--yyear--aahead inflation expectations, selected aadvanced economies, average
B. 1--year--ahead inflation eexpectations, selected EMDEs, average
C. Volatility of 1--year--ahead inflation expectations, selected advanced economies
D. Volatility of 1--year--ahead inflation expectations, selected EMDEs
E. 5--year--ahead inflation expectations, selected advanced economies, average
F. 5--year--ahead inflation expectations, South Africa
Source: Bank of Japan; Bloomberg; Bureau of Economic Research, South Africa; Central Bank of the Philippines; Consensus Economics; Haver Analytics; International Monetary Fund; Reserve Bank of India; Reserve Bank of New Zealand; University of Michigan; World Bank. Note: EMDEs = emerging market and developing economies. A.C. The sample period is 2006H1-2018H1. B.D. The sample period is 2007H2-2018H1. C.D. Volatility is measured by standard deviation. E. The sample period is 2009H1-2018H1.
0
1
2
3
4
5
United States Japan New Zealand
ProfessionalHousehold
Percent
0
2
4
6
8
10
12
India Philippines South Africa
ProfessionalHousehold
Percent
0
1
2
United States Japan New Zealand
ProfessionalHousehold
0
1
2
3
India Philippines South Africa
ProfessionalHousehold
0
1
2
3
4
5
United States Japan New Zealand
ProfessionalHousehold
Percent
5.0
5.5
6.0
6.5
7.0
2011
2012
2013
2014
2015
2016
2017
2018
Analysts Business Labor
Percent

19
FFigure 22.. SSurvey--bbased and market--bbased measures of inflation expectations: Country eevidence
A. 5--year--ahead inflation expectations, selected advanced economies, average
B. 55-yyear-aahead inflation expectations, selected EMDEs, average
C. Volatility of inflation expectations, selected advanced economies
D. Volatility of inflation expectations, selected EMDEs
Source: Bloomberg; Consensus Economics; International Monetary Fund; World Bank. Note: EMDEs = emerging market and developing economies. A.-D. Market-based inflation expectations are inflation swap rates (five-year, five-year forward) for advanced economies and break-even inflation rates (five-year-ahead) for EMDEs. A.C. The sample period is 2007H1-2018H1. B.D. The sample period is 2012H2-2018H1. C.D. Volatility is measured by standard deviation.
0
1
2
3
4
UnitedStates
Japan UnitedKingdom
Professional Market-based measurePercent
01234567
Brazil Chile Mexico Turkey SouthAfrica
ProfessionalMarket-based measure
Percent
0.0
0.2
0.4
0.6
UnitedStates
Japan UnitedKingdom
ProfessionalMarket-based measure
0.0
0.2
0.4
0.6
0.8
1.0
1.2
Brazil Chile Mexico Turkey SouthAfrica
ProfessionalMarket-based measure
20
FFigure 3.. LLong--tterm inflation expectations
AA. Inflation expectations, advanced economies BB. Inflation eexpectations, EMDEs
CC. Central bank transparency, advanced eeconomies
D. Central bank transparency, EMDEs
E. Share of economies with declines in inflation expectations, 1995-2018
F. Inflation expectations, EMDEs
Source: Consensus Economics; Dincer and Eichengreen 2014; International Monetary Fund; World Bank. Note: EMDEs = emerging market and developing economies. A.B.E.F. Inflation expectations are five-year-ahead expectations of annual inflation. A. Based on a sample of 24 advanced economies during 1990H1-2018H1. B. Based on a sample of 23 EMDEs during 1995H1-2018H1. C. Based on a sample of 24 advanced economies. D.F. Based on a sample of 23 EMDEs. F. High (low) transparency countries are defined as those with central bank transparency above the 75th (below the 25th) percentile of EMDEs.
0
2
4
6
8
1990
1994
1998
2002
2006
2010
2014
2018
MedianInterquartile range
Percent
0
2
4
6
8
1995
1997
1999
2001
2003
2005
2007
2009
2011
2013
2015
2017
2018
MedianInterquartile range
Percent
0
3
6
9
12
15
1995
1997
1999
2001
2003
2005
2007
2009
2011
2013
2014
MedianInterquartile range
Index (15=best)
0
3
6
9
12
15
1995
1997
1999
2001
2003
2005
2007
2009
2011
2013
2014
MedianInterquartile range
Index (15=best)
20
30
40
50
60
70
80
Advanced economies EMDEs
Percent of countries
0
2
4
6
8
1995
1997
1999
2001
2003
2005
2007
2009
2011
2013
2015
2016
High transparencyLow transparency
Percent
21
FFigure 4.. SSensitivity oof inflation expectations to inflation shock
AA. Sensitivity of inflation expectations to iinflation shocks
B. Sensitivity of inflation expectations to inflation shocks, all countries
C. Sensitivity of inflation expectations to inflation shocks, advanced economies
D. Sensitivity of inflation expectations to inflation shocks, EMDEs
Note: EMDEs = emerging market and developing economies. A.-D. Inflation expectations are five-year-ahead expectations of annual inflation. Inflation shocks are defined as the difference between realized inflation and short-term inflation expectations in the previous period. Sensitivity is estimated using a panel regression of the change in five-year-ahead inflation expectations on inflation shocks, as described in Appendix 3. Bars denote medians and vertical lines denote 90 percent confidence intervals. Based on a sample of 24 advanced economies and 23 EMDEs during 1990H2-2018H1. B.-D. Time-varying sensitivity is estimated by regressing the change in five-year-ahead inflation expectations on inflation shocks, as described in Appendix 3. Solid lines denote the median of estimates and the dotted lines indicate the median of 68 percent confidence intervals. B. Based on a sample of 24 advanced economies and 23 EMDEs during 2000H1-2018H1. C. Based on a sample of 24 advanced economies during 1995H1-2018H1. D. Based on a sample of 23 EMDEs during 2000H1-2018H1.
-0.2
0.0
0.2
0.4
0.6
0.8
All Advancedeconomies
EMDEs
1990-2018 1990-2004 2005-18Percentage points
0.0
0.5
1.0
2000
2002
2004
2006
2008
2010
2012
2014
2016
2018
Percentage points
-0.5
0.0
0.5
1.0
1995
1997
1999
2001
2003
2005
2007
2009
2011
2013
2015
2018
Percentage points
-0.5
0.0
0.5
1.020
00
2002
2004
2006
2008
2010
2012
2014
2016
2018
Percentage points

22
FFigure 5.. SSensitivity oof inflation expectations to global and domestic inflation shocks
AA. Sensitivity of inflation eexpectations to global sshocks, all countries
B. Sensitivity of inflation expectations to domestic shocks, all countries
C. Sensitivity of inflation expectations to global shocks, advanced economies
D. Sensitivity of inflation expectations to domestic shocks, advanced economies
E. Sensitivity of inflation expectations to global shocks, EMDEs
F. Sensitivity of inflation expectations to domestic shocks, EMDEs
Source: World Bank. Note: EMDEs = emerging market and developing economies. A.-F. Inflation expectations are five-year-ahead expectations of annual inflation. Time-varying sensitivity is estimated by regressing the change in five-year-ahead inflation expectations on global and domestic shocks, as described in Appendix 3. Solid lines denote the median of estimates and dotted lines indicate the median of 68 percent confidence intervals. A.B. Based on a sample of 24 advanced economies and 23 EMDEs during 2000H1-2018H1. C.D. Based on a sample of 24 advanced economies during 1995H1-2018H1. E.F. Based on a sample of 23 EMDEs during 2000H1-2018H1.
-0.5
0.0
0.5
1.0
1.5
2000
2002
2004
2006
2008
2010
2012
2014
2016
2018
Percentage points
-0.5
0.0
0.5
1.0
1.5
2000
2002
2004
2006
2008
2010
2012
2014
2016
2018
Percentage points
-0.5
0.0
0.5
1.0
1.5
1995
1997
1999
2001
2003
2005
2007
2009
2011
2013
2015
2018
Percentage points
-0.5
0.0
0.5
1.0
1.519
95
1997
1999
2001
2003
2005
2007
2009
2011
2013
2015
2018
Percentage points
-0.5
0.0
0.5
1.0
1.5
2000
2002
2004
2006
2008
2010
2012
2014
2016
2018
Percentage points
-0.5
0.0
0.5
1.0
1.5
2000
2002
2004
2006
2008
2010
2012
2014
2016
2018
Percentage points
23
FFigure 6 DDeterminants oof the sensitivity of inflation expectations to shocks
AA. Impact of inflation targeting regime ((dummy) on sensitivity of inflation expectations
BB. Impact of one--uunit increase iin central bank ttransparency on sensitivity of inflation expectations
C. Impact of fixed exchange rate regime ((dummy) on sensitivity of inflation expectations
D. Impact of one--unit increase in financial openness on sensitivity of inflation expectations
E. Impact of 10 percentage point increase in trade openness (import penetration) on sensitivity of inflation expectations
F. Impact of 10 percentage point increase in public debt-to-GDP ratio on sensitivity of inflation expectations
Sources: Chinn and Ito 2017; Dincer and Eichengreen 2014; International Monetary Fund; Shambaugh 2004; World Bank. Note: DOLS = dynamic ordinary least squares; EMDEs = emerging market and developing economies; FMOLS = fully modified ordinary least squares; GDP = gross domestic product. A.-D. Inflation expectations are five-year-ahead expectations of annual inflation. Bars denote coefficients of panel regressions of 24 advanced economies and 23 EMDEs using annual data for 1995-2016, as described in Appendix 3. Vertical lines denote 90 percent confidence intervals. D. Financial openness x exchange rate regime is the interaction of these two explanatory variables. E.F. Bars denote coefficients of group mean panel FMOLS and group mean DOLS regressions of 24 advanced economies and 23 EMDEs using annual data for 1995-2016, as described in Appendix 3. Vertical lines denote 90 percent confidence intervals.
-1.0
-0.6
-0.2
0.2
All Advancedeconomies
EMDEs
Percentage points
-1.6
-1.2
-0.8
-0.4
0.0
0.4
All Advancedeconomies
EMDEs
Percentage points
-0.4
0.0
0.4
0.8
1.2
All Advancedeconomies
EMDEs
Percentage points
-0.6-0.20.20.61.01.41.8
All Advancedeconomies
EMDEs
Financial openness
Financial openness × exchange rate regime
Percentage points
-0.4
-0.2
0.0
0.2
All Advancedeconomies
EMDEs
Group-mean FMOLSGroup-mean DOLS
Percentage points
-0.2
0.0
0.2
0.4
All Advancedeconomies
EMDEs
Group-mean FMOLSGroup-mean DOLS
Percentage points

24
FFigure 7.. TTime--vvarying sensitivity of inflation expectations to shocks: Country eexperiences
A. Sensitivity of inflation expectations to inflation shocks, advanced economies (1)
B. Sensitivity of inflation expectations to inflation shocks, advanced economies (2)
C. Sensitivity of inflation expectations to iinflation shocks, Europe and Central Asia
D. Sensittivity of inflation expectations to inflation shocks, Latin America
E. Sensitivity of inflation expectations to inflation shocks, India
F. Sensitivity of inflation expectations to inflation shocks, South Africa
Source: World Bank. A-F. Inflation expectations are five-year-ahead expectations of annual inflation. Time-varying sensitivity is estimated by regressing long-term inflation forecast revisions on inflation shocks. Vertical lines denote 68 percent confidence intervals. The model is described in Appendix 3. B. The Euro Area here comprises Austria, Belgium, Finland, France, Germany, Greece, Ireland, Italy, the Netherlands, Portugal, and Spain.
-0.5
0.0
0.5
1.0
1.5
Canada Korea, Rep. NewZealand
UnitedKingdom
2005 2010 2015
Percentage points
-0.5
0.0
0.5
1.0
1.5
Euro Area Japan United States
2005 2010 2015Percentage points
-0.4
0.0
0.4
0.8
1.2
All Advancedeconomies
EMDEs
Percentage points
0.0
0.5
1.0
1.5
Brazil Chile Mexico
2005 2010 2015Percentage points
0.0
0.5
1.0
1.5
2005 2010 2015
Percentage points
0.0
0.5
1.0
1.5
2005 2010 2015
Percentage points

25
AAppendix 1. Primer on expectations and monetary policy
The effectiveness of monetary policy depends on expectations, particularly about the future policy stance. Moreover, there is broad agreement that economic agents form their expectations by extracting signals from their experience of actual policies. Over time, there has been an evolution of views on this topic, which is reflected in the development of the models describing the links between expectations and monetary policy. This appendix presents a brief history of the evolution of views on the topic.
Traditional Keynesian models
The birth of modern macroeconomics is usually associated with the publication of Keynes’ (1936) General Theory of Employment, Interest and Money. However, the backdrop for Keynes’s analysis was the Great Depression, a period of low or negative inflation and stagnant nominal wages (Samuelson and Solow 1960). The General Theory had little to say directly about the issue of inflation and, for simplicity, assumed that money wages were fixed. As the economy recovered, and with World War II posing a new set of challenges due to higher government expenditure, Keynes later discussed the trade-off between excess demand and wage and price inflation (Keynes 1940).
By the 1950s, inflation was becoming more of a problem for policy makers, and Phillips (1958) provided a breakthrough, with statistical evidence on a negative relationship between the unemployment rate and wage inflation in the United Kingdom. The Phillips curve became a standard feature of subsequent Keynesian macroeconomic models. Samuelson and Solow (1960) famously developed the notion of a policy trade-off between reduced unemployment (or increased output) and lower inflation. However, they also pointed out that this trade-off might not be stable.
Friedman (1968) established that adaptive inflation expectations would disrupt this trade-off. A change in the expected rate of inflation would shift the short-run Phillips curve, and over time output and unemployment would return to their long-run equilibrium values, regardless of the rate of inflation. Keynesian modelers incorporated the concepts of endogenous expectations and the natural rate of unemployment (or, equivalently, potential output) into their estimated Phillips curves. Policy makers would no longer be able to run the economy “hot” without facing accelerating inflationary pressure.
Views advanced by Friedman and Phelps
Friedman (1968) forcefully argued that estimates of a stable relationship between inflation and unemployment would exist only when inflation expectations were well anchored. He warned that any attempt to exploit the short-run relationship as if it were permanent would cause expectations to become unanchored, leading to a shift in the Phillips curve. Thus, starting at the natural rate of unemployment, a stimulative monetary policy would lead to higher inflation without any benefit in terms of lower unemployment in the long run.
Friedman’s point—made independently by Phelps (1967)—was that rational workers care only about real wages, and that real wages need to adjust so that labor supply equals

26
labor demand at a uniquely determined natural rate of unemployment. An expansionary monetary (or fiscal) policy aimed at pushing unemployment below the natural rate would lead to an increase in aggregate demand, which would then feed into both higher prices and wages. If the increase in wages is smaller than the increase in prices, firms are willing to hire more workers because the real wage has decreased. However, workers will soon realize that their real wage has decreased and request wage increases that match price inflation. The outcome is a rightward shift of the Phillips curve with an equilibrium characterized by higher inflation and unemployment back at the natural rate. In this framework, the short-run Phillips curve is negatively sloped, but it shifts up the vertical long-run Phillips curve.
In the expectations-augmented Phillips curve, inflation depends on expected inflation as well as the deviation between actual unemployment and the natural rate of unemployment. In the long run, expected inflation is always equal to actual inflation and unemployment is always at the natural rate. However, the short-run Phillips curve will move up as expectations adjust, eventually to a point where a new short-run Phillips curve crosses the vertical long-term curve. The new equilibrium will be characterized by higher inflation and no gains in terms of lower unemployment. Any attempt to keep the unemployment rate below its natural level would require a continuous acceleration of inflation. A corollary of the expectations-augmented Phillips curve is that, in the long run, the natural rate of unemployment is compatible with any rate of inflation and the rate of inflation is completely driven by economic agents’ expectations of future inflation.
In the Friedman-Phelps formulation of the Phillips curve, there is a short-run trade-off between inflation and economic activity. Lucas (1972) introduced rational expectations about monetary policy itself into macroeconomic models. This led Sargent and Wallace (1975, 1976) to conclude that systematic monetary policy is irrelevant even in the short run. In this new classical approach, forward-looking agents incorporate policy makers’ reaction function into their expectations and thus make policy actions ineffective by fully anticipating them. In this view, only random (that is, surprise) changes in monetary policy can affect the real economy.
New Keynesian model
It soon became clear that the policy irrelevance proposition required the assumption of fully flexible prices and wages. Pioneering work by Fischer (1977), Taylor (1980), Rotemberg (1982), and Calvo (1983) showed that in the presence of staggered contracts monetary policy can be effective even under the assumption of rational expectations. Calvo’s pricing model is one of the key building blocks of modern New Keynesian models. This workhorse model combines forward-looking optimizing agents with monopolistic competition and sticky prices. Although agents are assumed to have full-information rational expectations (FIRE), in the presence of distortions associated with market power and sticky prices, monetary policy can be welfare enhancing and achieve an efficient allocation of resources.
In effect, the New Keynesian approach reverts to ideas first clearly expressed in the writings of Keynes’s contemporary, Hawtrey (for example, Monetary Reconstruction,

27
1923). Hawtrey argued that the effectiveness of monetary policy depends on expectations about the future policy stance and that agents form their expectations by extracting signals from the current policy actions. This view underlies the endogenous expectations in modern monetary economics (for example, Woodford 2003).
The standard New Keynesian Phillips curve describes inflation as a function of expected inflation and the output gap (Galí and Gertler 1999). This curve is the basis of Bernanke’s (2007) statement that expectations “greatly influence actual inflation and thus the central bank’s ability to achieve price stability.” In addition, expectations affect the transmission of monetary policy through the term structure of interest rates and changes in asset prices. Although the central bank can control the short-term nominal interest rate, investment and consumption decisions depend on the long-term real interest rate, which, in turn, depends on expectations about long-term inflation and future movements of the short-term nominal rate.1 Economic decisions are also affected by movements in asset prices (wealth effects), which again depend on expected real returns. A problem with the standard New Keynesian Phillips curve is that it does not fit the data well. Fuhrer (1997) documents that inflation expectations are not significant in explaining inflation using a purely forward-looking model. Several studies employ the hybrid New Keynesian Phillips curve, in which current inflation depends on both expected and lagged inflation (Galí and Gertler 1999).
1 Although the New Keynesian Phillips curve allows for a short-term trade-off between inflation and unemployment, it maintains the neoclassical view that there is no long-run trade-off. However, at low levels of inflation, the long-run Phillips curve may become negatively sloped and allow for such a trade-off (Akerlof, Dickens, and Perry 2000; Benigno and Ricci 2011). Blanchard (2016) argues that the Great Recession led to a substantial anchoring of inflation expectations and that now the U.S. Phillips curve looks more like the Phillips curve of the 1960s than the accelerationist Phillips curve of standard New Keynesian models.

28
AAppendix 2. Studies on the anchoring of inflation expectations Table A.2.1. Studies on advanced economies
Authors Questions Economies (sample
period and frequency) Methodology Results
Beaudry and Ruge-Murcia (2017)
Has inflation targeting been successful in Canada?
Australia, Canada, New Zealand, Sweden, United Kingdom, and United States (1991-2016, monthly and quarterly)
Descriptive statistics The implementation of inflation targeting in Canada has been particularly successful compared with the experiences of other inflation targeting countries and the United States.
Beechey, Johannsen, and Levin (2011)
Are inflation expectations anchored more firmly in the Euro Area than in the United States?
Euro Area and the United States (2003-07, daily)
Regression of changes in inflation expectations on macroeconomic news
Inflation expectations are better anchored in the Euro Area than in the United States.
Carroll (2003) How are households’ inflation expectations formed?
United States (1981-2000, quarterly)
Regression of household expectations on professional forecasts or news
Household forecasts are affected by media and professional forecasts.
Ciccarelli, Garcia, and Montes-Galdón (2017)
Did the financial crisis and the Great Recession affect the anchoring of long-term inflation expectations??
United States (2005-15, monthly)
Estimating the time-varying coefficient measuring the pass-through from short- to long-term inflation expectations
The anchoring of inflation expectations has deteriorated significantly since late 2008.
Coibion and Gorodnichenko (2015)
Was the absence of disinflation during the Great Recession linked to a change in inflation expectations?
United States (1981-2013, monthly)
Regression of difference between household and professional inflation expectations on the change in oil price
The absence of disinflation during 2009-11 can be attributed to rising inflation expectations, which were in turn affected by rising oil prices.
Ehrmann (2015)
How do inflation expectations behave under inflation targeting?
10 advanced economies (1990s-2014, monthly)
Regression of inflation expectations on lagged inflation and dummy variable for times of (persistently) low inflation
Inflation expectations are not as well anchored when inflation is persistently low as when inflation is around the target: inflation expectations are more dependent on lagged inflation.

29
TTable A.2.1 Studies on advanced economies (continued)
Authors Questions Economies (sample period and frequency) Methodology Results
Galati, Poelhekke, and Zhou (2011)
Did the global financial crisis affect inflation expectations?
Euro Area, United Kingdom, and United States (2004-09, daily)
Test for anchoring by regression of changes in inflation expectations on macroeconomic news
There is some evidence that market-based inflation expectations in the United Kingdom and the United States became more sensitive to macroeconomic news during the global financial crisis.
Garcia and Werner (2018)
Are Euro Area inflation expectations well anchored?
Euro Area, Germany, Italy, and Spain (2005-17, daily)
Test for anchoring by regression of changes in inflation expectations on macroeconomic news
The anchoring of inflation expectations has weakened in the Euro Area since 2013.
Grishchenko, Mouabbi, and Renne (2017)
Are long-term inflation expectations well anchored?
Euro Area and United States (1999:1-2016:2)
Estimation of inflation expectations and inflation uncertainty by dynamic latent factor model with stochastic volatility
Inflation anchoring improved in the United States, while mild de-anchoring occurred in the Euro Area.
Gürkaynak, Levin, and Swanson (2010)
Does inflation targeting anchor long-term inflation expectations?
Sweden, United Kingdom, and United States (1990s to early 2000s, daily)
Test for anchoring by regression of changes in inflation expectations on macroeconomic news
The response of market-based inflation expectations to macroeconomic news is larger in the United States than in Sweden and the United Kingdom. Inflation targeting affects long-term inflation expectations.
IMF (2016)
1. Have inflation expectations become increasingly sensitive to inflation outturns in recent years?2. How do monetary policy frameworks affect the degree of anchoring of inflation expectations?
24 advanced economies and 20 EMDEs (1990s-2016)
1. Estimation of a hybrid New Keynesian Phillips curve (regression of actual inflation on inflation expectations, past inflation, and other control variables)2. Test for anchoring by regression of changes in inflation expectations on macroeconomic news, using a time-varying parameter model
1. The coefficient on lagged inflation started declining in the mid-1990s, but this trend reversed in the aftermath of the Great Recession, and the coefficient is now similar to that in the early 1990s.
2. The sensitivity of inflation expectations to macro-economic news is inversely correlated with standard measures of central bank independence and trans-parency; expectations become better anchored when countries adopt an inflation targeting regime. Estimations that allow for time-varying coefficients indicate that, while expectations are better anchored in advanced economies, anchoring has improved in both advanced economies and EMDEs.

30
Table A.2.1 Studies on advanced economies (continued)
Authors Questions Economies (sample period and frequency)
Methodology Results
Kumar et al. (2015)
Are firms’ inflation expectations well anchored?
New Zealand (2014Q3-2014Q4) Quantitative survey of cross-section of firms
Firm managers display little anchoring of inflation expectations, despite 25 years of inflation targeting by the Reserve Bank of New Zealand. Managers are generally poorly informed about recent inflation dynamics. Their forecasts of future inflation reflect high levels of uncertainty and are volatile at both short- and long-run horizons.
Johnson (2003)
Does inflation targeting affect long-term inflation expectations?
Australia, Canada, New Zealand, Sweden, and the United Kingdom (1990s, monthly)
Comparison of forecasts of actual inflation with predicted forecasts, which are derived by multiplying the estimated coefficients of Phillips curves using the same independent variables before and after the target announcement
Inflation targeting stabilizes long-term inflation expectations.
Strohsal, Melnick, and Nautz (2016)
Did the global financial crisis affect inflation expectations?
United States (2004-14, monthly)
Regression of deviations of long-term inflation expectations from the inflation target on observed inflation or news-driven short-term inflation expectations using a model with time-varying parameters
Inflation expectations in the United States became partially de-anchored during the global financial crisis, but this de-anchoring was temporary.
Strohsal and Winkelmann (2015)
Are long-term inflation expectations well anchored?
Euro Area, Sweden, United Kingdom, and United States (2004-11, daily)
Estimation of a market-perceived inflation target using an exponential smooth transition autoregressive (ESTAR) model
Expectations appear to be best anchored in the Euro Area, followed by the United States, Sweden, and the United Kingdom. In most of these countries, the degree of anchoring did not change during the global financial crisis.

31
TTable A.2.2 Studies on EMDEs (some including advanced economies) (continued)
Authors Questions Economies (sample period and frequency)
Methodology Results
Baskaya, Gulsen, and Kara (2012)
Are inflation expectations well anchored in Turkey?
Turkey (2006-12, monthly)
Regression of inflation expectations on the lagged inflation rate
Inflation expectations are more sensitive to inflation realization at higher levels, but this sensitivity has decreased over time.
Capistrán and Ramos-Francia (2010)
Does inflation targeting affect inflation expectations?
12 advanced economies and 13 EMDEs (1989-2006, monthly)
Regression of dispersion of inflation expectations on a dummy for inflation targeting, the actual inflation rate, and world average inflation
Inflation targeting affects inflation expectations only in EMDEs. There is no effect of inflation targeting on the dispersion of inflation expectations in advanced economies.
Carrasco and Ferreiro (2013)
Does inflation targeting anchor inflation expectations?
Mexico (2004-11, monthly)
Tests whether inflation expectations follow a normal distribution under inflation targeting using the Shapiro-Wilk test, Jarque-Bera test, and Doornik-Hansen test. If the inflation expectations are anchored, they are assumed to follow a normal distribution where the mean is the inflation target and the variance is constant.
Inflation expectations are anchored to the inflation target.
Cerisola and Gelos (2009)
Does inflation targeting anchor inflation expectations? Is the inflation targeting framework supported by the perceived sustainability of public finances?
Brazil (2000-04, monthly)
Recursive OLS regression of inflation expectations on inflation target, lagged inflation rate, primary balance as a percent of GDP, and other control variables
The adoption of inflation targeting helped anchor expectations; the stance of fiscal policy was important in shaping inflation expectations.
Cortes and Paiva (2017)
How does the loss of credibility affect inflation expectations?
Brazil (2004-16, monthly)
Using VARs, estimation of impulse responses of inflation expectation to actual inflation, exchange rate movements, and output gap with two subsamples: 2004-10 and 2011-16
During 2011-16, inflation expectations reacted more strongly to actual inflation, exchange rate movements, and output shocks than during 2004-10.

32
TTable A.2.2 Studies on EMDEs (some including advanced economies) (continued)
Authors Questions Economies (sample period and frequency)
Methodology Results
Davis (2014)
Does inflation targeting anchor long-term inflation expectations?
14 advanced economies and 22 EMDEs (1990-2011, monthly)
SVAR to test whether 12-month-ahead inflation expectations respond to shocks to inflation and oil prices
The introduction of inflation targeting is associated with a statistically significant reduction in the response of short-term inflation expectations to shocks in oil prices and observed inflation.
de Mendonça and Galveas (2013)
How does central bank transparency affect the central bank’s commitment to inflation targeting?
Brazil (2001-10, monthly)
Estimation of backward-looking, forward-looking, and hybrid New Keynesian Phillips curves (regression of actual inflation on inflation expectations, past inflation, and other control variables)
Given the degree of central bank transparency, the forward-looking and hybrid specifications of the Phillips curve are more suitable for explaining current inflation.
de Mendonça and Veiga (2014)
Are fiscal imbalances a constraint to monetary policy?
Brazil (1999-2010, monthly)
Regression of the deviation between inflation and its target on the net public debt-to-GDP ratio and other control variables
The deviation of realized inflation from target inflation tends to be higher when the public debt-to-GDP ratio is larger.
De Pooter et al. (2014)
Are long-term inflation expectations in EMDEs well anchored?
Brazil, Chile, and Mexico (2000s-2013, daily)
Test for anchoring by regression of changes in inflation expectations on news
Long-term inflation expectations have become better anchored during the decade to 2013, especially in Chile and Mexico.
IMF (2018)
How has the extent of anchoring of inflation expectations evolved in recent decades?
19 EMDEs (2004-17, biannual)
Facts about four measures of inflation anchoring: absolute deviation of the three-year-ahead inflation forecast from target, variability of inflation forecasts,dispersion of inflation forecasts, and sensitivity to inflation surprises
The degree of anchoring of inflation expectations has improved significantly over the past two decades. However, there is heterogeneity in the extent of anchoring across emerging markets.
Kabundi, Schaling, and Some (2015)
Are long-term inflation expectations of individual agents well anchored?
South Africa (2000-13, quarterly)
Estimation of a market-perceived inflation target of individual agents using panel regression with dummy variables
The inflation expectations of price setters (businesses and unions) are higher than the upper bound of the official target band, while the expectations of professional forecasters are within the target band. In addition, price setters’ expectations are associated with lagged inflation but analysts’ expectations are not.

33
Table A.2.2 Studies on EMDEs (some including advanced economies) (continued)
Authors Questions Economies (sample period and frequency)
Methodology Results
Lei, Lu, and Zhang (2015)
Do consumers and professional forecasters update their inflation forecasts with information from the news media?
China (2001-12, quarterly)
Regression of inflation expectations on news about prices
The news media can have a strong influence on inflation expectations.
Mehrotra and Yetman (forthcoming)
Are long-term inflation expectations well anchored?
23 advanced economies and 21 EMDEs (2005-12, monthly)
Estimation of the decay function such that inflation forecasts monotonically diverge from a long-run anchor toward actual inflation as the forecast horizon shortens
Inflation expectations have become more tightly anchored over time in both inflation targeting economies and in those following other monetary policy regimes.
Minella et al. (2003)
Does inflation targeting anchor inflation expectations?
Brazil (2000-03, monthly)
Regression of inflation expectations on inflation target, lagged inflation rate, exchange rate, and other control variables
In Brazil, actual inflation was above the upper limit of the tolerance interval in 2001 and 2002 after the introduction of inflation targeting in 1999. Inflation expectations react significantly to the inflation target and past inflation. The inflation targeting regime has been successful in helping to anchor expectations.
Miyajima and Yetman (2018)
Are long-term inflation expectations of individual agents well anchored?
South Africa (2001-17, quarterly; 1993-2017, monthly)
Estimation of the decay function such that inflation forecasts monotonically diverge from a long-run anchor toward actual inflation as the forecast horizon shortens
Inflation expectations of businesses and trade unions are anchored to levels above the official target range although overall, inflation expectations have become more strongly anchored in South Africa in recent years.
Patra and Ray (2010)
What are the determinants of inflation expectations?
India (1997-2008, monthly)
Regression of inflation expectations on lagged inflation, changes in prices of fuel and primary articles, the output gap, and real interest rate
Lagged inflation and movements in fuel and food prices affect inflation expectations.
Reid (2009) Are long-term inflation expectations well anchored?
South Africa (2001-07, quarterly)
Test for anchoring by regression of changes in inflation expectations on macroeconomic news
Inflation expectations are well anchored in South Africa due to the inflation targeting framework.

34
AAPPENDIX 3. Methodology and database
Methodology
Panel regressions
If long-term expectations are well-anchored, they will not be highly responsive to macroeconomic news. Figure 4, panel A, presents the results of a panel regression model that estimates the sensitivity of changes in long-term inflation expectations to macroeconomic news shocks. The change in long-term inflation expectations (dependent variable) is measured by the difference between five-year-ahead inflation expectations in the current period and five-year-ahead inflation expectations in the previous period. The macroeconomic news shock corresponds to an inflation shock (a regressor) that is measured by the difference between realized inflation and short-term inflation expectations in the previous period.1
The model includes an interaction dummy variable to allow for different elasticities of inflation expectations in advanced economies and EMDEs:
Et πi,t+5 - Et-1 πi,t+5 = β 1(πi,t - Et-1 πi,t) + β 2Di (πi,t - Et-1 πi,t)+μi + τt +εi,t (1)
where i denotes country and t refers to time. Et πi,t+5 and Et-1 πi,t+5 are five-year-ahead inflation expectations in the current and previous periods, respectively. πi,t refers to realized inflation and Et-1 πi,t is short-term inflation expectations in the previous period. Di is a dummy variable that is equal to 0 for advanced economies and 1 for EMDEs, implying that β 1 and (β 1 + β 2) are the estimated sensitivities for advanced economies and EMDEs, respectively. When the estimated sensitivity is small (that is, β1 is not statistically significantly different from zero), inflation expectations are well anchored. The model includes country fixed effects (μi) and time fixed effects (τt) that are estimated for three periods: 1990H2-2004H2, 2005H1-18H1, and 1990H2-2018H1.2
Regressions with time-varying parameters: Country-specific models
Figure 4, panels B, C, and D, presents the results of a time-varying model, estimated using a Kalman filter, that captures the time variation in the sensitivity of changes in long-term inflation expectations to inflation shocks. The model is a version of model (1), but it includes time-varying coefficients:
Etπt+5 - Et-1 πt+5 = α t + βt (πt - Et-1 πt) + εt ,εt ~ iid N(0, ) (2)
where the measures of expected and realized inflation are the same as those in model (1). The model is estimated for each of the 24 advanced economies and 23 EMDEs in the sample, using semiannual data for 1990H1-2018H1 and 1995H1-2018H1, respectively. The
1 The model follows Beechey, Johannsen, and Levin (2011); Gürkaynak, Levin, and Swanson (2010); and De Pooter et al. (2014). 2 Because there are no available data for most EMDEs in the early 1990s, the panel data set is unbalanced. The sample was split at 2004 to produce two samples of roughly equal length.

35
time-varying parameters are assumed to follow a random walk:3
α t = α t-1 + ξt ,ξt ~ iid N(0, )
βt = β t-1 + ηt ,ηt ~ iid N(0, )
where αt captures changes in long-term inflation expectations that are independent of inflation shocks, and β t measures the sensitivity of inflation expectations to inflation shocks.4 In other words, αt and β t are assumed to be the sensitivity to the permanent and temporary shocks, respectively. If forecasters believe that the central bank’s monetary policy is credible, they do not react to inflation shocks. This implies that if β t is not statistically significantly different from zero, inflation expectations are well anchored.
RRegressions with time--varying parameters: Global and domestic shocks
A simple regression model with time-varying parameters is estimated to analyze the sensitivity of inflation expectations to global and domestic inflation shocks. The results are presented in Figure 5. The global inflation shock is defined as the first principal component of inflation shocks for the full sample of 24 advanced economies for 1990H2-2018H1 and 23 EMDEs for 1995H1-2018H1. The domestic inflation shock is defined as the residual from a regression of the inflation shock on the first principal component of inflation shocks, as in the following model:
πt - Et πt-1 = δt ft + ϵt (3)
where ft is the first principal component of inflation shocks and δt is the time-varying parameter. δt ft represents the global inflation shock and the remaining term ϵt is defined as the domestic inflation shock. The sensitivity of five-year-ahead inflation expectations to global and domestic inflation shocks is then modeled as:
Et πt+5 - Et-1 πt+5 = α t + β1t Gt + β2t Dt + εt (4)
where Gt (= δt ft) is the global shock and Dt (= ϵt) is the domestic shock. Models (3) and (4) are estimated using a Kalman filter and with the assumption that the time-varying parameters follow a random walk.
Panel cointegration regressions
The determinants of the degree of anchoring of inflation expectations are studied using a set of panel regression models. The results of these exercises, using annual data for 24 advanced economies and 23 EMDEs for 1995-2016, are presented in Figure 6. The degree of anchoring is measured as the sensitivity (βt) of changes in long-term inflation expectations to inflation shocks (as estimated in model (2) above). Six determinants are
3 IMF (2016) and Buono and Formai (2018) also estimate models with the time-varying parameters. IMF (2016) also uses a Kalman filter model but does not include other factors (αt). Buono and Formai (2018) estimate their model over a rolling window in which the sample periods change over time. 4 The results remain robust when αt is not included in the model.

36
considered: the presence of an inflation targeting regime, the degree of central bank transparency, the exchange rate regime, financial openness, trade openness, and the degree of fiscal sustainability. Inflation targeting regime and fixed exchange rate regime are dummy variables for which the presence of the indicated regime equals one. Exchange rate regime is determined using Shambaugh (2004). Central bank transparency and financial openness (capital account openness) are measured using indexes produced by Dincer and Eichengreen (2014) and Chinn and Ito (2017), respectively. Trade openness is measured as imports divided by domestic demand (domestic demand is defined as gross domestic product (GDP) + imports - exports). Fiscal sustainability is measured as the ratio of gross public debt to GDP.
The empirical exercise is undertaken in four steps. First, all variables are tested in a panel setting for unit roots.5 Some tests do not reject the null hypothesis of nonstationarity of trade openness and gross public debt-to-GDP ratio (Table A.4.2). Second, since some variables (including the inflation targeting dummy, fixed exchange rate regime dummy, and financial openness index) are stationary, residual series are obtained from a panel regression of sensitivity of inflation expectations on these stationary variables. Specifically, the following model is estimated:
β i,t = Ѳ i + φ t + γMPi,t + δXi,t + ϵi,t (5)
where β i,t is the time-varying estimate of the country-specific estimate of the elasticity of inflation expectations to inflation shocks, as explained in the discussion of regressions with time-varying parameters. MPi,t is (i) a dummy variable that takes a value of one in countries with an inflation targeting framework or (ii) a measure of central bank transparency. Xi,t includes a dummy variable that takes a value of one for countries with a fixed exchange rate regime and financial openness index. Ѳ i captures country-fixed effects and φ t refers to time fixed effects.
Third, the existence of cointegration between the residuals from the panel regression in model (5) and the gross public debt-to-GDP ratio and trade openness is tested by employing Pedroni’s (1999) cointegration test (Table A.4.3). The results indicate that the residuals are cointegrated with the two variables. Fourth, following Pedroni (2000, 2001), a grouped mean fully modified ordinary least squares (FMOLS) regression model and a grouped mean dynamic OLS (DOLS) regression model are estimated to correct for endogeneity bias and serial correlation. The dependent variable is the estimated residual from the panel regression in model (5). The independent variables are trade openness (measured by the import penetration ratio) and the gross public debt-to-GDP ratio.
5 This test follows Im, Pesaran, and Shin (2003); Maddala and Wu (1999); and Choi (2001). Although the time-varying parameters are constructed under the assumption of a random walk, most results of panel unit root tests reject the null hypothesis of nonstationarity.

37
DDatabase
Table A.3.1 List of countries
Country ggroup Countriies
Advanced economies (24)
Australia, Austria, Belgium, Canada, Denmark, Finland, France, Germany, Greece, Ireland, Israel, Italy, Japan, Korea, the Netherlands, New Zealand, Norway, Portugal, Singapore, Spain, Sweden, Switzerland, the United Kingdom, the United States
EMDEs (23) Argentina, Bangladesh, Brazil, Chile, China, Colombia, the Arab Republic of Egypt, India, Indonesia, the Islamic Republic of Iran, Kuwait, Malaysia, Mexico, Pakistan, Peru, Poland, the Russian Federation, Saudi Arabia, South Africa, Thailand, Tunisia, Turkey, Zambia
Note: The numbers in parentheses are the number of countries in the sample. EMDEs = emerging market and developing economies.
Table A.3.2 Description of the variables
Variable Description Sources
Inflation expectations (advanced economies: 1990H1-2018H1 EMDEs: 1995H1-2018H1)
Current year, one-year-ahead, five-year-ahead inflation forecasts based on surveys conducted biannually for 30 countries by Consensus Economics, complemented by current year, one-year-ahead, and five-year-ahead annual average headline CPI inflation forecasts produced biannually for 17 countries in the IMF's World Economic Outlook database.
Consensus Economics, Consensus Forecast; IMF, World Economic Outlook database
Inflation targeting regime (1995-2016)
A dummy variable equal to 1 for inflation targeting regime and 0 for no inflation targeting regime.
IMF, Annual Report on Exchange Arrangements and Exchange Restrictions database
Central bank transparency (1995-2014)
Index calculated from responses to 15 questions. To expand the sample, the index was extrapolated to 2015-16 using 2014 data.
Dincer and Eichengreen (2014)
Exchange rate regime (1995-2014)
The exchange rate regime classification developed in Shambaugh (2004) is used to determine whether a country has a pegged or flexible exchange rate. To expand the sample, the index was extrapolated to 2015-16 using 2014 data.
Shambaugh (2004)
Financial openness (1995-2015)
Index of de jure capital account openness. To expand the sample, the index was extrapolated to 2016 using 2015 data.
Chinn and Ito (2017)
Trade openness (1995-2016)
Imports divided by domestic demand (domestic demand = GDP + imports - exports).
IMF, International Financial Statistics database
Gross public debt (1995-2016)
Gross public debt divided by nominal GDP. IMF, World Economic Outlook database
Oil prices (1990H1-2017H2)
Index is in nominal U.S. dollars. World Bank, Commodity Price Data (the Pink Sheet)
Food prices (1990H1-2017H2)
Index is in nominal U.S. dollars. World Bank, Commodity Price Data (the Pink Sheet)
Global liquidity (1990H1-2017H2)
International claims on all sectors (annual change). Bank for International Settlements, Global Liquidity Indicators database
Global output gap (1990H1-2017H2)
Real GDP-weighted average of country specific output gaps estimated using a multivariate filter. World Bank (2018)
Note: CPI = consumer price index; EMDEs = emerging market and developing economies; IMF = International Monetary Fund.

38
AAppendix 4 Estimation results
Table A.4.1 Sensitivity of long-term inflation expectations to inflation shocks
A. 1990H2-2018H1 Dependent variable: Change in long--term inflation expectations
All countries All countries Advanced economies
EMDEs
All countries 0.282***
(0.021)
Advanced economies
0.159*** 0.154***
(0.028) (0.032)
EMDEs 0.425*** 0.425***
(0.030) (0.030)
Observations 2,408 2,408 1,344 1,064
R-squared 0.069 0.086 0.019 0.169
B. 1995H1-2004H2 Dependent variable: Change in long--term inflation expectations
All countries All countries Advanced economies
EMDEs
All countries 0.423***
(0.035)
Advanced economies
0.284*** 0.278***
(0.049) (0.052)
EMDEs 0.554*** 0.558***
(0.048) (0.046) Observations 1,139 1,139 696 443
R-squared 0.119 0.131 0.044 0.261
C. 2005H1-2018H1 DDependent variable: Change in long-tterm inflation expectations
All countries All countries Advanced economies
EMDEs
All countries 0.083***
Advanced economies
0.008 -0.001
(0.028) (0.031)
EMDEs 0.201*** 0.206***
(0.034) (0.037)
Observations 1,269 1,269 648 621
R-squared 0.011 0.028 0.000 0.049
Note: Standard errors are in parentheses. EMDEs = emerging market and developing economies. A.-C. Results for the full sample of 47 countries, 24 advanced economies, and 23 EMDEs, with country and time fixed effects. *** p < 0.01, ** p < 0.05, * p <0.1 significance level.

39
TTable A.4.2 Panel unit root tests
A. All countries
Intercept and trend Intercept
Im--Pesaran--
Shin ADF Fisher
PP Fisher Im--Pesaran--
Shin ADF Fisher
PP Fisher
Total sensitivity
-23.1 1167.2 560.8 -15.2 853.4 444.3
(0.00)*** (0.00)*** (0.00)*** (0.00)*** (0.00)*** (0.00)***
Gross public debt
0.0 102.0 42.9 -4.9 405.2 78.2
(0.52) (0.27) (1.00) (0.00)*** (0.00)*** (0.88)
Penetration -2.2 145.3 112.2 -0.9 96.1 89.2
(0.01)*** (0.00)*** (0.10)* (0.19) (0.42) (0.62)
B. Advanced economies
Intercept and trend Intercept
Im--Pesaran--
Shin ADF Fisher
PP Fisher Im--Pesaran--
Shin ADF Fisher
PP Fisher
Total sensitivity
-3.7 96.7 95.2 -0.4 71.8 98.4
(0.00)*** (0.00)*** (0.00)*** (0.34) (0.01)*** (0.00)***
Gross public debt
1.1 38.2 14.2 -0.6 55.8 27.9
(0.86) (0.84) (1.00) (0.26) (0.21) (0.99)
Penetration -3.4 86.3 53.3 -0.9 49.3 47.2
(0.00)*** (0.00)*** (0.28) (0.18) (0.42) (0.50)
C. EMDEs
Intercept and trend Intercept
Im--Pesaran--
Shin ADF Fisher
PP Fisher Im--Pesaran--
Shin ADF Fisher
PP Fisher
Total sensitivity
-29.1 1070.5 465.6 -21.3 781.6 345.9
(0.00)*** (0.00)*** (0.00)*** (0.00)*** (0.00)*** (0.00)***
Gross public debt
-1.0 63.8 28.6 -6.4 349.5 50.3
(0.16) (0.04)** (0.98) (0.00)*** (0.00)*** (0.31)
Penetration 1.0 48.2 60.5 0.1 43.9 43.8
(0.85) (0.38) (0.07)* (0.53) (0.56) (0.56)
Note: P-values are in parentheses. ADF = augmented Dickey-Fuller unit-root test; EMDEs = emerging market and developing economies; PP = Phillips-Perron unit-root test. A. Results for the full sample of 47 countries, using data for 1995-2016. B. Results for 24 advanced economies, using data for 1995-2016. C. Results for 23 EMDEs, using data for 1995-2016. The null hypothesis of a unit root is rejected at significance levels of *** p < 0.01, ** p < 0.05, * p < 0.1.

40
TTable A.4.3 Panel cointegration tests
Intercept and trend
All countries Advanced economies EMDEs
Statistic p--value Statistic p--value Statistic p--value
Panel v-statistic -1.7 0.96 2.0 0.03** -1.2 0.88
Panel rho-statistic -9.7 0.00*** 1.0 0.84 -7.0 0.00***
Panel PP-statistic -27.8 0.00*** -3.0 0.00*** -19.5 0.00***
Panel ADF-statistic -22.4 0.00*** -3.8 0.00*** -15.7 0.00***
Group rho-statistic 0.3 0.60 3.1 1.00 -0.5 0.30
Group PP-statistic -13.9 0.00*** -0.9 0.18 -10.8 0.00***
Group ADF-statistic -11.7 0.00*** -2.7 0.00*** -10.7 0.00***
Intercept
All countries Advanced economies EMDEs
Statistic p--value Statistic p--value Statistic p--value
Panel v-statistic 2.4 0.01*** -0.5 0.69 1.9 0.03**
Panel rho-statistic -11.5 0.00*** -0.2 0.42 -8.3 0.00***
Panel PP-statistic -19.4 0.00*** -2.8 0.00*** -13.8 0.00***
Panel ADF-statistic -15.2 0.00*** -2.7 0.00*** -11.0 0.00***
Group rho-statistic -1.3 0.09* 1.9 0.97 -1.1 0.14
Group PP-statistic -10.0 0.00*** -1.6 0.06* -7.0 0.00***
Group ADF-statistic -9.5 0.00*** -2.9 0.00*** -8.7 0.00***
Note: Results for the full sample of 47 economies, 24 advanced economies, and 23 EMDEs, all using data for 1995-2016. ADF = augmented Dickey-Fuller unit-root test; EMDEs = emerging market and developing economies; PP = Phillips-Perron unit-root test.The null hypothesis of no cointegration is rejected at significance levels of *** p < 0.01, ** p < 0.05, * p < 0.1.

41
TTable A.4.4. Determinants of sensitivity of inflation expectations
A. Panel regressions
Dependent variable: Estimated sensitivity
All countries All countries Advanced
economies Advanced economies EMDEs EMDEs
Model FE FE FE FE FE FE
Inflation targeting -0.390*** -0.222*** -0.498***
(0.094) (0.053) (0.165)
Central bank transparency
-0.414** 0.040 -0.724*
(0.204) (0.108) (0.377)
Exchange rate regime
0.306** 0.307** 0.255 0.012 0.060 0.079
(0.147) (0.149) (0.395) (0.405) (0.222) (0.224)
Financial openness
0.141 0.046 0.032 -0.094 -0.059 -0.186
(0.178) (0.177) (0.121) (0.125) (0.289) (0.286)
Exchange rate regime x financial openness
0.070 -0.046 -0.343 -0.069 1.037** 1.001**
(0.222) (0.225) (0.400) (0.410) (0.490) (0.493)
Observations 1,034 1,034 528 528 506 506
R-squared 0.067 0.055 0.203 0.178 0.078 0.067
Note: Results of panel regressions for the full sample of 47 countries, 24 advanced economies, and 23 EMDEs, with country and time fixed effects, using data for 1995-2016. Standard errors are in parentheses. EMDEs = emerging market and developing economies; FE = fixed effects. *** p < 0.01, ** p < 0.05, * p < 0.1 significance level.
B. Panel cointegration regressions (fully modified OLS and dynamic OLS)
Dependent variable: Residual from the first regression
All countries
All countries
Advanced economies
Advanced economies EMDEs EMDEs
Model FMOLS DOLS FMOLS DOLS FMOLS DOLS
Penetration -0.004 -0.010 0.012 0.010 -0.015 -0.021
(0.004) (0.010) (0.003)*** (0.006)* (0.008)** (0.011)*
Gross public debt 0.008 0.009 -0.002 -0.001 0.018 0.020
(0.002)*** (0.003)*** (0.001)*** (0.001) (0.005)*** (0.006)***
Note: Results of group mean panel fully modified ordinary least squares regressions (FMOLS) and group mean dynamic ordinary least squares regressions (DOLS) the full sample of 47 countries, 24 advanced economies, and 23 EMDEs. Standard errors in parentheses. DOLS = dynamic ordinary least squares; EMDEs = emerging market and developing economies; FMOLS = fully modified ordinary least squares; OLS = ordinary least squares. *** p < 0.01, ** p < 0.05, * p < 0.1 significance level.

42
AAppendix 5. Inflation targeting: Country experiences
5.1. Inflation targeting in Brazil
Rationale. Brazil adopted inflation targeting in July 1999 after it became clear that five years of exchange rate targeting had failed. Despite the success of the Central Bank of Brazil (BCB) in reducing historically high inflation through exchange rate stabilization measures, which began in 1994, a lack of fiscal discipline resulted in a gradual buildup of government debt, which in turn made the Brazilian real vulnerable to speculative attacks (Mishkin and Savastano 2002). Amid a severe currency crisis that began in early 1999, Brazil shifted to an inflation targeting regime to “coordinate market expectations and control inflation” (Barbosa-Filho 2008).
Process. The inflation targeting framework, adopted by presidential decree, established that the National Monetary Council would set inflation targets no later than two years in advance, following a transition period concluding in 2002. The BCB was granted instrument independence to this end (Bognanski, Tombini, and Werlang 2000). If end-year annual inflation is out of the established tolerance range, which has been changed over time, the governor of the BCB is required to provide an open (public) letter to the minister of finance explaining why the target was not met and what actions will be taken to return inflation to the target range. The framework also required the BCB to issue a quarterly inflation report detailing the results of its recent monetary policy actions and its projections for inflation.
Several aspects of Brazil’s inflation targeting framework are distinctive. For one, the BCB is not solely responsible for setting the inflation target range. The entity that establishes the targets, the National Monetary Council, is composed of the governor of the BCB, the minister of finance, and the minister of planning, development, and management. In addition, Brazil’s target band was for a long time quite wide compared to that in other inflation targeting countries (IMF 2015).1 Official assessment of whether the annual target has been met is based only on the December/December change in the consumer price index (CPI). Furthermore, although Brazil has maintained a de jure flexible exchange rate under its inflation targeting regime, the BCB has at times intervened in foreign exchange markets to manage excess volatility of the currency.
When inflation targeting was adopted in 1999, Brazil had a sound banking system and was in the process of strengthening its fiscal profile. The banking system had been restructured after a crisis in the early 1990s. Although government debt was still rising in 1999, fiscal adjustment was underway. A series of debt restructuring agreements between individual states and the federal government had been negotiated a few years prior. Fiscal discipline improved with the passing of the Fiscal Responsibility Law in 2000 (López Vicente and Serena Garralda 2014).
Results. Brazil’s inflation targeting regime was successful in the first years after its
1 However, after the target was held at 4.5 percent and the tolerance band at 2.5-6.5 percent since 2006, the band was narrowed to 3-6 percent in 2018. Over 2019-21 the target and tolerance band will be incrementally lowered on an annual basis, to a target of 3.75 percent within a band of 2.25-5.25 percent in 2021.
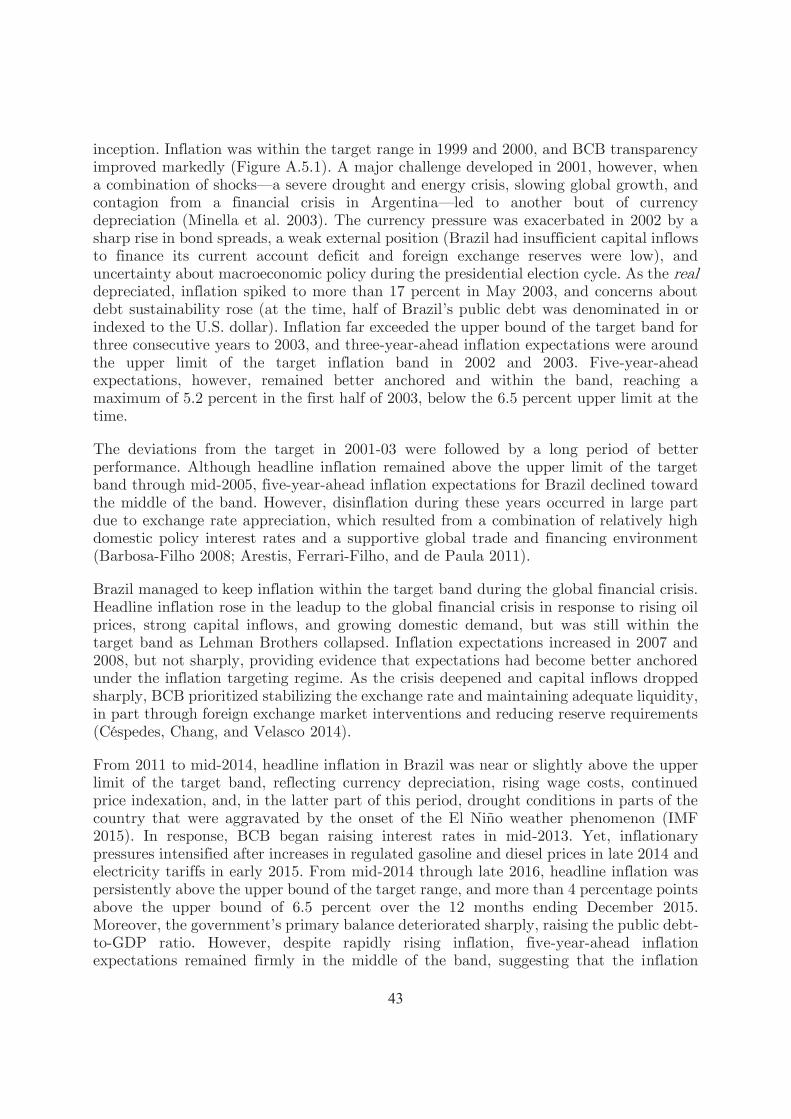
43
inception. Inflation was within the target range in 1999 and 2000, and BCB transparency improved markedly (Figure A.5.1). A major challenge developed in 2001, however, when a combination of shocks—a severe drought and energy crisis, slowing global growth, and contagion from a financial crisis in Argentina—led to another bout of currency depreciation (Minella et al. 2003). The currency pressure was exacerbated in 2002 by a sharp rise in bond spreads, a weak external position (Brazil had insufficient capital inflows to finance its current account deficit and foreign exchange reserves were low), and uncertainty about macroeconomic policy during the presidential election cycle. As the real depreciated, inflation spiked to more than 17 percent in May 2003, and concerns about debt sustainability rose (at the time, half of Brazil’s public debt was denominated in or indexed to the U.S. dollar). Inflation far exceeded the upper bound of the target band for three consecutive years to 2003, and three-year-ahead inflation expectations were around the upper limit of the target inflation band in 2002 and 2003. Five-year-ahead expectations, however, remained better anchored and within the band, reaching a maximum of 5.2 percent in the first half of 2003, below the 6.5 percent upper limit at the time.
The deviations from the target in 2001-03 were followed by a long period of better performance. Although headline inflation remained above the upper limit of the target band through mid-2005, five-year-ahead inflation expectations for Brazil declined toward the middle of the band. However, disinflation during these years occurred in large part due to exchange rate appreciation, which resulted from a combination of relatively high domestic policy interest rates and a supportive global trade and financing environment (Barbosa-Filho 2008; Arestis, Ferrari-Filho, and de Paula 2011).
Brazil managed to keep inflation within the target band during the global financial crisis. Headline inflation rose in the leadup to the global financial crisis in response to rising oil prices, strong capital inflows, and growing domestic demand, but was still within the target band as Lehman Brothers collapsed. Inflation expectations increased in 2007 and 2008, but not sharply, providing evidence that expectations had become better anchored under the inflation targeting regime. As the crisis deepened and capital inflows dropped sharply, BCB prioritized stabilizing the exchange rate and maintaining adequate liquidity, in part through foreign exchange market interventions and reducing reserve requirements (Céspedes, Chang, and Velasco 2014).
From 2011 to mid-2014, headline inflation in Brazil was near or slightly above the upper limit of the target band, reflecting currency depreciation, rising wage costs, continued price indexation, and, in the latter part of this period, drought conditions in parts of the country that were aggravated by the onset of the El Niño weather phenomenon (IMF 2015). In response, BCB began raising interest rates in mid-2013. Yet, inflationary pressures intensified after increases in regulated gasoline and diesel prices in late 2014 and electricity tariffs in early 2015. From mid-2014 through late 2016, headline inflation was persistently above the upper bound of the target range, and more than 4 percentage points above the upper bound of 6.5 percent over the 12 months ending December 2015. Moreover, the government’s primary balance deteriorated sharply, raising the public debt-to-GDP ratio. However, despite rapidly rising inflation, five-year-ahead inflation expectations remained firmly in the middle of the band, suggesting that the inflation

44
targeting regime retained credibility.
After peaking in early 2016 following the realignment of administered prices, inflation gradually moderated, and the BCB began an extended period of interest rate easing late in the year. By the end of 2017, inflation was slightly below the 3 percent lower bound of the target band, largely due to food price deflation that in turn reflected very strong agricultural production. Five-year-ahead inflation expectations continued to moderate during this period.
The behavior of inflation expectations in Brazil has been broadly consistent with the estimated sensitivity of long-term inflation expectations to shocks. Following a large initial drop in the sensitivity of expectations to shocks after the introduction of the inflation targeting regime in 1999, sensitivity has been more or less constant, suggesting that the inflation targeting regime has been successful in anchoring expectations. Yet the sensitivity to shocks is still higher than in some other inflation targeting emerging market and developing economies (EMDEs). A deterioration of fiscal balances could have impeded the anchoring of inflation expectations (Cerisola and Gelos 2009; de Mendonça and Veiga 2014). An additional factor may have been that central bank independence was less well established in Brazil than in other countries (Cortes and Paiva 2017; Minella et al. 2003).
LLessons learned. Brazil’s experience with inflation targeting offers two key lessons. First, long-term inflation expectations can remain stable during sharp fluctuations in actual inflation even in the absence of typical elements of inflation targeting regimes elsewhere (for example, the central bank having sole power to set inflation targets, fixed-term appointment of central bank governors, and use of a narrow inflation target band). Further, inflation expectations in Brazil have been stable despite periodic questions about the credibility of the inflation targeting regime arising from its unique institutional arrangements (IMF 2015). However, some of the specifics of the regime (that is, a wide target band and use of only December data for measuring results) have arguably made formal compliance with targets easier than in most other inflation targeting countries.
Second, fiscal policy can be a key factor in determining the outcome of inflation targeting and controlling inflation expectations (Cerisola and Gelos 2009; de Mendonça and Veiga 2014). For instance, during the 2001-03 currency crisis, Brazil avoided a prolonged growth contraction thanks to the fiscal adjustments put in place in the late 1990s. These measures lent support to the inflation targets and the BCB’s well-articulated strategy for reverting inflation to target levels (Giavazzi, Goldfajn, and Herrera 2005). At the same time, the structure of public debt in Brazil at the time—a large share of debt was short term or denominated in foreign currency—was a constraint on the central bank’s ability to target inflation freely, since interest rate hikes abroad had a significant adverse impact on debt service obligations. Similarly, the high level of foreign currency–denominated debt may have also dissuaded the central bank from allowing the exchange rate to float freely, despite the stated commitment to floating (López Vicente and Serena Garralda 2014). Over time, the structure of public debt has changed, and the vast majority of domestic debt is now issued domestically. However, the stock of debt has risen rapidly in recent years.

45
55.2. Inflation targeting in Chile
Rationale. Expansionary macroeconomic policies in Chile in the late 1980s, together with the oil price spike that accompanied the Gulf War in the early 1990s, resulted in a sharp increase in inflation, to a peak of 30 percent in October 1990. These factors triggered the decision to adopt inflation targeting (Morandé 2002). Policy makers recognized that the fundamental historical driver of the inflation trends was excessive credit expansion by the Central Bank of Chile (BCC) (Corbo 2005). To better discipline monetary policy, the BCC first announced a numerical target for inflation in 1990. Since the target was set for just one year ahead, it did not amount to the complete adoption of inflation targeting. But it was the first step in the transition toward such a regime.
Process. Gradual implementation, a hallmark of Chile’s inflation targeting experience, allowed the BCC to build credibility. Legislation passed in 1989 made the BCC fully independent and declared price stability to be the primary monetary policy objective. The BCC was given authority to define this objective (that is, goal independence) and control the instruments of monetary policy (that is, instrument independence). Its new framework of banking sector regulation and supervision was among the strongest of all emerging markets (Mishkin 2004).
Starting in 1991, the BCC adopted a partial inflation targeting regime. Under this arrangement, it announced a headline target for annual inflation in December each year, gradually reducing the level of the target, but continued to target an exchange rate band and retained the right to use short-term capital controls if needed.2 Chile used unremunerated (non-interest bearing) reserve requirements on selective capital inflows through most of the 1990s to discourage buildups of short-term liabilities, favored a weaker exchange rate, and provided more operating space for monetary policy (De Gregorio, Tokman, and Valdés 2005). The exchange rate band was widened during the decade, allowing more flexible adjustment to external shocks (Bordo and Siklos 2014).
In September 1999, Chile shifted to a floating exchange rate regime and formally adopted a flexible inflation targeting framework that recognized the lag effect in monetary policy and the short-run trade-off with output. Key components of the framework included bolstering the statistical and analytical capacity of the BCC, publication of a monetary policy report (initially three issues per year, and four per year since 2009), and the release of minutes of monetary policy meetings with a short lag. In addition, the BCC announced its intent to deepen the foreign exchange derivatives market and intervene in the foreign exchange market only in extraordinary circumstances (Valdés 2007).
Over time, Chile’s inflation target has been fine-tuned. In 1999, the BCC set the target band for annual inflation at 2-4 percent (to be achieved in 2001) and later extended this target indefinitely. In 2001, the target was redefined as 3 percent with at ± 1 percentage point tolerance range, and the horizon for achieving the 3 percent target, from any current deviation, was lengthened from 12-24 months to 24 months to account more realistically for the lag in the monetary transmission mechanism.
2 The new framework also included current account deficit targets (Céspedes and Soto 2005).

46
In 2001, the government adopted a balanced budget rule that constrained public expenditures, to ensure that the structural balance, measured as a share of GDP, met a specific target or range (De Gregorio 2009b; Llédo et al. 2017). The fiscal targets are were then regularly adjusted in line with changes in potential growth and forecasts of long-term copper prices.3 Two independent committees, one focused on potential output and the other on copper prices, advise on the practical calculation of the structural balance.
RResults. Despite some large fluctuations of inflation around the target range, long-term inflation expectations in Chile have been remarkably well anchored since the adoption of inflation targeting, and the sensitivity of inflation expectations to shocks is among the lowest in EMDEs. During the early years of the inflation targeting regime, inflation fell and became less volatile. Even under the partial inflation targeting regime, there was a sustained decline in headline inflation and inflation expectations (Figure A.5.2). Average inflation fell from 15.5 percent in 1991-94 to 5.7 percent in 1995-98. Moreover, the exchange rate pass-through to inflation dropped significantly starting in the mid-1990s and continued falling after the adoption of formal inflation targeting in 1999 (Schmidt-Hebbel and Tapia 2002).
A period of low inflation in 2003 and 2004 challenged the credibility of Chile’s inflation target. In the second half of 2003, Chile experienced a significant and unexpected deceleration in inflation, as the peso appreciated and competition in the retail sector intensified (Central Bank of Chile 2004). Although survey-based inflation expectations remained close to the target of 3 percent (that is, well anchored), five-year-ahead, market-based inflation expectations declined significantly.
Long-term inflation expectations varied only slightly during the global financial crisis, despite large gyrations in actual inflation. From mid-2007 to late 2008, headline inflation in Chile experienced upward pressure from international factors—namely, rising food and energy prices. Headline inflation peaked at 9.9 percent (year-on-year) in October 2008. Although short-term expectations increased significantly as inflation rose, the reaction of five-year-ahead expectations was much more muted, reaching a high of 3.2 percent in the second half of 2008. Thereafter, as the global financial crisis deepened and global activity slowed, inflation in Chile rapidly became negative, prompting a 775 basis point reduction in the policy interest rate in the seven months to July 2009 and the introduction of several liquidity support measures. Yet five-year-ahead inflation expectations dropped only slightly, to 2.9 percent in the second half of 2009, suggesting that expectations were by that point very well anchored.
Inflation rose well above the target band in 2014-16, due to peso depreciation following the slump in copper prices. However, excess capacity in the economy and a cautious monetary policy stance helped reduce inflationary pressure, and by mid-2017, inflation began to slightly undershoot the target band. Food price deceleration and, initially, peso appreciation, contributed to the undershooting. Through these fluctuations, long-term inflation expectations were impressively stable.
3 Prior to 2015, long-term molybdenum prices were also considered in setting structural balance targets. Llédo et al. (2017) provide additional details.

47
Indeed, inflation expectations at the three-year-ahead and five-year-ahead horizons have been stable at around 3 percent since 1999. At the same time, the sensitivity of long-term inflation expectations to revisions in the short-term inflation forecast and other factors steadily declined during the decade after the adoption of full-fledged inflation targeting. Since 2009, the sensitivity of long-term expectations to shocks has been close to zero, consistent with findings by De Pooter et al. (2014) that inflation expectations have become better anchored in Chile over time.
LLessons learned. Chile’s experience with inflation targeting offers three key lessons. First, gradual and successful implementation of the regime can have a lasting impact on inflation expectations. Second, deviations of actual inflation from the target, although substantial at times in Chile’s case, need not weaken the credibility of the central bank. A clear strategy for returning inflation to target during the medium term, taking into account the lagged effect of monetary policy and the short-run trade-off between output and inflation, is more important than precise targeting from one year to the next. Third, a comprehensive, credible macroeconomic policy framework has yielded positive returns in Chile. A credible fiscal rule, strong financial sector regulation and supervision, and well-functioning capital markets—as well as the monetary policy regime of inflation targeting with a flexible exchange rate—have all helped generate favorable macroeconomic outcomes (De Gregorio, Tokman, and Valdés 2005; Valdés 2007).
48
55.3. Inflation targeting in Poland
Rationale. During the 1990s, monetary policy in Poland embodied two intermediate strategies: maintaining a stable exchange rate and controlling money supply growth (NBP 1998). Amid the challenges related to the transition to a market economy, inflation was reduced from an extremely high level in 1990 to around 10 percent by the end of the decade. But the two strategies also generated tension in the conduct of monetary policy. Inflation stabilization stalled, while episodes of excessive capital inflows, as Poland integrated more deeply into global markets, stoked fears of inflation persistence. Growing current account deficits highlighted a primary disadvantage of exchange rate targeting, since a flexible rate offers a key adjustment mechanism for balance of payments disequilibria. Coupled with the need to meet certain price stability and exchange rate criteria as Poland began accession discussions with the European Union (EU), this triggered the announcement by the National Bank of Poland (NBP) in 1998 that it would adopt an inflation target beginning in 1999 (Gottschalk and Moore 2001; Jonas and Mishkin 2003).
Process. Major legislative changes in the late 1990s paved the way for the adoption of inflation targeting. A new constitution in early 1997, together with the Act on the National Bank of Poland passed later the same year, established goal and instrument independence for the NBP (Polański 2004). Monetary policy would henceforth be conducted by a Monetary Policy Council composed of 10 members serving fixed-duration terms. The new constitution also enshrined two Maastricht Treaty fiscal requirements into law: it barred direct NBP financing of government deficits and imposed a public debt ceiling of 60 percent of GDP.4 These legislative changes followed the development of indirect instruments of monetary policy in the early 1990s, including Treasury bills and bonds, which allowed the NBP to begin to conduct open market operations.
Introducing the medium-term strategy for inflation targeting, the Monetary Policy Council committed to achieving inflation-reduction targets and publishing a semi-annual inflation report (NBP 1998). The medium-term target for CPI inflation was defined as below 4 percent by 2003. By the end of 2002, inflation was less than 2 percent, well below the target ceiling. Poland took a cautious approach to liberalizing its exchange rate, indicating that the date of floating would depend on foreign exchange market developments and the pace of capital account liberalization. The eventual flotation of the zloty in April 2000 was smooth, however, with no speculative attack despite a large current account deficit.
Over time, Poland’s inflation targeting regime has been fine-tuned. In 2003, the NBP redefined the target to be 2.5 percent, within a band of ± 1 percentage point (NBP 2003).
Results. When inflation targeting was announced in 1998, inflation was falling. Yet, the short-term inflation target was still overshot in 1999-2001, even after the target band was raised and widened in 2001 (Figure A.5.3). This was followed by four years of below-target inflation. Several factors may explain the undershooting of inflation relative to the
4 However, the risk of fiscal dominance over monetary policy was perceived to be already low at the time (Gottschalk and Moore 2001).

49
target. First, the immature domestic bond market limited the ability of the NBP to estimate the transmission of monetary policy to inflation (Christoffersen, Slok, and Wescott 2001; Polański 2004). Second, deficiencies in data availability and quality prevented timely identification of inflation pressures, and excess liquidity produced by foreign exchange intervention and institutional issues in the banking sector distorted monetary policy transmission (Schaechter, Stone, and Zelmer 2000). Despite the misses, the NBP communicated the deviations sufficiently far in advance that the public was not surprised by them (Buliř et al. 2008). The avoidance of surprises helped build the credibility of inflation targeting.
Inflation overshot the target band during and after the global financial crisis but persistently undershot it in 2013-16. In 2013, the slowdown of the Euro Area led to region-wide disinflation, including in Poland, where inflation fell below target. The plunge in oil prices that began in mid-2014 accelerated the deflationary trend, contributing to negative inflation during 2014-16. However, the impact of low inflation in the Euro Area on the Polish economy was smaller than in economies with more rigid exchange rate regimes (Iossifov and Podpiera 2014). During the period of undershooting, the NBP kept its policy rate at 1.5 percent amid concerns about macroeconomic stability (NBP 2016). Inflation recovered to the target range in 2017, as oil prices rose and the Euro Area economy strengthened.
Measures of long-term inflation expectations in Poland have stabilized under the inflation targeting regime, mostly fluctuating within the target band. Five-year-ahead inflation expectations stabilized immediately after the shift to inflation targeting—initially, to a level well below the target band. Since 2003, the year the short- and medium-term targets were merged, five-year-ahead expectations have been firmly anchored at about 3 percent. This is consistent with the low and steadily moderating sensitivity of inflation expectations to shocks and an improvement in monetary policy credibility (NBP 2003).
LLessons learned. Poland’s experience with inflation targeting offers two key lessons. First, it is possible to control inflation, despite limitations on the relevant data and the presence of much uncertainty about monetary policy transmission. When inflation targeting was adopted in 1999, domestic financial markets in Poland were still developing, and the transmission of monetary policy in the emerging market economy was untested. Although these conditions limited the NBP’s ability to respond to shocks in a timely manner, the NBP succeeded in bringing down the inflation rate, broadly in line with the medium-term targets. Inflation volatility as well fell significantly after the introduction of inflation targeting.
Second, the combination of inflation targeting and a flexible exchange rate seems to have reduced spillovers from external shocks, in line with results in the literature on macroeconomic adjustment (for example, Georgiadis 2016). Real exchange rate depreciation supported Poland’s growth during the global financial crisis, even as other European economies experienced a sharp slowdown in activity (Andrle, Garcia-Saltos, and Ho 2014). Moreover, spillovers to Poland from the recent period of ultra-low inflation in the Euro Area were lower than in other EU countries with lower exchange rate flexibility (for example, Bulgaria and Croatia) (Iossifov and Podpiera 2014).
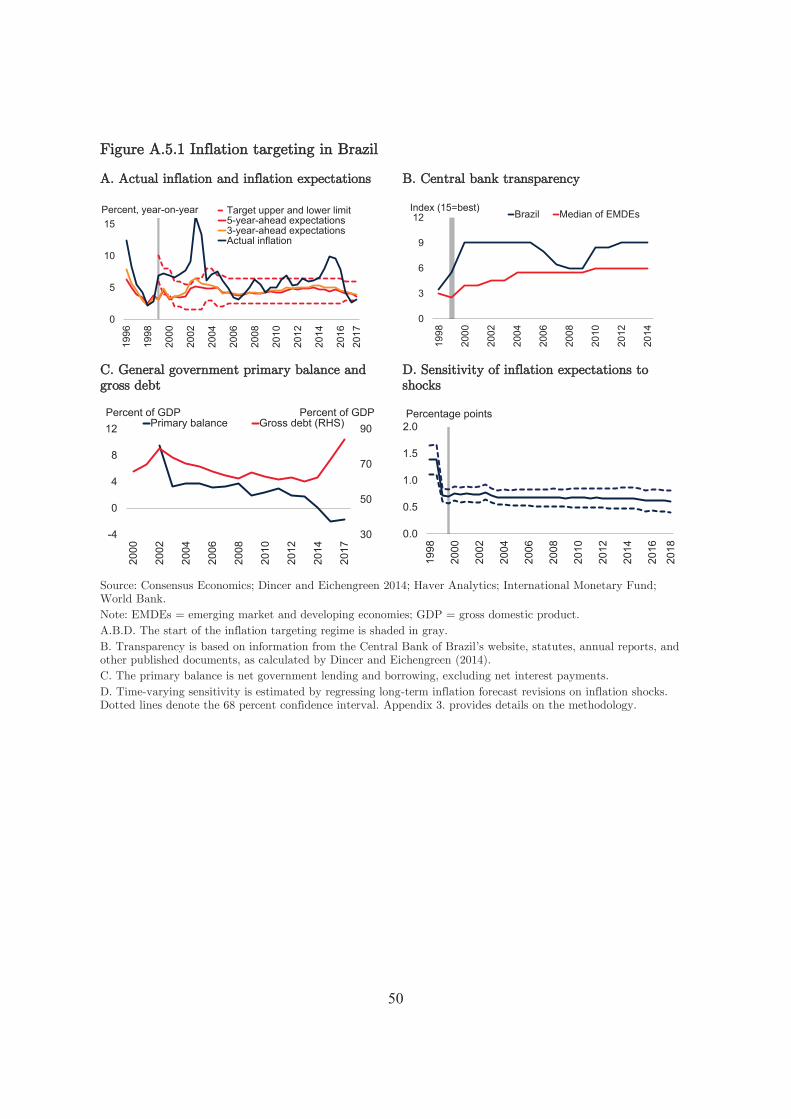
50
FFigure A.5.1 IInflation targeting in Brazil
AA. Actual inflation and inflation expectations BB. Central bank transparency
CC. General government primary balance and ggross debt
D. Sensitivity of inflation eexpectations to shocks
Source: Consensus Economics; Dincer and Eichengreen 2014; Haver Analytics; International Monetary Fund; World Bank. Note: EMDEs = emerging market and developing economies; GDP = gross domestic product. A.B.D. The start of the inflation targeting regime is shaded in gray. B. Transparency is based on information from the Central Bank of Brazil’s website, statutes, annual reports, and other published documents, as calculated by Dincer and Eichengreen (2014). C. The primary balance is net government lending and borrowing, excluding net interest payments. D. Time-varying sensitivity is estimated by regressing long-term inflation forecast revisions on inflation shocks. Dotted lines denote the 68 percent confidence interval. Appendix 3. provides details on the methodology.
0
5
10
15
1996
1998
2000
2002
2004
2006
2008
2010
2012
2014
2016
2017
Target upper and lower limit5-year-ahead expectations3-year-ahead expectationsActual inflation
Percent, year-on-year
0
3
6
9
12
1998
2000
2002
2004
2006
2008
2010
2012
2014
Brazil Median of EMDEsIndex (15=best)
30
50
70
90
-4
0
4
8
12
2000
2002
2004
2006
2008
2010
2012
2014
2017
Primary balance Gross debt (RHS)Percent of GDP Percent of GDP
0.0
0.5
1.0
1.5
2.019
98
2000
2002
2004
2006
2008
2010
2012
2014
2016
2018
Percentage points

51
FFigure A.5.2 IInflation targeting in Chile
AA. Actual inflation and inflation expectations BB. Central bank transparency
CC. General government structural balance and ddebt
D. Sensitivity of inflation eexpectations to shocks
Source: Bloomberg, Consensus Economics, Dincer and Eichengreen (2014), Haver Analytics, International Monetary Fund, World Bank. A.-D. The start of the inflation targeting regime is shaded in gray. B. Transparency is based on information from the Central Bank of Chile’s website, statutes, annual reports, and other published documents, as calculated by Dincer and Eichengreen (2014). C. Structural balance is the difference between government revenues and expenditures, adjusted for effects due to economic cycles. D. Time-varying sensitivity is estimated by regressing long-term inflation forecast revisions on inflation shocks. Dotted lines denote 68 percent confidence interval. Appendix 3 provides details on the methodology.
-2
2
6
10
1995
1997
1999
2001
2003
2005
2007
2009
2011
2013
2015
2018
Target upper and lower limit5-year-ahead expectations3-year-ahead expectations5-year breakeven inflationActual inflation
Percent, year-on-year
0
3
6
9
12
1998
2000
2002
2004
2006
2008
2010
2012
2014
Chile Median of EMDEsIndex (15=best)
0
5
10
15
20
25
-6-4-202468
1996
1998
2000
2002
2004
2006
2008
2010
2012
2014
2017
Structural balance Gross debt (RHS)Percent of GDP Percent of GDP
0
1
2
319
98
2000
2002
2004
2006
2008
2010
2012
2014
2016
2018
Percentage points

52
FFigure A.5.3 IInflation targeting in Poland
AA. Inflation and inflation expectations BB. Central bank transparency
CC. General government structural balance and ddebt
D. Sensitivity of inflation expectations to shocks
Source: Bloomberg, Consensus Economics, Dincer and Eichengreen (2014), Haver Analytics, International Monetary Fund, World Bank.
A.-D. The start of the inflation targeting regime is shaded in gray. B. Transparency is based on information from the Central Bank of Chile’s website, statutes, annual reports, and other published documents, as calculated by Dincer and Eichengreen (2014). C. Structural balance is the difference between government revenues and expenditures, adjusted for effects due to economic cycles. D. Time-varying sensitivity is estimated by regressing long-term inflation forecast revisions on inflation shocks. Dotted lines denote 68 percent confidence interval. Appendix 3 provides details on the methodology.
-2
2
6
10
14
1998
2000
2002
2004
2006
2008
2010
2012
2014
2016
2018
Target upper and lower limit5-year-ahead expectations1-year-ahead expectationsActual inflation
Percent, year-on-year
0
3
6
9
12
1998
2000
2002
2004
2006
2008
2010
2012
2014
Poland Median of EMDEsIndex (15=best)
30405060708090
-6
-4
-2
0
2
4
1998
2000
2002
2004
2006
2008
2010
2012
2014
2017
Primary balance Gross debt (RHS)Percent of GDP Percent of GDP
0.0
0.5
1.019
98
2000
2002
2004
2006
2008
2010
2012
2014
2016
2018
Percentage points

53
RReferences
Akerlof, G., W. Dickens, and G. Perry. 2000. “Near-Rational Wage and Price Setting and the Long-Run Phillips Curve.” Brookings Papers on Economic Activity 31: 1-60.
Andrle, M., R. Garcia-Saltos, and G. Ho. 2014. “A Model-Based Analysis of Spillovers: The Case of Poland and the Euro Area.” IMF Working Paper 14/186, International Monetary Fund, Washington, DC.
Arestis, P., F. Ferrari-Filho, and L. F. de Paula. 2011. “Inflation Targeting in Brazil.” International Review of Applied Economics 25 (2): 127-48.
Arioli, R., C. Bates, H. Dieden, I. Duca, R. Friz, C. Gayer, G. Kenny, A. Meyler, and I. Pavlova. 2017. “EU Consumers’ Quantitative Inflation Perceptions and Expectations: An Evaluation.” Occasional Paper Series 186, European Central Bank, Frankfurt am Main.
Ascari, G., and A. M. Sbordone. 2014. “The Macroeconomics of Trend Inflation.” Journal of Economic Literature 52 (3): 679-739.
Auer, R., C. Borio, and A. Filardo. 2017. “The Globalisation of Inflation: The Growing Importance of Global Value Chains.” BIS Working Paper 602, Bank for International Settlements, Basel.
Ball, L. 1995. “Disinflation with Imperfect Credibility.” Journal of Monetary Economics 35 (1): 5-23.
Barbosa-Filho, N. 2008. “Inflation Targeting in Brazil: 1999-2006.” International Review of Applied Economics 22 (2): 187-200.
Baskaya, Y. S., E. Gulsen, and H. Kara. 2012. “Inflation Expectations and Central Bank Communication in Turkey.” Central Bank Review 12 (2): 1-10.
Batini, N., and D. Laxton. 2006. “Under What Conditions Can Inflation Targeting Be Adopted? The Experience of Emerging Markets.” Central Bank of Chile Working Paper 406, Central Bank of Chile, Santiago.
Beaudry, P., and F. Ruge-Murcia. 2017. “Canadian Inflation Targeting.” Canadian Journal of Economics 50 (5): 155-72.
Beechey, M. J., B. K. Johannsen, and A. T. Levin. 2011. “Are Long-Run Inflation Expectations Anchored More Firmly in the Euro Area Than in the United States?” American Economic Journal: Macroeconomics 3 (2): 104-29.
Benati, L. 2008. “Investigating Inflation Persistence across Monetary Regimes.” Quarterly Journal of Economics 123 (3): 1005-60.
Benes, J., K. Clinton, A. George, J. John, O. Kamenik, D. Laxton, P. Mitra, G. V. Nadhanael, H. Wang, and F. Zhang. 2017. “Inflation-Forecast Targeting for India: An Outline of the Analytical Framework.” IMF Working Paper 17/32, International Monetary Fund, Washington, DC.
Benigno, P., and L. Ricci. 2011. “The Inflation-Output Trade-Off with Downward Wage Rigidities.” American Economic Review 101 (4): 1436-66.
Bernanke, B. S. 2007. “Inflation Expectations and Inflation Forecasting.” Speech at the Monetary Economics Workshop of the National Bureau of Economic Research Summer

54
Institute, Cambridge, MA, July 10.
———, T. Laubach, F. S. Mishkin, and A. S. Posen. 2001. Inflation Targeting: Lessons from the International Experience. Princeton, NJ: Princeton University Press.
Blanchard, O. 2016. “The Phillips Curve: Back to the ‘60s.” American Economic Review: Papers & Proceedings 106 (5): 31-34.
———, E. Cerutti, and L. Summers. 2015. “Inflation and Activity - Two Explorations and Their Monetary Policy Implications.” NBER Working Paper 21726, National Bureau of Economic Research, Cambridge, MA.
Bognanski, J., A. A. Tombini, and S. R. C. Werlang. 2000. “Implementing Inflation Targeting in Brazil.” Working Paper 1, Central Bank of Brazil, Brasilia.
Bordo, M., and P. Siklos. 2014. “Central Bank Credibility, Reputation and Inflation Targeting in Historical Perspective.” Working Paper 20693, National Bureau of Economic Research, Cambridge, MA.
———. 2017. “Central Bank Credibility before and after the Crisis.” Open Economies Review 28 (1): 19-45.
Borio, C., and A. Filardo. 2007. “Globalisation and Inflation: New Cross-Country Evidence on the Global Determinants of Domestic Inflation.” BIS Working Paper 227, Bank for International Settlements, Basel.
Buliř, A., K. Šmídková, V. Kotlán, and D. Navrátil. 2008. “Inflation Targeting and Communication: It Pays Off to Read Inflation Reports.” Working Paper 08/234, International Monetary Fund, Washington, DC.
Buono, I., and S. Formai. 2018. “New Evidence on the Evolution of the Anchoring of Inflation Expectations.” Journal of Macroeconomics 57 (C): 39-54.
Calvo, G. 1983. “Staggered Prices in a Utility-Maximizing Framework.” Journal of Monetary Economics 12 (3): 383-98.
Calza, A. 2009. “Globalization, Domestic Inflation and Global Output Gaps: Evidence from the Euro Area.” International Finance 12 (3): 301-20.
Capistrán, C., and M. Ramos-Francia. 2010. “Does Inflation Targeting Affect the Dispersion of Inflation Expectations?” Journal of Money, Credit and Banking 42 (1): 113-34.
Carrasco, A., and J. Ferreiro. 2013. “Inflation Targeting and Inflation Expectations in Mexico.” Applied Economics 45 (10): 3295-3304.
Carroll, C. D. 2003. “Macroeconomic Expectations of Households and Professional Forecasters.” Quarterly Journal of Economics 118 (1): 269-98.
Central Bank of Chile. 2004. “Monetary Policy Report: January 2004.” Central Bank of Chile, Santiago.
Cerisola, M., and G. Gelos. 2009. “What Drives Inflation Expectations in Brazil? An Empirical Analysis.” Applied Economics 41 (10): 1215-27.
Céspedes, L. F., R. Chang, and A. Velasco. 2014. “Is Inflation Targeting Still on Target?”

55
International Finance 17 (2): 185-207.
Céspedes, L. F., and C. Soto. 2005. “Credibility and Inflation Targeting in an Emerging Market: Lessons from the Chilean Experience.” International Finance 8 (3): 545-75.
Chinn, M., and H. Ito. 2017. “The Chinn-Ito Index: A De Jure Measure of Financial Openness.” http://web.pdx.edu/~ito/Chinn-Ito_website.htm.
Choi, I. 2001. “Unit Root Tests for Panel Data.” Journal of International Money and Finance 20 (2): 249-72.
Christelis, D., G. D. Georgarakos, T. Jappelli, and M. van Rooij. 2016. “Trust in the Central Bank and Inflation Expectations.” DNB Working Papers 537, Netherlands Central Bank, Amsterdam.
Christiansen, I., F. Dion, and C. Reid. 2004. “Real Return Bonds, Inflation Expectations, and the Break-Even Inflation Rate.” Working Paper 2004-43, Bank of Canada, Ottawa.
Christoffersen, P., T. Slok, and R. Wescott. 2001. “Is Inflation Targeting Feasible in Poland? Economics of Transition 9 (1): 153-74.
Ciccarelli, M., J. A. Garcia, and C. Montes-Galdón. 2017. “Unconventional Monetary Policy and the Anchoring of Inflation Expectations.” Working Paper 1995, European Central Bank, Frankfurt am Main.
Clark, T., and T. Nakata. 2008. “Has the Behavior of Inflation and Long-Term Inflation Expectations Changed?” Federal Reserve Bank of Kansas City Economic Review 93 (1): 17-50.
Cogley, T., and A. Sbordone. 2008. “Trend Inflation, Indexation, and Inflation Persistence in the New Keynesian Phillips Curve.” American Economic Review 98 (5): 2101-26.
Coibion, O., and Y. Gorodnichenko. 2012. “What Can Survey Forecasts Tell Us about Information Rigidities?” Journal of Political Economy 120 (1): 116-59.
———. 2015 “Is the Phillips Curve Alive and Well after All? Inflation Expectations and the Missing Disinflation.” American Economic Journal: Macroeconomics 7 (1): 197-232.
Coibion, O., Y. Gorodnichenko, and R. Kamdar. 2018a. “How Do Firms Form Their Expectations? New Survey Evidence.” American Economic Review 108 (9): 2671-713.
———. 2018b. “The Formation of Expectations, Inflation, and the Phillips Curve.” Journal of Economic Literature. 56 (4): 1447-91.
Coibion, O., Y. Gorodnichenko, S. Kumar, and M. Pedemonte. 2018. “Inflation Expectations as a Policy Tool?” NBER Working Paper 24788, National Bureau of Economic Research, Cambridge, MA.
Corbo, V. 2005. “Monetary Policy under Inflation Targeting in Chile and around the World.” Speech at the 9th Annual Conference of the Central Bank of Chile, Santiago, October 20.
Cortes, G., and C. A. C. Paiva. 2017. “Deconstructing Credibility: The Breaking of Monetary Policy Rules in Brazil.” Journal of International Money and Finance 74 (June): 31-52.
Cunningham, R., B. Desroches, and E. Santor. 2010. “Inflation Expectations and the

56
Conduct of Monetary Policy: A Review of Recent Evidence and Experience.” Bank of Canada Review (Spring): 13-25.
Davis, J. S. 2014. “Inflation Targeting and the Anchoring of Inflation Expectations: Cross- Country Evidence from Consensus Forecasts.” Globalization and Monetary Policy Institute Working Paper 174, Federal Reserve Bank of Dallas, Dallas, TX.
De Gregorio, J. 2009a. “Inflation Targeting and Financial Crises.” Speech at the at the Seminar on Financial Crises, Banco de la República de Colombia and the Fondo de Garantías de Instituciones Financieras de Colombia, Bogota.
———. 2009b. “Chile: Foreign Shocks and Policy Responses.” World Economics 10 (4): 5-24.
———, A. Tokman, and R. Valdés. 2005. “Flexible Exchange Rate with Inflation Targeting in Chile: Experience and Issues.” Working Paper 540, Inter-American Development Bank, Washington, DC.
de Mendonça, H. F., and K. A. Galveas. 2013. “Transparency and Inflation: What Is the Effect on the Brazilian Economy?” Economic Systems 37 (1): 69-80.
de Mendonça, H. F., and I. S. Veiga. 2014. “A Note on Openness and Inflation Targeting: Implications for the Unpleasant Fiscal Arithmetic.” Macroeconomic Dynamics 18 (5): 1187- 1207.
De Pooter, M., P. Robitaille, I. Walker, and M. Zdinak. 2014. “Are Inflation Expectations Well Anchored in Brazil, Chile, and Mexico?” International Journal of Central Banking 10 (2): 337-400.
Demertzis, M., and M. Viegi. 2008. “Inflation Targets as Focal Points.” International Journal of Central Banking 4: 55-86.
Dincer, N. N., and B. Eichengreen. 2014. “Central Bank Transparency and Independence: Updates and New Measures.” International Journal of Central Banking 10 (1): 189-253.
Ehrmann, M. 2015. “Targeting Inflation from Below: How Do Inflation Expectations Behave?” International Journal of Central Banking 11 (S1): 213-49.
Eusepi, S., and B. Preston. 2018a. “Central Bank Communication and Expectations Stabilization.” Journal of Economic Literature 56: 3-59.
———. 2018b. “Fiscal Foundations of Inflation: Imperfect Knowledge.” American Economic Review 108 (9): 2551-89.
Evans, G., and S. Honkapohja. 2009. “Learning and Macroeconomics.” Annual Review of Economics 1: 421-49.
Fischer, S. 1977. “Long-Term Contracts, Rational Expectations, and the Optimal Money Supply Rule.” Journal of Political Economy 85 (1): 191-205.
Forbes, K. 2018. “Has Globalization Changed the Inflation Process?” Paper presented at the 17th Bank for International Settlements Annual Research Conference, Zurich, June 22.
Friedman, B. 1979. “Optimal Expectations and the Extreme Information Assumptions of ‘Rational Expectations’ Macromodels.” Journal of Monetary Economics 5 (1): 23-41.

57
Friedman, M. 1968. “The Role of Monetary Policy.” American Economic Review 58 (1): 1-17.
Fuhrer, J. C. 1997. “The (Un)Importance of Forward-Looking Behavior in Price Specifications.” Journal of Money, Credit, and Banking 29 (3): 338-50.
———, and G. Moore. 1995. “Inflation Persistence.” Quarterly Journal of Economics 110 (1): 127-59.
Gaiotti, E. 2010. “Has Globalization Changed the Phillips Curve? Firm-Level Evidence on the Effect of Activity on Prices.” International Journal of Central Banking 6 (4): 51-84.
Galati, G., P. Heemeijer, and R. Moessner. 2011. “How Do Inflation Expectations Form? New Insights from a High-Frequency Survey.” BIS Working Paper 349, Bank for International Settlements, Basel.
Galati, G., S. Poelhekke, and C. Zhou. 2011. “Did the Crisis Affect Inflation Expectations?” International Journal of Central Banking 7 (1): 167-207.
Galí, J., and M. Gertler. 1999. “Inflation Dynamics: A Structural Economic Analysis.” Journal of Monetary Economics 44 (2): 195-222.
Garcia, J. A., and S. Werner. 2018. “Inflation News and Euro Area Inflation Expectations.” IMF Working Paper 18/167, International Monetary Fund.
Garnier, C., E. Mertens, and E. Nelson. 2015. “Trend Inflation in Advanced Economies.” International Journal of Central Banking 11 (4): 65-136.
Georgiadis, G. 2016. “Determinants of Global Spillovers from U.S. Monetary Policy.” Journal of International Money and Finance 67 (C): 41-61.
Giavazzi, F., I. Goldfajn, and S. Herrera. 2005. Inflation Targeting, Debt, and the Brazilian Experience, 1999 to 2003. Cambridge, MA: MIT Press.
Gottschalk, J., and D. Moore. 2001. “Implementing Inflation Targeting Regimes: The Case of Poland.” Journal of Comparative Economics 29 (1): 24-39.
Grishchenko, O., S. Mouabbi, and J.-P. Renne. 2017. “Measuring Inflation Anchoring and Uncertainty: A US and Euro Area Comparison.” Finance and Economics Discussion Series 2017-002, Board of Governors of the Federal Reserve System, Washington, DC.
Grothe, M., and A. Meyler. 2018. “Inflation Forecasts: Are Market-Based and Survey-Based Measures Informative?” International Journal of Financial Research 9 (1): 171-88.
Gupta, A. S. 2008. “Does Capital Account Openness Lower Inflation?” International Economic Journal 22: 471-87.
Gürkaynak, R. S., A. Levin, and E. Swanson. 2010. “Does Inflation Targeting Anchor Long- Run Inflation Expectations? Evidence from the U.S., UK, and Sweden.” Journal of the European Economic Association 8 (6): 1208-42.
Hawtrey, R. G. 1923. Monetary Reconstruction. London: Longmans, Green and Co.
Hördahl, P. 2009. “Disentangling the Drivers of Recent Shifts in Break-Even Inflation Rates.” BIS Quarterly Review (March): 10-11.

58
Ihrig, J., S. B. Kamin, D. Lindner, and J. Marquez. 2010. “Some Simple Tests of the Globalization and Inflation Hypothesis.” International Finance 13 (3): 343-75.
Ilzetzki, E., C. Reinhart, and K. Rogoff. 2017. “Exchange Arrangements Entering the 21st Century: Which Anchor Will Hold?” NBER Working Paper 23134, National Bureau of Economic Research, Cambridge, MA.
Im, K. S., M. H. Pesaran, and Y. Shin. 2003. “Testing for Unit Roots in Heterogeneous Panels.” Journal of Econometrics 115 (1): 53-74.
IMF (International Monetary Fund). 2015. “Brazil: 2014 Article IV Consultation.” IMF.
———. 2016. “Global Disinflation in an Era of Constrained Monetary Policy.” In World Economic Outlook, 121-70. Washington, DC: IMF.
———. 2018. “Challenges for Monetary Policy in Emerging Markets as Global Financial Conditions Normalize.” World Economic Outlook. Washington, DC: IMF.
Iossifov, P., and J. Podpiera. 2014. “Are Non-Euro Area EU Countries Importing Low Inflation from the Euro Area?” Working Paper 14/191, International Monetary Fund.
Johnson, D. R. 2003. “The Effect of Inflation Targets on the Level of Expected Inflation in Five Countries.” Review of Economics and Statistics 85: 1076-81.
Jonas, J., and F. Mishkin. 2003. “Inflation Targeting in Transition Countries: Experience and Prospects.” Working Paper 9667, National Bureau of Economic Research.
Jonung, L. 1981. “Perceived and Expected Rates of Inflation in Sweden.” American Economic Review 71 (5): 961-68.
Kabundi, A., E. Schaling, and M. Some. 2015. “Monetary Policy and Heterogeneous Inflation Expectations in South Africa.” Economic Modelling 45 (February): 109-17.
Keynes, J. M. 1936. The General Theory of Employment, Interest and Money. London: Macmillan.
———. 1940. How to Pay for the War: A Radical Plan for the Chancellor of the Exchequer. London: Macmillan and Co.
Kose, M. A., E. Prasad, K. Rogoff, and S.-J. Wei. 2010. “Financial Globalization and Economic Policies.” In Handbook of Development Economics, Volume 5, edited by D. Rodrik and M. Rosenzweig, 4283-362. Oxford, U.K.: North-Holland.
Kumar, S., H. Afrouzi, O. Coibion, and Y. Gorodnichenko. 2015 “Inflation Targeting Does Not Anchor Inflation Expectations: Evidence from Firms in New Zealand.” Brookings Papers on Economic Activity 2: 151-225.
Lei, C., Z. Lu, and C. Zhang. 2015. “News on Inflation and the Epidemiology of Inflation Expectations in China.” Economic Systems 39 (4): 644-53.
Levy Yeyati, E., F. Sturzenegger, and I. Reggio. 2010. “On the Endogeneity of Exchange Rate Regimes.” European Economic Review 54 (5): 659-77.
Lledó, V., S. Yoon, X. Fang, S. Mbaye, and Y. Kim. 2017. “Fiscal Rules at a Glance.” Background paper, International Monetary Fund, Washington, DC.
López Vicente, F., and J. M. Serena Garralda. 2014. “Macroeconomic Policy in Brazil:

59
Inflation Targeting, Public Debt Structure and Credit Policies.” Occasional Paper 1405, Banco de España, Madrid.
Lucas, R. E. 1972. “Expectations and the Neutrality of Money.” Journal of Economic Theory 4 (2): 103-24.
Maćkowiak, B., and M. Wiederholt. 2009. “Optimal Sticky Prices under Rational Inattention.” American Economic Review 99 (3): 769-803.
Maddala, G. S., and S. Wu. 1999. “A Comparative Study of Unit Root Tests with Panel Data and a New Simple Test.” Oxford Bulletin of Economics and Statistics 61 (S1): 631-52.
Malmendier, U., and S. Nagel. 2016. “Learning from Inflation Experiences.” The Quarterly Journal of Economics 131 (1): 53-87.
Mankiw, N. G., and R. Reis. 2002. “Sticky Information versus Sticky Prices: A Proposal to Replace the New Keynesian Phillips Curve.” Quarterly Journal of Economics 117 (4): 1295-1328.
———. 2018. “Friedman’s Presidential Address in the Evolution of Macroeconomic Thought.” Journal of Economic Perspectives 32 (1): 81-96.
———, and J. Wolfers. 2003. “Disagreement about Inflation Expectations.” In NBER Macroeconomics Annual, Volume 18, edited by M. Gertler and K. Rogoff, 209-48. Cambridge, MA: MIT Press.
Martínez-Garcia, E. 2017. “Good Policies or Good Luck? New Insights on Globalization and the International Monetary Policy Transmission Mechanism.” Computational Economics 1-36.
Mehrotra, A., and J. Yetman. Forthcoming. “Decaying Expectations: What Inflation Forecasts Tell Us about the Anchoring of Inflation Expectations.” International Journal of Central Banking.
Mertens, E. 2016. “Measuring the Level and Uncertainty of Trend Inflation.” The Review of Economics and Statistics 98 (5): 950-67.
Miles, D., U. Panizza, R. Reis, and Á. Ubide. 2017. “And Yet It Moves: Inflation and the Great Recession.” Geneva Reports on the World Economy 19, Centre for Economic Policy Research, London.
Minella, A., P. Springer de Freitas, I. Goldfajn, and M. Kfoury Muinhos. 2003. “Inflation Targeting in Brazil: Constructing Credibility under Exchange Rate Volatility.” Journal of International Money and Finance 22 (7): 1015-40.
Mishkin, F. 2004. “Can Inflation Targeting Work in Emerging Market Countries?” Working Paper 10646, National Bureau of Economic Research, Cambridge, MA.
———. 2007. Monetary Policy Strategy. Cambridge, MA: MIT Press.
Mishkin, F., and M. Savastano. 2002. “Monetary Policy Strategy for Emerging Market Countries: Lessons from Latin America.” Comparative Economic Studies 24 (2): 45-82.
Miyajima, K., and J. Yetman. 2018. “Inflation Expectations Anchoring across Different Types of Agents: The Case of South Africa.” IMF Working Paper 18/177, International

60
Monetary Fund.
Morandé, F. 2002. “A Decade of Inflation Targeting in Chile: Developments, Lessons, and Challenges.” In Inflation Targeting: Design, Performance, Challenges, 583-626. Santiago: Central Bank of Chile.
National Bank of Poland. 1998. “Medium-Term Strategy of Monetary Policy, 1999–2003.” Monetary Policy Council, National Bank of Poland, Warsaw.
———. 2003. “Monetary Policy Strategy beyond 2003.” Monetary Policy Council, National Bank of Poland, Warsaw.
———. 2016. “Report on Monetary Policy Implementation in 2015.” National Bank of Poland, Warsaw.
Patra, M. D., and P. Ray. 2010. “Inflation Expectations and Monetary Policy in India: An Empirical Exploration.” IMF Working Paper 10/84, International Monetary Fund.
Pedroni, P. 1999. “Critical Values for Cointegration Tests in Heterogeneous Panels with Multiple Regressors.” Oxford Bulletin of Economics and Statistics 61 (S1): 653-70.
———. 2000. “Fully-Modified OLS for Heterogeneous Cointegrated Panels.” Advances in Econometrics 15: 93-130.
———. 2001. “Purchasing Power Parity Tests in Cointegrated Panels.” The Review of Economics and Statistics 83 (4): 727–31.
Phelps, E. S. 1967. “Phillips Curves, Expectations of Inflation and Optimal Unemployment Over Time.” Economica 34 (135): 254–281.
Phillips, A.W. 1958. “The Relationship between Unemployment and the Rate of Change of Money Wage Rates in the United Kingdom, 1861–1957.” Economica 25 (100): 283-99.
Polański, Z. 2004. “Poland and the European Union: The Monetary Policy Dimension: Monetary Policy before Poland’s Accession to the European Union.” Bank i Kredyt 5: 4-18.
Reid, M. 2009. “The Sensitivity of South African Inflation Expectations to Surprises.” South African Journal of Economics 77: 414–429.
Rogoff, K. 2006. “Impact of Globalization on Monetary Policy.” Paper prepared for the Federal Reserve of Kansas City Jackson Hole Conference, “The New Economic Geography: Effects and Policy Implications,” Jackson Hole, WY, August 24-26.
Romer, D. 1993. “Openness and Inflation: Theory and Evidence.” The Quarterly Journal of Economics 108 (4): 869-903.
Rotemberg, J. 1982. “Sticky Prices in the United States.” Journal of Political Economy 90 (6): 1187-211.
Samuelson, P., and R. Solow. 1960. “Analytical Aspects of Anti-Inflation Policy.” American Economic Review Papers and Proceedings 50 (2): 177-94.
Sargent, T., and N. Wallace. 1975. “‘Rational’ Expectations, the Optimal Monetary Instrument, and the Optimal Money Supply Rule.” Journal of Political Economy 83 (2): 241-54.

61
———. 1976. “Rational Expectations and the Theory of Economic Policy.” Journal of Monetary Economics 2 (2): 169-83.
Schaechter, A., M. R. Stone, and M. Zelmer. 2000. “Adopting Inflation Targeting: Practical Issues for Emerging Market Countries.” Occasional Paper 202, International Monetary Fund.
Schmidt-Hebbel, K., and M. Tapia. 2002. “Inflation Targeting in Chile.” North American Journal of Economics and Finance 13 (2): 125-46.
Shambaugh. J. 2004. “The Effect of Fixed Exchange Rates on Monetary Policy.” Quarterly Journal of Economics 119 (1): 301-52.
Sims, C. A. 2003. “Implications of Rational Inattention.” Journal of Monetary Economics 50 (3): 665-90.
Sousa, R., and J. Yetman. 2016. “Inflation Expectations and Monetary Policy.” BIS Paper 89d, Bank for International Settlements, Basel.
Stock, J., and M. Watson. 2007. “Why Has U.S. Inflation Become Harder to Forecast?” Journal of Money, Credit and Banking 39 (1): 3-33.
———. 2016. “Core Inflation and Trend Inflation.” Review of Economics and Statistics 98 (4): 770-84.
Strohsal, T., R. Melnick, and D. Nautz. 2016. “The Time-Varying Degree of Inflation Expectations Anchoring.” Journal of Macroeconomics 48 (June): 62-71.
Strohsal, T., and L. Winkelmann. 2015. “Assessing the Anchoring of Inflation Expectations.” Journal of International Money and Finance 50 (C): 33-48.
Taylor, J. 1980. “Aggregate Dynamics and Staggered Contracts.” Journal of Political Economy 88 (1): 1-23.
Tytell, I., and S.-J. Wei. 2004. “Does Financial Globalization Induce Better Macroeconomic Policies?” IMF Working Paper 04/84, International Monetary Fund.
Valdés, R. 2007. “Inflation Targeting in Chile: Experience and Selected Issues.” Economic Policy Paper 22, Central Bank of Chile, Santiago.
Woodford, M. 2002. “Imperfect Common Knowledge and the Effects of Monetary Policy.” In Knowledge, Information, and Expectations in Modern Macroeconomics: In Honor of Edmund S. Phelps, edited by P. Aghion, R. Frydman, J. Stiglitz, and M. Woodford. Princeton, NJ: Princeton University Press.
———. 2003. Interest and Prices: Foundations of a Theory of Monetary Policy. Princeton, NJ: Princeton University Press.
———. 2005. “Central-Bank Communication and Policy Effectiveness.” NBER Working Paper 24788, National Bureau of Economic Research, Cambridge, MA.
World Bank. 2018. Global Economic Prospects: Broad-Based Upturn, but for How Long? Washington, DC: World Bank.
Yetman, J. 2017. “The Evolution of Inflation Expectations in Canada and the US.” Canadian Journal of Economics 50 (5): 711-37.