centralization vs. decentralization: selection of
TRANSCRIPT

IN DEGREE PROJECT INDUSTRIAL ENGINEERING AND MANAGEMENT,SECOND CYCLE, 30 CREDITS
, STOCKHOLM SWEDEN 2020
Centralization vs. Decentralization: Selection of Downstream Supply Chain Strategy
A single case study on the positioning of purchasing within the Supply Chain of a multinational company
OLIVER MAZOYER
KTH ROYAL INSTITUTE OF TECHNOLOGYSCHOOL OF ARCHITECTURE AND THE BUILT ENVIRONMENT

TRITA TRITA-ITM-EX 2020:262
www.kth.se

Centralization vs. Decentralization:
Selection of Global Supply Chain
Strategy A single case study on the positioning of purchasing within the
Supply Chain of a multinational company
by
Oliver Mazoyer
Master of Science Thesis TRITA-ITM-EX 2020:262
KTH Industrial Engineering and Management
Industrial Management
SE-100 44 STOCKHOLM

Centralisering vs. Decentralisering:
Strategiurval för en Global Supply
Chain En enstaka fallstudie om positionsändring på inköpsfunktionen i ett
multinationellt företags Supply Chain
av
Oliver Mazoyer
Examensarbete TRITA-ITM-EX 2020:262
KTH Industriell Teknik och Management
Industriell Ekonomi och Organisation
SE-100 44 STOCKHOL

1
Master of Science Thesis TRITA-ITM-EX 2020:262
Centralization vs. Decentralization: Selection of a
Global Supply Chain Strategy
Oliver Mazoyer
Approved
202X-06-05
Examiner
Jannis Angelis
Supervisor
Luca Urciuoli
Commissioner
Ericsson AB
Contact Person
Magnus Dahlin
Abstract
As Supply Chain Management has continuously evolved, it has during recent times been
exposed to the opportunities and threats that follow globalization. Firms have the possibility of
getting their products/services to customers worldwide by outsourcing processes. This
possibility has even turned mandatory for numerous firms in order to be competitive. However,
such decisions can expose the Supply Chain to various risks. Because of lack of data and
Supply Chain Structures, decision-makers need to distinguish advantages vs. disadvantages
between centralized, decentralized or even outsourced structures. The purpose of this study has
been, based on gathered data from a case company, to determine what Supply Chain structure
to opt for when it comes to purchasing.
This master thesis has performed a literature review on the science of Data Mining to enrich
the quality of a quantitative part based on databases of the case company. The study also
reviews Supply Chain Management strategies and how to select an appropriate distribution
channel design - allowing for a framework about selecting an appropriate network design and
another framework summarizing current literature’s contribution on the question of
centralization versus decentralization based on Finance, Performance or Information. These
three pillars are the aspects used as reference of analysis in various literature and could
therefore be compared with empirics. The selection framework was filled in by key individuals
at the case company and was associated with qualitative contributions from interviews about
strengths and weaknesses of three scenarios involving centralization, decentralization or
outsourcing.
With obtained data, it was possible to identify all strengths and weaknesses of each scenario
and discuss differences to select the best possible option. The findings were summarized into
a framework where one can clearly see pros and cons of each scenario, thus providing a concise
summary of implications following centralization, decentralization and outsourcing

2
respectively. The results of the distribution network pointed towards a decentralization of the
purchasing function as a more cost-efficient strategy, but these results must be questioned
because of the current setting-bias with the spreading of the COVID-19 virus and its economic
consequences. However, when all arguments were grouped into the final summarizing figure,
it was concluded that the outsourcing strategy is the most advantageous. This thesis has thus
permitted the extension of a framework that identifies the best distribution network design and
summarized the implications of centralizing, decentralizing or outsourcing purchasing.
Keywords: Supply Chain Management, Globalization, Outsourcing, Risks, Purchasing, Data
Mining, Strategies, Network Design, Selection Framework, Centralization, Decentralization,
Scenario, Distribution Network, COVID-19

3
Examensarbete TRITA-ITM-EX 2020:262
Centralisering vs. Decentralisering: Strategiurval
för en Global Supply Chain
Oliver Mazoyer
Godkänt
2020-06-05
Examinator
Jannis Angelis
Handledare
Luca Urciuoli
Uppdragsgivare
Ericsson AB
Kontaktperson
Magnus Dahlin
Sammanfattning
Supply Chain Management har kontinuerligt utvecklats med bl.a. namnbyten eller nya populära
strategier. Den har under modern tid varit utsatt för både möjligheter såsom hot vilka har varit
följder av globalisering. Företag har erhållit möjligheterna att leverera sina produkter till
kunder över hela världen men även att outsourca processer för att förenkla denna leverans.
Oursourcingmöjligheten har även översatts till obligatoriska beslut för flera företag för att ens
kunna erbjuda produkter till konkurrenskraftiga priser. Dessa beslut kan dock exponera en
Supply Chain till olika risker, en brytning i logistikkedjan till exempel. På grund av dessa
konsekvenser måste företag värdera vilken strategi som måste tillämpas för varje process i
kedjan. Ska de centraliseras, decentraliseras eller outsourcas? Ändamålet med denna studie är
att, baserat på insamlad data från ett case företag, kunna bestämma vilken strategi ska tillämpas
när det kommer till inköp från externa leverantörer.
Detta examensarbete har utfört en litteraturgenomgång på bl.a. studier om Data Mining för att
berika kvalitén på den kvantitativa delen baserad på databaser från caseföretaget. Utvald
litteratur förklarar olika aspekter från Supply Chain Management med involverade strategier
och hur en lämplig nätverksdesign väljs ut. Målet är att utveckla ett ramverk för urval av
lämplig nätverksdesign för caseföretaget samt ett ramverk för att summera litteraturens
budskap till implikationer av centralisering eller decentralisering med fokus på Finans,
Prestanda och Information. Urvalsramverket har därefter fyllts i av nyckelpersoner från
caseföretaget för att jämföras med kvalitativa bidrag från intervjuer om styrkor och svagheter
på tre utvecklade scenarios om centralisering, decentralisering eller outsourcing.
Med erhållen data möjliggjordes en diskussion för att tydliggöra styrkor och svagheter för varje
scenario för att kunna noggrant jämföras och skapa argument för vilket skulle väljas. Resultat
och argument har generaliserats och sammanfattats i en figur där en kan tydligt se för- och
nackdelar med varje scenario. På så sätt disponeras en koncis slutsats av implikationer med att

4
centralisera, decentralisera eller att outsourca. Resultaten från urvalsramverket pekar på att
decentraliseringsstrategin är den optimala för caseföretaget, detta måste dock ifrågasättas på
grund av kontexten med den nuvarande spridningen av COVID-19 viruset och dess inverkan
på ekonomin. Med detta i åtanke och ihopsamlade argument, drogs slutsatsen att
outsourcingstrategin är den mest lämpliga för caseföretaget. Detta masterexamensarbete har
således lett till förlängningen av ett urvalsramverk av distributionsnätverksdesign samt
diskuterat fram och sammanfattat implikationerna av centralisering, decentralisering och
outsourcing.
Nyckelord: Supply Chain Management, Globalisering, Outsourcing, Risker, Inköp, Data
Mining, Strategier, Nätverksdesign, Urvalsramverk, Centralisering, Decentralisering,
Scenario, Distributionsnätverk, COVID-19

5
Foreword
This master thesis was conducted between January and June 2020 for Ericsson AB and was
written at the department of Industrial Engineering and Management. The study corresponds
to 30 high school credits from the Royal Institute of Technology in Stockholm, Sweden.
Acknowledgements
The acknowledgements can be divided into a thank you message for the support received from
my university and for people at Ericsson AB.
Firstly, I must express my utmost gratitude towards my supervisor Luca Urciuoli, Associate
Professor in Supply Chain Management for the department of Industrial Engineering and
Management who helped me with consistently good advice throughout the conduction of this
study, and even before its commencement.
Secondly, I would also like to thank my seminar leader Jannis Angelis, Docent in Operations
Strategy at the department of Industrial Engineering and Management, for providing valuable
support, feedback and structuring seminars with the purpose of improving this study as much
as possible.
Thirdly, I would like to thank Magnus Dahlin, Head of MELA Supply for entrusting me this
thesis, answering multiple questions and regularly asking for updates and suggesting ways to
help the study advance, as well as all other Ericsson employees that have contributed via
interviews or emails.
Ultimately, I would like to specially thank Hans Engström H, Senior Product Portfolio
Manager, who spent many hours of his working schedule to help me through the jungle that is
a multinational firm’s database. This thesis would surely not have been possible without his
crucial guidance.
Oliver Sébastien Mazoyer
Stockholm, Sweden
May, 2020

6
Glossary
The following chapter will list definitions and abbreviations of terms utilized in this thesis to
facilitate understanding for the reader.
ASP: Authorized Service Provider are outsourced installers of Ericsson’s offering on the site
for the customer. They are not always present in the Supply Chain.
BA: Business Area
Carbon Footprint: The total greenhouse gas emissions caused.
CPO: Customer Purchase Order
Customer Experience: How easy life is for the customer as well as the degree of
customization that is involved.
EAB: Ericsson AB, the mother company
Economies of scales: Cost advantage gained as a result of increased production (upscaled
operation)
Economies of scope: Cost advantage gained by producing complementary goods and
services which help decrease marginal costs.
EMS: External Manufacturing Site is an outsourced factory to produce Ericsson components,
owned by Ericsson, for the final offering.
EOM: Ericsson Operation Model
ESH: Ericsson Supply Hub are warehouses strategically placed closer to the customer in
order to gain flexibility, reduce tied up capital (compared to previous distribution centers
Ericsson had) and shorten lead times.
ESS: Ericsson Supply Site are the factories owned by Ericsson that manufacture components
for the final offering
HW: Hardware
Inbound Logistics: The transport, storage and delivery of goods arriving to a company.
Internet of Things (IoT): An interconnected system that allows an autonomous exchange of
data.

7
Just-in-time: A production system which aims to reduce times, classified as wastes, in the
system.
LC: Local Company
Lean Manufacturing: A systematic production method which aims to eliminate wastes,
undesired aspects of the production system, and focuses on value adding aspects.
LSP: Local Service Provider
MA: Market Area
Make-to-order (MTO): A production strategy where production only begins when customer
order has been received. It allows for customization but lead time is longer.
Make-to-stock (MTS): A traditional production strategy where production anticipates
customer order by following the forecast of expected demand. This strategy can therefore
lead to inventory or stock-outs.
MANA: Market Area North America
MELA: Market Area Europe and Latin America
MMEA: Market Area Middle East and Africa
MOAI: Market Area Oceania, South East Asia and India
NGSC: Next Generation Supply Chain, an internal project at Ericsson
Order Visibility: The ability of customers but also from the firm to track orders from
placement to delivery
Outbound logistics: The transport, storage and delivery of leaving the company to
customers.
Outsourcing is when a firm hires another firm to be responsible for a previously internally-
performed activity.
PDU - Product Development Unit
PO - Purchase Order
Product Availability: Reflects the probability of having a product ready, in stock, when a
customer order is made.

8
Product Variety: represents the amount of different offerings available for the customer in a
distribution network.
Productified/Productification: signifies that a purchased 3PP, for example, has been
registered as a product in Ericsson’s databases.
Response Time: the amount of time it takes for a customer to receive their order.
Returnability: The ability of the distribution network to handle returns of unsatisfactory
orders made by the customers.
Risk Diversification: aims to decrease potential negative effects from one variable by
spreading out the risk, increased number of cable suppliers for instance.
Risk Pooling: consists in the sharing of all risks between a group of firms, between buyer
and supplier for instance. Instead of transfering all risk to the partner firm, it is shared and
reduced overall
SIPP: Stock Item Product Portfolio are the items kept in physical stock, as opposed to non-
stock items, and are determined based on the forecast of demand.
SO: Sales Order
Supply Chain: A network between a firm and its suppliers to produce and distribute a
specific product to the final buy. This network includes different activities, people, entities,
information, and resources. The supply chain also represents the steps it takes to get the
product or service from its original state to the customer
Tacit knowledge: The knowledge that cannot be codified and is difficult to transfer to
another person, it is often gained from long experience.
Time to Market: Time it takes to get a new product out on the market.
VMI: Vendor Managed Inventory
3PL: Third Party Logistics
5G: The fifth generation of wireless connectivity following 3G and 4G

9
Table of Contents
Abstract 1
Sammanfattning 3
Foreword 5
Acknowledgements 5
Glossary 6
Table of Contents 9
List of figures 11
List of tables 12
1. Introduction 13
1.1 Background 13
1.2 Problem statement 14
1.3 Purpose 14
1.4 Research Question 14
1.5 Delimitations & Directives 15
2. Literature Review and Theoretical Framework 16
2.1 Data Science 16
2.2 Supply Chain and Management 20
2.3 Strategy in Supply Chain Management 24
3. Method 32
3.1 Pre-research/Pre-study 32
3.2 Research design 32
3.3.1 Single Case Study 34
3.3.2 Literature Review 35
3.3.3 Ericsson’s Internal Data 36
3.3.4 Interviews 38
3.3.5 Workshop 40
3.4 Data Analysis 41
3.5 Quality of Research 44
3.5.1 Reliability 44
3.5.2 Validity 45
3.5.3 Generalizability 46
3.5.4 Ethical Considerations 46
3.5.5 Sustainability Considerations 47
4. Business Introduction 48

10
4.1 Ericsson AB 48
4.2 Market Area Europe and Latin America 48
4.3 MELA Supply Chain 50
4.4 Firm-specific problem 51
4.5 Scenarios 54
5. Empirical Findings 58
5.1 Workshop 58
5.1.1 Workshop Introduction 58
5.1.2 Summary of Findings 59
5.1.3 Relevant contributions 60
5.2 As-Is Visualization 61
5.2.1 Locally Sourced 3PPs 61
5.2.2 Categorization of Locally Sourced 3PP HW 62
5.2.3 Third Party Products HW vs. Global Portfolio 64
5.3 Advantages & Disadvantages 65
5.3.1 Scenario 1 - Removing 3PPs 65
5.3.2 Scenario 2 - Moving Purchasing to ASPs 66
5.3.3 Scenario 3 - Moving Purchasing to One Trusted Supplier 67
5.3.4 Evaluation of Scenarios 68
5.3.5 Production Costs & Capacity 69
5.3.6 Infohub 70
6. Discussion 73
6.1 InfoHub, Workshop and Transition Challenges 73
6.2 Distribution Network Design Selection 74
7. Conclusion 81
7.1 Theoretical Implications 81
7.2 Managerial Implications & Limitations 82
7.3 Future Research 83
References 84
Appendix A - Outsourcing Framework 91
Appendix B - Pre-study Interviews 92
Appendix C - Literature Review Selection 93
Appendix D - Interview Questions for SC Manager 96
Appendix E - Interview Questions for InfoHub 97
Appendix F - Interview with ESS Tallinn 98
Appendix G - Other people involved 99

11
List of figures
Figure 1. Process diagram of CRISP-DM’s six major phases (IBM, 2012) ............................ 17
Figure 2. Kadiyala and Srivastava’s Typology of Data Mining Processes (2011) .................. 18
Figure 3. Porter’s generic value chain (1985) .......................................................................... 20
Figure 4. Stages to integrate the Supply Chain (Stevens, 1989) .............................................. 22
Figure 5. Single vs. Multi-Sourcing (Angelis, 2018)............................................................... 24
Figure 6. Steps in strategic planning (Nakano, 2020) .............................................................. 24
Figure 7. Framework for selecting a delivery network design based on performance in ten
measures (Chopra, 2003) ......................................................................................................... 29
Figure 8. Framework for selecting a delivery network design based on performance for
different characteristics (Chopra, 2003) .................................................................................. 29
Figure 9. Framework to evaluate a distribution network based on performance ..................... 31
Figure 10. The study’s research design .................................................................................... 33
Figure 11. The three stages of a systematic literature review (Tranfield, Denyer & Smart,
2003) ........................................................................................................................................ 35
Figure 12. Matrix for theoretical contribution (Fawcett & Waller, 2011) ............................... 36
Figure 13. Framework to evaluate the three scenarios ............................................................ 42
Figure 14. Triangulation method ............................................................................................. 45
Figure 15. Market Area Europe and Latin America ................................................................ 48
Figure 16. ESS, EMS & ESH across MELA ........................................................................... 49
Figure 17. A generalized and simplified Supply Chain Flow of MELA ................................. 50
Figure 18. General flows inside Ericsson’s Supply Chain in MELA (Ericsson, 2018)........... 51
Figure 19. General Area of Investigation in the MELA Supply Chain ................................... 52
Figure 20. Specified Area of Investigation and identified Problem Area in the MELA Supply
Chain ........................................................................................................................................ 52
Figure 21. MELA’s Supply Chain after removing the 3PPs and local warehouses ................ 54
Figure 22. Consequence of removing 3PPs when purchasing ................................................. 54
Figure 23. MELA’s Supply Chain by giving 3PP responsibility to ASP ................................ 55
Figure 24. Movement of 3PP purchasing to ASPs .................................................................. 56
Figure 25. MELA’s Supply Chain by having one supplier for all 3PPs .................................. 56
Figure 26. Movement of Purchasing to one supplier ............................................................... 57
Figure 27. Front-end and Back-end vision .............................................................................. 58
Figure 28. Product numbers that need to be reduced ............................................................... 59
Figure 29. Savings involving Site Products over the last six years ......................................... 61
Figure 30. Rows and Columns to extract HANA Data of locally sourced 3PPs in 2019 ........ 61
Figure 31. Extract of Pivot Table to quantify yearly local 3PPs ............................................. 62
Figure 32. World Map of 3PP ordering behavior for MELA in 2019 ..................................... 62
Figure 33. Categorization of locally sourced 3PP HW of 2019. ............................................. 63
Figure 34. Extract of Pivot Table of yearly quantification of local 3PP HW. ........................ 64
Figure 35. 3PPs that have duplicates in the global portfolio ................................................... 64

12
Figure 36. Comparison between two jumper cables, global portfolio vs. 3PP HW ................ 65
Figure 37. Categorization of 3PP HW missing a product description ..................................... 65
Figure 38. Evaluation of the three scenarios ............................................................................ 68
Figure 39. Description Template of the Product Portfolio ...................................................... 71
Figure 40. Framework for centralization vs. decentralization of procurement based on a
literature review ....................................................................................................................... 76
Figure 41. Implications for centralizing, decentralizing or outsourcing procurement ............ 81
List of tables
Table 1. Clarification of 3PP types .......................................................................................... 37
Table 2. Specifications of conducted interviews ..................................................................... 39
Table 3. Specifications for Workshop participants .................................................................. 40
Table 4. Example of one 3PP product that has been productified 20 times in Ericsson. ....... 53
13
1. Introduction
In the following section, the thesis will introduce background information about the complex
term that is supply chain and specifically new technologies and trends that have caused its
evolution and revealed risks, that set up the following problem statement, purpose and research
question. Also, the thesis’ delimitation will be presented to allow a more elaborate discussion
with respect to the study’s time frame.
1.1 Background
With the rise of new technologies and processes, mostly as a following of interconnectivity,
Supply Chain Management and its definition has been subject to change. Generally, scholars
have defined it as an inclusion of coordination and integration of a cooperation between chain
members to move and transform material for a final customer (Sock & Boyer, 2009), however,
there are visible variations and different conceptualizations of the term in both academic and
practitioner communities (Mentzer et al., 2001; New, 1997; Tan, 2001). In their reach for a
consensus definition, Sock & Boyer (2009) have acknowledged best practices that have
contributed by creating a network of relationships and activities with the purpose of adding
value and maximizing profits through effectivization of the Supply Chain.
A paradigm that has grown and developed in parallel with the advancement of technology is
globalization, and more precisely, the pressure to globalize. The possibilities to gain economic
advantages, such as economies of scale, by expanding business can result in competitive
advantages substantial enough to make competition irrelevant, thus pushing other businesses
to improve their operations (Powell & Ghauri, 2008). However, firms are generally not strong
enough to satisfy the global market demand without damaging its profit margin, especially
when the competition is high, new entries in the market are common and the technologies are
constantly changing (Christopher, 2011). Because of globalization, the opportunity of
outsourcing has presented itself for several stages of the supply chain, including its downstream
part, in order to reduce costs and lead times by placing inventories closer to the customer and
therefore decentralize to gain flexibility (Mulay, 2013). Despite this, technology-intensive
firms often must deliver not only a product but a performance, local challenges found abroad
can obstruct the delivered performance (Alvizos & Angelis, 2012). Moreover, this might result
in firms underestimating the costs of outsourcing parts of the Supply Chain, partly in reason of
loss of quality and defective products. Hence, a firm might be exposed to a value/cost trade-
off. To not risk business continuity, firms must decide on a strategy that will result in as much
added value as possible with the goal of increasing its performance and of gaining an edge on
its competitors to not fall behind.
The trend of globalization has also meant the increase of risks, a consequence which has
resulted in the development of Supply Chain Risk Management (SCRM) (Wieland &
Wallenburg, 2012). This type of management deals with both common and exceptional risks,
with the purpose of reducing the vulnerability of discontinuity of the Supply Chain along with
several other uncertainties. To implement appropriate strategies to deal with each risk, SCRM
14
disposes of the advantages of data handling. Because the cost of storing data is lower than the
one of deleting it and that most interactions between parties can digitally be recorded, has led
firms to create large data pools for the data to be analyzed thanks to Data Science (Hurwitz et
al., 2013) and the process of Data Mining. A combination of these two fields has permitted to
improve promised performance to each customer and helps identify implications for potential
changes. Moreover, the data pools permit to search for ways to optimize the Supply Chain
without decreasing the added-value for customers but increasing it instead (Hofacker,
Malthouse and Sultan, 2016).
The three introductory paragraphs briefly mention relevant aspects to consider when attempting
to optimize a Supply Chain and are therefore utilized throughout the study.
1.2 Problem statement
In constant search for improvement through effectivization of their Supply Chain, firms are
dealing with the choice of centralizing or decentralizing processes. This choice can prove to be
critical as they both carry advantages and disadvantages and where a general answer for moving
purchasing upstream or downstream has not been given. A multinational firm must therefore
develop a strategy to evaluate its current supply chain to optimize its downstream part as much
as possible. In order to do so, there is a requirement of understanding customer needs through
data analysis and developing a way of selecting an appropriate strategy to modify the Supply
Chain accordingly.
1.3 Purpose
Firm-specifically, the purpose is to mine data to investigate if locally ordered third party
products (3PPs) can be replaced by parts found in the global portfolio and if other strategies
involving procurement and handling of 3PPs can be executed to the benefit of the firm. The
findings there will be utilized to fulfill a general purpose of investigating if a multinational
firm’s database along with qualitative data can be analyzed to potentially lead to a strategic
decision of centralization versus decentralization. The strategic selection will therefore aim to
find the advantages and disadvantages of decisions involving reallocating the process of
purchasing in a global Supply Chain.
1.4 Research Question
To guide the study towards field beneficent results, the thesis will attempt to answer the
following research question:
RQ: What are the implications of centralizing, decentralizing or outsourcing purchasing in a
global Supply Chain to cost-efficiently distribute products?

15
One can state that the research question aims to develop a framework based on literature and
empirics that, to some extent, can be utilized to deliver recommendations for the firm-specific
issue.
1.5 Delimitations & Directives
To best answer the research question, the thesis will delimit itself according to specifications
agreed on with the case company. In reason of the vast geographical presence of the case
company, the study will focus on the data gathered from nine customer units of the market area
of Europe and Latin America. The time frame in this master thesis would not allow for all
market areas to be analyzed. For the same reasons, analyzed data (internal Ericsson data) will
only be data from 2019. However, considerations will be taken to events of 2020 that can help
generate a more thorough discussion.
More specifically, Ericsson has asked for an as-is visualization of their current 3PP behavior,
therefore, there is a need to quantify the ordered 3PP from vendors in MELA and map it
according to the respective country. Out of this data, only the hardware stored and utilized in
the final offering for the customer must be filtered out and categorized to provide numbers on
how many items of each category exist and the quantity ordered. When properly categorized,
the list will have to be compared to Ericsson’s Global Portfolio where products of similar
function will be searched for. Parallelly to this data mining, different solutions to the current
way of ordering 3PPs need to be proposed and investigated. Thereafter, Ericsson wants to have
an aligned strategy on how to approach procurement and handling of 3PPs.

16
2. Literature Review and Theoretical Framework
In the following section, the reader will be presented with scientific information revolving
around the studied area. Firstly, a literature review, divided into two parts, will display current
knowledge in the field of data science and supply chain management. The later part will briefly
mention some aspects relating to strategy as it is the purpose of this study to develop one and
help provide the basis to answer the research question.
2.1 Data Science
Purpose of Data Science: As described in the background of this study, firms in almost every
industry are focusing on the gathering and exploiting of data in search of competitive
advantage. These premises combined with the advancement of technology, the worldwide
networking and new complex algorithms have led firms to put more efforts into data science.
Moreover, popular concepts such as Big Data and Data-driven decision making are closely
related to the field of Data Science. There is therefore a need to clearly explain the term by
reviewing its relationship with the other concepts and to better define it in order to answer the
research question in the most appropriate and precise manner possible.
In their article, Provost & Fawcett (2013) begin with comparing Data Science with another
close concept, the one of Data Mining that aims to find patterns in data with the purpose of
extracting valid and new information (Larose, 2015). However, Provost & Fawcett continue
by claiming that Data Science involves more than just data-mining and complex algorithms,
there is a requirement to identify business problems from a data perspective which also involves
a more intuitive approach. These eventually lead to improved decision-making. Thus, implying
that a simple understanding of fundamental concepts can help generate frameworks to organize
the data-analytic thinking, in order to permit smoother interactions, improvement of current
data-driven decision making, predicting competitive threats and most importantly increase
profit by increasing revenues and decreasing costs. Also, it is stated that managers should know
the basics in order to understand whether a data exploitation proposal makes sense, to know if
there is a strategic advantage. Conclusively, the authors state that if system thinking is applied
and core concepts understood, success in today’s data-oriented business environment can be
guaranteed as evidence suggests improved performance (Brynjolfsson, Hitt & Kim, 2011).
Data Science and Data Mining: A fundamental concept is the Cross Industry Standard
Process for Data Mining (CRISP-DM) model is described as flexible and easily customized by
IBM (2012) and is the most used analytics model. This customizability permits organizations
to create data mining models which are convenient for one’s needs, these can for instance be
visualization and data-exploration. Moreover, the model emphasizes a balance between human
intuition and need of data and breaks it down into six major phases, visible in figure 1, in order
to fit data mining into a problem-solving approach by a business.

17
Figure 1. Process diagram of CRISP-DM’s six major phases (IBM, 2012)
One can observe from the framework that movement between phases is free, both forwards and
backwards, and that is a general cyclic nature to data mining. The lastly mentioned observation
underlines that lessons from past projects can be utilized in search for amelioration, the same
is applicable for the phases inside (Larose, 2015). The first phase, business understanding, aims
to clearly establish both objectives and requirements to identify a data mining problem
formulation which leads to a preliminary strategy on reaching one’s goals. The second phase,
data understanding, involves collecting data, searching for initial insights by exploring it,
evaluating its quality and potentially selecting subsets to help find interesting patterns. The
third phase, data preparation, can be the most time-intensive phase where all data is prepared
for analysis with appropriate variables (which can be transformed) and finally cleaned. With
the raw data cleaned, the fourth phase of modelling can begin by applying selected modelling
techniques according to one’s goals. This phase can require one to go back to the previous
phase in order to get the appropriate data to optimize the results. Thereafter, the evaluation
phase can begin by testing the quality and effectiveness of delivered models by investigating
if the model delivers results that answer the initial problem formulation fully. Finally, the
deployment phase involves finding use for the created models by writing a report for instance.
Data Science Fundamental Concept: The model above leads to the second fundamental
concept which can be associated with the evaluation phase. In order to evaluate data science
results appropriately, there is a need to understand the context of its usage, thus referring to the
business and data understanding phases. More precisely, it is wishful to know in advance how
identified patterns are going to be used and how they compare to more intuitive approaches.
The third fundamental concept highlights the importance of identifying the business problems
and preparing probability estimations. These can help provide a broader and therefore more
anticipating analysis that can partly be based on expected outcomes. The fourth fundamental
concept specifies that segments of data can be useful to identify correlations within the large
body of data in order to reduce uncertainties about unknown quantities of interest, thus allowing
potential early predictions. The fifth fundamental concept revolves around computing
18
similarity. The sixth fundamental concept stresses the importance of avoiding overfitting
(generalizing an observation from one set of data and applying it to another without it necessary
being applicable, an overgeneralization). The seventh and last concept underlines that causal
conclusions must not be drawn without complete understanding of assumptions taken and
without identification of confounding factors, especially for regression analysis.
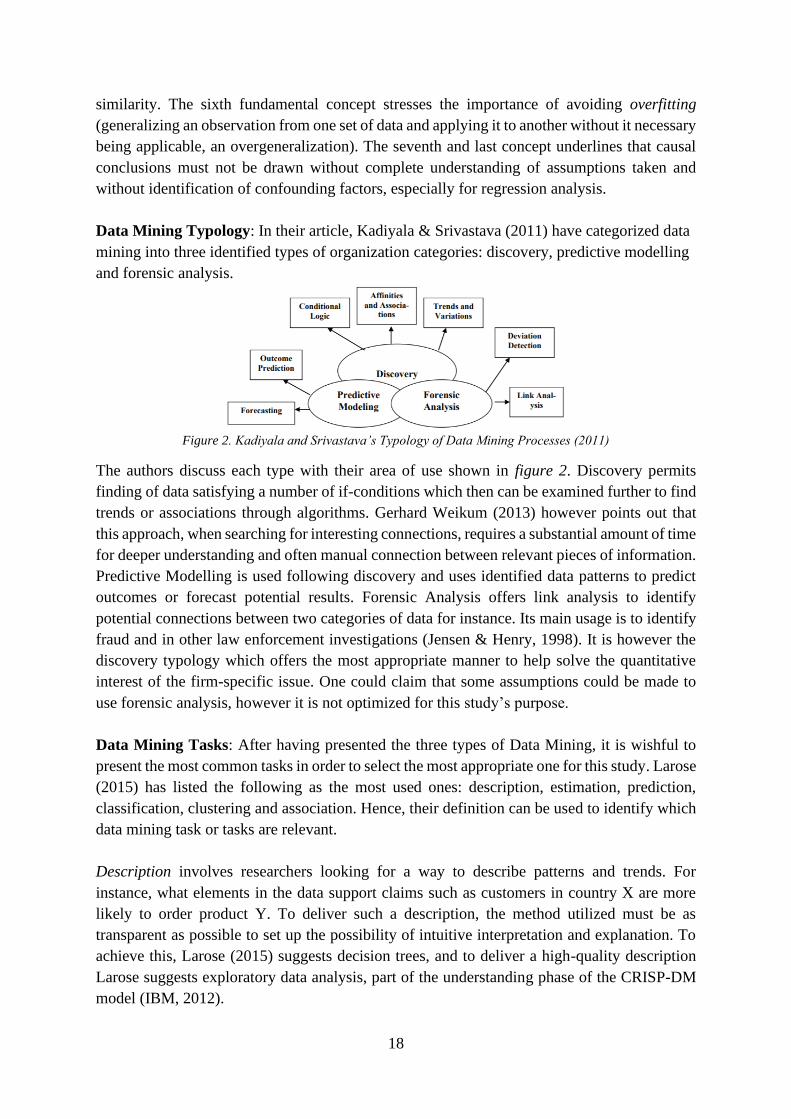
Data Mining Typology: In their article, Kadiyala & Srivastava (2011) have categorized data
mining into three identified types of organization categories: discovery, predictive modelling
and forensic analysis.
Figure 2. Kadiyala and Srivastava’s Typology of Data Mining Processes (2011)
The authors discuss each type with their area of use shown in figure 2. Discovery permits
finding of data satisfying a number of if-conditions which then can be examined further to find
trends or associations through algorithms. Gerhard Weikum (2013) however points out that
this approach, when searching for interesting connections, requires a substantial amount of time
for deeper understanding and often manual connection between relevant pieces of information.
Predictive Modelling is used following discovery and uses identified data patterns to predict
outcomes or forecast potential results. Forensic Analysis offers link analysis to identify
potential connections between two categories of data for instance. Its main usage is to identify
fraud and in other law enforcement investigations (Jensen & Henry, 1998). It is however the
discovery typology which offers the most appropriate manner to help solve the quantitative
interest of the firm-specific issue. One could claim that some assumptions could be made to
use forensic analysis, however it is not optimized for this study’s purpose.
Data Mining Tasks: After having presented the three types of Data Mining, it is wishful to
present the most common tasks in order to select the most appropriate one for this study. Larose
(2015) has listed the following as the most used ones: description, estimation, prediction,
classification, clustering and association. Hence, their definition can be used to identify which
data mining task or tasks are relevant.
Description involves researchers looking for a way to describe patterns and trends. For
instance, what elements in the data support claims such as customers in country X are more
likely to order product Y. To deliver such a description, the method utilized must be as
transparent as possible to set up the possibility of intuitive interpretation and explanation. To
achieve this, Larose (2015) suggests decision trees, and to deliver a high-quality description
Larose suggests exploratory data analysis, part of the understanding phase of the CRISP-DM
model (IBM, 2012).

19
Estimation aims to, as its name indicates, estimate a target value by utilizing numeric and/or
categorical predictor variables that are themselves provided from historical but general data -
“complete records”. This allows for a target value to be set, but which then can be estimated
again for new observations. An instance of this can be estimating the number of goals football
player X might score when playing team Y. This task enables multiple statistical methods such
as linear regression, correlation etc.
Prediction has common points with the two previous tasks, however, it differentiates itself
through the time situation of the results which are entirely in the future, thus the name of
prediction. An instance of prediction task can be when predicting a stock price, a year from
now. Therefore, methods used for description or estimation can also be used with prediction -
linear regression for example.
Classification resembles estimation but has a categorical target value instead of numeric to
permit a classification of the target value. It is in this task also based on predictor variables
(from historical data). It is highly useful when wanting to categorize data according to what is
called a training set - the classified historical data. The algorithm uses this training set as an
example for further classification and can determine which drug should be assigned to which
age group for instance, based on the gathered data of what drug people of all ages use.
Clustering groups observations, records or cases into segments of similar objects. This
definition resembles the one of classification, however, clustering does not have a target value,
nor does it try to predict one. Instead, historical data is used by the algorithm to segment data
according to records into clusters where it attempts to maximize homogeneity. This task is
often performed as a first step to arrange the data somewhat in the data mining process.
Association involves the search for compatible attributes, which of them “go together”? This
is therefore an attempt of investigating if the relationship between a certain number of attributes
is quantifiable. The task revolves around multiple if- and then- statements as a combination.
Data Mining and Supply Chain: To utilize data mining in Supply Chain Management, one
must first understand its use by asking questions such as what, when or how? A Supply Chain
contains physical, financial and information flows, three great sources of data when wanting to
organize, plan or implement changes within these flows in order to ensure quality (He et al.,
2015). Moreover, the key reason for applying data mining is because of the numerous
uncertainties that can be found in the Supply Chain. For the case studied in this thesis, one can
notice that the reason that 3PPs exist partially depends on the variation in demand, not in
numbers, but in specification with different lengths of cable for instance (see pre-study). An
area where data mining becomes useful, in relation to this case, is in identifying the products
for mass customization. It is usually used to discover patterns that can permit unique customer
orders from a significant number of products and aims to keep inventory of components at the
lowest possible level. In the study’s case, customized products ordered by the customer would

20
similarly have to be identified to extract the 3PPs and compare them with the global portfolio
in order to minimize product numbers by reducing orders of duplicates.
2.2 Supply Chain and Management
Definitions: As stated in the background of this thesis, firms are experiencing new forms of
competitive threats due to globalization and have to find ways of becoming better, faster and
cheaper (Powell & Gauri, 2008). However, to fully grasp the study of this thesis, and to
complement the presentation of the evolution of the definition of SCM, one must become
familiarized with the term Supply Chain. Its first usage tracks back to Banbury (1975) and was
short but concisely described as a chain of supply-related activities that have several functions
and often several organizations. The Supply Chain can therefore be categorized into two parts
that share many dissimilarities depending on the observed Supply Chain. The first part is the
upstream where the organization can be linked with raw materials and parts suppliers, whereas
the second part is the downstream where there are links to deliverers and customers for
instance. These are both observable when looking at the external part of the Supply Chain,
however, the internal Supply Chain contains activities such as procurement, production,
logistics and sales that can be considered as the motion setters of activities between external
entities (Nakano, 2020). This explanation can be compared to Porter’s (1985) generic value
chain below:
Figure 3. Porter’s generic value chain (1985)
One can observe in figure 3 that Porter has generalized the supply chain into activities that
create value for the customer and the customer. These are also separated into primary activities
that are supported by, as the name suggests, the support activities. There is therefore a
resemblance to the general explanation by Nakano (2020) where Porter (1985) motivates the
unicity of each Supply Chain as an attempt of distinguishing themselves to gain a competitive
advantage by creating more added value.

21
Management of costs: With the problem statement in mind, the purpose of this study and the
observations above, one can highlight the activities of procurement, logistics and the
management that comes with them, both part of the overall Supply Chain Management.
Firstly, procurement management is needed by all organizations that acquire goods and
services from another organization. When these purchases are made, firms are looking for cost
beneficial solutions compared to if the same activity was performed in-house or if the same
offering is available from different organizations. There is therefore interest in performing cost-
utility analysis to evaluate each possibility to best benefit the organization (Van Weele, 2018).
Here, the differences between procurement and purchasing must be emphasized to avoid
confusion during the rest of this thesis. Procurement can be divided into two phases, pre-
purchase and during purchase (Moncza et al., 2015). In the pre-purchase, procurement implies
the identification and definition of an organization’s needs, the research for potential suppliers
and their solutions, and the evaluations of the options available to help the firm gain a
competitive advantage. During the purchase, procurement involves the negotiations with the
chosen supplier, the creation of a purchase order and living up to the agreements made. Over
time, procurement will involve interactions with the same or other suppliers to investigate if
more value can be added. With procurement defined, it is possible to define purchasing by
going in deeper in the during purchase phase where specific actions can be attributed to
purchasing. These are: the pricing and terms negotiations with the suppliers, the actions
involved for a purchase order and the payment. The mentioned processes ensure that the
business can act as a reliable and sustainable customer that can ultimately create an
advantageous situation for all parties involved. Vendors will value the reliability from the
customer which increases the likelihood of them providing quality offering and of them
accepting leeway because of demand fluctuations.
Secondly, logistics management makes sure that links between processes to meet customer
demand exist and are as cost efficient and value-adding as possible (Sople, 2009; Nakano,
2020). This type of management aims to see logistics as an opportunity of value creation instead
of a cost center. Logistics is a broad activity, however, it is outbound (downstream) logistics
which is of interest in this study with the aspects of warehousing, transportation and inventory
management. Inventory Management aims to keep inventory as low as possible without it
hindering to meet customer requirements and demand, firms face the challenge to satisfy
customers while attempting to keep costs as low as possible, a difficult balance to find. This
balance is especially complicated when firms are following Just In Time (JIT) principles that
operate with a zero-inventory level, a high level of communication and visibility are mandatory
in the whole supply chain. Warehousing management is often the most considered, in reason
of it being a high cost center, important decisions need to be taken about number, location, size,
layout, design and ownership. All options have different advantages and disadvantages that
need to be considered, these can notably impact lead time and therefore have significant impact
on not only customer satisfaction but also on costs. Transportation management is critical
because the transaction cannot be completed until the physical arrival of the offering at the
customer’s location or pick up point. The means by which these transports occur can vary and
are highly important when considering both lead time and costs, sometimes the urgency of the

22
goods is chosen over the cost. The choice of transportation has therefore several criteria to
respect, but attention must also be paid to infrastructures available for wished routes. Moreover,
firms must also consider if the transportation should be outsourced which is often the case in
reason of operating costs and expertise, the outsourced delivery becomes more reliable.
Moving purchasing: As aforementioned, Supply Chain Management attaches more and more
importance to the utilized suppliers. The current paradigm of Integrated Supply Chain
Management consists of a more cooperative approach with suppliers rather than an adversarial
one (Moncza et al., 2015). This has resulted from an outside pressure by not only global
competition but also from the rapidly changing technologies and expectations by customers.
Moreover, purchasing has therefore become more and more integrated with primary activities
in the Supply Chain to align customer requirements, leading to a more centralized approach
with coordination of the primary activities to enhance performance. The purpose is to be able
to differentiate oneself to permit a customized offering for several customers, which in turn
requires an alignment from all participants in terms of goals, objectives and incentives (Gibson
et al. 2013).
Figure 4. Stages to integrate the Supply Chain (Stevens, 1989)
Zooming in on Integrated Supply Chain Management (see figure 4) and when investigating the
impacts of purchasing movement, one must consider the concept of Vendor Managed Inventory
(VMI). VMI is the process of giving responsibility of inventory replenishment to a supplier
(Nakano, 2020). As opposed to traditional inventory management where the buyer determines
23
the order size, the vendor takes over that responsibility and therefore the charge of the original
buyer’s ordering cost. Moreover, this practice relies on creating a win-win situation where the
supplier takes over the buyers holding costs and can flexibly prevent stockouts (Gibson et al.,
2013) while the suppliers can increase their revenues by securing a contract, by adjusting order
sizes and achieving to reduce their risk. However, this buyer-supplier cooperation is a
relationship which necessitates a high trust in reason of the supplier getting access to critical
data from the buyer firm (Sadeghi, Mousavi & Niaki, 2016). Furthermore, VMI has been
proven to decrease the possible magnitude from the bullwhip effect phenomenon (Disney &
Towill, 2003). This effect can be explained as a result of variation in demand which forecasts
cannot predict accurately enough because of lack of transparency or visibility in the Supply
Chain, resulting in Supply Chain inefficiencies, where the amplitude of inefficiency increases
as one moves upstream from the customer order and the forecast accuracy decreases. These
inaccurate forecasts are then communicated to suppliers who transmit these inaccuracies to
their suppliers, ultimately leading to fluctuations in inventory compared to what is required.
If the responsibility of purchasing is to be moved to a central supplier, one must know the pros
and cons of single sourcing versus multi-sourcing. Single sourcing signifies that demand for
an item or service is provided by one single supplier, whereas multi-sourcing satisfies this
demand through use of multiple suppliers (Bhattacharya, Gupta & Hasija, 2018). The decision
between models can impact the complexity of the procurement process as it increases with the
number of suppliers (Don, 2014). Moreover, sourcing decisions can impact the relationships
with the one or numerous suppliers. While trust, confidentiality and economies of scale can be
gained with single sourcing, multi-sourcing offers the possibility to utilize competitiveness
between suppliers who have to fight for their share of the contract, and thus creating a more
advantageous negotiation position (van Weele, 2018). Moreover, each supplier often possesses
specific knowledge that can be transferred for further sourcing decisions and if one supplier
fails others may fill the demand hole (Norrman & Jansson, 2004). However, it might be difficult
to motivate various suppliers to update their processes if a contract is not substantial enough,
the complexity of communication to these various suppliers also increases with the amount of
suppliers involved which minimizes contact and hinders the motivation for increased
commitment to supply.

24
Figure 5. Single vs. Multi-Sourcing (Angelis, 2018)
While figure 5 summarizes notable advantages and disadvantages with each mode, one must
consider some conclusions found in Bhattacharya, Gupta & Hasija’s (2018) study. Their
comparison of sourcing methods revealed that multi-sourcing dominates single-sourcing in
terms of performance when project revenue tasks are modular. Nevertheless, when tasks
instead are integrated, the choice of sourcing mode becomes more difficult. When project
revenue was aligned with performance, firms preferred single sourcing in reason of the lower
moral hazard - the risk is shared - than moral sourcing. Oppositely, multi-sourcing is more
interesting when there are so called interdependence costs, because vendors want to avoid risk,
meaning a lower risk for the buyer as well in reason of the supply being less vulnerable to
disruption.
2.3 Strategy in Supply Chain Management
In reason of the thesis’ goal of developing a recommended strategy for the firm-specific issue,
there is a need to include theory on how to formulate a Supply Chain strategy, as well as a
multitude of strategies that are relevant for the study and the coming business introduction.
Some of these strategies have already been addressed in the previous subchapter but not all that
are relevant to the study’s scope and research question.
Strategy formulation: It is essential for a firm that wishes to set up a Supply Chain strategy
which can be applied in the whole design of the network in order to fulfil customer demand
(Nakano, 2020). Moreover, the specific demand or requirements by customers are what impacts
the chosen strategy and what the Supply Chain is going to look like. Hence, and as Galbraith
(2014) underlines, strategy becomes important as it not only consists of what a firm is going to
do, but also what it is not going to do in reason of limited resources.
Figure 6. Steps in strategic planning (Nakano, 2020)

25
Figure 6 summarizes the steps for strategic planning according to Barney (2002) who
highlights the three levels of management strategy. Firstly, corporate strategy is explained to
be all actions taken simultaneously, in several businesses, that aim to gain a competitive
advantage. Secondly, as opposed to corporate strategy, business strategy only aims to gain
competitive advantage in one single business. Thirdly, functional strategy consists of the
operative direction taken for all functions as a consequence of chosen business strategy. Supply
Chain strategy is integrated across several of these functions with notably the aforementioned
logistics, procurement etc. and is therefore positioned in the final level. This last observation
highlights the challenge of aligning the competitive business strategy with the Supply Chain
one, a challenge that needs to be overcome if firms want to identify the required responsiveness
that their Supply Chain must have to handle various parameters (Chopra & Meindl, 2013).
These parameters include fluctuation in demand, other uncertainties, the wanted lead time
which is usually set to be as short as possible etc. All of this should be thought of combined
with Porter’s (1985) initial indication that Supply Chains should strive for differentiation.
Postponement: Postponement, in Supply Chain Management, is a strategy that has recently
become more popular because of customer demand on responsiveness, and which can be found
in Ericsson’s Supply Chain. This concept implies that the activity of customization is placed
as late in the Supply Chain and as close to the customer as possible to allow the modification,
specification and personalization of the final offering to add as much value as possible while
adding flexibility as well (Zinn & Bowersox, 1988). This strategy also contributes to minimize
risk by not making unnecessary investments and reduces lead time between the customization
activity and the customer (Ferreira, Thomas & Alcântara, 2015) which enables economies of
scale and economies of scope. In short, postponement can involve having semi-finished
products (work-in-progress, WIP) as close to the customer as possible to quickly deliver a
customized offering and achieving organization flexibility. Postponement therefore requires
the offering to share a product family containing common parts and processes before the point
of customization.
Postponement can be segmented into four strategies: pull postponement, logistics
postponement, form postponement and price postponement, where the first three mentioned
also have been referred to as production postponement (van Mieghem & Dada, 1999). A
popularly used strategy is logistics postponement which takes form, time and place into
consideration by positioning inventories upstream or downstream. It can be considered as an
extension of pull postponement which refers to the movement of a decoupling point of push
and pull manufacturing strategies earlier in the Supply Chain with the purpose of reducing the
need of following forecasts. Hence, these strategies can be complementary to one another as
well as partly applied (Ferreira, Thomas & Alcântara, 2015).
The advantages of postponement are increased quality and responsiveness, reduced costs and
inventory (Cheng, Wan & Wang, 2010). Moreover, WIP inventories means that less capital is
tied compared to if the same number of finished products were stored. Also, if pull
postponement is used, forecasting becomes easier as it is not needed as much while the demand

26
variability is reduced. It therefore supports various production alternatives such as make to
order, engineer to order etc. which reflects a characteristic of modularity which in turn allows
the possibility and opportunity of outsourcing with the example of third-party logistics (3PL).
Parallelly, postponement also has its disadvantages. Having semi-finished products can
increase variable costs in production because the WIP needs to be compatible with the
variations that the customer might want (the customizations). However, these variations of cost
can be reduced by moving the assembly process to local warehouses/facilities which instead
increase transportation, setup, training and local material costs. There is therefore a trade-off,
especially visible in logistics postponement, to be made between customization, implying
higher customer values, and mass production which leads to economies of scale.
Outsourcing: This literature review has already addressed the advantages and disadvantages
of single versus multi-sourcing, nevertheless, the concept of outsourcing needs to be reviewed
as some activities are sometimes better to be performed in-house. This aspect is relevant
because it is common for firms to outsource transportation and installation to 3PLs, and because
of the question if the purchasing and possibly procurement should be outsourced to them as
well. This inquiry follows Marshall, McIvor & Lamming’s (2007) observation of outsourcing
moving from non-business critical activities such as cleaning or catering to business and Supply
Chain critical activities such as design, logistics, HR etc. One must therefore review the
advantages and disadvantages of such actions.
A first reason why outsourcing costs, in general, often can be underestimated is brought up in
Platts & Song’s (2010) article about sourcing from China. The authors state that it is
understandable that firms outsource to China because of the cheap labor cost in order to
increase profit. However, their findings suggest that the estimated savings are often overvalued,
additional costs always appear. These take the form of loss of efficiency, loss of quality with
increased defective products, new shipping costs and set-up costs. Moreover, gains in
efficiency can also be difficult to make in reason of the culture difference, relationships with
workers, or with local suppliers adding up in the list of challenges. Along with this goes the
highly increased uncertainty that comes with the Chinese government and the local currency.
These are only a few examples that must be considered before sourcing not only from China
but from any other country globally. If one therefore wishes to outsource, one can utilize Platts
& Song’s framework (See Appendix A).
Secondly, procurement outsourcing, also referred to as indirect procurement, must be reviewed
because of its mentioning in the research question. This action could be categorized as
transformational outsourcing as it focuses on creating a win-win relationship between suppliers
and buyers. Motivation for such a strategy comes in the form of increased performance,
reduction of operational and administrative costs (Brewer, Ashenbaum & Carter, 2013; Favre,
Findlay & Zanker, 2003). Another benefit that can be listed is that assets would be freed up
and potentially utilized on other core activities while expertise would be shared and flexibility
increased. However, the procurement outsourcing would reduce supply-base visibility which
could lead to the suppliers sourcing illegal parts, prioritizing certain suppliers or enable
overbilling (Amaral, Billington & Tsay, 2006). This highlights the challenge of becoming too

27
dependent on the outsourced buyer who along with the challenge can lose control of the
suppliers’ performance, involved costs and instead drag legal issues with them (Parry, James-
Moore & Graves, 2006). The lastly mentioned study reflects the quantity firms have to put on
investigating laws locally for every country where sourcing is involved.
Ultimately, because of the mentioned differences between the terms purchasing and
procurement (Moncza et al., 2015), outsourced purchasing must be reviewed as well. Hence,
the difference with outsourcing procurement would be that suppliers would still be selected by
the initial buyer while the outsourced supplier would make orders, payments and negotiate
prices. This study investigates the potential scenario of outsourcing 3PPs which resembles
Yang, Zhang and Zhu’s (2017) research on if the procurement function should be outsourced
along with production - a similar case but situated in the upstream part of the Supply Chain.
The study indicates that by identifying suppliers through procurement ensures quality inputs
but increases overhead costs involved for bargaining, administration and logistics. Solely
outsourcing purchasing would therefore lead to firms wanting to outsource procurement as
well. These premises combined with a potential increase in trust of the outsourced buyer may
lead to outsourcing the procurement function as well. Moreover, the mentioned trust can often
be tracked to a “favorite supplier” which gains responsibility which, through numerous
examples, leads to a loss of quality especially when demand uncertainty is high. There is
therefore a big importance to be made on how to formulate a contract to avoid losing quality
when outsourcing procurement and purchasing. Inclusion of an inspection schedule is a
suggestion made to resolve the loss of quality issue, however control over visibility remains an
issue.
Centralization vs. Decentralization: A recurrent observation in this literature review is that
several management areas or identified strategies either suggest a centralization or
decentralization of functions in the type Supply Chain. The closest to this choice the literature
has yet to review is whether to outsource procurement/purchasing or not. However, one could
observe literature on centralization versus decentralization in other areas, such as politics or
distribution in the Supply Chain, and compare observations and patterns to the literature above.
Thus, an aligning framework can be developed to best evaluate centralization vs.
decentralization of procurement according to the study’s three scenarios.
When discussing the choice between centralization and decentralization in Supply Chain, one
must understand that both strategies aim to fulfil customer satisfaction by changing parameters
of processes but also by balancing the trade-off that can occur between cost and service levels
(Bendoly et al., 2006). In a political context, centralization vs. decentralization signifies a
division of power (Minas & Overby, 2010) where a typical example can be found in the United
States where each state can to some extent regulate its own laws, with the legalization of
cannabis, a local adjustment according to the choice of inhabitants, whereas national decisions
occur centrally such as currency. This decentralization from Washington D.C. is done to allow
continuous processes to be made slowly and to better adapt changes to local needs. However,
the decentralization trend has lost some of its movements, partially in reason of political
ideologies but also because a more centralized steering would notably allow cost-cutting and
28
performance assessments (Minas, Wright & Van Berkel, 2012). Moreover, some aspects such
as a standardized healthcare system require central steering to align coherence, accountability
and equal treatment. Therefore, the domain of politics does not have an answer of appropriate
strategy, both have their advantages and disadvantages.
Oppositely, Schmitt et al. (2014) have demonstrated an answer when considering risk pooling
and risk diversification. In their study, they have investigated the risk of placing inventory in
one central warehouse or to have it in multiple warehouses - reflecting two potential outcomes
of strategies that this thesis might lead to. Their findings show that if supply disruption occurs,
then it is more advisable to have a decentralized system as losses will not be everywhere,
especially when disruption and demand uncertainty are present. However, exceptions exist
when the firm is neutral to risk, the service level is low and has a system that works reliably.
Bendoly et al. (2006) reached similar conclusions in their specific context but while
highlighting that decentralization complicates relationships despite its cost benefits.
In distribution, the movement of products from supplier to customer, the major reason for not
choosing a centralized system is the longer lead time associated with the longer distance to
travel and which results in a higher cost of shipping and therefore often increases the buyer’s
price to pay. Adenso-Díaz, Lozano & Moreno (2016) have in their research identified
advantages and disadvantages when choosing centralization or decentralization. Despite the
increased lead time, centralization offers lowered fixed costs. However, the authors do not
recommend to only have one centralized structure as it has shown higher total costs than having
two, instead, firms should opt for a degree of centralization to benefit from both centralized
and decentralized aspects. A firm can therefore reduce its warehouses while still having local
exposure, reduced transportation cost and a determined lead time to reach the customer. The
authors have by so also highlighted the better service level that can be offered in a decentralized
system which complies with the other mentioned areas in this literature review.
Network design: To get an understanding of strengths and weaknesses of centralization vs.
decentralization of purchasing, there is a need to understand network design, especially
distribution in reason of this study’s research question. The following sub-section will thus
identify critical aspects of distribution design based on previously mentioned factors such as
costs, performance and information utilizing two frameworks by Chopra (2003). Moreover,
network design’s importance is substantial because of its impacts on revenue and costs and
hence determining the profitability of a company.
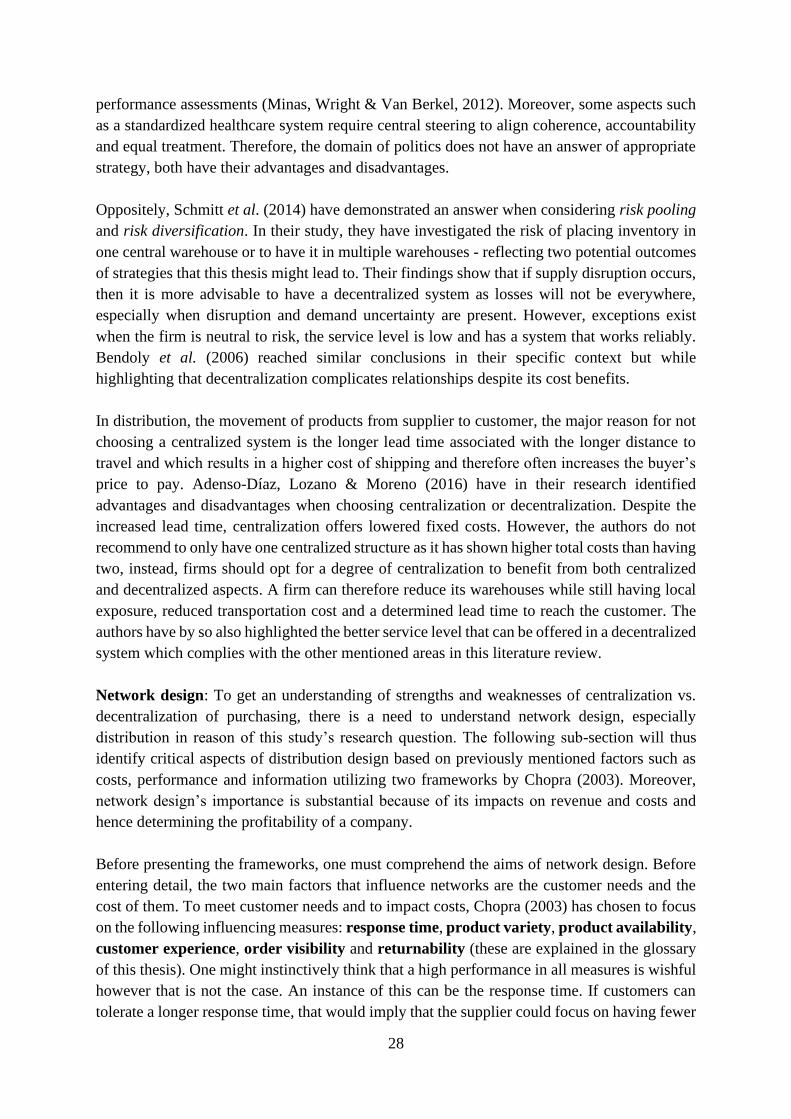
Before presenting the frameworks, one must comprehend the aims of network design. Before
entering detail, the two main factors that influence networks are the customer needs and the
cost of them. To meet customer needs and to impact costs, Chopra (2003) has chosen to focus
on the following influencing measures: response time, product variety, product availability,
customer experience, order visibility and returnability (these are explained in the glossary
of this thesis). One might instinctively think that a high performance in all measures is wishful
however that is not the case. An instance of this can be the response time. If customers can
tolerate a longer response time, that would imply that the supplier could focus on having fewer
29
storage facilities close to the customer and instead have high capacities in locations far away
from the customers. Moreover, such a strategy would impact inventory, transportation,
information facilities and handling costs. To analyze changes of mentioned criteria, the authors
have chosen network designs originating from answers of the questions on the location of the
point of delivery and if the product flow passes through an intermediate location. These designs
are classified as follows: manufacturer storage with direct shipping, manufacturer storage with
direct shipping and in-transit merge, distributor storage with package carrier delivery,
distributor storage with last mile delivery, manufacturer/distributor storage with customer
pickup and retail storage with customer pickup.
Figure 7. Framework for selecting a delivery network design based on performance in ten measures (Chopra,
2003)
Figure 8. Framework for selecting a delivery network design based on performance for different characteristics
(Chopra, 2003)
Figure 7 uses a comparative grading system based on the performance of the previously
mentioned ten measures, where 1 corresponds to the strongest performance while 6 represents
the weakest performance. Figure 8 has a similar approach but displays how compatible network
designs performances are with various characteristics that are of relevance when taking
customer preference and customer behavior into consideration.

30
Chopra & Meindl (2013) have in their book about Supply Chain Management discussed a
variety of factors that influence network design decisions. The authors firstly mention the
strategic factors such as a firm’s competitive strategy where cost leadership often is followed
by utilizing low-cost countries for manufacturing for instance. However, a firm can also opt
for a high cost location if it aims to have better responsiveness by being closer to the market.
A multinational firm can utilize its financial advantage and locate itself in multiple countries
to benefit from the advantages of producing large standardized quantities for a low price in a
low-cost country, whereas the fewer but more expensive parts/products of higher quality would
be produced in a more expensive country. The authors also mention technological,
macroeconomic, political, infrastructure and competitive factors. These factors have already
been addressed, but what can complement it is the tariffs and tax incentives. Costs of moving
products over borders can be high and must be taken into consideration, instead, some countries
have tax incentives which are a reduction in taxes to attract companies.
Capacity allocation: A study that has historical relevance to this thesis is the article by
Norrman & Jansson (2004) on how Ericsson handled its Supply Chain Management after a
serious accident. The study is introduced by pointing out that firms increase their vulnerability
to risk when following trends such as outsourcing, globalization, reduced buffers, capacity
limitation of the most important components etc. Some of these risks can come in the form of
natural catastrophes, diseases, fires, or mistakes made in the Supply Chain coupled with
uncertain demand. At the time of the article, Ericsson used to be the biggest player in supplying
mobile telecom systems in the world. A notable event which jeopardized this position was the
Albuquerque accident on the 18th of March 2000 which resulted in a significant issue for
Ericsson. The fire accident was caused by lightning but was very minor since it only was in a
room fitting ten people, however, despite the small room, the whole inventory of chips required
by Ericsson were corrupted. Ericsson’s financial report of 2001 shows a loss of approximately
400 million dollars, mostly because production stopped for three weeks and that the plant was
Ericsson’s only source for supply of the radio-frequency chips. After several months, the yield
from the factory was still insufficient compared to what it was and to what was demanded from
Ericsson, and led to the company failing to deliver phones during a critical time in the market.
On top of this, Ericsson failed to get other suppliers, Nokia were quicker, thus highlighting the
importance of allocating production in several areas or to have relationships with different
suppliers. Otherwise the risk for disruption becomes too significant. The loss caused Ericsson
to partner up with Sony to save its mobile business but eventually led the firm to abandon it.
To evaluate a distribution network design, this study has made alterations and extensions to
Chopra’s (2003) framework to better suit the research question and better respond to firm
directives.

31
Figure 9. Framework to evaluate a distribution network based on performance
Figure 9 can be utilized to evaluate a distribution network design with help of KPIs but where
the range could be altered instead of using Chopra’s (2003) of 1 to 6 where the lower number
represents the strongest performance and the bigger number the weakest, an opposite approach
could also be opted for. The extensions made to the original framework is the addition of
“Carbon Footprint” and “Disruption Handling”. The firstly mentioned complements the
transportation aspect which is not the only source of greenhouse gas emissions, the majority of
it originates from the production/manufacturing part of the Supply Chain. This point is relevant
because of the ethical considerations taken during this study, Ericsson states in its Business
Code of Ethics a strive for sustainable development. Also, there are laws revolving emissions
that firms need to respect. The secondly mentioned aspect reflects how vulnerable a distribution
network is to disruption and how fast the Supply Chain members can help react to such a
disruption, this could also be seen as a risk vulnerability measurement.

32
3. Method
This section describes the applied methodology to collect and analyze study-relevant data. In
order to benefit this approach, a pre-research methodology has been carried out to gain firm-
specific knowledge to better understand the context of the study, and to best set up the complex
multimethods approach in the data collection part. The data analysis is also described and
ultimately, this section will reflect on the thesis’ reliability, validity and ethical considerations.
3.1 Pre-research/Pre-study
To carry out this study, the thesis revolves around a company-specific problem, this premise
allows the thesis to utilize practical observations for an empirical section that can be combined
with theories found in previous studies. However, in order to formulate initial adequate
research, whether it is qualitative or quantitative, there is a need to conduct numerous short
meetings with multiple members of the Supply Chain Management, at the case company (see
Appendix B), to grasp the current organization and provide a simplified visualization of the
current Supply Chain. Thus, describing a present state that can be compared to a wishful future
one. In reason of remarks made by Tranfield, Denyer and Smart (2003), there is a need of
eliminating bias to ameliorate rigor in the field of Industrial Management. Therefore, similar
to their systematic literature review approach, a systematic approach following guidelines
made by Uwe Flick (2014) combined with Research Methods for Business Students (Saunders,
Lewis and Thornhill, 2009) is followed. Thus, meetings with a semi-structured approach are
carried out to allow more open-ended discussion instead of solution-seeking questions resulting
in biased answers and explanations. Ultimately, this permits the design of necessary
visualization of the organization and Supply Chain presented in a chapter called Business
Introduction, understanding the problem, narrowing down the scope and formulation of the
thesis’ problematization, purpose and thus forming the pre-study of this thesis.
3.2 Research design
As stated in the previous section, the study will centralize a firm-specific issue, with a real-life
context, put into an academic context and therefore become a single case study. Moreover, the
research approach will contain empirics, a literature review and use multiple theoretical
frameworks. Eisenhardt’s (1989) abductive approach emphasizes the importance of revising
field-knowledge continuously in order to fully understand existing theory and permit flexibility
to adjust, thus avoiding weaknesses that come with a deductive or inductive approach. This
design leads to the purpose of the study where the exploratory research activity is chosen to
identify the current situation, through the aforementioned pre-study, to gain new insights in
order to ask new questions and qualitatively search for new knowledge within Supply Chain
Management, rather than investigating hypotheses (Baxter & Jack, 2008). However, a business
introduction will be presented as a basis of the study to optimize the Supply Chain which will
be iterated inductively. In this case, the exploratory approach is relevant in reason of the little
existing research of the subject within the field. Despite Baxter & Jack (2008) indicating that
case studies best answer research questions starting with “how” or “why”, the thesis’ research

33
question has a “what-question” with goals of best providing recommendations for the firm
specific problem as well as providing new findings to research. These premises initiate a gap-
spotting method in order to generate this study’s research question while taking consideration
of one’s familiar position in order to reduce initial bias (Alvesson & Sandberg, 2011). Also, a
case study allows the thesis to provide an in-depth and holistic view of the firm-specific issue
and by so, allowing a qualitative method to provide both objective and subjective information
that can enable a specific understanding of the subject (Gephart & Rynes, 2004). However, to
fulfill the firm directives, there is a need of including quantitative data to strengthen potential
claims made further in the study in order to develop a critical and well-investigated conclusion
that can converge into a solution which would answer the research question. This suggestion
is made by Baxter & Jack (2008) in spite of their constructivist viewpoint, that the truth depends
on the people’s perspective. Moreover, the single case study approach does not suffice to
provide a statistical generalization, but the focus permits an analytical generalization thanks to
analysis and discussion of the results’ applicability on other cases. Hence, to answer the thesis’
research question, the thesis will use a mixed methods approach to benefit from the advantages
of both qualitative and quantitative methods (Saunders et al., 2012).
Figure 10. The study’s research design
Figure 10 above, summarizes the research design, showing the performed methodological
activities with time, starting with a pre-study which permitted the drawing of scenarios and
determined the scope of the thesis, which in turn led to guidelines to follow for the gathering
of Internal Ericsson Data and the reviewing of literature. The literature was utilized to better

34
understand observations made during the workshop with Next Generation Supply Chain and
formulate questions for interviews. The figure also displays the transition between data
collection and data analysis. In spite of this, there is a missing activity that is the continuous
writing of the thesis, performed not only in reason of the time frame, but also because it enables
a constant iteration of thoughts to question oneself, results and conclusions (Ely et al., 2005).
Moreover, Figure 10 indicates the use of Internal Ericsson Data which refers to the
aforementioned quantitative data that will permit to fulfil directives from the case company.
Also, this data will contribute to deliver an As-Is State, corresponding to the as-is visualization
demanded by the case company, and will help in generating a To-be State, which will provide
recommendations for the case company that can ultimately lead to a general strategy and
therefore to a conclusion to the thesis’ research question. This To-be-State will also be
generated thanks to a developed framework and other qualitative analysis, these are described
in detail in the Data Analysis section.
3.3 Data Collection This subchapter will explain how each part of the data collection was conducted. These are the
single case study, the literature review, a benchmark analysis, the quantitative data of
Ericsson, interviews and a workshop.
3.3.1 Single Case Study
As stated in the research design of this thesis, this thesis is going to use a single case study as
the basis for theory as it provides an in-depth and holistic view of a firm-specific issue (Yin,
2003). Thus, the thesis can utilize real-life events that can offer a complete picture which
facilitates conducting of the planned method combination, composed of both data analytics,
literature review and empirics in the form of interviews.
The case was provided by Ericsson AB, from their Group Supply in Kista. Because of
numerous internally used terms, the specifications of the case were too complex to fully
understand in the early parts of the study. Therefore, a search for information about the Group
Supply, the unit for Supply Chain, was effectuated in the pre-study. Consequently, the unit of
analysis for the pre-study were the main responsibles in the Supply Chain department in Kista,
see Appendix B, which could provide specific explanations to understand Ericsson and its
Supply Chain Management. When a clearer understanding of the organization and of its
expressions had been gained, the case of investigating 3PP ordering behavior and of movement
of purchasing was introduced, with a search for an optimal strategy of either centralization,
decentralization or outsourcing. The company’s supervisor for this thesis, Magnus Dahlin,
Head of MELA Supply, explained that the study would require quantitative data analysis
through Ericsson’s software as well as discussions and interviews with various people in the
organization. Thus, one could identify the case study to be an embedded one (Yin, 2003) as it
contains multiple units of analysis between the various functions in the case company. These
are notably Ericsson’s Master Data to receive clarification and help with the quantitative
approach of the thesis, while the quantitative approach will focus on contributions from
individuals in the organization with a majority coming from the Supply Chain Department.

35
Further limitations listed in the early parts of this thesis, were mutually agreed on to respect the
time frame set by the Royal Institute of Technology, KTH.
There is therefore an in-depth examination of a part of Ericsson’s Supply Chain to help them
with expressed wishes, and to along the process, discuss results to contribute to new research
and thus search for a generalization applicable for a different setting.
3.3.2 Literature Review
One of the most critical aspects of this thesis is to conduct an extensive literature review in
order to gain a deeper understanding of the field of Supply Chain Management. This approach
provides a theoretical foundation in order to analyze collected empirical data that will lead to,
as described in the research design, to an as-is state and a to-be state that will enable discussion
and help reach key conclusions.
Due to the research question and purpose of the study, the literature review was made in two
phases to separate the research. However, despite the research involving different fields,
potential correlation or links between articles were not ignored. Thus, the study has utilized
secondary sources such as published articles and books, other master theses, reports from the
case company and other organizations with validated and verified data. There is therefore a
vast majority of academic data sources. The academic theories provide more theoretical
information such as frameworks, while non-academic studies are included to display practical
implications, or to demonstrate that existing theories are being followed and are potential
solutions, utilized by consultancy firms or published in the news.
While the studies and other information from the case company were gained access to from
supervisor or to specific responsible person, the research for theoretical information was carried
out by conducting a systematic literature review following the framework by Tranfield, Denyer
& Smart (2003).
Figure 11. The three stages of a systematic literature review (Tranfield, Denyer & Smart, 2003)

36
The purpose of this framework is to efficiently find literature by adopting a replicable, scientific
and transparent approach, which eliminates bias and that in the end can be beneficial to advance
knowledge in the selected field. Additionally, the framework along with the research question
and made pre-study, it is possible to identify field-specific keywords to limit the scope of the
research and filter away articles of undesirable relevance while keeping ones of quality (see
Appendix C). Moreover, the data was collected through numerous databases, mostly KTH
Primo and Google Scholar. The approach taken can be traced in Appendix C, with selected
keywords, where only articles referred to in the thesis are written. One can observe from
Appendix C that the chosen limitation resulted in few specific articles that were relevant and
usable for this study. However, one can also notice that the research started broad and often
resulted in the choice of books to help gain general information that can lead to more specific
and crucial information, a funnel approach. Also, it must be pointed out that no literature
containing the combined keywords “centralization”, “decentralization” and “purchasing” as
these did not show relevance in answering the research question.
To narrow down the selection even more, a convergent method was opted for where criteria
such as number of citations and notoriety of the author were taken into consideration to simplify
the selection. This part refers to Fawcett & Waller’s (2011) two complementary-thought-
experiment to ensure quality of contributions to the development of theory, particularly within
Supply Chain research, as well as their three-step model.
Figure 12. Matrix for theoretical contribution (Fawcett & Waller, 2011)
Ultimately, from the obtained results, backward and forward referencing were used as a
complementation data-wise to efficiently exploit already performed research of existing
literature (Ellis & Levy, 2006). The selection in this lastly mentioned method was dependent
on the articles’ relevance to this thesis’ research question.
3.3.3 Ericsson’s Internal Data
To develop an as-is state of the firm’s Supply Chain and follow the firm directives, there is a
need to investigate the current (2019) purchasing of Ericsson. This data will provide an insight
on the ordering behavior, the current offering and give a response to if centralization is feasible.
If it is not, data could be utilized to understand why and what has to be done to make it feasible
and to find its implications.

37
Ericsson has multiple large databases on diverse software full of information that needs to be
uncovered. However, there is not one person that is all-knowing of these databases. The first
process in the data gathering was therefore to talk with different people in the organization to
unveil what software to use and which database to select. Respondent 1 initially indicated that
Tableau Software is wishful to utilize in reason of its interactive data visualization capabilities.
However, Respondent 2, explained that Ericsson’s data is accessed through SAP HANA, a
database management system, which possesses an Excel ad-on, the most optimal to access,
manipulate data and is relatively user-friendly. Through the Excel ad-on, the first variable of
time was utilized to extract data from the whole of 2019.
Accessibility was gained through various emails with IT-responsibles, but the difficulty of
understanding what data to display remained. To overcome this difficulty, various people were
contacted that had not been involved in the pre-study, these can be found in Appendix G. A
first discussion was held with Helper 1 who stated that there are definitions of 3PPs which
separate them into an alpha (1 & 2) or beta category (see table 1).
Table 1. Clarification of 3PP types
3PP Type Authorization Manufacturer Responsible in
Ericsson
Supply Chain
Alpha 1 Global Product
Management
3rd Party BA/PDU
ownership
in Product
Portfolio
Ericsson & 3rd
Party
Alpha 2 Global or Local
Portfolio
Management
3rd Party Local
Ownership
In Product
Portfolio
Ericsson & 3rd
Party
Beta Customer
Account /
Project
Management
3rd Party Local
Ownership
Not in Product
Portfolio
Ericsson & 3rd
Party
Despite the structure in place for 3PPs, the rules are not followed, and some products are not
categorized correctly. However, in a perfect world, the criteria above could be utilized to filter
the data to find 3PP hardware. Therefore, Master Data Management had to be contacted where
Helper 2 indicated that all vendors starting with 2*, in the vendor number, correspond to
external suppliers, and would include all products purchased locally and not only parts of it
through the material types in table 1, thus capturing all existing 3PPs. If not performed this
way, the products not recorded correctly, in free text for instance, would not be included. This
permitted the realization of the first wish by the case company where appropriate filters were
utilized to highlight MELA 3PPs and exclude undesirables. The totality of the filters will be
displayed in the empirical findings of this thesis.

38
For the second part of the as-is-visualization, only hardware products will be of interest. Helper
2 suggested in that case to inspect the material group filter which Respondent 2 could utilize
to identify what could be seen as hardware, software, customer service etc. To verify this
approach, the obtained list should have both weight and dimension. More specifically, Helper
4 was contacted for clarification about specifications around sourcing categories where group
codes reveal if a material can be associated with 3PP hardware. The category group areas that
were identified to keep HW were “Network Products HW”, “Site Products & Logistics”,
“Production, Services & Tests” and “IT”. The lastly mentioned one was however left out in
reason of the HW it contains, considered to be out of scope for this thesis by both Respondent
2 and Respondent 1. Moreover, the other three areas still contain services or costs that can be
excluded thanks to the Sourcing Category document, given access to from Helper 4, which
states what material groups to retain to include specific products. Thus, the 3PP HW was
categorized utilizing the Sourcing Category document as guideline and where specifics will
also be displayed in the empirical findings. Ultimately, a small and short meeting was
conducted with Helper 4 for him to confirm the obtained results in terms of cost and
categorization.
For the third and last part of the as-is-visualization, a file containing site products was
compared, provided by Respondent 2, to the reached classification from the previous
paragraph. A first comparison was made thanks to product numbers which could easily find
duplicates between the files. However, a meeting with Helper 3, Supply Product Manager,
confirmed that the only category which permits to find similar products that do not share
identical product numbers, is the product description. Ericsson does not have a naming
convention for the product description which makes the challenge of comparing the two files
immense. Therefore, it was decided to cluster products by keywords to facilitate the
comparison with the global portfolio. This approach means that products without product
description cannot be identified and hence are impossible to know if alternatives/duplicates
exist.
3.3.4 Interviews
Despite the quantitative approach of this thesis through data mining, there is a need for views
and opinions from experts that have worked with the area of investigation in order to rightfully
understand the extracted numerical data. The following quote by Vermeulen (2007)
summarizes the situation well: “What you can learn about mountain gorillas by sitting in an
office is limited. Surely, you can learn something about gorilla behavior by running regressions
based on secondary data about populations, habitat, climate changes, etc., but to really
interpret the results and truly comprehend the animal’s behavior, you need to understand them
at a much more intimate level, which can only be gained through close observation or
interaction. Hence, in order to truly understand my subject, I believe that every now and then,
I have to force myself to go into the mountains and smell the beast.”

39
Following the semi-structured interview approach used in the pre-study, this thesis has built
each interview template based on recommended instructions by Saunders, Lewis and Thornhill
(2009) in their book Research Methods for Business Students. This does not mean that all
interviewees received the same questions, but that a consistent approach was taken with a
predetermined time-frame of one hour, all interviews were held via Skype/Teams, the desktop
was shared in order to help visualization for the interviewee, and where a similar structure of
the interview was held with general goal of having focus on the interviewee’s expertise. Since
this study is not conducted by multiple people, each conversation was recorded, with
permission of the interviewee, in order to be relistened to after and not miss out on valuable
contributions. Also, all interviews were conducted in English in order to avoid
misinterpretations because of wrongfully made translations (Flick, 2014). More specifications
of the interviews can be found in the following table:
Table 2. Specifications of conducted interviews
Respondent Title Date Timeframe Pre-encounter
Interviewee 1 Supply Chain
Manager
18/03/2020 60 min Pre-study
Interviewee 2 Project Support 19/03/2020 60 min None
Interviewee 3 ICT Consultant 25/03/2020 60 min None
Interviewee 4 Change Lead 03/04/2020 60 min Pre-study
Interviewee 5 Head of
Distribution
Management
03/04/2020 60 min None
Interviewee 6 Head of Supply
Chain
Management
08/04/2020 60 min None
Interviewee 7 Head of
Operations
08/04/2020 60 min None
The purpose of these interviews involves answering the second part of the firm directives,
people that work every day with supply chain, manufacturing or sales see what happens on “the
field”, they can provide qualified examples from their professional point of view. These
perspectives can help generate a more detailed analysis by putting opinions against each other
and therefore more thoroughly evaluate iterated scenarios to generate the best
recommendations possible. Also, the approach of analysis taken by the utilized framework
helped form the questions posed to the Supply Chain Manager, and is therefore the driver of
the question formulation of strengths versus weaknesses (see Appendix D).

40
3.3.5 Workshop
A workshop was conducted by an internal team of Ericsson, Next Generation Supply Chain
(NGSC), which study had relevance to this thesis’ research question and where observations
could be made. Ericsson has identified the fact that many old products can be encountered in
their master data with a low visibility and utilization. Also, several sourcing contracts and
activities can be found as duplicates that have low control on costs, volumes and categorization
of items as consequence, which ultimately leads to a more complex supply delivery flow. To
solve this issue, increased visibility and control is wished by the several Market Areas in order
to reduce the number of products in the portfolio and allow a standardization. Therefore, the
purpose of NGSC’s workshop is to establish a way of action for each Market Area’s product
portfolio, establish governance for local material set up and for Product Life Cycle
Management ownership, and determine how the standardized Radio Installation Kits can be
utilized in each Market Area (Lund Joergensen & Pretorius, 2020). The scope is much broader
than the one addressed in this thesis but shares the goal of identifying all 3PPs that can be
replaced by internally manufactured products. NGSC’s approach is also different as it has
measurable and defined goals whereas this study is investigating theoretical scenarios to lead
to an advisable strategy.
The workshop was conducted for two days; both from 9:00 to 17:00 and with a one-hour break
and the participants can be found in the table 3 below. The first two participants, Workshop
Leader 1 and Workshop Leader 2 were the ones in charge of coordinating the workshop and
delimited the time for each contribution, WS Participant 6 helped by writing down answers and
thoughts to help future analysis. The other participants and respondents contributed by taking
part in the discussions and often had their own slides of PowerPoint to clarify their point of
view and help enrich the discussions of the identified problem, mentioned above, and for the
four planned breakout sessions by the workshop leaders.
Table 3. Specifications for Workshop participants
Name Title Date of Participation Market Area
Workshop Leader 1 Supply Business Partner 4th & 5th Feb. 2020 Central
Workshop Leader 2 Change Lead 4th & 5th Feb. 2020 Central
WS Participant 1 Presales Lead Site Solution 4th & 5th Feb. 2020 MELA
WS Participant 2 Solution Architect 4th & 5th Feb. 2020 MELA
WS Participant 3 Head of SuPM RAN
Compute & Site
4th & 5th Feb. 2020 Central
WS Participant 4 Supply Product Manager 4th & 5th Feb. 2020 Central
WS Participant 5 Head of MANA PPM 4th & 5th Feb. 2020 MANA
WS Participant 6 Change Lead 4th & 5th Feb. 2020 MMEA/MELA
WS Participant 7 Solution Architect 4th & 5th Feb. 2020 MMEA

41
WS Participant 8 Senior Product Portfolio
Manager
4th & 5th Feb. 2020 MELA
WS Participant 9 Sourcing and Category
Manager Site Prod
4th & 5th Feb. 2020 MELA
WS Participant 10 Strategic Sourcing
Manager
4th & 5th Feb. 2020 MOAI
WS Participant 11 Senior Manager - RDC 4th & 5th Feb. 2020 MOAI
WS Participant 12 Supply Product Portfolio
Manager
4th & 5th Feb. 2020 MOAI
WS Participant 13 Site Product & Portfolio
Director
4th & 5th Feb. 2020 MOAI
WS Participant 14 Global SC Architect 4th & 5th Feb. 2020 Central
WS Participant 15 Global SC Architect 5th Feb. 2020 Central
WS Participant 16 Strategic Product Manager 5th Feb. 2020 Central
WS Participant 17 Global Category Manager 5th Feb. 2020 Central
WS Participant 18 Strategic Product
Management
5th Feb. 2020 Central
It can be concluded from the similarity of NGSC’s study with this one, that a participation in
their workshop is advantageous. They share similar goals but have a different scope. Thus, the
reflections from participants were noted depending on the potential relevance to the research
question which was determined from the pre-study and performed literature review. There was
therefore no direct involvement in the workshop, only an observative role was taken.
3.4 Data Analysis
With data collected from methods described above as input, the thesis’ data analysis could
begin with the purpose of finding solutions to the firm directives and to answer the thesis’
research question. The analysis follows an abductive approach as indicated in figure 10 and
was proceeded with as the following short descriptions:
Internal Ericsson Data: The quantitative data could be analyzed with help of the mentioned
analysis for excel extension of SAP HANA. Pivot-tables were utilized to arrange the data per
country to quantify the 3PPs in MELA, first for all types of 3PPs and secondly for only HW.
This permitted a comparison of costs and order quantity to display the percentage of third-party
products that is hardware. Moreover, to help the analysis of the data, the visualization and
analysis software Tableau was utilized to map the 3PPs after which country they are delivered
to.
For the categorization, the sourcing document provided by Helper 4 was utilized to find what
types of categories only involve hardware that are utilized in the final offering. With help of

42
this document, the gathered data could be filtered according to selected groups (“Network
Products HW”, “Site Products & Logistics”, “Production, Services & Tests”) which permitted
a categorization of the 3PP HW and where subcategories were added such as “Antenna
Systems”, “Connectivity” etc.
For the comparison with the Global Portfolio, the obtained categorization was utilized to filter
the Global Portfolio to compare the two lists. A first comparison was performed utilizing
product numbers. If product numbers had duplicates that would mean that an exact replica
would be present in the Global Portfolio. A second comparison was performed based on the
product description, similar products could be linked to each other as a possibility of
replacement. However, this approach did not lead to conclusive results, the descriptions of 3PP
HW did not fully match with the descriptions of the products in the Global Portfolio. A
selection of replacement, without technical knowledge, was thus impossible. There was
therefore a need for qualitative data to improve the findings/suggestions of this point.
Interviews & Framework: For the qualitative data, the recordings from the interviews were
transcribed in order to not miss out on potential information and to help compare various
answers with each other with the purpose of having a holistic view of all contributions. This
last approach was crucial to make the triangulation method work and allowed connections to
be made with observations from the workshop. The method could also reveal the relevance of
contributions observed there as one could draw parallels and notice similarities. Combined with
the quantitative data, an as-is visualization could therefore be displayed. This set the basis of
the thesis’ analysis, however, to provide appropriate recommendations for the case company,
a framework was developed in order to evaluate previously established scenarios.
Figure 13. Framework to evaluate the three scenarios
Figure 13 displays the framework that was utilized to evaluate the three scenarios. Weights
have been added from the original framework in order to highlight the performances which the
firm values the most. This framework was therefore sent along with each formulated scenario

43
to key individuals of Ericsson Group Supply (MELA), based on the recommendation of the
case company supervisor, to first weigh the importance of every measurement and after to
grade each performance depending on respective scenario. Thus, a multiple-criteria decision
analysis, with a Pugh Concept Selection, could be made (Pugh, 1981, Marttunen, Lienert &
Belton, 2017). This decision method allows to rank the designs based on multidimensional
entities. More specifically, the weights were chosen between 1 and 5 where the highest number
reflects the most important performance(s) and the lowest the least important one(s), all for the
case company. Each performance is then also rated from 1 to 5 where the highest number
represents a very good performance scaling down to 1 which represents a very bad
performance. With the framework filled in by every key member, a mean value of every weight
and performance could be taken rounded to the closest whole number to calculate a total score
which sums up the multiplication between the weight and respective performance (See the
following equations).
𝑥 = 𝑟𝑜𝑤 𝑛𝑢𝑚𝑏𝑒𝑟
(1)
𝑦 = 𝑝𝑎𝑟𝑡𝑖𝑐𝑖𝑝𝑎𝑛𝑡 𝑛𝑢𝑚𝑏𝑒𝑟
(2)
𝑝𝑒𝑟𝑓𝑜𝑟𝑚𝑎𝑛𝑐𝑒𝑥,𝑦 = 𝑝𝑥,𝑦
(3)
𝑤𝑒𝑖𝑔ℎ𝑡𝑥,𝑦 = 𝑤𝑥,𝑦
(4)
𝑛 = 𝑛𝑢𝑚𝑏𝑒𝑟 𝑜𝑓 𝑎𝑛𝑠𝑤𝑒𝑟𝑠
(5)
𝑚𝑒𝑎𝑛 𝑤𝑒𝑖𝑔ℎ𝑡 = 𝑤𝑥 =
𝑤1,1 + 𝑤1,2+. . . +𝑤1,𝑛
𝑛
(6)
𝑚𝑒𝑎𝑛 𝑝𝑒𝑟𝑓𝑜𝑟𝑚𝑎𝑛𝑐𝑒 = 𝑝𝑥 =
𝑝1,1 + 𝑝1,2+. . . +𝑝1,𝑛
𝑛
(7)
𝛴𝑥 = 𝑤𝑥 ⋅ 𝑝𝑥
(8)
𝛴𝑡𝑜𝑡 = 𝛴1 + 𝛴2+. . . +𝛴13
(9)
The listed equations (1)-(9) is applied to each scenario and where the highest 𝛴𝑡𝑜𝑡 seen in
equation (9) should, according to the framework and empirics, be selected. However, a
framework based on the literature review was also developed containing arguments about
moving purchasing, either by centralizing or decentralizing it. This framework could in turn be
utilized to discuss obtained results in order to give final recommendations in form of a strategy
and to properly answer the research question of this thesis formulated under the conclusion
heading. The lastly mentioned framework would therefore provide an unbiased theoretical
critique of obtained results based on the literature review. Ultimately, arguments found in
interviews will also be used as a source for argumentation with the instance of production and
storage capacity. These arguments originate from questions that have been posed to perform a
similar analysis to surrounding Chopra’s (2003) framework, where advantages and

44
disadvantages are listed before rating the scenarios. However, in this study they will be used
as a comparison to the scores to highlight opinions that talk for or against obtained results.
3.5 Quality of Research
In the following sub-chapter, the quality of the thesis research design will be evaluated based
on Yin’s (2003) dimensions for case studies, with the reliability, validity and generalizability
of the thesis. Also, considerations towards ethics and sustainability will be mentioned as
testimonials of high standards.
3.5.1 Reliability
In research, reliability represents the accuracy and exactitude of all measurements and factors
included, in order to obtain similar or identical results if the research was to be performed again
(Collis & Hussey, 2014). Moreover, the results should be stable over time. This signifies that
if identical results are obtained when repeating the research, the thesis has a very high
reliability. The goal with having high reliability ensures the quality and trustworthiness of the
research and aims to eliminate sources of errors and potential bias. Therefore, this thesis has
aimed to have the highest possible reliability by opting for an objective view and treating
gathered data impartially as recommended by Blomkvist & Hallin (2015).
For the quantitative part of this thesis, the data utilized would be only identical if the same time
frame of the year 2019 is utilized and same case company is observed. The database is
continuously updated and new 3PP orders are made every day, therefore, results would differ
with selection of time. In spite of this, the data of 2019 is stored in SAP Hana and cannot be
altered, thus preserving the possibility of recreating the quantitative data gathering of this
research. The analysis of the data set is thoroughly described in the thesis’ method and could
be recreated identically. What could be different if repeating the study, would be arranging the
data in another order in the columns, however, this order does not impact the analysis of the
data. The quantitative part of the thesis based on Ericsson’s internal data would thus receive a
very high reliability. Oppositely, the quantitative data gathered for the qualitative approach in
the Pugh selection matrix is not as reliable. Biases of mood or current events can impact
participants when choosing a weight and performance between 1 to 5. The company philosophy
is also a factor which could change over time which means that certain performances would be
valued differently. New technology or paradigms of best practices could also be factors that
would change the results in the future. Despite these risks of biases, the people involved have
been selected based on their expertise and should have similar answers despite mood, also, the
mean value taken helps against the extreme values and possible biases of mood.
For the qualitative part, interviews have been transcribed properly, based on a recording, with
attention paid to gestures and even tones as rhetoric figures of speeches, such as irony, are
common, and if wrongfully interpreted, can result in misleading biases (Creswell, 2009). The
recordings were listened to a multitude of times to decrease the probability of misinterpreting
or missing out on a contribution. To furtherly decrease risk of bias, interview questions were
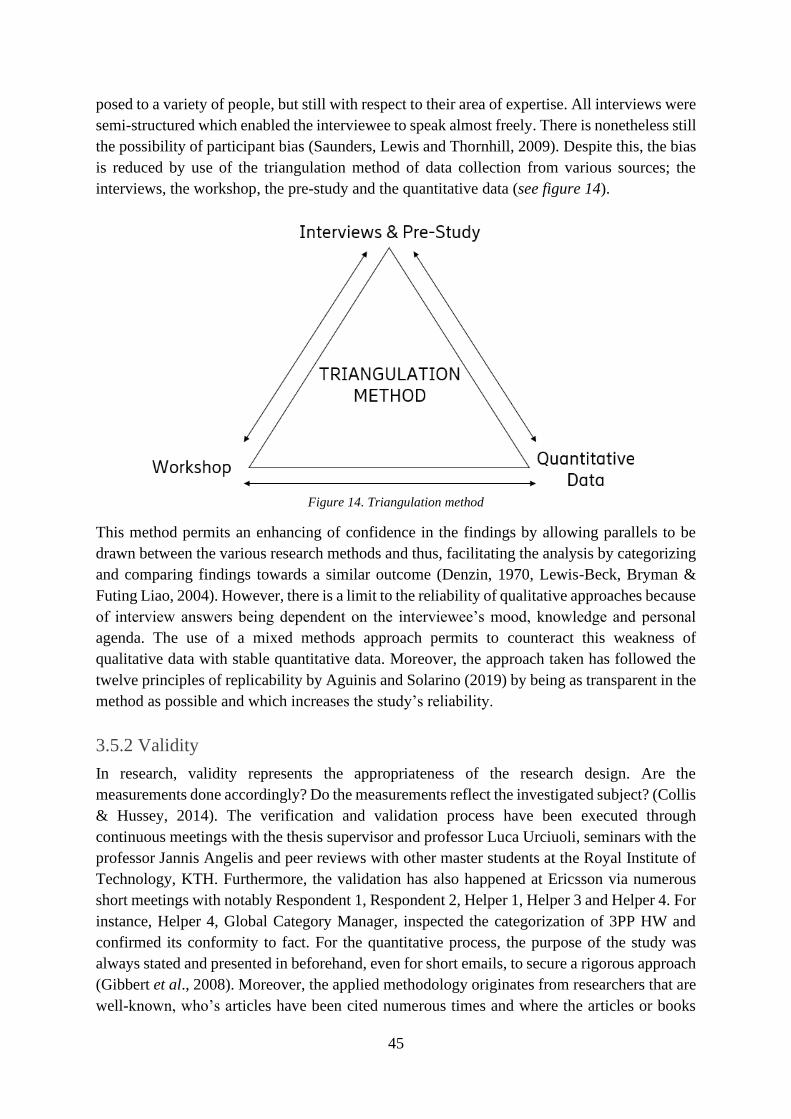
45
posed to a variety of people, but still with respect to their area of expertise. All interviews were
semi-structured which enabled the interviewee to speak almost freely. There is nonetheless still
the possibility of participant bias (Saunders, Lewis and Thornhill, 2009). Despite this, the bias
is reduced by use of the triangulation method of data collection from various sources; the
interviews, the workshop, the pre-study and the quantitative data (see figure 14).
Figure 14. Triangulation method
This method permits an enhancing of confidence in the findings by allowing parallels to be
drawn between the various research methods and thus, facilitating the analysis by categorizing
and comparing findings towards a similar outcome (Denzin, 1970, Lewis-Beck, Bryman &
Futing Liao, 2004). However, there is a limit to the reliability of qualitative approaches because
of interview answers being dependent on the interviewee’s mood, knowledge and personal
agenda. The use of a mixed methods approach permits to counteract this weakness of
qualitative data with stable quantitative data. Moreover, the approach taken has followed the
twelve principles of replicability by Aguinis and Solarino (2019) by being as transparent in the
method as possible and which increases the study’s reliability.
3.5.2 Validity
In research, validity represents the appropriateness of the research design. Are the
measurements done accordingly? Do the measurements reflect the investigated subject? (Collis
& Hussey, 2014). The verification and validation process have been executed through
continuous meetings with the thesis supervisor and professor Luca Urciuoli, seminars with the
professor Jannis Angelis and peer reviews with other master students at the Royal Institute of
Technology, KTH. Furthermore, the validation has also happened at Ericsson via numerous
short meetings with notably Respondent 1, Respondent 2, Helper 1, Helper 3 and Helper 4. For
instance, Helper 4, Global Category Manager, inspected the categorization of 3PP HW and
confirmed its conformity to fact. For the quantitative process, the purpose of the study was
always stated and presented in beforehand, even for short emails, to secure a rigorous approach
(Gibbert et al., 2008). Moreover, the applied methodology originates from researchers that are
well-known, who’s articles have been cited numerous times and where the articles or books
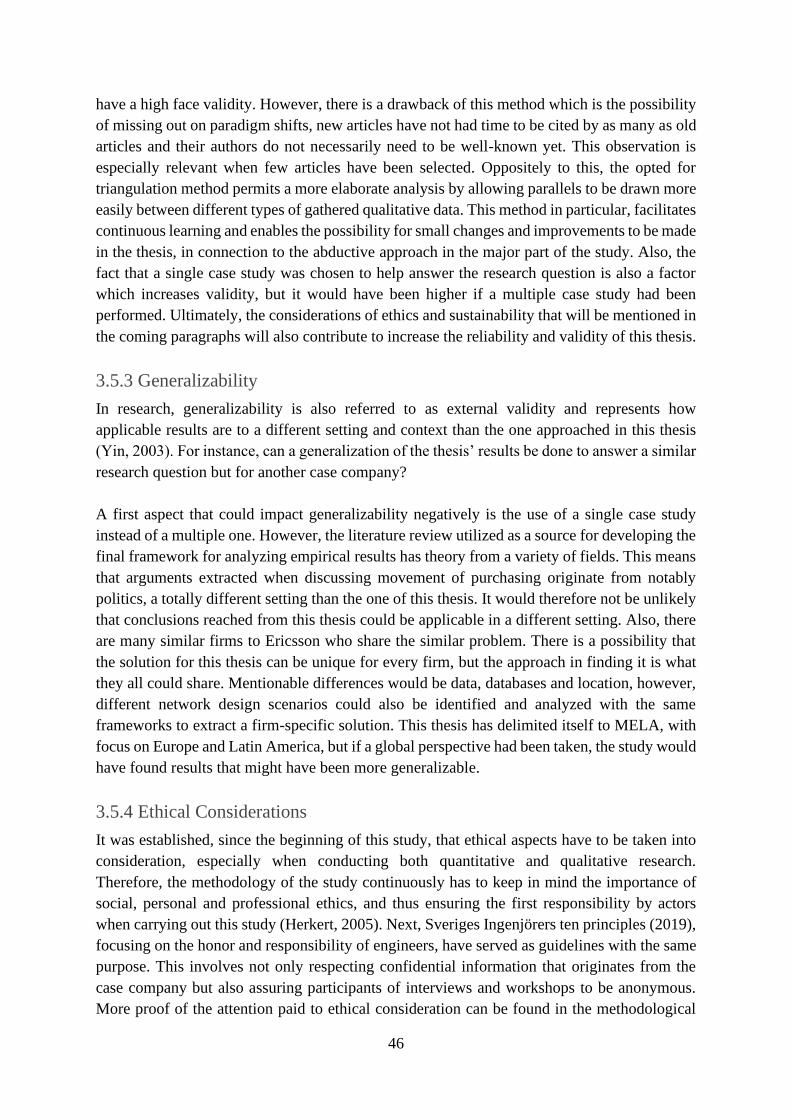
46
have a high face validity. However, there is a drawback of this method which is the possibility
of missing out on paradigm shifts, new articles have not had time to be cited by as many as old
articles and their authors do not necessarily need to be well-known yet. This observation is
especially relevant when few articles have been selected. Oppositely to this, the opted for
triangulation method permits a more elaborate analysis by allowing parallels to be drawn more
easily between different types of gathered qualitative data. This method in particular, facilitates
continuous learning and enables the possibility for small changes and improvements to be made
in the thesis, in connection to the abductive approach in the major part of the study. Also, the
fact that a single case study was chosen to help answer the research question is also a factor
which increases validity, but it would have been higher if a multiple case study had been
performed. Ultimately, the considerations of ethics and sustainability that will be mentioned in
the coming paragraphs will also contribute to increase the reliability and validity of this thesis.
3.5.3 Generalizability
In research, generalizability is also referred to as external validity and represents how
applicable results are to a different setting and context than the one approached in this thesis
(Yin, 2003). For instance, can a generalization of the thesis’ results be done to answer a similar
research question but for another case company?
A first aspect that could impact generalizability negatively is the use of a single case study
instead of a multiple one. However, the literature review utilized as a source for developing the
final framework for analyzing empirical results has theory from a variety of fields. This means
that arguments extracted when discussing movement of purchasing originate from notably
politics, a totally different setting than the one of this thesis. It would therefore not be unlikely
that conclusions reached from this thesis could be applicable in a different setting. Also, there
are many similar firms to Ericsson who share the similar problem. There is a possibility that
the solution for this thesis can be unique for every firm, but the approach in finding it is what
they all could share. Mentionable differences would be data, databases and location, however,
different network design scenarios could also be identified and analyzed with the same
frameworks to extract a firm-specific solution. This thesis has delimited itself to MELA, with
focus on Europe and Latin America, but if a global perspective had been taken, the study would
have found results that might have been more generalizable.
3.5.4 Ethical Considerations
It was established, since the beginning of this study, that ethical aspects have to be taken into
consideration, especially when conducting both quantitative and qualitative research.
Therefore, the methodology of the study continuously has to keep in mind the importance of
social, personal and professional ethics, and thus ensuring the first responsibility by actors
when carrying out this study (Herkert, 2005). Next, Sveriges Ingenjörers ten principles (2019),
focusing on the honor and responsibility of engineers, have served as guidelines with the same
purpose. This involves not only respecting confidential information that originates from the
case company but also assuring participants of interviews and workshops to be anonymous.
More proof of the attention paid to ethical consideration can be found in the methodological

47
approach of wanting the study to be transparent by following Aguinis and Solarino’s (2019)
twelve criteria of replicability. This transparency and replicability results in a high rigor which
allows readers to be critical of used sources and to continuously reflect on the work to avoid
potential bias.
Parallelly, the study has also respected the four requirements put forward by the Swedish
Research Council (Vetenskapsrådet, 2017). Their goals are similar to the ones by Sveriges
Ingenjörer, however, they stress the importance of informing actors of the purpose of the study,
asking for authorization of using gathered data from them, ensuring the good use of it, and
offering the option of confidentiality.
Also, Ericsson’s own Code of Business Ethics (Ericsson, 2019) contributed by emphasizing the
importance of responsibility, following laws, rules and regulations, commitment to sustainable
development etc. These were often tied to their Non-disclosure agreement which was signed
and followed through the complete conduction of this thesis.
3.5.5 Sustainability Considerations
The first sustainable consideration taken of this thesis is the reading of Ericsson’s Code of
Ethics where it states that Ericsson consistently searches for more sustainable solutions and
always aims for a more environmentally friendly world. This source of inspiration could
thereafter be used in the development of one of this thesis’ frameworks. A framework for
evaluating distribution network designs was developed based on the one formulated by Chopra
(2003), but where extensions were made. These extensions firstly include the use of weights to
perform a Multiple-Criteria Decision Analysis. The second extension that was made was the
addition of “carbon footprint” as a Key Performance Indicator (KPI). This allows a more
environmentally friendly approach to the analysis, more than just considering transportation
costs and where the firm can opt for a high weight for this KPI if it values a low carbon
footprint.

48
4. Business Introduction
In the following section, the case company will be presented following a funnel model, from
general information to specified supply chain structure that will lead to investigated scenarios
during this study.
4.1 Ericsson AB
Ericsson AB is a world-renowned Swedish information and communication technology
company of approximately 99000 employees which carries approximately 40 percent of the
world’s mobile traffic through its networks. Their current efforts are being put into networks,
emerging businesses, digital services and managed services; all with the help of IoT platforms
powered by 5G (Ericsson, 2018). A substantial amount of Ericsson’s revenues is secured
through large, multi-year contracts that can be linked to what can be qualified as few but
important customers. In 2017, almost 45 percent of the sales originated from solely ten
customers (Ericsson, 2017). Hence, quality of product delivery is vital to keep relationships
with key customers good, a quality that can be jeopardized along the Supply Chain.
To understand the case, one must also be somewhat familiar with the Group Supply in the
company organization. The global presence of the company motivates the five existing market
areas: North America, Europe & Latin America, Middle East & Africa, North East Asia, and
South East Asia, Oceania & India. Respondent 3 explained that these must be mentioned
because of the reorganization from ten to the current market areas.
4.2 Market Area Europe and Latin America
The investigated area in this thesis will be the one of MELA, the market area of Europe and
Latin America.
Figure 15. Market Area Europe and Latin America
As seen in Figure 15, MELA is the largest geographical market area, counts about 47 percent
of Ericsson’s total number of employees and contains the largest customer base of the firm. In
reason of its geographical spread, Respondent 3 explained that the supply chain part of the
organization works with nine customer units:

49
These permit higher flexibility and responsiveness to customer needs in order to shorten lead-
times, to provide proactive supply chain risk management by placing formal requirements on
them and to support a sustainable operation by targeting surface transportation, all by following
Ericsson and Supply system standards implemented in all aforementioned market areas.
Respondent 5 explained that following these principles has helped in reaching sales covering
26 percent of Ericsson’s total sales. Moreover, to further reduce lead times, increase flexibility
and improve customer service, MELA has four Ericsson Supply Hubs (ESH). These hubs are
strategically placed warehouses where the offering can quickly be delivered to the customer
and act as limit between the upstream (referred to as inbound in the case company) and
downstream (referred to as outbound in the case company) part of the Supply Chain, located
in Borås (Sweden), Duisburg (Germany), São José dos Campos (Brazil) and Guadalajara
(Mexico). To support these consolidation points, MELA disposes of four factories that are
either an Ericsson Supply Site (ESS) or an External Manufacturing Services (EMS). They both
participate in the production of the Ericsson offering that is to be delivered to the ESH,
however, the main difference is that ESS are owned by Ericsson AB or its subsidiaries whereas
the EMS are outsourced. Despite this, they are both referred to as Ericsson Manufacturing
Services. MELA mainly utilizes its two ESSs, in Tallin (Estonia) and São José dos Campos
(Brazil) and its two EMSs, in Guadalajara (Mexico), and Tczew (Poland). However, a little
portion of the offering is still produced in Wuxi (China), it used to hold 52 percent of the
production for MELA in 2018 according to Respondent 3, but most of it has been moved to
Poland in reason of political conflicts between the US and China (Keane, 2019). To make the
Supply Chain work, MELA (see figure 16) has about 340 sub-suppliers.
Figure 16. ESS, EMS & ESH across MELA

50
4.3 MELA Supply Chain
The following figure was made following the Ericsson Supply Model (ESM) and is the firm’s
own and specific way of summarizing their Supply Chain:
Figure 17. A generalized and simplified Supply Chain Flow of MELA
Figure 17 displays a generalized and simplified material flow to replenish MELA according to
Respondent 4. One can observe the previously mentioned EMS and ESSs that utilize brought
in parts and materials to manufacture Ericsson products before delivering them to an ESH,
which in the figure is marked as an Ericsson AB (EAB) hub which means it is owned and
managed by the mother company. After that the product is taken to a local warehouse which is
generalized to be managed by LC Ericsson but can in some cases be managed by EAB. This
choice depends on multiple factors such as customer, country etc. The handling of goods there
is taken care of by LSPs (Local Service Providers) which also make the purchase order to the
EAB Order Desk. The local warehouses can permit final justifications of the semi-finished
products which also allows for a customization thanks to 3PPS (third party products) which
are sourced locally. The finished products are finally brought to the customer on a site by ASPs
(Authorized Service Providers), installers of the offering that the customers can decide to
include or not to install themselves. This last interaction represents the change in ownership
from Ericsson to the customer.
If one were to compare every Supply Chain for each customer, one could claim that they each
benefit from a unique and customer tailored Supply Chain. Respondent 4 pointed out that this
approach is reflected in Ericsson’s latest marketing about the diffusion of their 5G solution
with the three C’s: Customer focus, Collaboration and a Can-do attitude. Moreover, the
figure depicts a general case of how the supply chain operates. For instance, the supply hub in
Figure 17 is centralized (owned by EAB) meaning that there is no buffer, following a make-
to-order strategy. However, there are also cases where it is regional, with a buffer and
containing the SIPP (Stock Item Product Portfolio), thus following a make-to-stock strategy.
Ultimately, the order flow could also have a local supply chain where there are both stock and
non-stock items (Engström, 2020). A visualization of the previous physical flows is completed
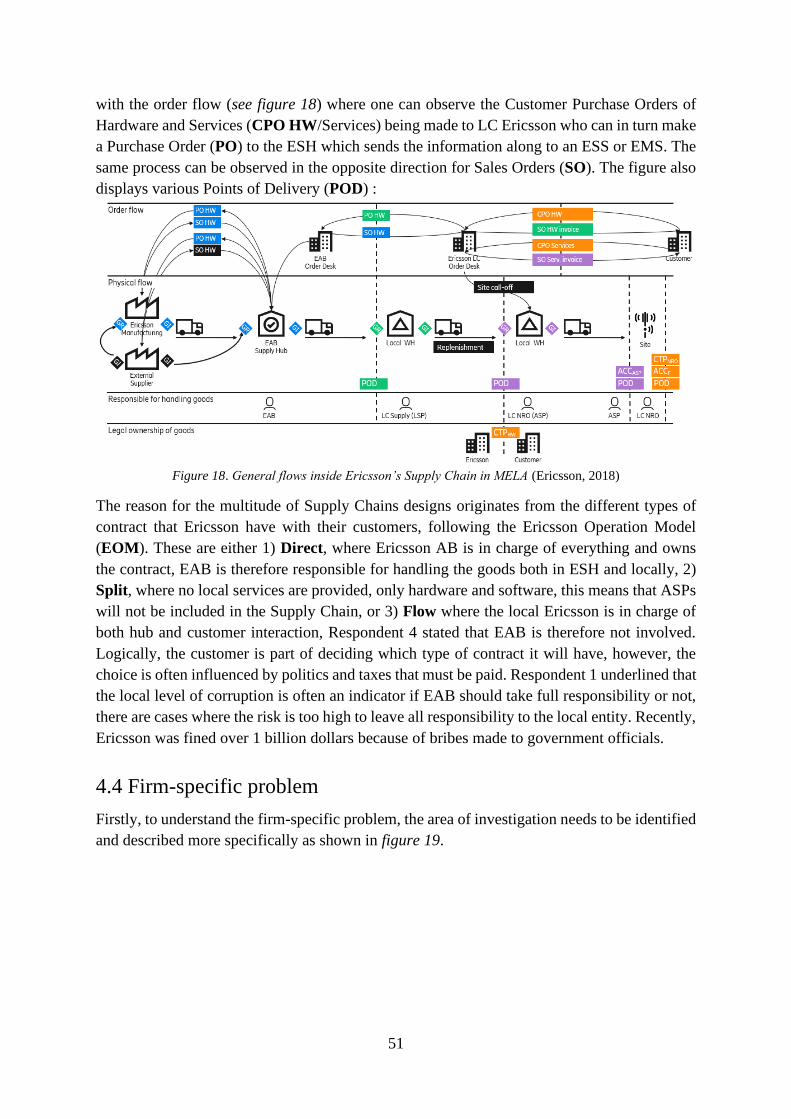
51
with the order flow (see figure 18) where one can observe the Customer Purchase Orders of
Hardware and Services (CPO HW/Services) being made to LC Ericsson who can in turn make
a Purchase Order (PO) to the ESH which sends the information along to an ESS or EMS. The
same process can be observed in the opposite direction for Sales Orders (SO). The figure also
displays various Points of Delivery (POD) :
Figure 18. General flows inside Ericsson’s Supply Chain in MELA (Ericsson, 2018)
The reason for the multitude of Supply Chains designs originates from the different types of
contract that Ericsson have with their customers, following the Ericsson Operation Model
(EOM). These are either 1) Direct, where Ericsson AB is in charge of everything and owns
the contract, EAB is therefore responsible for handling the goods both in ESH and locally, 2)
Split, where no local services are provided, only hardware and software, this means that ASPs
will not be included in the Supply Chain, or 3) Flow where the local Ericsson is in charge of
both hub and customer interaction, Respondent 4 stated that EAB is therefore not involved.
Logically, the customer is part of deciding which type of contract it will have, however, the
choice is often influenced by politics and taxes that must be paid. Respondent 1 underlined that
the local level of corruption is often an indicator if EAB should take full responsibility or not,
there are cases where the risk is too high to leave all responsibility to the local entity. Recently,
Ericsson was fined over 1 billion dollars because of bribes made to government officials.
4.4 Firm-specific problem
Firstly, to understand the firm-specific problem, the area of investigation needs to be identified
and described more specifically as shown in figure 19.

52
Figure 19. General Area of Investigation in the MELA Supply Chain
Figure 20. Specified Area of Investigation and identified Problem Area in the MELA Supply Chain
As indicated in the section about MELA, the Supply Hubs could be defined as the limit between
the inbound and outbound part of the Supply Chain. This study will focus on the outbound part.
Figure 19 and Figure 20 offer one example of the existing variety of Supply Chains for each
customer, however, one must remember the aforementioned statement from Respondent 4
about each Supply Chain being unique for each customer. An example is that ASPs are not
involved as the Split contract determines. In spite of this, the identified problem is with the
local warehouses. To satisfy customer demand and to add as much value as possible, product
customization is available. Customers can request a specific length for a cable as an example,
yet, these so-called third-party products (3PPs) are ordered by LSPs (Local Service Provider)
and provided locally to be brought to the local warehouses. Respondent 6 showed that in 2019,
the cost for local warehouses in MELA amounted to approximately 200 million SEK. Ericsson
has partially, due to these costs, expressed willingness to remove local warehouses and reduce

53
lead time. Furthermore, it would help the firm logistically to reduce the number of different
products as well as seen in the table below: logistics issues internally have resulted in over
200000 product numbers that should to be cut down to ten percent of the current value
according to Respondent 1.
Table 4. Example of one 3PP product that has been productified 20 times in Ericsson.
In short, the goal is to have finished products in the hubs to quickly deliver to ASPs (Authorized
Service Providers) which basically are Ericsson’s outsourced installers. However, Ericsson is
currently ordering products such as cables, antennas etc. that already exist in their global
portfolio. In reason of logistic issues, as well as wanting to reduce local dependency, it has
become wishful to reduce use of local 3PPs and utilize the hubs and ESS/EMS more efficiently.
There is therefore a need to quantify and map all products ordered from local suppliers to
compare the products in the global portfolio. If 3PPs should be manufactured internally instead,
one must take price and capacity into consideration. Can the ESS/EMS produce enough? Can
the ESH store the old 3PPs that would be produced internally? A possible vertical integration
by ASPs upstream must also be considered in order to create a more powerful and beneficial
relationship or even outsourcing to one central supplier. However, local obligations in reason

54
of politics might hinder the reduction of local warehouses. Conclusively, there are several
factors into the equation that need to be considered in order for Ericsson to opt for an optimizing
strategy that can improve its Supply Chain.
4.5 Scenarios
To narrow the scope of this thesis, to investigate Ericsson’s problem and to answer the research
question of the thesis, the study has identified three potential scenarios to optimize the Supply
Chain. These will similarly to Figure 17 follow a generalized model of the Supply Chain across
MELA and recommendations by Respondent 1.
Removing Local 3PPs
Figure 21. MELA’s Supply Chain after removing the 3PPs and local warehouses
The first scenario assumes that all 3PPs have an equivalent product in Ericsson’s Global
Portfolio and that the capacity in the ESS/EMS is enough to fulfil customer demand in MELA.
Therefore, local warehouses could fully be removed and its costs with them. These costs would
instead be transferred to transportation and production, but it is expected by the firm that this
solution would decrease overall costs. In spite of this, there is still a need to investigate how
lead time between the ESH and the site would be impacted.
Figure 22. Consequence of removing 3PPs when purchasing

55
Figure 22 highlights the fact that purchase order would still happen between customer and LC
Ericsson. For instance, customers in Bulgaria would order from Ericsson Bulgaria and not
through Ericsson AB. However, the now centralized 3PP would have to be ordered by Ericsson
LC to Ericsson AB who in turn would order the EAB Supply Hub to ask for manufacturing as
displayed in figure 18, resulting in a partial backwards shift with the removal of 3PP suppliers.
The manufacturing strategy would therefore become a make-to-order or make to stock
depending on the demand for the specific 3PP.
Moving Purchasing to ASPs
The second scenario differs from the first scenario by changing the responsibility of 3PPs to
ASPs.
Figure 23. MELA’s Supply Chain by giving 3PP responsibility to ASP
Theoretically, lead time between the hub and the ASP’s warehouse would be reduced, but more
importantly, response time might decrease even more and thus create a win-win situation for
both parties: Ericsson would not have to handle the purchasing of 3PPs while ASPs would have
more responsibility which would increase their income, the local warehouses would be
eliminated, and instead, the ASP’s warehouses would be utilized more effectively. However,
this scenario has the assumption that the ASP would accept the responsibility, that its
warehouses are large enough to handle more products and that potential reduction of lead time
and response time are substantial enough for ASPs to consider a potential investment.

56
Figure 24. Movement of 3PP purchasing to ASPs
Figure 24 displays an example of how moving purchasing of 3PPs to ASPs would look like,
this would instead mean a disaggregated forward shift - the 3PPs would be brought to the
customer’s site to complete Ericsson’s inhouse offering. The purpose of this figure is to display
that ASPs might have to handle relationships between multiple suppliers as well as
transportation to customer sites. What is left out from this figure is the information flow
between LC Ericsson and the ASPs to inform them of the 3PP demand.
Moving Purchasing to One Trusted Supplier
Figure 25. MELA’s Supply Chain by having one supplier for all 3PPs
The third and final scenario is a modification of the second. In this case, the ASPs would keep
their original responsibility, instead, one single and trusted supplier would take care of the
3PPs. Thus, resulting in a significant contract for the one supplier and the possibility for
Ericsson to benefit from a discounted price due to large orders, economies of scale within
supplying, and possible reduction of lead time. Moreover, the difficulty that ASPs face in
scenario two is dealt with while Ericsson can keep a relationship with one big supplier which
can be easier to maintain than multiple small ones.

57
Figure 26. Movement of Purchasing to one supplier
Figure 26 shows the purchasing responsibility of the one outsourced supplier who could
manufacture his own parts, or in turn go through a 3PP supplier of his choosing, before
delivering the product to ASPs, or possibly to a supply hub depending on the offering. Thus,
resulting in an aggregated forward shift with potentially local suppliers. The information flow
is once again left out, but the LC Ericsson would after receiving the order from the customer
inform the outsourced supplier what is expected of him. One can observe that Ericsson is
completely left out of the purchasing of parts or involvement of other suppliers.
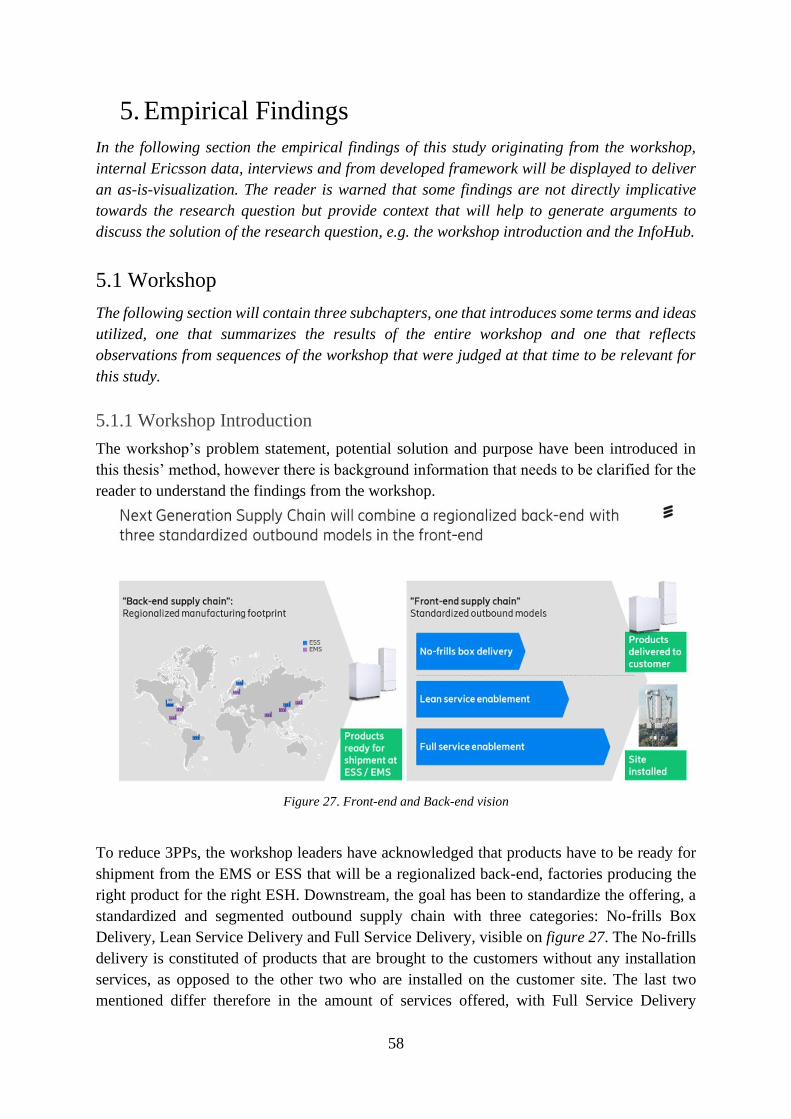
58
5. Empirical Findings
In the following section the empirical findings of this study originating from the workshop,
internal Ericsson data, interviews and from developed framework will be displayed to deliver
an as-is-visualization. The reader is warned that some findings are not directly implicative
towards the research question but provide context that will help to generate arguments to
discuss the solution of the research question, e.g. the workshop introduction and the InfoHub.
5.1 Workshop
The following section will contain three subchapters, one that introduces some terms and ideas
utilized, one that summarizes the results of the entire workshop and one that reflects
observations from sequences of the workshop that were judged at that time to be relevant for
this study.
5.1.1 Workshop Introduction
The workshop’s problem statement, potential solution and purpose have been introduced in
this thesis’ method, however there is background information that needs to be clarified for the
reader to understand the findings from the workshop.
Figure 27. Front-end and Back-end vision
To reduce 3PPs, the workshop leaders have acknowledged that products have to be ready for
shipment from the EMS or ESS that will be a regionalized back-end, factories producing the
right product for the right ESH. Downstream, the goal has been to standardize the offering, a
standardized and segmented outbound supply chain with three categories: No-frills Box
Delivery, Lean Service Delivery and Full Service Delivery, visible on figure 27. The No-frills
delivery is constituted of products that are brought to the customers without any installation
services, as opposed to the other two who are installed on the customer site. The last two
mentioned differ therefore in the amount of services offered, with Full Service Delivery

59
offering customer specific services as well as site material not part of the SIPP contrary to Lean
Service Delivery.
Moreover, as a temporary solution, the workshop leaders defined Radio Installation Kits
(RIKs) as a wanted outcome of the project, a model to reduce lead time and various costs. The
purpose is to connect these to type sites, however, the material/products required for each kit
need to be decided with help of workshop participants. The goal is to productify the RIKs in
SAP, notably, to increase transparency and allow full real-time visibility for the customer. The
kits will contain material limited to basic installation material, all products will be based on
SIPP and will help the standardization of site solutions for all market areas. In short, RIKs aim
to support right material in each ESH or local warehouse with more flexibility and less handling
units.
5.1.2 Summary of Findings
During the workshop, it was concluded that the actual radio related portfolio is much smaller
than what the databases are showing, but there is a need of reducing it even more to realize
wanted visibility. Moreover, there is a need to address the data, tools and the portfolio centrally
as well as in each MA for the local 3PP material - which this thesis will partially contribute to.
These findings therefore reflect the challenge of the diversity in each MA, who differ in views
on each product, some sort of alignment is required if actions are to be taken. A market area
that has started the clean up process on its own is MANA, their practices were deemed as a
solid for the process and structure for managing products that are added or removed from the
portfolio, and could therefore be used by other MAs. The solution of RIKs is good and currently
working differently, but working, for many MAs. However, it was reached as a conclusion that
RIKs have to continue to be MA specific, a statement made was that “each MA is special in its
own way”. MANA defines RIKs on historical data of sales, MMEA based the definition on a
delivery driven approach while MELA and half of MOAI do not have RIKs. During
discussions, participants did not share a common definition for portfolio, which is part of the
problem, it must therefore be defined.
The identified ways forward from the findings can be split into three categories: site portfolio
clean up, product governance for the phase in and phase out, and Radio Installation Kits.
Figure 28. Product numbers that need to be reduced

60
The site clean-up targets to reduce the site products from figure 28 to less than ten thousand,
by aligning data and baseline, align centrally and then apply on the MA’s, executing the clean
up and evaluating risks and challenges that can arise.
For the product governance, global material should have full control over the phase in and
phase out of products whereas for local material, MANA once again has an established process
which other MAs can learn from. There is therefore a need to develop a guide for local material
set up, with help from Ericsson’s InfoHub.
For the Radio Installation Kits, a target has been set to about 35-50 RIKs per MA, which is
what is estimated to help minimize the portfolio and ensure effective business. The challenges
are to develop and align a best practice strategy for MANA, MMEA and MOAI while MNEA
and MELA require further analysis and investigation to see if RIKs are possible.
5.1.3 Relevant contributions
As introduced in this thesis, workshop leaders brought up the 20 locally sourced duplicates as
proof of lack of visibility, and that five thousand 3PP are added every year. However,
participants pointed out that the visibility is more an issue than having locally sourced products.
The reason is that the purchase can be cheaper or have a shorter lead time than if it was
produced centrally, or both. Moreover, there is a need for visibility to allow a financial follow-
up but the use of 3PP should not be categorized as bad. As a response, participants that work
centrally indicated that the 3PPs might as well be more expensive and that not using the
products from ESS/EMS hinders economies of scale, this could also be the case for transport
costs.
While many MA’s introduced their way of working with RIKs, WS Participant 1, Presales
Lead Site Solution responsible argued that RIKs are not possible in MELA. He highlighted the
importance of customer needs; a standardized kit does not comply with the specific demand. If
a customer needs for instance a cable of 150mm it must be of that size, WS Participant 2,
Solution Architect, confirmed that providing a longer cable is not a possibility and that it cannot
simply be wrapped around the antenna or similar. MELA has therefore pointed out that the
specific customer demand cannot work with RIKs yet, 3PPs are still required. They also
confirmed that visibility is non existing, decisions are taken locally and cannot be tracked
centrally. More challenges found in that area are that big customers such as Vodafone do not
have that same order in every country, for instance Vodafone UK demands one cable whereas
Vodafone NL demands another.

61
Figure 29. Savings involving Site Products over the last six years
WS Participant 17, Global Category Manager (Sourcing), mentioned that savings made by
Ericsson has increased over the years, as seen in figure 29, and that product reduction would
help this growth and must be done. This goal is connected to the one of reducing local suppliers
to aim for economies of scale and to drive a global procurement strategy. However, this
requires LC Ericsson to not opt for “preferred suppliers” as it is a violation of the code of
conduct, but is acceptable if the customer has asked for a specific supplier.
Finally, WS Participant 5, Head of MANA PPM, lectured several times to show how MANA
approaches different challenges and a common emphasized aspect was that their cross-
functional teams are the key to success.
5.2 As-Is Visualization
This section will display a summary of empirics from Ericsson’s internal data which answers
the first part of the directives given.
5.2.1 Locally Sourced 3PPs
The measures utilized in the Excel-columns were “PO Net Value In Input Currency” to show
the price in SEK of purchased material, the “PO Order Quantity” to see the number of items
ordered (“PO Item Counter”) along with a “PO Header Counter”. In the rows, only the “SO
Final External Customer Country” and “Vendor” were put in to see which supplier delivered
3PPs to what country (see figure 30).
Figure 30. Rows and Columns to extract HANA Data of locally sourced 3PPs in 2019
Figure 30 also shows a result of 3PPs that have been delivered in MELA from CALA
TELECOM SERVICES LTD. The found key measures were blurred in accordance with a
signed Non-Disclosure Agreement. To permit the categorization by country and vendor, and
to obtain the result above, the following filters were utilized: “Market Area” and “SO Final
External Customer Market Area” where only MELA was selected to exclude other Market
areas that were out of scope. “PO Return Item” and “SO Reason for Rejection (Itm)” were also

62
utilized as filters to remove all orders that never were delivered to customers or that were sent
back. Finally, the “PO Plant” was filtered to exclude all EAB flows and focus on the local
companies. Thus, a Pivot Table was created to sum all measures and categorise them per
country as asked by firm directives:
Figure 31. Extract of Pivot Table to quantify yearly local 3PPs
Once again, the key measures have been blurred. Figure 31 reveals how many vendors deliver
how many different items to Albania during 2019. However, it must be emphasized that these
are the number of vendors delivering 3PPs to Albania. One of the 8 vendors counted above can
also deliver to another country in MELA which means that the total of this column does not
represent the total amount of vendors in MELA, a vendor could have been counted several
times.
Below, a Tableau visualization was produced to get a geographical spread of the per mille of
the total order quantity in MELA for each country:
Figure 32. World Map of 3PP ordering behavior for MELA in 2019
Without going into much detail, one can observe that the main receivers of 3PPs are Italy
with a per mille of 223,4 and Moldova with a per mille of 157,4 of the total of ordered 3PPs
inside MELA in 2019.
5.2.2 Categorization of Locally Sourced 3PP HW
To reduce the locally sourced 3PPs to only hardware, new filters had to be added to the ones
described under the previous heading. These are mentioned in the thesis’ method and are found

63
in “PO Material Category Group” and include “Antenna Systems, Connectivity, Digital
Semiconductor, Energy Systems, Installation Material, Mechanics & Plastics, RF Signal Chain,
Site Interconnect, Standard Electronics and Test-Manuf & Ind Equipment”. Thus, services and
other irrelevant 3PPs could be excluded to only keep storable 3PPs that are part of the final
offering, resulting in a Sum of Net Value of 2,48 percent of the total locally sourced 3PPs. To
finalize the categorization, a subcategory called “PO Material Group” was introduced to allow
a better specification (see figure 33).
Figure 33. Categorization of locally sourced 3PP HW of 2019.
Figure 33 also provides the count of vendors for each 3PP category. With obtained data, the
same approach could be taken as in previous part of the as-is visualization to be displayed in
figure 34:

64
Figure 34. Extract of Pivot Table of yearly quantification of local 3PP HW.
5.2.3 Third Party Products HW vs. Global Portfolio
As described in the method, the 3PP HW were firstly compared to the Global Portfolio file
with product numbers:
Figure 35. 3PPs that have duplicates in the global portfolio

65
One can observe from figure 35 that 39 third party products (hardware) have identical
duplicates in the global portfolio. There are however 1524 products that do not have duplicates
based on the product number. The product description of 3PPs must therefore be scrutinized
and similarities must be found with descriptions in the global portfolio, this resulted in the
following comparisons in figure 36:
Figure 36. Comparison between two jumper cables, global portfolio vs. 3PP HW
The products missing a product description and R state (product number) are instead
categorized as “impossible to know” as seen in figure 37 below:
Figure 37. Categorization of 3PP HW missing a product description
Unfortunately, it is not possible to determine whether the local 3PP HW that do not have an
identical product number in the Global Portfolio can be replaced by a Global Portfolio product
or not, there is too little information about the product specifications. Only figure 35 contains
products that are identical but that have been sourced from other vendors. From the comparing
approach in figure 36 above, it is not possible for a person without specific technical knowledge
and who has not made the 3PP order to know if products can be replaced from the global
portfolio. There are specifications that are not included in the descriptions of both 3PP HW and
Global Portfolio products such as wire material for instance.
5.3 Advantages & Disadvantages
For the scenario-evaluation: all scenarios were declared as feasible with the assumption that all
complexities that will arise from implementing each scenario can be solved and that cost is not
an issue. This subchapter will also display results from interviews with the InfoHub-project as
well as numerous interviewees contributions linking with the scenarios and permitting an
iteration of recommended strategy for the case company.
5.3.1 Scenario 1 - Removing 3PPs
The major strength discovered from such a scenario is full control that Ericsson will obtain.
All products will be manufactured internally, and all offerings would be available centrally at
the ESH. There would not be any dependability on local suppliers, only on needed products to
specific sites. Another strength would be the standardization of the offering and reduction in
product numbers, Ericsson would stop to offer “bits and pieces” as they are currently doing
and have one delivery for one customer. This scenario would permit box deliveries - one box
for one site - the ideal situation where nothing is added along the way. Consequently, this would
consist in a significant simplification of the inventory allocation, parts coming from different

66
suppliers from different countries would not have to be considered, and thus no worrying about
material ageing. Inventory control points can therefore be avoided.
However, it will cost more to keep and increase complexity by putting a customer order point
into the factory. A new consolidation point would thus have to be created upstream, before
manufacturing. Another weakness of this scenario would be the capacity in the factories.
Numerous changes upstream will be required as the current capacity is not high enough with
current resources. Resources could however be increased as capacity in the Tallin factory (ESS)
used to be higher, but many resources could be cut off when postponement to ESH was
introduced. A backwards shift would instead require more resources, proper sourcing to the
factories, and thus increased costs. Other consequences of the scenario that can be seen as
weaknesses are lead times. If the customers have urgent needs, it would be impossible with
Scenario 1 to deliver a cable for the next day as an example. Moreover, what if something goes
wrong in the Supply Chain? There are no spare cables ready to be shipped, this scenario would
be highly susceptible for disruptions. All urgent cases would be impossible to handle and acting
quickly would be very difficult. Furthermore, one must consider the flexibility of the site as
well. John Hislop stated that sites are never ready, site plans change or move, different sites
come into plan and configurations change.
Other points discussed were that the standardization seen as a strength for this scenario is not
as simple as one can believe. Interviewee 2 said it would require a large team and several years
to solve the issue of productification. His team is currently developing templates to simplify
comparison between 3PPs and the global portfolio, but they need to be followed as well. The
amount of 3PPs is consistently increasing nonetheless and the product reduction would
therefore not be simple to determine if current products can replace the 3PPs. Another
important reflection made by Interviewee 1 was that all 3PPs should not be sourced from
upstream, concrete towers would for instance have high distribution costs. Despite this, the
ESH should not have any problems with capacity. Interviewee 1 explained that the hub in Borås
is gigantic and that its full surface is not utilized, there would however be good planning
required and understanding of an updated global portfolio. Parallelly, more resources will have
to be put on the factories where good factory warehouses will be required to keep a good buffer
of the products.
Conclusively, Scenario 1 is a good scenario which works for all three market types (Flow, Split,
Direct), it even creates the possibility of shipping directly from the ESS/EMS to the sites
without using the ESH. However, the risk of disruption would have dramatic results and could
lead to a loss of customers, Interviewee 4 stressed the fact that it would require great planning
in order to work. It is strategically wise to have local warehouses and 3PPs.
5.3.2 Scenario 2 - Moving Purchasing to ASPs
Discussing the second scenario revealed that its major strength would be a large reduction in
tied up capital with inventory being put in ASPs’ warehouses, with a Vendor Managed
Inventory approach. On their part, ASP’s can utilize their network and technical knowledge to

67
deliver 3PPs on demand which can be consolidated at their own warehouses before being
brought to the customer’s site. This would result in ASPs’ charging Ericsson for their
accomplished service, resulting in a new source of income which can motivate them in working
faster, reduce lead time but mostly help in increasing responsiveness. Moreover, ASPs’ would
take on all the risks, relieving pressure from Ericsson’s shoulders.
Despite the numerous advantages, the scenario has the weakness that it requires heavy
investments and all risks have to be taken by ASPs in the form of tied up capital, inventory
handling, material ageing etc. Also, ASPs might not even have capacity to manage this
scenario, it would require investments. Many firms have connections but lack resources to build
warehouses and handle a transitional learning period. Another issue involves the possibility of
packaging corruption along the way to the customer. ASPs will add 3PPs to complete the final
offering but might corrupt the Ericsson packaging which might result in a lower credibility of
the solutions, damaging Ericsson’s image. Moreover, products sourced by ASPs have the risk
of not being up to standards. The customer site is still Ericsson’s responsibility, their reputation
will take a hit, not the ASPs. The local sourcing might also have issues and ASPs should have
Ericsson involved in each contract as a guarantee of payment. Otherwise, firms might not want
to sell, they might require the name of an established company.
Nonetheless, the scenario remains a great option for Ericsson. Not all ASPs can handle this
new type of responsibility and height of investments, however, Ericsson could help these firms
in building the warehouses. For the ASPs less inclined because of risks and tied up capital,
Ericsson could formulate agreements which would result in a share of risks and therefore
avoiding the tying up of too much capital. Also, for Ericsson’s issue of 3PPs not being up to
standards, there is a possibility of setting up a quality control point. Elsewise, quality
requirements can be formulated in early contracts, stopping ASPs from sourcing low quality
products. This might however demotivate the 3PLs as their potential profit margin would
shrink. Despite this, Interviewee 1 expressed that if he had money he would gamble on this
investment. There is a global gap in the market. There is no firm that has created this network,
and it could be utilized for other companies than Ericsson to increase profit. Similarly to
Scenario 1, Interviewee 5 pointed out that this scenario would also require heavy planning for
it to work well, international communication is often more complex and difficult than one
might expect.
5.3.3 Scenario 3 - Moving Purchasing to One Trusted Supplier
The advantages of the third scenario are almost identical with the second scenario. However,
this scenario benefits the advantage that all purchasing is going through one supplier instead of
several ASPs. Moreover, these suppliers might have better accessibility to various types of
material and are more inclined to find better deals. These suppliers have the technical
knowledge but only need the warehouses and a contract with a firm that can handle shipping
for them. The weaknesses of this scenario are shared with the second, however, it is less
complex than the second scenario and visibility should also be higher. ASPs can on their end
keep their regular routines.
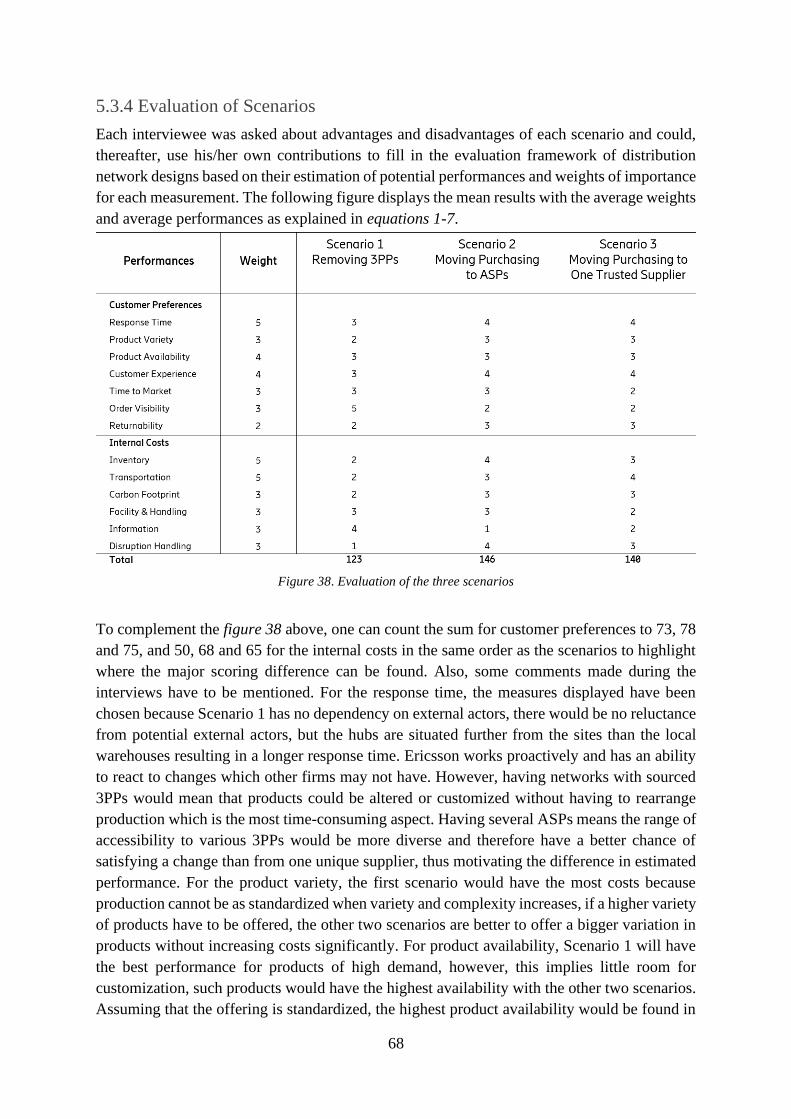
68
5.3.4 Evaluation of Scenarios
Each interviewee was asked about advantages and disadvantages of each scenario and could,
thereafter, use his/her own contributions to fill in the evaluation framework of distribution
network designs based on their estimation of potential performances and weights of importance
for each measurement. The following figure displays the mean results with the average weights
and average performances as explained in equations 1-7.
Figure 38. Evaluation of the three scenarios
To complement the figure 38 above, one can count the sum for customer preferences to 73, 78
and 75, and 50, 68 and 65 for the internal costs in the same order as the scenarios to highlight
where the major scoring difference can be found. Also, some comments made during the
interviews have to be mentioned. For the response time, the measures displayed have been
chosen because Scenario 1 has no dependency on external actors, there would be no reluctance
from potential external actors, but the hubs are situated further from the sites than the local
warehouses resulting in a longer response time. Ericsson works proactively and has an ability
to react to changes which other firms may not have. However, having networks with sourced
3PPs would mean that products could be altered or customized without having to rearrange
production which is the most time-consuming aspect. Having several ASPs means the range of
accessibility to various 3PPs would be more diverse and therefore have a better chance of
satisfying a change than from one unique supplier, thus motivating the difference in estimated
performance. For the product variety, the first scenario would have the most costs because
production cannot be as standardized when variety and complexity increases, if a higher variety
of products have to be offered, the other two scenarios are better to offer a bigger variation in
products without increasing costs significantly. For product availability, Scenario 1 will have
the best performance for products of high demand, however, this implies little room for
customization, such products would have the highest availability with the other two scenarios.
Assuming that the offering is standardized, the highest product availability would be found in

69
Scenario 1. Despite the customer experience having customization involved in its parameters,
the quality of life would be much higher in the first scenario because of the order visibility it
would have. A customer could check in real time exactly where their order is. This
measurement was therefore made with the assumption that the standardized solutions satisfy
the customer and that the order visibility is more important than customization, hence why one
supplier has a better performance than having multiple ASPs handling purchasing. For
returnability, the second and third scenarios have actors closer to the customer. Returning a
product in Scenario 1 would mean sending it longer upstream in the Supply Chain, thus
motivating for a weaker performance. For inventory, the second and third scenarios have
almost outsourced a majority of its inventory while the first scenario requires more use of
inventory in the factories than it previously did. This impacts next measurement as
transportation for scenario one will be huge. The other two as well, but shorter ones.
Consequently, the carbon footprint is impacted as well, however one might think that the first
scenario should have a lower footprint because of fewer transportations. Despite these, the
production will increase and that is where the majority of emissions are caused. The same
logical sense can be made about facilities and handling, Scenario 1 will have much fewer
facilities but the complexity of handling should not be underestimated in the beginning, the
other scenarios will have lower handling complexity and therefore costs but will still require
numerous facilities, but not necessarily from Ericsson. With the assumption that the second
and third scenarios can build their own warehouses, these two will have the best performances.
For information, the first scenario would have the highest performance as it only travels
internally, the other scenarios require good communication with external companies where
there are numerous factors that can slow down the flow of information such as incompatibility
of data files etc. As an example, Interviewee 2 mentioned having received data in a .pdf
originating from Word, having thus no way of smoothly putting the data. Finally, for the
disruption handling, the first case is the worst. There are no external actors that could be utilized
to compensate for a lack of production for instance. The other two scenarios help build
relationships with suppliers where there is possibility for upscaling. If Scenario 1 is adopted
preparations should be made for an eventual disruption.
When it comes to evaluating the three scenarios from solely customer preferences, Interviewee
1 lifted the reality that the customer wants everything delivered to their door, as fast as possible
and does not want to pay extra. This generalization would mean that the first scenario would
have the worse measurement of performance as the distance between finished product and
customer would be longer than the other two.
5.3.5 Production Costs & Capacity
To complement Interviewee 1’s contribution in his interview, another interview was held with
a Head of Supply Chain Management and a Head of Operations from the Tallinn ESS
(Interviewee 6 and 7) to discuss the first scenario from a manufacturing perspective, to
complement the managerial one.

70
A first comment that was made was that if one were to look at Ericsson’s history, about 30 to
40 years ago, one could observe that Ericsson produced everything by itself, without third party
products. Interviewee 6 mentioned that there is a reason that Ericsson moved away from such
a strategy. The products categorized in the as-is-visualization were shown to the interviewees
and they both stated that these products are commodities and that is why they were purchased
from vendors in the first place. They both continued by explaining that storage and production
capacity to produce some of the items on the list, however, it would be impossible to produce
them at competitive prices. If they were, nothing would stop the customer from ordering them
separately and thus tailor the solution on their own. Moreover, the interviewees stressed that
with current processes the lead time for the ex-3PPs would be too long. Also, many of the
products cannot be produced with resources in Tallinn, despite storage not being an issue, to
produce base station antennas is impossible without new technologies and would require
several investments. Besides that, many of the products do not comply with the current
environment, manufacturing and assembling processes in place, a long period of change and
adaptation would be required. In addition to this, there is the example of batteries that have
issues that are antecedent to the production. There would be a logistics complication as many
chemicals needed to produce batteries are fought for as numerous vehicle manufacturing
companies are producing more and more electrical cars and other parts required come from
locations far away from the ESS.
Ultimately, Interviewee 7 informed that there are on-going discussions of currently produced
products in the ESS that are becoming commodities with time. He believes that products show
trends of being outsourced instead of bringing in more to be manufactured. However, both
interviewees do not call the first scenario impossible or unfeasible, but that it is not cost
effective and might have more hidden challenges.
5.3.6 Infohub
When searching for a solution to find better specifications about 3PP HW and the Global
Portfolio, the interview with the Project Support revealed that he is conducting a project which
will help provide templates for the product descriptions of the portfolio and thus hinder future
unclearness and uncertainties. His project has identified that there are transparency issues, there
is limited knowledge of active and obsolete local products. The quality of the data is also not
optimal because it can be difficult to comprehend product characteristics. The project is
currently aiming to improve the visualization of the digital catalog and wants to enable
comparison, searching and branding. Before this point, the project acknowledged the same
issue observed above when comparing specifications of 3PP HW with the Global Portfolio that
the Global Portfolio did not include specifications of importance. Hence, these were added in
the mentioned template. An example of the visualization can be seen in figure x below:

71
Figure 39. Description Template of the Product Portfolio
However, as seen in figure 39, the description will not be enough to compare 3PP HW with the
purpose of selecting “the better option” in terms of price. The project will however provide a
much better structure of the global portfolio which can be utilized in doing so by the InfoHub.
Therefore, the Project Support suggested an interview with an ICT Consultant, the third
interviewee.
The InfoHub has previously been referred to in this thesis during the workshop, but what is it
really? The InfoHub is a structured workflow that will permit user-friendly productification of
local third-party products to implement them in Ericsson’s systems. The InfoHub will be able
to provide a distinction between local 3PPs (HW, services etc.) and thus enable visibility and
control of the purchased products to improve sourcing and supply. To achieve this the InfoHub
will secure good data quality and that it is available for the right people. One of the key benefits
of the workflow would be shortened lead time as the set-up time for 3PP HW is very long and
nothing is automated, everything is manual. The new automated process will notably hinder
duplication of products, products will always be given a product number and the description
field is mandatory - a product cannot be created without filling in a description. Such avoidance
would thus eliminate duplication of the productification, saving time and therefore money.
However, the InfoHub does not have a tool for comparison based on technical aspects or costs,
but the data will be available. With the enrichment of the Global Portfolio a manual comparison
can be performed. Moreover, the InfoHub will not be able to solve the current issue of
providing better descriptions for existing 3PP HW, as believed notably by Respondent 7, the
tool will only ensure that all needed information will be available when making future
productification. The inclusion of existing products will require a discussion with each CU to
manually add products of interest, solving the issue of visibility of these products. This task
will be facilitated as the number of products are being cut down, the clearing is not in the scope
of the InfoHub.

72
The InfoHub will thus help a lot but not solve all problems. It will contain a lot of dropdowns
and many fields will be mandatory thus hindering future problems. However, there will not be
anything hindering the use of other languages than English. Descriptions will still be able to be
in several languages, but it will be possible to specify which language it has been written in.
There is no naming convention defined in the system for now, but it is something that can be
implemented in the future as well as a text validation of the “correct language”.

73
6. Discussion
In the following section the thesis will discuss its results by utilizing all contributions included
in this thesis with the goal of providing relevant arguments to answer the research question
and deliver good recommendations for the case company. Similarly as in Empirical Findings,
the reader has to be warned that contents from the InfoHub and Workshop do not directly give
solutions to the research question, but they highlight challenges that can be considered as
arguments for selecting one strategy over another.
6.1 InfoHub, Workshop and Transition Challenges
To begin this discussion, the aspect of the InfoHub and its role must be brought up as it is
regarded as a critical tool for a potential change to the first scenario. Scenario 1 involves
removing the 3PP HW from purchasing and reallocating it in production, produced Ericsson
hardware from the ESS or the EMS. It was found out in the pre-study that it was probable for
Ericsson to already have identical products in its global portfolio and that numerous 3PPs were
duplicates of themselves. Finding all corresponding products in the global portfolio would
therefore significantly reduce the number of products and initiate a first step towards
transitioning to the mentioned first scenario. As this thesis developed the as-is-visualization, it
was eventually found out that comparing 3PP HW with the global portfolio based on product
description was difficult despite the obtained categorization. Numerous products lacked
description and even product number, they only had a product category. Finding a specific
corresponding product in the global portfolio was therefore impossible. One can observe in the
empirical findings that only guesses of potential replacements could be found with the example
of the jumper cables in figure 36. Numerous others could be found but never was it 100 percent
certain that the corresponding products in the global portfolio were identical. The descriptions
lacked specifics and often required technical knowledge about the products that was not
possessed and the time to ask every responsible for each product was not existent. However,
the products in figure 35 are evidence that there are numerous duplicates in the global portfolio
that are being locally sourced instead of being manufactured internally. Why this is the case
was not investigated for each individual product in reason of the time frame and the setting of
2020 - the spreading of the Covid-19 obstructed communication as many employees did not
have time to answer a master thesis student. Instead, a general answer appeared in both the
workshop and with the interview with the Change Lead, interviewee 4. In MELA and in other
market areas, the customer units do not have to share their decisions with EAB. They can decide
on their own which products should be sourced and why. It is therefore possible that lead times
available locally are shorter than ordering from the ESS/EMS. Customer units put the customer
in focus and the customer needs their order as quickly as possible. Also, it is possible that
purchasing the product locally can be cheaper, it can however be a value/cost trade-off. A
parallel could be drawn to the workshop where it was mentioned that despite CUs having found
better local deals, they should all order from the ESS/EMS, this with hopes in obtaining
economies of scale. Moreover, the packaging originating directly from the hub is less likely to
have been corrupted along the way. However, if the lead time is too long one might understand
why CUs would opt for identical local solutions. This issue was brought up during the interview

74
with Interviewee 4 who gave the example of a customer wanting an order within seven weeks,
but that the supply chain manager could not guarantee delivering everything before twelve
weeks, the result was utilizing sourcing of 3PPs to deliver within the required time frame. If
such decisions are taken, they must be added in the data with a comment on why it was chosen
over an internally manufactured product. Such simple measures would facilitate a potential
transition to the first scenario and would help the firm on how it proceeds with third party
products to result in an eventual organizational alignment, and lead to increased savings,
according to sourcing, by permitting reduction of the product portfolio.
Another point which was mentioned during the workshop and which was investigated further
during this thesis was the InfoHub. A general observation made during the workshop was that
a lot of assumptions made were based on the InfoHub solving the productification issue of
3PPs. The workshop leaders, Workshop Leader 1 and 2, presented the InfoHub as the key to
the reduction of the product portfolio. However, the interview revealed that the InfoHub will
not be able to deal with current data issues presented in the empirics. The InfoHub is a new
efficient way of productifying 3PPs which ensures to obstruct the same errors made when
productifying duplicates for instance. The description field is mandatory and the product will
automatically be given a product number, thus stopping the situation of figure 37 from
reproducing itself. Moreover, the InfoHub will have all necessary data present and visually
present in a user-friendly manner. Parallelly the templates developed by Interviewee 2’s team
will present the global portfolio in a similar user-friendly manner which will facilitate a
comparison with 3PPs from the InfoHub. Therefore, Ericsson will dispose of two great tools
that permit a comparison between sourced products and ones that are manufactured. However,
this statement is only valid for products that will be productified from the implementation of
the InfoHub. The 3PP HW identified in this thesis will still require the massive technical
knowledge previously mentioned. Both Respondent 2 and Interviewee 2 estimated that it would
take a team and a couple of years to solve such an issue. In spite of this, WS Participant 1
suggested an alternative during the workshop which could be worth trying out. His suggestion
was to delete the 3PPs from the system. Since many of the products are duplicates would mean
that many would be deleted without causing any change in the ordering behavior. Other 3PPs
have also a very low order quantity which would not impact Ericsson significantly. Also, this
would obligate 3PPs to be registered correctly in the InfoHub and help the structure of 3PPs
and not require speaking to a multitude of people if only 3PP HW should be filtered out, as
opposed to how it was done in this thesis. The InfoHub is therefore a great tool for the future
but not the solution to identify what was deemed as unidentifiable or “impossible to know”
products as seen in figure 37. It will however permit a future product portfolio reduction as WS
Participant 5 described that MANA had done, where the InfoHub already is live and working.
6.2 Distribution Network Design Selection
One can observe from the results obtained in the MCDA-framework, in figure 38, that the
highest scoring scenario was the second one with decentralizing purchasing to ASPs, closely
followed by the third scenario involving outsourcing purchasing to one trusted supplier. The
first scenario involving the removement of purchased 3PPs was the one which scored the lowest

75
and had a lot fewer points than the other two scenarios, but why? When only observing the
results from the customer preferences performances, the scenarios had similar rankings, but
they all were almost tied. It was the internal cost factors which Scenario 1 had the worst
performance by far. During the interviews, both the Supply Chain Manager and the Head of
Distribution Management stated that the first scenario is the best one. However, they both
implied that the complexity it involves concerning the planning notably makes it almost
unfeasible. As the interview progressed and mentioned performances were discussed, both
interviewees changed their minds and stated that the second and third scenario make more
sense. A critical reason for this change of mind could be the ongoing spread of the covid-19
virus causing numerous tragedies in the world and disruptions in the Supply Chain. This virus
is currently exposing numerous vulnerabilities of several firms and might force companies to
rethink their Supply Chain Management. Firms with a high reliability for raw materials or
workforce from China were heavily exposed in the early spreading of the virus. Fortunately for
Ericsson, its dependency on China was low thanks to the movement of production to Tallinn,
Estonia. However, despite this low dependency, the firm had to restrategize and work
proactively. This bias of setting could be the reason why the first scenario received such low
performance for the ability to handle disruption. If the framework had been filled in last year,
results might not have been the same, but this setting highlights that despite numerous
advantages risk management is critical when selecting a procurement strategy. Another criteria
that might have led to different results would have been different weights. The chosen weights
were added to obtain an average alignment of what is important for Ericsson as a company.
However, it was noticeable from the results that different people valued different performances,
showing evidence that the firm is not aligned on how it should act and where it should go. This
was also observed during the workshop when the concept of RIKs was introduced as a form of
standardization. The workshop leaders believed in simplifying the offering while others lifted
the reality of customer tailored solutions. A standard cable does not work for everyone.
The theories found during this literature review, in the subchapters concerning Supply Chain,
can be utilized to develop the following framework which summarizes the consequences of
centralizing vs. decentralizing (and outsourcing) procurement. Each identified aspect can
therefore be utilized to thoroughly discuss obtained results for each scenario combined with
gathered data to generate appropriate recommendations and thus answer the thesis’ research
question. The following framework has been separated into financial, performance and
informational implications that various theories point towards in the literature review and can
be compared to the measurements of customer preferences and internal costs from the extended
Chopra (2003) framework:

76
Figure 40. Framework for centralization vs. decentralization of procurement based on a literature review
Observing the evaluation of the three scenarios, one can see that the first scenario did not
receive a good performance in the internal costs part, except for the flow of information.
However, the literature has several advantages financially when it comes to the centralization
of procurement; Cheng, Wan & Wang (2010) notably mentioned a decrease in transportation
costs. Despite this, scenario 2 and 3 outperformed the first in the transportation measurement.
This result is based on participants having acknowledged that all transportation from the hub
would be taken on by ASPs or the one trusted supplier, as opposed to the first scenario where
there is the extra transportation from the hub to the site. Also, that the transportation between
ESH and the ASP warehouse is shorter than the one directly to the site. The cost of the service
of the one supplier or the ASPs would then not become categorized as a transportation cost,
however if it was, the transportation costs would be higher for the second and third scenario.
This argument would comply with Cheng, Wan & Wang’s (ibid.) conclusion of possibilities
for economies of scale for transportation. This advantage could be even more utilized by having
an eventual fourth scenario corresponding to what was referred to as the “no frills offering”
during the workshop. This offering consists of bulk orders where the customer does not want
any installation or maintenance services, hence the ASPs would not be involved, and a possible
direct shipping could be made from ESS/EMS directly to the customer. This would simplify
gaining economies of scale as there would a single route without stops in ESH or various
warehouses. However, the no-frills box delivery is presented as a defined box delivery where
its constituents would be pre-decided according to data gathered of customer demand. This
facilitates planning and standardization for the factories but deducts value for the customer.
During the workshop, numerous participants were skeptical against the RIKs because of this
potential loss of value and because of the diversity in demand of third-party products.
Consequences would be a high number of boxes that would increase similarly to the number
of 3PPs instead of contributing to the reduction of the product portfolio. It was even joked
about that the same workshop would be held in the near future to discuss reduction of the RIKs.
77
There is therefore a decision to be made, either increase standardization or increase added value
for the customer. The last argument leads back to the weakness of lead time for the first
scenario, not having finished products close to the customer will increase lead time. However,
having a more standardized offering in the form of boxes would help counteract this negative
aspect. This financial aspect is complemented by the interview of the participants from Tallinn
who did not believe in the manufacturing of 3PPs. It would be very difficult to get competitive
prices and if the customers would be forced to pay for these, as they are included in the box-
offering, it would not result in customer satisfaction. A customer would rather buy the old 3PPs
from elsewhere.
Performance-wise the first scenario’s strengths displayed in figure 40 are not as clear in the
evaluation framework. The first scenario facilitates standardization as mentioned previously,
but it would therefore also simplify performance assessments and future cost-cuttings
according to Minas, Wright & Van Berkel (2012), as well as a better coordination of primary
activities because of decreased complexity (Gibson et al., 2013). These are advantages who are
not reflected in the evaluation framework but if added, would decrease the gap between the
total scores of the first scenario and the other two. Another performance measurement which
would instinctively have the same consequences would be Relationship Handling. Scenario 1
benefits from not having to source the 3PPs from local suppliers and therefore involves fewer
relationships to handle, making it easier (Bendoly et al., 2006) and can hence lead to better
quality and a possibility of sharing risk because of suppliers valuing a partnership more
(Bhattarcharya, Ghupta & Hasija, 2018). However, this might not be true when observing
manufacturing. The interviews with the Tallinn ESS revealed that manufacturing 3PPs
internally would require more sourced parts than initially needed. An example of this was the
batteries, which needed chemicals from various parts of the world, and where the chance of
getting a competitive price for them would be slim in reason of the demand from the car
manufacturing companies. Instead of having a multitude of suppliers downstream, Scenario 1
would result in having a multitude of suppliers upstream and therefore not decrease the
complexity of handling multiple relationships or gain advantages from using single-sourcing
(Angelis, 2018). Going back to the evaluation framework, one can see that one of the major
drawbacks of the first scenario is its inability to deal with disruption in comparison with the
other two scenarios. If an eventual incident to the manufacturing of 3PPs would happen, as it
did for Ericsson in March 2000 with the chips, Ericsson would not be able to reallocate
production in its other factories as difficult changes in process would be required, probably
new technologies, even greater planning than prior to the accident, a need for increased
production capacity and thus resources. The study by Norrman & Jansson (2004) shows that
not having production capacity in case of a crisis can have terrible consequences for the firm.
With the second and third scenario, the production is allocated in diverse areas and has
therefore minimized the risk of disruption. If one of the suppliers would have an issue, another
utilized one could upscale their production, also, it is easier to find a replacement for one
product than for many.
Information-wise is where Scenario 1 is vastly superior to the other two scenarios. This is
reflected in the order visibility and information measurements. During the workshop, it was

78
presented as one of the goals to have a real time order visualization as a tool to increase value
for the customer. The lastly mentioned one could check online exactly how the order is going,
where it is, and when to expect it. However, when multiple sourcing options are involved it
complicates this visualization. Only having Ericsson involved maximizes the visibility for both
the customer and for Ericsson. With a decentralized or outsourced procurement, there is the
issue of not knowing what they are purchasing and the risk of it not being up to standards.
During the interviews, it was mentioned that a quality specifications requirement list could be
discussed and added in the contract, but the risk is still there, and in the end, the customer
would blame Ericsson for faulty products, not the ASPs or the One Supplier. However, as
literature suggests, centralizing procurement would increase visibility and decrease complexity
(Favre, Findlay & Zanker, 2016) so that a better understanding of the organization is developed
and to then aligning it with the firm’s vision and strategies (Moncza et al, 2015). Decentralizing
or outsourcing procurement can result in losing understanding in products and of what
customers really need, a knowledge that the sourcing department would lose. Moreover, it
would require sharing a lot of data to optimize planning with the outsourced purchaser which
would be a challenge for secrecy (Sadeghi, Mousavi & Niaki, 2016). Also, as found out in the
interview with the Project Support, the sharing of data involves challenges in the forms of
compatibility of systems. His example was receiving data from external firms to Ericsson in
.pdf, not compatible with SAP Hana. Thus, testifying for the informational superiority of the
first scenario.
For the second and third scenario, both customer preferences and internal costs measurements
scored high and with little total difference. There is therefore a need to describe differences
more thoroughly. As literature suggests that outsourced purchasers can benefit from better local
deals because of their superior knowledge to a company like Ericsson (Moncza et al., 2015;
Van Weele, 2018), there is a possibility that suppliers might not want to sell to small purchasers
such as ASPs, they might require the involvement of a larger company for business security
and for branding reasons. This financial aspect is not reflected in the framework but would
favorize the first and third scenario ahead of the second. Besides that, there is the issue of
storage facilities. Both Scenario 2 and Scenario 3 outperform the first one when it comes to
inventory costs as the Vendor Managed Inventory strategy can be utilized to create a win-win
situation (Nakano, 2020; Gibson et al., 2013), notably inventory would be lower for Ericsson
as it would be taken in charge by the ASP or the One Trusted Supplier. However, the difficulty
to persuade the external firm to build these facilities remains. It might be more challenging for
ASPs to invest in warehouses to handle the amount of inventory Ericsson has in comparison to
one larger supplier. In addition to that, all ASPs would have to be convinced or it would not
work. There is the opportunity to help the ASPs financially, but it might be more economical
to help one supplier and easier to maintain a relationship with a share of risk - thus gaining
benefits of centralization. Comparing this aspect might prove to be challenging as costs
involving outsourcing can often be underestimated (Platt & Song, 2010), but the framework in
Appendix A could be used as inspiration for more detailed cost comparisons. Apart from that,
both scenarios share the costs advantages of decentralizing such as being able to free up assets
used on purchasing to focus instead on core activities (Favre, Findlay & Zanker, 2016), and as

79
decreased overhead costs from bargaining, administration and logistics (Yang, Zhang & Zhu,
2016).
Performance-wise, one can observe from literature that Vendor Managed Inventory adopted in
Scenario 2 and 3 has the positive effect of decreasing the bullwhip effect (Disney & Towill,
2003) making life easier in the upstream Supply Chain because of forecast inefficiencies.
Moreover, this strategy increases responsiveness which was given the maximum weight in
figure 38 and which interviews revealed to be valued by the customer as well. However, the
results did not show any difference in responsiveness between the second and third scenario,
but the second scenario could have slightly higher responsiveness if it is situated closer to the
customer. Despite this, the third scenario might also have higher responsiveness as a customer
might need items purchased by different ASPs, a coordination of these might be difficult,
require intensive planning for it to work, and result in the third scenario being the most
responsive. What differs these scenarios in terms of performance is how dispersed risk is. 3PPs
would be allocated in numerous different warehouses in the second warehouse, but in the third
scenario might place larger warehouses strategically. Incidents at this warehouse could disrupt
the flow of the purchased products. Furthermore, the quality of these purchased products might
be more questionable when they originate from a multitude of suppliers (Platt & Song, 2010).
The third scenario will be led by a large brand which could utilize its notoriety as validation of
quality, controlling their procurement might not be as important as controlling the one done by
smaller businesses who would rather focus on margins than on scale. In regard to this aspect
of quality and control, the third scenario is superior to the second. Otherwise, these two
scenarios share the benefit of being able to provide the customer with a better experience
through customized products (Cheng, Wan & Wang, 2010) without reducing the efficiency of
manufacturing but the one of transportation. This might however contribute to a reduction of
lead time (Adenzo-Diáz, Lozano & Moreno, 2016) in comparison to the first scenario.
Ultimately, the mentioned advantages contribute to the two scenarios’ potentially better
handling of an eventual disruption. Having multiple ASPs purchasing can lead to each being
responsible for fewer products than the One Trusted Supplier. It would therefore be easier for
them to know where to find product alternatives with short notice. The third scenario has a
supplier which has a large network but organizing a way of handling disruption would take
longer than for multiple independent ASPs, therefore justifying their difference in performance.
When evaluating the second and third scenario from an informational aspect, the results from
the framework reflect what literature says. Information does not flow as well in these scenarios
in comparison to the first one and can therefore be object to the risk mentioned in the previous
paragraph surrounding quality. It is a loss of control for Ericsson of the complexity opted for
as well (Van Weele, 2018). Also, this impacts the order visibility performance where both
Scenario 2 and 3 share a low score. Distinguishing the two in this aspect is difficult because
both scenarios have dependency on external actors. Losing visibility in the sourcing can lead
to legal issues and Ericsson would take part of the blame. That is however why the third
scenario is superior to the second as it is only one company that needs to be trusted and which
is easier to communicate and build a trustworthy relationship with (Parry & James-Moore,

80
2016). A cooperation which, as previously mentioned, can be complicated because of
incompatibility of systems used for data analytics for instance.

81
7. Conclusion
This chapter will firstly present the theoretical implications of this thesis to set up the
managerial implications, limitation of the research and future studies
7.1 Theoretical Implications
After having conducted a single case study to investigate the opportunities surrounding
centralization, decentralization or outsourcing the purchasing function in a global Supply
Chain, the thesis has firstly been able to extend Chopra’s (2003) framework, see figure 13 and
38, and utilize it to select the most appropriate network design. This extension permits to
include environmental and sustainability aspects which are measures of performances many
modern companies care for. The study has also identified the state of the art when it comes to
literature’s perspective on centralization versus decentralization, see figure 40. There, a gap-
filling approach was identified based on the missing application to purchasing, however,
different observations could be categorized into the categories: Finance, Performance and
Information. Based on these observations and obtained empirics, this thesis has found the
following implications for centralization, decentralization and outsourcing:
Figure 41. Implications for centralizing, decentralizing or outsourcing procurement
The thesis’ research question can thus be answered through the developed framework visible
above, figure 41, which summarizes advantages and disadvantages of each strategy and enables
comparisons to be made. Moreover, a firm can utilize both the extended framework and figure
41 to select the most appropriate strategy for its purchasing allocation.

82
7.2 Managerial Implications & Limitations
The managerial implications of this thesis will first regard the scenario of removing 3PPs and
producing everything centrally instead, before showing a summarizing framework. Changing
to the mentioned scenario requires identifying replacement products as it was attempted during
this study. Ericsson is currently developing a tool which will simplify such a comparison, but
it will only work for 3PPs registered in the InfoHub. Numerous people that were contacted
during this thesis believed that the InfoHub would solve everything, this is not the case as
previously discussed. The first recommendation that can be given from this observation is that
there is a need to create a better understanding for members involved in an eventual transition
of what the software can and cannot do.
The second recommendation that can be given involves the unidentifiable products displayed
in the empirics. There is no way of identifying these and therefore no way of registering them
in the InfoHub to allow future comparisons. There are therefore two potential solutions to this
issue; the first would be to initiate a long discussion with each customer unit to attempt to find
out what these products are, based on the order quantity and the categorization developed
during this study. The second is based on the suggestion from WS Participant 1, where all these
3PPs should be deleted from the system to force each CU to register them anew when the
InfoHub becomes live. The lastly mentioned one should be done for 3PPs with small order
quantities but might result in chaos if applied on the products with order quantities, in that case
the first suggested solution might be more appropriate.
The third recommendation concerns the transparency issue with CUs. The lastly mentioned
party can act on their own and have made qualified judgements on why certain products are
chosen over internally manufactured ones, often with respect to lead times and costs. However,
there is no information about these choices in the system. The third recommendation is
therefore to create an organizational alignment on how to act in such cases. Should internally
manufactured products be prioritized despite customer demand? If external products are still
chosen over internal ones, the reason for this decision should be trackable to simplify the
evaluation of advantages versus disadvantages to decide for an eventual removement of 3PPs.
The fourth recommendation originates from the arguments made by the two interviewees from
the Tallinn factory. Manufacturing all 3PPs internally at competitive prices is impossible and
would move the complexity of dependency on external suppliers upstream for all the various
parts required. Despite the removement of 3PPs resulting in some economies of scale, nothing
stops the customers from getting the ex-3PP elsewhere. The suggested RIKs during the
Workshop would obligate the customer to have the product included in a kit but would result
in a lower added value for the customer. Having products of lower added value might result in
customers not opting for Ericsson’s offering.

83
Based on the results from the evaluation framework in figure 38 the decentralization scenario
by moving procurement to ASPs is the highest scoring one and therefore the best fit for
Ericsson. However, numerous aspects such as risk concentration, sharing of data or external
dependency were not included in the framework and might have resulted in the outsourcing
scenario being the most performing one. In addition to this, the participants share the bias
attached to COVID-19’s impact, on Supply notably, which led to lower scoring centralization
scenario than initially expected. When comparing advantages and disadvantages instead,
summarized in figure 41, one can see that both decentralization and outsourcing share common
pros and cons, however, outsourcing comes out as superior in terms of secrecy, complexity and
communication while having equal scores on other performances. Furthermore, the feasibility
of outsourcing is simpler to realize than to convince every ASP to build a bigger warehouse
and take on more risk and responsibility. While there is no existing equivalent to the One
Trusted Supplier as of the time of writing this thesis, there are more advantages to argue for a
company taking on this role. Interviewee 1, Supply Chain Manager, even stated that if he had
the money, he would immediately invest in this scenario. There is a similar risk to the one from
the second scenario with the ASPs, but in this case, there is one big contract and one big
partnership, leading to simpler communication and less complexity than the one of the
decentralization scenario. Creating a partnership with One Trusted Supplier is therefore the
optimal option for Ericsson, it is the most advantageous scenario on how to deal with
purchasing. In spite of this, realizing the outsourcing scenario under the current circumstances
of the COVID-19 will be close to impossible. If suppliers have not attempted this scenario
under good economical premises because of the risk, why would they now that they are bad
and will be for a while? Ericsson might not be in the state of making huge investments to help
realize it either. Nevertheless, this strategy should be the one opted for in a better future.
7.3 Future Research
There are numerous aspects of this thesis that would be interesting to investigate. Firstly, the
extension of the network design selection could be extended even more. During the discussion,
several aspects such as the difficulty of planning were mentioned but were not included and
might have led to different results. Since this thesis mostly focused on the implications on
allocating purchasing at various positions in the supply chain, all relevant measures of
performance were not included. Instead, qualitative contributions were added and helped to
more properly analyze each scenario. Secondly, the framework should also be properly tested
out to check for practical validity. Thirdly, there are the practical implications of the strategies
in this thesis. Advantages, disadvantages and further arguments are based on gathered data and
qualitative contributions, however, not all aspects might have been considered, they do not
contain all practical implications useful for a proper implementation. There is therefore a need
for a study on the implementation for each strategy which would verify and validate the
theoretical conclusions in this thesis and perhaps emphasize the importance of the InfoHub.

84
References
Adenso-Díaz, B., Lozano, S. and Moreno, P. (2016). How the Environmental Impact Affects
the Design of Logistics Network Based on Cost Minimization. Transport Research part D:
Transport and Environment, 48, pp. 214-224.
Aguinis, H. & Solarino, A. M. (2019). Transparency and Replicability in Qualitative
Research: The Case of Interviews with Elite Informants. Strategic Management Journal.
Alvesson, M. & Sandberg, J. (2011). Generating Research Questions through
Problematization. Academy of Management Review, pp. 247-271.
Alvizos, E. and Angelis, J. (2012). Servitized Capital Goods Offerings: Why Should the
Customer Accept? Proceedings of the 4th World Conference Production and Operations
Management.
Amaral, J., Billington, C.A. and Tsay, A.A. (2006). Safeguarding the Promise of Production
Outsourcing. Interfaces, 36, pp. 220-233.
Angelis, J. (2018). Single vs. Multi-sourcing. Lecture 2 - Production & Supply Chain
Management. Kungliga Tekniska Högskolan.
Banbury, J. G. (1975). Distribution: The Final Link in The Electricity-Supply Chain.
Electronics and Power, 21(13), pp. 773-775.
Barney, J.B. (2002). Gaining and Sustaining Competitive Advantage (2nd ed.). Englewood
Cliffs, NJ: Prentice Hall.
Baxter, P. and Jack, S. (2008). Qualitative Case Study Methodology: Study Design and
Implementation for Novice Researchers. The Qualitative Report, 13(4), pp. 544-559.
Bendoly, E., Blocher, D., Bretthauer, K.M., and Venkataramanan, M.A. (2007). Service and
Cost Benefits through Clicks-and-Mortar Integration: Implications for the
Centralization/Decentralization Debate. European Journal of Operational Research, 180 (1),
pp. 426-442.
Blomkvist, P. and Hallin, A. (2015). Method for Engineering Students. Lund:
Studentlitteratur.
Brewer, B.L., Ashenbaum, B. and Carter, J.R. (2013). Understanding the Supply Chain
Outsourcing Cascade: When Does Procurement Follow Manufacturing Out the Door?
Journal of Supply Chain Management, 49(3), pp. 90-110.

85
Brynjolfsson E., Hitt L.M., and Kim, H.H. (2011). Strength in Numbers: How Does Data-
driven Decision Making Affect Firm Performance?. SSRN. [Online] Available at:
https://ssrn.com/abstract=1819486 [Accessed 03 Feb. 2020].
Chopra, S. (2003). Designing the Distribution Network in a Supply Chain. Transportation
Research Part E, Logistics and Transportation Review, 39(2), pp. 123-140.
Chopra, S. & Meindl, P. (2013). Supply Chain Management: Strategy, Planning and
Operation. London: Pearson Education.
Christopher, M. (2011). Logistics & Supply Chain Management (4th ed.). Pearson Education
Limited.
Colicchia, C. and Strozzi, F. (2012). Supply chain risk management: a new methodology for a
systematic literature review. Supply Chain Management: An International Journal, 17(4), pp.
403-418.
Collis, J. and Hussey, R. (2014). Business Research: A Practical Guide for Undergraduate
and Postgraduate Students. OAI (4th ed.). Palgrave MacMillan.
Creswell, J. W. (2009). Research Design: Qualitative, Quantitative and Mixed Approaches.
Sage Publications.
Denscombe, M. (2014). The Good Research Guide: For Small-Scale Social Research
Projects (5th ed.). Open University Press.
Denzin, N. K. (1970). The Research Act in Sociology. Chicago: Aldine.
Disney, S.M. and Towill, D.R. (2003). The Effect of Vendor Managed Inventory (VMI)
Dynamics on the Bullwhip Effect in Supply Chain. International Journal of Production
Economics, 85(2), pp. 199-215.
Don, T.G. (2014). Single Versus Multiple Sourcing. Logistics Engineering Handbook: Taylor
& Francis.
Ellis, T. and Levy, Y. (2006). A Systems Approach to Conduct an Effective Literature Review
in Support of Information. NSU. Informing Science Journal, Vol. 9, pp. 181-212.
Ely, M., Vinz, R., Anzul, M. and Downing, M. (2005). On Writing Qualitative Research:
Living by Words. Bristol: Taylor & Francis e-Library.
Ericsson. (2017). Consolidated Balance Sheet. Annual Report 2017. [Online] Available at:
https://www.ericsson.com/assets/local/investors/documents/2017/ericsson-annual-report-
2017-en.pdf [Accessed 24 Jan. 2020]

86
Ericsson. (2018). About Ericsson - Corporate Information. [Online] Available at:
https://www.ericsson.com/en/about-us [Accessed 06 Jan. 2020].
Ericsson. (2019). Code of Business Ethics. [Online] Available at:
https://www.ericsson.com/en/about-us/corporate-governance/code-of-ethics [Accessed 24
Jan. 2020]
Fan, Y. and Stevenson, M. (2017). A review of supply chain risk management: definition,
theory, and research agenda. International Journal of Physical Distribution & Logistics
Management, 48(3), pp.205-230.
Favre, D., Findlay, C. and Zanker, J.C. (2016). The Case for Procurement Outsourcing.
Accenture. [online] Available at:
https://mthink.com/legacy/www.ascet.com/content/pdf/ASC5_wp_favre.pdf [Accessed 18th
Feb. 2020]
Fawcett, S.E. and Waller, M. A. (2011). Making Sense Out of Chaos: Why Theory is Relevant
to Supply Chain Research. Journal of Business Logistics, 32(1), pp. 1-5.
Ferreira, K. Tomas, R. & Alcântara, R. (2015). A Theoretical Framework for Postponement
Concept in Supply Chain. International Journal of Logistics, 18(1), pp. 26-61.
Flick, U. (2014). The SAGE Handbook of Qualitative Data Analysis. Chapter 20 - Analysing
Interviews. SAGE Research Methods.
Galbraith, J.R. (2014). Designing Organizations: Strategy, Structure, and Process at the
Business Unit and Enterprise Levels. San Francisco, CA: Jossey-Bass.
Gibbert, M., Ruigrok, W., and Wicki, B. (2008). What Passes as a Rigorous Case Study?
Strategic management journal, 29(13), 1465-1474.
Gibson, B.J., Hanna, J.B., Defee, C. and Chen, H. (2013). The Definitive Guide to Integrated
Supply Chain Management: Optimize the Interaction between Supply Chain Processes, Tools
and Technologies (1st ed.). Pearson FT Press.
Gephart, R. and Rynes, S. (2004). Qualitative Research and the Academy of Management
Journal. Academy of Management Journal, 47, pp. 454-462.
He, X., Ai, X., Jing, Y. and Liu, Y. (2015). Partner Selection of Agricultural Products Supply
Chain Based on Data Mining. Wiley Online Library (wileyonlinelibrary.com). [Accessed 10
Feb. 2020]

87
Herkert, J. (2005). Ways of Thinking About and Teaching Ethical Problem Solving:
Microethics and Macroethics in Engineering. Science and Engineering Ethics, 11(3), pp.
373-385.
Hofacker, C., Malthouse, E., and Sultan, F. (2016). Big Data and Consumer Behavior:
Imminent Opportunities. Journal of Consumer Marketing, 33(2), pp.89-97.
Hurwitz, J., Kaufman, M., Halper, F. and Nugent, A. (2013). Big Data for dummies.
Hoboken, NJ: John Wiley & Sons, Inc.
IBM. (2012). CRISP-DM Help Overview. IBM Corporation. [Online] Available at:
https://www.ibm.com/support/knowledgecenter/SS3RA7_15.0.0/com.ibm.spss.crispdm.help/
crisp_overview.htm [Accessed 03 Feb. 2020]
Jensen, D and Henry, G. (1998). Artificial Intelligence and Link Analysis. AAAI.
Kadiyala, S.S. and Srivastava, A. (2011). Data Mining for Customer Relationship
Management. International Business & Economics Research Journal, 1(6), pp. 61-70.
Kumar, V and Andrew Petersen, J. (2012). Statistical Methods in Customer Relationship
Management, Chapter 1, pp. 1-10.
Larose, D.T. (2015). Data Mining and Predictive Analytics. Hoboken, NJ: John Wiley &
Sons, Inc. 2nd ed.
Lewis-Beck, M. S., Bryman, A., and Futing Liao, T. (2004). Triangulation. The SAGE
Encyclopedia of Social Science Research Methods, Thousand Oaks, CA: Sage Publications,
Inc.
Lund Joergensen, P. and Pretorius, M. (2020). Change Lead; and Supply Business Partner,
Ericsson Group Supply, EMEA - MMEA. [21st of January]
Marttunen, M., Lienert, J. & Belton, V. (2017). Structuring Problems for Multi-Criteria
Decision Analysis in Practice: Literature Review of Method Combinations. European Journal
of Operational Research, 263(1), pp. 1-17.
Marshall, D, McIvor, R. and Lamming, R. (2007). Influences on Outsourcing and Outcomes:
Insights from the Telecommunications Industry. Journal of Purchasing and Supply
Management, 13(4), pp. 245-260.
Mentzer, J.T., DeWitt, W., Keebler, J.S., Min, S., Nix, N.W., Smith, C.D. and Zacharia, Z.G.
(2001). What is supply chain management. Mentzer, J.T. (Ed.). Supply Chain Management,
Sage, Thousand Oaks, CA, pp. 1-25.

88
Moncza, R.M., Handfield, R.B., Giunipero, L.C. and Patterson, J.L. (2015). Purchasing &
Supply Chain Management (6th ed.). Cengage Learning US.
Mulay, A. (2013). Decentralize to Improve Supply Chain Efficiency. EBN. [online]
Available at: http://www.ebnonline.com/author.asp?section_id=3315&doc_id=268703&
Accessed 07 Feb. 2020]
Nakano, M. (2020). Supply Chain Management - Strategy and Organization. Springer Nature
Singapore Pte Ltd.
New, S. (1997). The scope of supply chain management research. Supply Chain
Management: An International Journal, 2(1), pp. 15-22.
Norrman, A. and Jansson, U. (2004). Ericsson’s Proactive Supply Chain Risk Management
Approach After a Serious Sub-Supplier Accident. International Journal of Physical
Distribution & Logistics Management, 34(5), pp. 434-456.
Parry, G., James-Moore, M. and Graves, A. (2006). Outsourcing Engineering Commodity
Procurement. Supply Chain Management 11(5), pp. 436-443.
Platts, K.W. and Song, N. (2010). Overseas Sourcing Decisions - The Total Cost of Sourcing
from China. Supply Chain Management, 15(4), pp. 320-331.
Porter, M.E. (1985). The Competitive Advantage: Creating and Sustaining Superior
Performance. New York: Free Press.
Provost, F. and Fawcett, T. (2013). Data Science and Its Relationship to Big Data and Data-
driven Decision Making. Mary Ann Liebert, Inc, 1(1), pp. 1-22.
Pugh, S. (1981). Concept Selection: A Method That Works. Review of Design Methodology.
Hubka, V. (ed.).
Sadeghi, J., Mousavi, S.M. and Niaki, S.T.A. (2016). Optimizing an Inventory Model With
Fuzzy Demand, Backordering, and Discount Using a Hybrid Imperialist Competitive
Algorithm. Applied Mathematical Modelling, 40 (15-16), pp. 7318-7335.
Saunders, M., Lewis, P. and Thornhill, A. (2009). Research methods for business students.
Chapter 11. 5th ed. Harlow et al.: Pearson.
Schmitt, A.J., Sun, S.A., Snyder, L. and Shen, Z.J.M. (2015). Centralization versus
Decentralization: Risk Pooling, Risk Diversification, and Supply Chain Disruptions. Omega,
52, pp. 201-212.

89
Sock, J. R. and Boyer, S. L. (2009). Developing a consensus definition of a supply chain
management: a qualitative study. International Journal of Physical Distribution & Logistics
Management, 39, pp. 690-711.
Sople, V.V. (2009). Logistics Management. 2nd ed. Pearson India.
Sveriges Ingenjörer. (2019). Code of Honour. [online] Available at:
https://www.sverigesingenjorer.se/om-forbundet/sveriges-ingenjorer/hederskodex/ [Accessed
28 Jan. 2020].
Tan, K. (2001). A framework of supply chain management literature. European Journal of
Purchasing & Supply Management, Vol. 7, pp. 39-48.
Tranfield, D., Denyer, D. and Smart, P. (2003). Towards a Methodology for Developing
Evidence-Informed Management Knowledge by Means of Systematic Review. British Journal
of Management, Vol. 14, pp. 207-222.
Trkman, P., De Oliveira, M.P.V. and Mccormack, K. (2016). Value-oriented supply chain
risk management: you get what you expect. Industrial Management & Data Systems, Vol. 116
No. 5, pp. 1061-1083.
Van Miegham, J.A. and Dada, M. (1999). Price Versus Production Postponement: Capacity
and Competition. Management Science, 45(12), pp. 1631-1649.
Van Weele, A. (2018). Purchasing & Supply Chain Management: Analysis, Strategy and
Practice. London: Cengage Learning EMEA.
Vetenskapsrådet. (2017). Etik i Forskningen. [online] Available at:
https://www.vr.se/uppdrag/etik/etik-i-forskningen.html [Accessed 28 Jan. 2020]
Vermeulen, F. (2007). “I Shall Not Remain Insignificant”: Adding a Second Loop to Matter
More. Academy of Management Journal, 50(4), pp. 754-761.
Weikum, G. (2013). Data Discovery. Data Science Journal, 12(1), pp. 26-31
Wieland, A. and Wallenburg, M.C. (2012). Dealing with Supply Chain Risks: Linking Risk
Management Practices and Strategies to Performance. International Journal of Physical
Distribution & Logistics Management, 42(10), pp. 887-905.
Yang, F.X., Zhang, R.Q. and Zhu, K. (2017). Should Purchasing Activities Be Outsourced
Along with Production? European Journal of Operational Research, v. 257, (2), pp. 468-482.
Yin, R.K. (2003). Case Study Research: Design and Methods (3rd ed.). Thousand Oaks, CA:
Sage.

90
Zinn, W. & Bowersox, D.J. (1988). Planning Physical Distribution with the Principle of
Postponement. Journal of Business Logistics, 9(2), pp. 117-136.

91
Appendix A - Outsourcing Framework
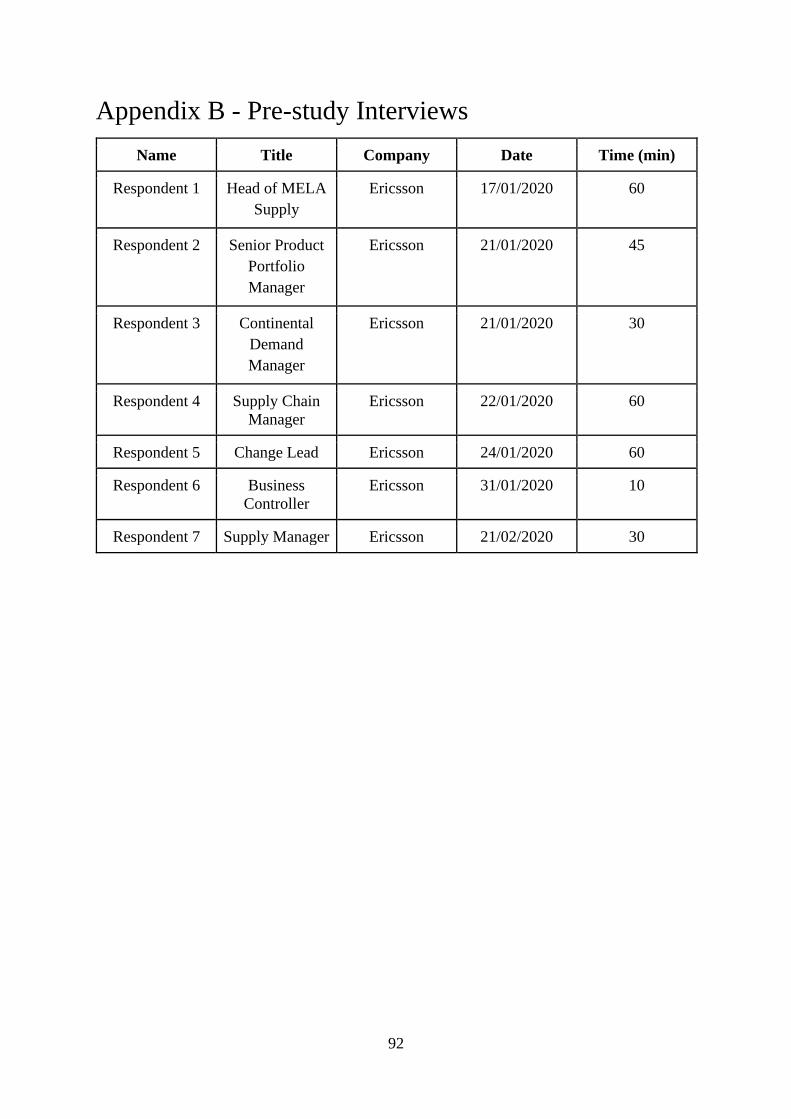
92
Appendix B - Pre-study Interviews
Name Title Company Date Time (min)
Respondent 1 Head of MELA
Supply
Ericsson 17/01/2020 60
Respondent 2 Senior Product
Portfolio
Manager
Ericsson 21/01/2020 45
Respondent 3 Continental
Demand
Manager
Ericsson 21/01/2020 30
Respondent 4 Supply Chain
Manager
Ericsson 22/01/2020 60
Respondent 5 Change Lead Ericsson 24/01/2020 60
Respondent 6 Business
Controller
Ericsson 31/01/2020 10
Respondent 7 Supply Manager Ericsson 21/02/2020 30

93
Appendix C - Literature Review Selection
Database Keyword(s) Number of
Results/Relevant
Results
Reference
Google Scholar “Data Science” AND
“Big Data”
65900/1 Provost & Fawcett
(2013)
Google Scholar “Data Mining” AND
“Predictive
Analytics”
143000/2 Larose (2015)
Brynjolfsson, Hitt &
Kim (2011)
KTH Primo “CRISP-DM” 983/2 Larose (2015)
IBM (2012)
Google Scholar “Data Mining” AND
“Customer
Relationship”
29600/1 Kadiyala &
Srivastava (2011)
KTH Primo “Data Mining” AND
“Supply Chain”
58629/1 He et al. (2015)
KTH Primo “Supply Chain” 448040/3 Nakano (2020)
Porter (1985)
Banbury (1975)
Powell & Gauri
(2008)
KTH Primo “Purchasing” AND
“Supply Chain
Management”
100827/2 Van Weel (2018)
Moncza et al.
(2015)
KTH Primo “Logistics
Management”
333537/2 Nakano (2020)
Sople (2009)
KTH Primo “Integrated Supply
Chain Management”
213527/2 Gibson et al. (2013)
Stevens (1989)
Moncza et al. (2015)
KTH Primo “Vendor Managed
Inventory”
24291/3 Nakano (2020)
Gibson et al. (2013)
Sadeghi, Mousavi &
Niaki (2016)
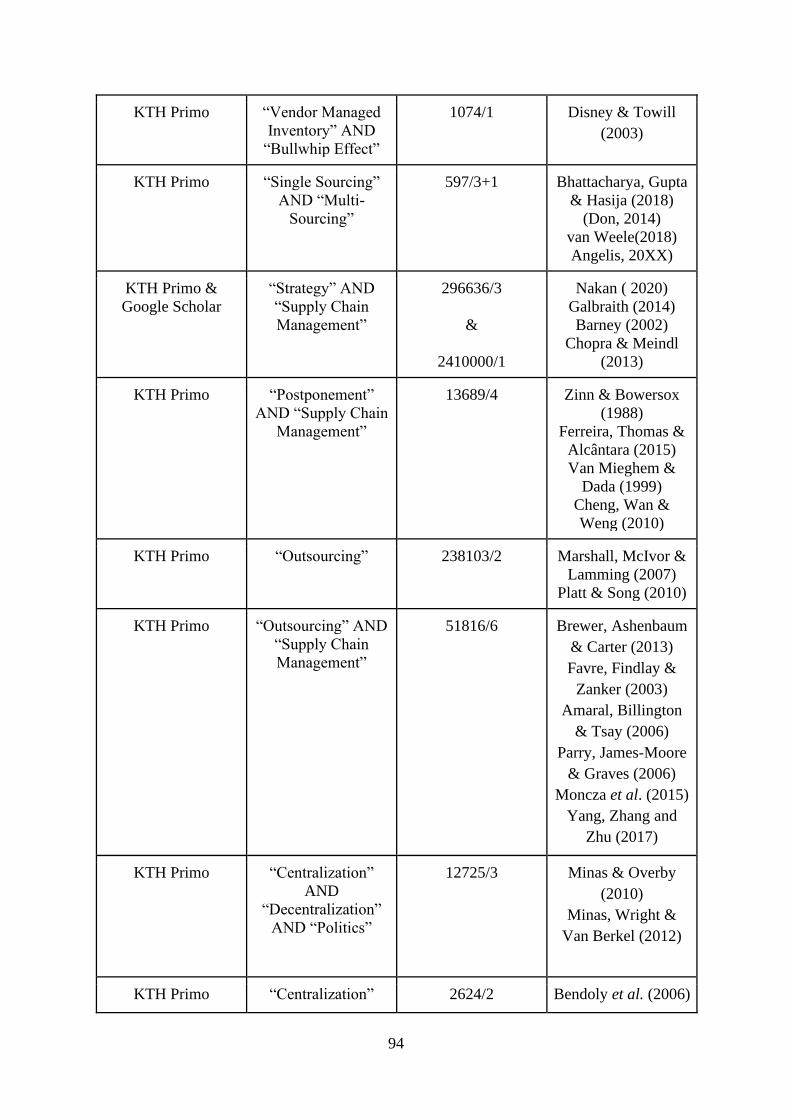
94
KTH Primo “Vendor Managed
Inventory” AND
“Bullwhip Effect”
1074/1 Disney & Towill
(2003)
KTH Primo “Single Sourcing”
AND “Multi-
Sourcing”
597/3+1 Bhattacharya, Gupta
& Hasija (2018)
(Don, 2014)
van Weele(2018)
Angelis, 20XX)
KTH Primo &
Google Scholar
“Strategy” AND
“Supply Chain
Management”
296636/3
&
2410000/1
Nakan ( 2020)
Galbraith (2014)
Barney (2002)
Chopra & Meindl
(2013)
KTH Primo “Postponement”
AND “Supply Chain
Management”
13689/4 Zinn & Bowersox
(1988)
Ferreira, Thomas &
Alcântara (2015)
Van Mieghem &
Dada (1999)
Cheng, Wan &
Weng (2010)
KTH Primo “Outsourcing” 238103/2 Marshall, McIvor &
Lamming (2007)
Platt & Song (2010)
KTH Primo “Outsourcing” AND
“Supply Chain
Management”
51816/6 Brewer, Ashenbaum
& Carter (2013)
Favre, Findlay &
Zanker (2003)
Amaral, Billington
& Tsay (2006)
Parry, James-Moore
& Graves (2006)
Moncza et al. (2015)
Yang, Zhang and
Zhu (2017)
KTH Primo “Centralization”
AND
“Decentralization”
AND “Politics”
12725/3 Minas & Overby
(2010)
Minas, Wright &
Van Berkel (2012)
KTH Primo “Centralization” 2624/2 Bendoly et al. (2006)

95
AND
“Decentralization”
AND “Supply
Chain”
Schmitt et al. (2014)
KTH Primo “Centralization”
AND
“Decentralization”
AND “Distribution”
13720/1 Adenso-Díaz,
Lozano & Moreno
(2016)
KTH Primo “Network Design”
AND
“Distribution”
AND
“Supply Chain”
4931/2 Chopra (2003)
Chopra & Meindl
(2013)
KTH Primo “Supply Chain”
AND
“Capacity
Allocation”
874/1 Norrman & Jansson
(2004)
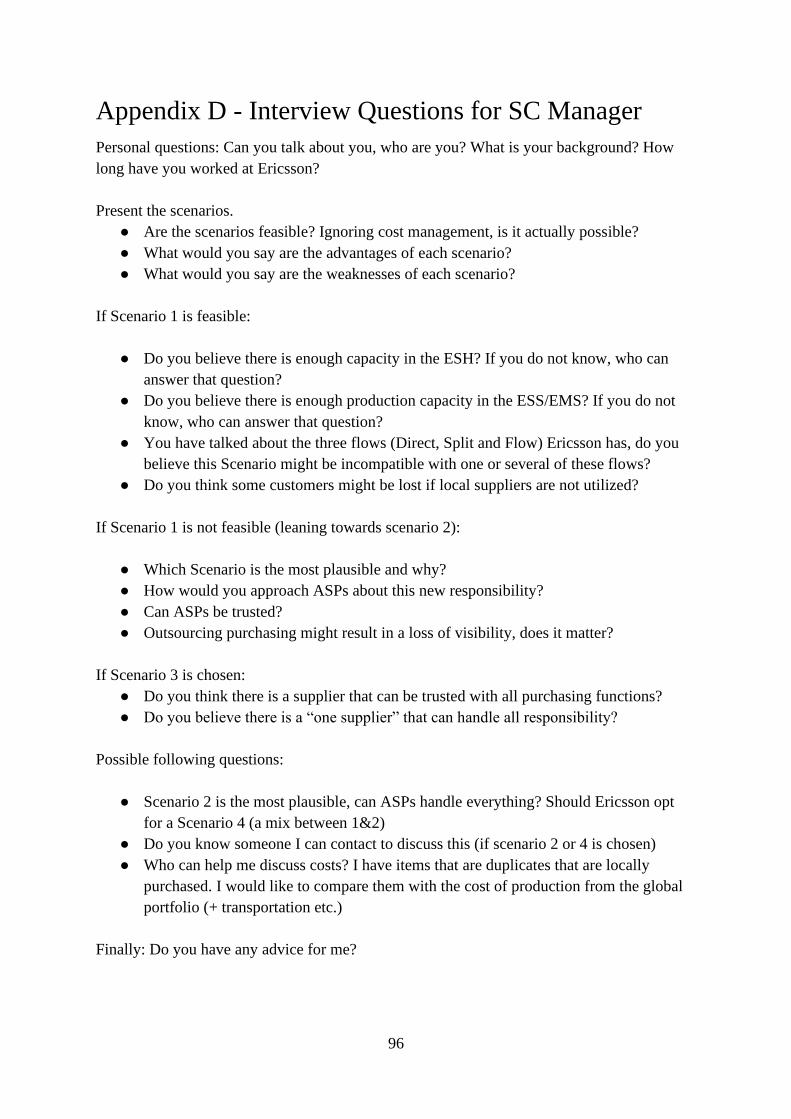
96
Appendix D - Interview Questions for SC Manager
Personal questions: Can you talk about you, who are you? What is your background? How
long have you worked at Ericsson?
Present the scenarios.
● Are the scenarios feasible? Ignoring cost management, is it actually possible?
● What would you say are the advantages of each scenario?
● What would you say are the weaknesses of each scenario?
If Scenario 1 is feasible:
● Do you believe there is enough capacity in the ESH? If you do not know, who can
answer that question?
● Do you believe there is enough production capacity in the ESS/EMS? If you do not
know, who can answer that question?
● You have talked about the three flows (Direct, Split and Flow) Ericsson has, do you
believe this Scenario might be incompatible with one or several of these flows?
● Do you think some customers might be lost if local suppliers are not utilized?
If Scenario 1 is not feasible (leaning towards scenario 2):
● Which Scenario is the most plausible and why?
● How would you approach ASPs about this new responsibility?
● Can ASPs be trusted?
● Outsourcing purchasing might result in a loss of visibility, does it matter?
If Scenario 3 is chosen:
● Do you think there is a supplier that can be trusted with all purchasing functions?
● Do you believe there is a “one supplier” that can handle all responsibility?
Possible following questions:
● Scenario 2 is the most plausible, can ASPs handle everything? Should Ericsson opt
for a Scenario 4 (a mix between 1&2)
● Do you know someone I can contact to discuss this (if scenario 2 or 4 is chosen)
● Who can help me discuss costs? I have items that are duplicates that are locally
purchased. I would like to compare them with the cost of production from the global
portfolio (+ transportation etc.)
Finally: Do you have any advice for me?

97
Appendix E - Interview Questions for InfoHub
● Personal Questions
Can you talk about you, who are you?
What is your background?
How long have you worked at Ericsson?
● Problem-specific Questions
What is the InfoHub? Can you mention the purpose and the goals of this project?
One of the key benefits is the tool for easier productification and how it will shorten lead
time. Can you elaborate?
The InfoHub is live in MANA. How did you approach the issue of 3PPs there? How did you
compare the 3PPs with each other and with the global portfolio?
Can the same methods be utilized for MELA or is each Market Area unique?
Will the InfoHub be able to identify 3PPs that lack product number and description?
If not, how should this issue be solved?
Will the InfoHub instore a naming convention for the product descriptions? In the DEMO
showed, the description is already typed. What happens if it is left blank?
(When writing questions) My current opinion of InfoHub is that it is making everything more
smooth, clear and user friendly. However, I do not see it fixing the issue of being unable to
identify what some 3PPs actually are. Do you agree? The only solution I see is to call the
people that made the order and ask for more specifications. However, the InfoHub will be
able to make a future comparison with the global portfolio much clearer.

98
Appendix F - Interview with ESS Tallinn
● Personal Questions
Can you talk about you, who are you?
What is your background?
How long have you worked at Ericsson?
● Problem-specific questions
Does Tallinn have the production and storage capacity for 3PP HW?
*Show categorization* These are the 3PP HW. Which are impossible for Tallinn to
manufacture? Elaborate
Are some possible to manufacture?
If they are possible, does Tallinn have the capacity?
If you do not have the capacity, what is needed (more people, new machines, more storage
room etc.)? Are those changes realistic?
Can the products that you cannot manufacture be manufactured in another ESS/EMS?
Do you have contacts with other production facilities (ESS/EMS) that could help me answer
these questions?

99
Appendix G - Other people involved
Name Title Company Date Communication
Helper 1 Sourcing Global
Process
Architect P2P
Ericsson 28/01/2020 Email & Meeting
Helper 2 Subject Matter
Expert Product
MD
Ericsson - Email
Helper 3 Supply Product
Manager
Ericsson 13/03/2020 Meeting
Helper 4 Global Category
Manager
Ericsson 03/04/2020 Email & Meeting