central west regional economic snapshot danielle ranshaw ceo western research institute central west...
TRANSCRIPT

CENTRAL WEST REGIONAL ECONOMIC SNAPSHOT
Danielle RanshawCEOWestern Research Institute
Central West Jobs Summit 2014
OUTLINE
• Features of our regional economy• Manufacturing in the Central West• Measuring the impacts of a large manufacturer• Alternative measures of impact• Issues facing manufacturing

CENTRAL WEST NSW
Central West Statistical Area 4

REGIONAL CONTEXT: TOP CONTRIBUTORS
Wholesale
Construction
Retail
Finance & insurance
Public admin
Education
Health & community
Agriculture
Manufacturing (All)
Mining (Coal and Other)
0% 2% 4% 6% 8% 10% 12% 14% 16% 18%
Key contributors
FTE Value Added
• At an aggregate level, Mining, Manufacturing and Agriculture are the top contributors to the generation of value added in the Central West.
• The top employment generators are Agriculture; Health & Community; and Manufacturing.

CENTRAL WEST GROWTH/DECLINE BY SECTOR
Best performers Chg 2006-11Mining 82%Administrative & Support Services 22%Professional, Scientific & Tech Services 16%Construction 12%Health Care & Social Assistance 12%Education and Training 8%
• Mining reported the strongest growth in employment between 2006 and 2011.
• Manufacturing and Agriculture, two historically important sectors, experienced declines.
Worst performers Chg 2006-11Transport, Postal & Warehousing -5%Retail Trade -7%Manufacturing -9%Financial & Insurance Services -13%Agriculture, Forestry & Fishing -15%Information Media & Telecommunications -16%

CENTRAL WEST GROWTH/DECLINE BY SECTOR (SHIFT SHARE ANALYSIS)
• Between 2006 and 2011, Manufacturing was a low employment growth industry across NSW (relative to the growth of all sectors) - even more noticeable in the Central West.
• With the exception of Mining, regional factors have had a negative influence on sectoral performance.
A shift-share analysis identifies industries that have grown at a faster or slower rate than state and industry averages.
From this we can tell which sectors are:
Outperforming in a high growth industryMining
Underperforming in a high growth industry
Includes:Construction
Accommodation and Food ServicesTransport, Postal and Warehousing
Underperforming in a low growth industry
Includes:Manufacturing
AgricultureWholesale and Retail

POST SCHOOL EDUCATION LEVELS
As at the 2011 Census, the highest post school qualification held was most commonly a Certificate III or IV (15% of the population).
• 7% held a Bachelor degree• 5% held a Diploma or Advanced Diploma• 1% held a Graduate Certificate or Graduate Diploma• 1% held a Postgraduate degree
Central West Rest of NSW Greater Sydney NSWPostgraduate 1% 2% 5% 3%Grad Dip / Grad Cert 1% 1% 1% 1%Bachelor degree 7% 7% 14% 11%Adv Dip / Dip 5% 6% 7% 7%Certificate level, nfd 1% 1% 1% 1%Certificate III and IV 15% 15% 10% 12%Certificate I and II 1% 1% 1% 1%
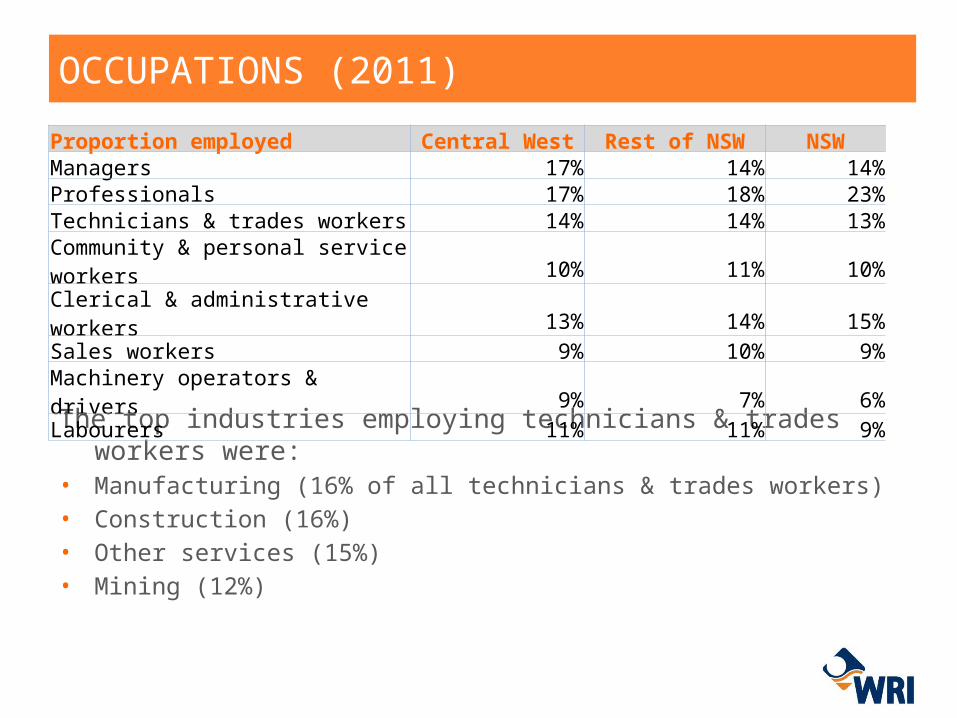
OCCUPATIONS (2011)
The top industries employing technicians & trades workers were:• Manufacturing (16% of all technicians & trades workers)• Construction (16%)• Other services (15%)• Mining (12%)
Proportion employed Central West Rest of NSW NSWManagers 17% 14% 14%Professionals 17% 18% 23%Technicians & trades workers 14% 14% 13%Community & personal service workers 10% 11% 10%Clerical & administrative workers 13% 14% 15%Sales workers 9% 10% 9%Machinery operators & drivers 9% 7% 6%Labourers 11% 11% 9%

OCCUPATIONS (2011)
The top industries employing managers were:• Agriculture (45% of all managers)• Retail Trade (11%)• Manufacturing (7%)
The top industries employing labourers were:• Manufacturing (19% of all labourers)• Accommodation & food services (16%)• Agriculture (12%)
The top industries employing Machinery operators & drivers were:• Mining (31% of all machinery operators & drivers)• Transport, postal and warehousing (21%)• Manufacturing (14%)

UNEMPLOYMENT
Unemployment in the Central West has remained below that for the Rest of NSW over the past five years, hovering around 5%.
Periodically, it has been below that for NSW as a whole, however, more recently has tracked closer to the NSW unemployment rate.
Mar-0
8
Jun-
08
Sep-
08
Dec-0
8
Mar-0
9
Jun-
09
Sep-
09
Dec-0
9
Mar-1
0
Jun-
10
Sep-
10
Dec-1
0
Mar-1
1
Jun-
11
Sep-
11
Dec-1
1
Mar-1
2
Jun-
12
Sep-
12
Dec-1
2
Mar-1
3
Jun-
13 -
1.0
2.0
3.0
4.0
5.0
6.0
7.0
Central West SAL4 Rest of NSW NSW

MANUFACTURING: REGIONAL COMPARISONS
Manufacturing Sector Comparison
Value Added $m
% total value added
Employment FTE
% total FTE employment
Income$m
% total income
Orange 159.1 9.1% 1,510 10.4% 88.4 9.8%
Bathurst 176.3 12.5%
1,726 13.3% 114.1 14.9%
Central West 726.9 8.9%
6,879 10.3% 463.7 12.4%
New South Wales 35,561.6 8.6%
279,500 9.0% 20,460.8 9.3%
The data shows that manufacturing plays a more significant role in the Central West, Orange and Bathurst, than it does for NSW as a whole.
Issues facing manufacturing are therefore more pertinent for Central West communities.

COUNT OF MANUFACTURING BUSINESSES
In the Central West there has been a slight reduction in the overall number of Manufacturing businesses between 2009 and 2012, down from 650 to 624 businesses.
• Looking at this by business size:• Largest falls were in small businesses (employing between 1 and 19 people)• Marginal increases in medium-large businesses (employing 20-199 people)
• Looking at this by business turnover:• Businesses with a turnover less than $2 million fell significantly; while• there was a marginal increases in businesses with a turnover in excess of
$2 million

OCCUPATIONS INVOLVED IN MANUFACTURING
• As at 2011 Census, the top occupations involved in manufacturing in the Central West were:• Technicians and trades
workers (27%)• Labourers (25%)• Machinery operators and
drivers (14%)• Managers (14%)
MEASURING THE IMPACT OF MANUFACTURERS….
WRI is often asked to estimate the contributions that an organisation makes to a region in terms of:• Gross Regional Product or industry value added;• FTE employment; and • household income.
We do this by first building a model of the economy of the region and then inserting the operational data (local expenditures and locally generated incomes) of the organisation into the model.
MEASURING THE IMPACT OF MANUFACTURERS….
The model works through the industry supply chain and the purchases of employees to show the initial and flow on effects that the organisation has on the region:
• The initial effect is the value of immediate changes in the regional economy as a result of an organisation’s operations.
• The flow on effect is the value of changes in the regional economy in the course of additional spending by other firms and industries linked to the organisation (suppliers).
By including wage and salary data in the model, the estimates produced also account for the expenditure of employees in the local economy.

STUDY: ELECTROLUX (2012)
Electrolux has a large presence in Orange Local Government Area employing:• 534 FTE staff from the
Orange LGA; and • a small number from
Blayney, Cabonne and Bathurst LGAs.
Total of 589 FTE staff across the Central West statistical area (SA4)

STUDY: ELECTROLUX
When flow-on effects are taken into account, Electrolux’s operations are estimated to generate the following in the economy of the Central West:• Approximately $80.92 million in value
added, contributing 1.01 percent of GRP;
• Approximately $53.38 million in income, representing 1.41 percent of household income; and
• Approximately 864 FTE jobs, representing 1.31 percent of the Central West’s total FTE employment.

STUDY: ELECTROLUX
The sectors most impacted by Electrolux’s operations are:
• Transport & storage• Finance & insurance• Retail• Health & community• Wholesale• Hospitality• Education
These impacts are the result of purchases made by Electrolux in the local economy and the expenditure patterns of its employees

ALTERNATIVE MEASURES OF IMPACT
Other studies WRI has conducted try to quantify some of the “on the ground” contributions made by an organisation’s workforce to a region, for instance:
• Family members who work in other sectors in the region; • Community services and facilities used by the workforce; • Schools supported through the children of the workforce;• Local volunteer groups who benefit from participation by members of
this workforce.
These measures are important when considering how the closure of operations may affect other community services and sectors.

ISSUES FACING MANUFACTURING
• Nationally, manufacturing’s share of output and employment has declined since the late 1970s and there has been a shift towards services boosted by specific government assistance.
• Reductions in assistance to manufacturing (tariff levels) since the 1970s, not matched OS.
• Over the past 5 years especially we’ve experienced a strong exchange rate and terms of trade (strong export prices for minerals and energy and weak import prices for manufactured goods from developing Asian economies).
• Greater investment in mining has put pressure on other sectors (including competition for labour).

WHY IS THIS A PROBLEM?
• Manufacturing historically has played a vital role in the economic growth of nations because of its impact on wealth, capital accumulation and productivity and because it generates significant flow-on impacts through incomes and jobs.
• The flow-on impacts of the manufacturing sector are typically some of the most significant.
• The decline of manufacturing as import penetration increases erodes domestic manufacturing’s productive capital, including technology and skills.
• Maintaining such a presence may be particularly important if manufacturing activity is seen as an important source of technological progress.