central plan outlay in crore rs 1999-002000-012001-022002-032003-042004-052005- 062006-07 elementary...
TRANSCRIPT


Central Plan Outlay in Crore Rs
1999-00 2000-01 2001-02 2002-03 2003-04 2004-05 2005- 06 2006-07
Elementary Education 2852 3150 3732 4302 4900 7943 12536 17133
Health 1062 1250 1393 1480 1651 2211 2719 3237
Family Welfare 3120 3200 3506 4174 4955 5300 6424 8052
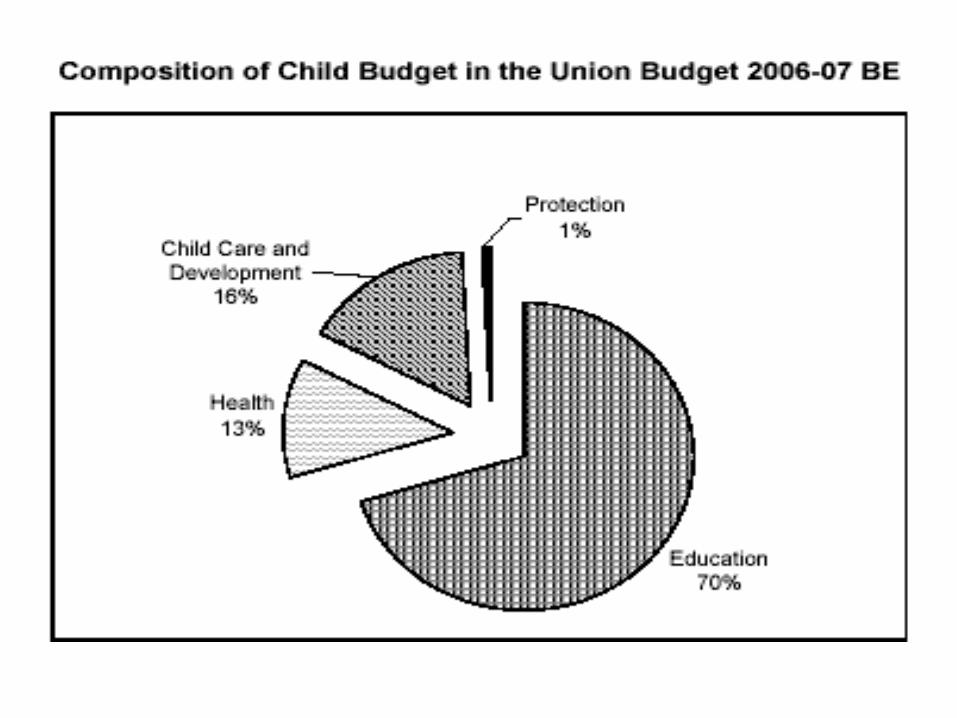
Women & Child Development 1250 1350 1642 2085 2600 2448 3931 4853
Water & Sanitation 2250 2750 3284 4761 6002

Flagships Programmes of Government of India
• Sarva Siksha Abhiyan – (10,041 + 8746 transferred from education cess = 18787 )
• Mid-day Meal Scheme• Rajiv Gandhi Drinking Water Mission• Total Sanitation Campaign• National Rural Health Mission• Integrated Child Development Services• National Rural Employment Gurantee Scheme• Jawaharlal Nehru National Urban Renewal
Mission
Total allocation in 2005-06 was 34927 crores – Total allocation in 2006-07 is 50,015, an increase of 43.2 %


State-wise Literacy Rates in Percentages
0
10
20
30
40
50
60
70
1951 1961 1971 1981 1991 2001
IndiaMadhya PradeshRajasthanUttar Pradesh
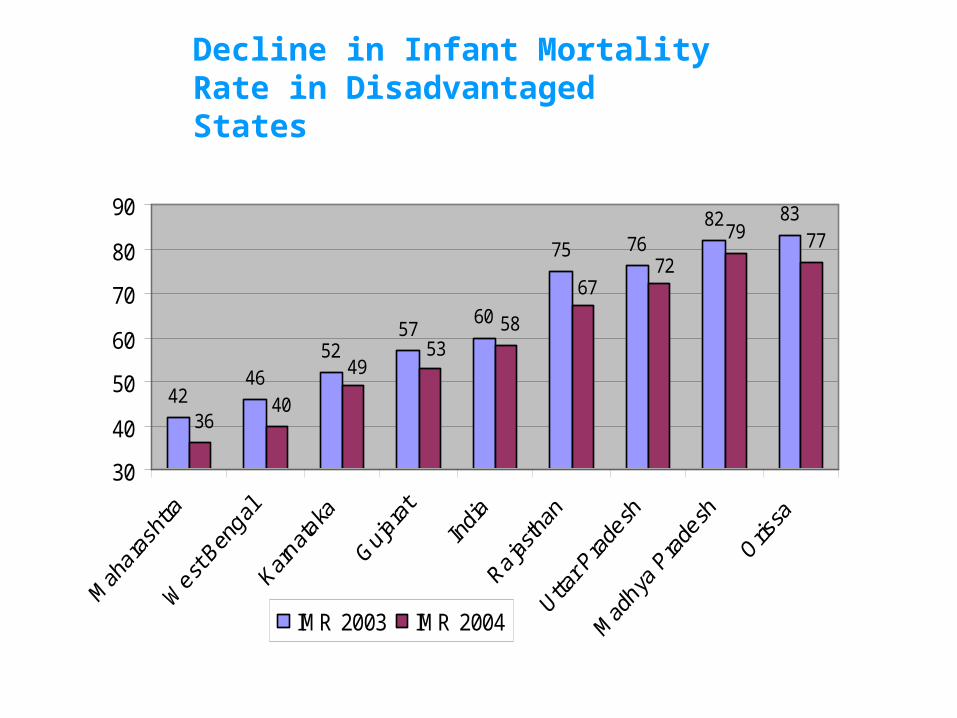
4246
5257
60
75 7682 83
79 7772
67
5853
49
4036
30
40
50
60
70
80
90
IMR 2003 IMR 2004
Decline in Infant Mortality Rate in Disadvantaged States

West Bengal: Progress Profile for Total Sanitation Campaign
0
2000000
4000000
6000000
8000000
10000000
2001-02 2002-03 2003-04 2004-05TSC achievem ents
No
. of
IHH
Ls/
HH
s
Physical Progress - allHHs with IHHLs
Physical Progress - AllBHP HHs with IHHLs

70%
51%
44%
8%0%
20%
40%
60%
80%
1993-94 Education Survey 2003-04 TSC Baseline
Water Supply Sanitation
Water and Sanitation in Schools

51
192
209
160
24
49
65
43
0.47
0.26
0.31
0.27
0
50
100
150
200
250
Sep-03 Oct-Mar 04 Apr-Sep 04 Oct-Feb 05*
No
. o
f d
ea
ths
0
0.05
0.1
0.15
0.2
0.25
0.3
0.35
0.4
0.45
0.5
Pe
rce
nta
ge
of
de
ath
No. of admission No. of deaths Death rate Trend line of death rate
A 10-bed sick newborn unit in a district hospital, air conditioned, with oxygen supply, nursing station and other cost effective and efficient equipment such as an infusion pump, blood gas analyzer, radiant warmer, phototherapy unit, etc. Six Stabilization Units - 4 functional - - Partnership – State Govt., District administration, Panchayat, District Health & FW sector, NGO, UNICEF
ADVOCACY, PLANNING, RESTRUCTURING, STAFFING, SUPPLIES, TRAINING, innovating (Newborn aides) – Mortality reduced by half.
Newborn Admission and Deaths - Newborn Care Unit Purulia District Hospital

Changes in Malnutrition levels in Bihar : through Nutrition interventions
•8% decline in the prevalence of underweight among children under three,
•20% increase in the use of colostrum feeding within one hour of birth,
•20% decline in the episodes of diarrhea in under-3, and
•30% increase in the consumption of adequately iodized salt

Location of poliovirus, India2003 - 20062003 2004
225 cases in 87 districts
134 cases in 43 districts
66 cases in 35 districts
2005
* data as on 8th May, 2006
26 cases in14 districts
2006*

ConstraintsBroad Issues:• Management and systemic bottlenecks particularly in
disadvantaged states• Low levels of community involvement in management of
services• Predominance of vertical, issue-specific approaches • Staffing: Frequent transfers, vacant posts particularly in
remote locations, poor performance of service-providers (i.e. attendance rates of teachers)
• Weak monitoring systems and limited use of evidence at local levels
• Political considerations have influenced programmatic decisions

ConstraintsSpecific to UNICEF:• Predominance of sectoral programmes with limited
focus on intersectoral collaboration• Limited emphasis on integrated behaviour change
communication• Overlap in responsibility between national and state
level officers• Limited capacity in certain states (Chattisgarh,
Jharkhand and Assam)• Lack of flexibility in certain procedures• Programme/project perspective with a need to realign
staff to becoming more involved in policy, systems and governance related issues
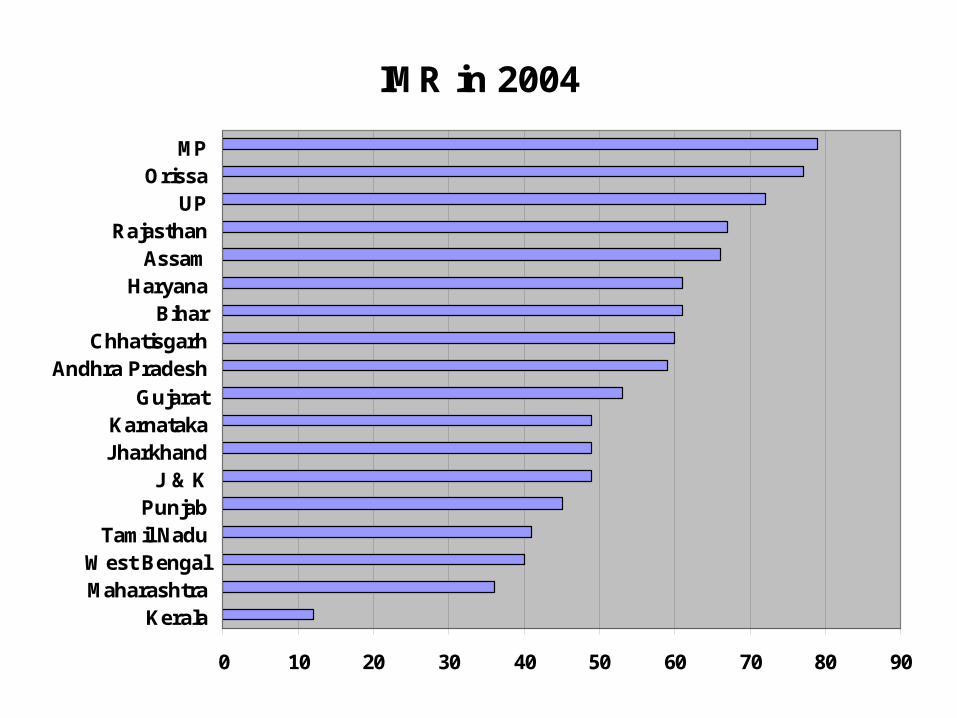
IMR in 2004
0 10 20 30 40 50 60 70 80 90
KeralaMaharashtraWest Bengal
Tamil NaduPunjab
J & KJharkhandKarnataka
Gujarat
Andhra PradeshChhatisgarh
BiharHaryana
AssamRajasthan
UPOrissa
MP

Economic Growth in Major Indian States
3
4
5
6
7
8
9
Ass
am
Utta
r Pra
desh
Oris
sa
Punj
ab
Bih
ar
Mad
hya
Prad
esh
And
hra
Prad
esh
Raj
asth
an
Ker
ala
Tam
il N
adu
Mah
aras
htra
Kar
nata
ka
Him
acha
lPra
desh
Har
yana
Wes
t Ben
gal
Guj
arat
All-
Indi
a
1980-19901990-2004
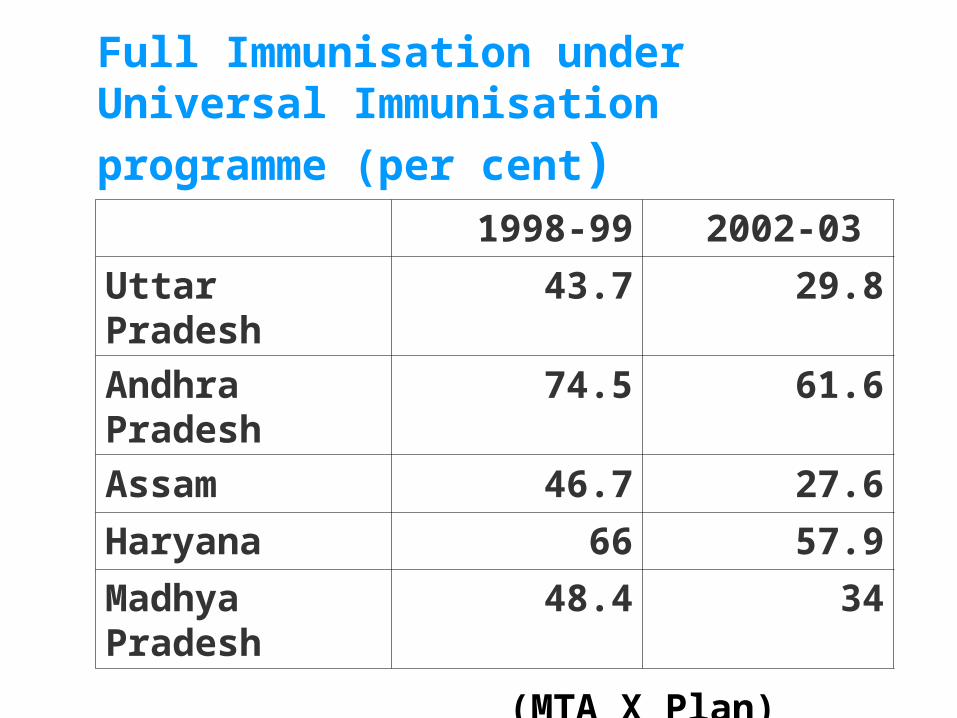
Full Immunisation under Universal
Immunisation programme (per cent)
1998-99 2002-03
Uttar Pradesh 43.7 29.8
Andhra Pradesh
74.5 61.6
Assam 46.7 27.6
Haryana 66 57.9
Madhya Pradesh
48.4 34
(MTA X Plan)

Share in rural poverty
0
5
10
15
20
25
perc
entag
e of t
he to
tal
1973-74
1999-00
1973-74 17.22 12.88 9.87 8.85 8.07 6.82 6.61 5.44 3.25 4.91 4.26 3.88 3.62 1.17 1.15
1999-00 21.32 19.48 9.32 11.25 6.47 3.01 4.17 7.44 4.77 3.1 1.09 2.85 2.06 0.53 0.62
UP Bihar WB MPMaharashtra
AP TN Orissa AssamKarnata
kaKerala
Rajasthan
Gujarat PunjabHaryan
a

Services Available in Rural UPServices Available in the Dwelling Unit
Poorest 20% Wealthiest 20%
Electricity 4% 28%Drinking water 25% 66%Services Available in the village
Primary school 59% 61%Middle school 6% 83%Pre-school centre 38% 60%Government Fair price shop (for cheap grains)
43% 57%

Figure -3.1 : Uttar Pradesh Government's Allocation on Social Services as a Proportion to Total Uttar Pradesh Budget (in %)
0.00
5.00
10.00
15.00
20.00
25.00
30.00
35.00
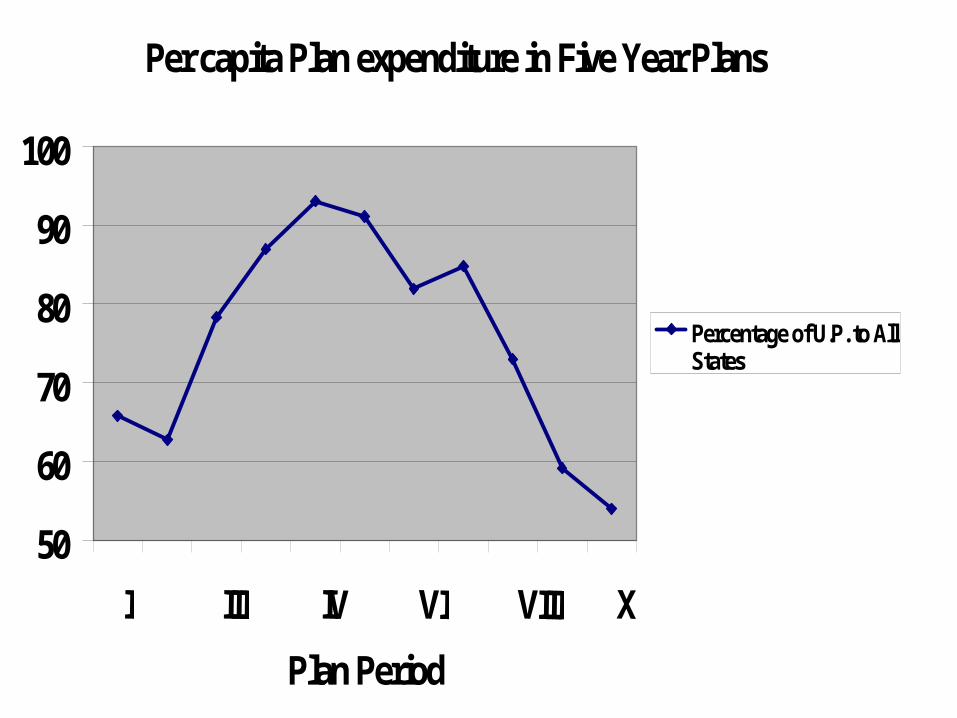
Per capita Plan expenditure in Five Year Plans
50
60
70
80
90
100
Plan Period
Percentage of U.P. to AllStates

Deterioration in governance
• Increasing politicization of administration, eroding the stability of tenure and undercutting managerial authority
• Administrative fragmentation leading to a proliferation of senior positions
• Little concern for correct reporting and outcome monitoring
• Building networks with patrons and politicians• System is committed to service provider, but not to
service provisionHonesty, impartiality, and commitment to public
welfare are no longer being demanded

Why are we not changing the system?
•Those who can change actually benefit from chaos & leakages
•They are indifferent, as they do not lose due to bad delivery
•Effecting change is beyond them (short tenure, risk, lack of consensus)
Laying down a road map and sequencing of reforms is as important as the reform itself
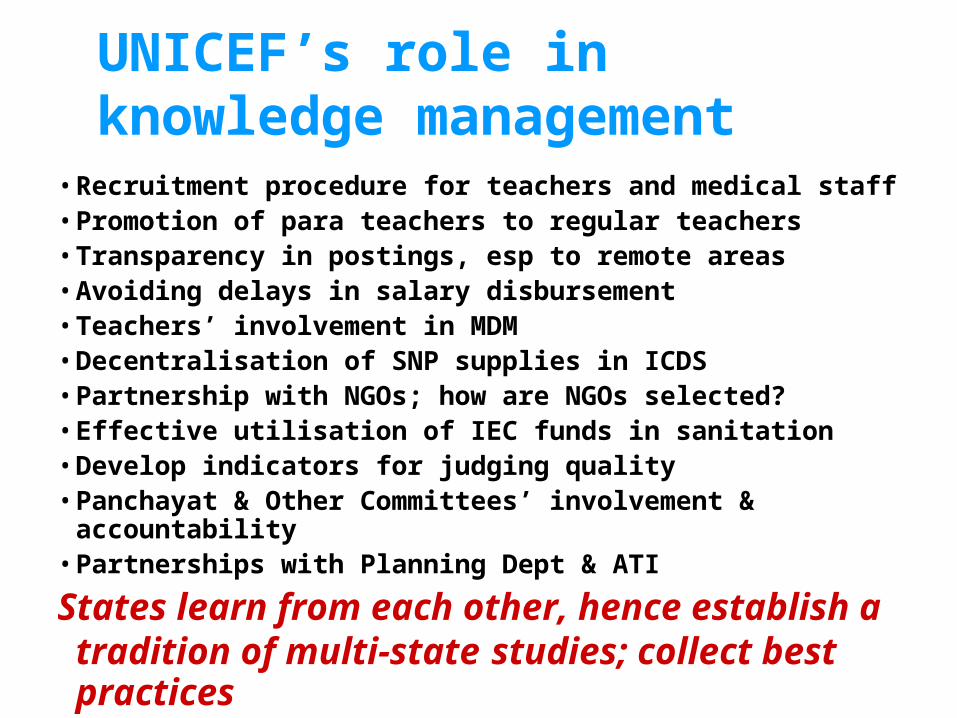
UNICEF’s role in knowledge management
• Recruitment procedure for teachers and medical staff• Promotion of para teachers to regular teachers• Transparency in postings, esp to remote areas• Avoiding delays in salary disbursement• Teachers’ involvement in MDM• Decentralisation of SNP supplies in ICDS• Partnership with NGOs; how are NGOs selected?• Effective utilisation of IEC funds in sanitation• Develop indicators for judging quality• Panchayat & Other Committees’ involvement & accountability• Partnerships with Planning Dept & ATI
States learn from each other, hence establish a tradition of multi-state studies; collect best practices

UNICEF Country Programme: New challenges and changing Role

Role of UN in the 21st Century
Building institutional capacities
Advocacy, standards and norms
Post crisis response

On-going Reform: ‘Three Ones’
There is a changing UN culture – from agency-specific to real UN system-wide thinking and joint results
Programme
Team
Leader

Uttaranchal
Maharashtra
Karnataka
Lakshadweep
Goa
Kerala
Tamil Nadu
Pondicherry
Andhra Pradesh
Dadra & Nagar Haveli
Rajasthan
Gujarat
Daman & Diu
Jammu & Kashmir
Uttar Pradesh
Madhya Pradesh
Haryana
Punjab
Delhi
Himachal Pradesh
Chandigarh
Jharkhand
Orissa
Chhattisgarh
Andaman & Nicobar Islands
MeghalayaBihar
Assam
Sikkim
Manipur
TripuraMizoram
Arunachal Pradesh
Nagaland
West Bengal
¤ Field Offices
Country Office
¤¤
¤
¤
¤
¤
¤
¤
¤
¤
¤
¤
¤
Kolkata
BhubaneshwarRaipur
Hyderabad
Chennai
Mumbai
Gandhinagar
Jaipur
Bhopal
LucknowPatna
Ranchi
Guwahati¤
New Delhi
UNICEF: A national and state presence

The Country Programme in 2003-2007
RCH CDN CE Educ CP HIVAIDS
Advocacy &
Partnerships
PME
Reduce IMR -MMRReduce Child MalnutritionEnhance Child ProtectionEnsure quality primary
educationPrevent HIVAIDS
Under - 3 School Age Adolescence
Empowered families & communitiesExpanded partnerships
Improved knowledge base on children

Summary of Key Results
• Progress with salt iodization in certain states, increase from 37% in 2003 to 57% in 2005.
• “Last mile” for polio • Vitamin A supplementation increased with positive implications for
well-being of children: i.e. 76.2% for the May 2005 round in 12 – 36 months children in Orissa
• While sanitation remains low nationwide, sanitary marts have transformed West Bengal: Model be scaled-up nationwide
• Water and sanitation facilities in schools dramatically increased, with positive implications for girls’ attendance and also changing behaviors within communities
• Effective models developed for reducing mortality in first month of life; reducing malnutrition and also increasing performance of schools. Challenge now to “go to scale” while maintaining quality and sustainability.

Changing role of UNICEF….
• Normative Agenda• Modeling innovative interventions • Knowledge Management and Analysis• Systems Strengthening at district level• Community Empowerment• Behaviour Change at household level
Promoting Political, Economic and Social Inclusion by: