central highlands (victoria) plantation potential...
TRANSCRIPT
Central Highlands (Victoria)Plantation Potential Analysis
Methodology And Results
July 1998
By
David Bush, Keith Lamb, Philip Tickle, Alison Pritchard
Bureau of Resource SciencesPO Box E11
Kingston ACT 2604
© Bureau of Resource Sciences 1998
This work is copyright. The Copyright Act 1968 permits fair dealing for study, research, news reporting,criticism or review. Selected passages may be reproduced for such purposes provided acknowledgment ofthe source is included. Reproduction for purposes other than these requires written permission from theBureau of Resource Sciences, PO Box E11, Kingston ACT 2604.
The work was prepared in the Bureau of Resource Sciences to support the joint Commonwealth andVictorian Central Highlands Regional Forest Agreement process.
Views expressed in the report are those of the authors and not necessarily those of the Commonwealth orVictorian Governments. The Commonwealth and Victoria do not accept responsibility for any advice orinformation in relation to this material.
Edited by: Dr Ray Spencer and Sally Kaufmann, Bureau of Resource Sciences
Copies are available from:
Bureau of Resource SciencesPO Box E11Kingston ACT 2604
Preferred way to cite this publication:
Bush, D., Lamb, K., Tickle, P., and Pritchard, A. (1998) Central Highlands (Victoria) plantation potentialanalysis: methodology and results. Bureau of Resource Sciences, Canberra.
The Bureau of Resource Sciences is a professionally independent scientific bureau within the Departmentof Primary Industries and Energy. Its mission is to enhance sustainable development of Australia'sresource industries by providing high quality scientific and technical advice to government, industry andthe community.
Bureau of Resource Sciences Internet address: http://www.brs.gov.au
Cover designed by Barbara van der Linden, Bureau of Resource Sciences
iii
Contents
1. SUMMARY 1
2. INTRODUCTION 2
2.1 SCOPE OF THIS STUDY 2
2.2 MARKET OUTLOOK FOR FOREST PRODUCTS 22.2.1 Domestic market outlook 32.2.2 World market outlook 3
2.3 EXISTING PLANTATION RESOURCE 42.3.1 Murray Valley plantation region 42.3.2 Central Gippsland plantation region 4
2.4 PLANTATION POLICY 52.4.1 National Forest Policy Statement 52.4.2 Wood and Paper Industry Strategy 52.4.3 Standing Committee on Forestry's 'Plantations 2020' 6
3. PLANTATION CAPABILITY AND SUITABILITY ASSESSMENT 8
3.1 CONCEPT OF PLANTATION CAPABILITY 8
3.2 CONCEPT OF SUITABILITY 8
4. PLANTATION CAPABILITY STUDY 11
4.1 PLANTATION SPECIES 114.1.1 Purpose of plantations 114.1.2 Products 114.1.3 Markets 114.1.4 Research and data 12
4.2 REGIONAL PLANTATION SPECIES 124.2.1 Minor species 134.2.2 Species selected for analysis 13
4.3 LAND CAPABILITY AND PLANTATION GROWTH 13 4.3.1Rating plantation capability 14
4.4 RESULTS OF PLANTATION CAPABILITY STUDY 18
4.5 DISCUSSION OF PLANTATION CAPABILITY 19
iv
5. PLANTATION SUITABILITY 20
5.1 TRANSPORT DISTANCE AND COST 20
5.2 PROPERTY SIZE/PRICE RELATIONSHIP 215.2.1 Estimation of unimproved land price 235.2.2 Suitability classes 245.2.3 Property size 25
5.3 RESULTS OF PLANTATION SUITABILITY ANALYSIS 26
5.4 DISCUSSION OF PLANTATION SUITABILITY 28
6. CONCLUSION 30
7. REFERENCES 31
APPENDIX I – GROWTH AND YIELD ESTIMATES 35
APPENDIX II – CLIMATIC VARIABLES AND SPECIES THRESHOLDS 38
v
LIST OF TABLES
Table 1: Results of suitability trials in and around the Central Highlands 12
Table 2a: Climate and soil matrix 17
Table 2b: Climate x soil product matrix 17
Table 2c: Climate and soil capability matrix 17
Table 2d: Climate and soil capability matrix (E. Regnans) 18
Table 3: Gross capable area by species 18
Table 4: Central Highlands property sales 23
Table 5: Suitability classes 25
Table 6: Area of Central Highlands suitable for plantations, by species 26
Table 6 (cont)): area of Central Highlands suitable for plantations, by species 27
Table 7: Indicative yields for Victorian plantation species averaged over 30 years 35
Table 8: Yield by species by suitability classes 36
Table 9: Summary of climatic requirements for plantation species 38
Table 10: Threshold parameters for climatic variables 39
Table 11: Range of required mean annual rainfall for each species 39
LIST OF FIGURES
Figure 1: Mean annual rainfall and productivity for soil depths of 10, 20, 30, 60and 400 cm (P. radiata, south-eastern Australia) 14
Figure 2. Layers used in GIS analysis 16Figure 3. Zones of equal economic opportunity for plantation investment
given estimated Mai and distance to market in Tasmania 21Figure 4. Location of processing plants receiving wood from the
Central Highlands region (eg. Kinglake) 22Figure 5. Relationship between property size class and price per hectare
(1991-1996 rural property sales records) 24Figure 6. Distribution of property size in the Central Highlands region
and its three sub-regions 25Figure 7. Plantation options: Scale and purpose 29
LIST OF MAPS (SEE END OF REPORT)
Map 1 Annual rainfall
Map 2 Soil capability
Map 3 Land cover and tenure
Map 4 Land suitability by parcel size
Map 5 Eucalyptus globulus: potential sites
Map 6 Eucalyptus nitens: potential sites
Map 7 Eucalyptus regnans: potential sites
Map 8 Pinus radiata: potential sites
Map 9 Acacia melanoxylon: potential sites
vi
ABBREVIATIONS AND INITIALISMS
Initialism MeaningAGPS Australian Government Publishing ServiceANU Australian National UniversityBRS Bureau of Resource SciencesCE Centre for International EconomicsCRA Comprehensive regional assessmentCRES Centre for Resource and Environmental StudiesCSIRO Commonwealth Scientific and Industrial Research OrganisationDEM Digital elevation modelDPlE Department of Primary Industries and EnergyElS Environmental impact statementFAFPIC Forests and Forest Products Industry CouncilFAO Food and Agriculture Organization (of the United Nations)GIS Geographic information systemGOIP Generic operations planMAI Mean annual incrementNFI National Forest InventoryNPAC National Plantations Advisory CouncilNPI National Plantations InventoryNIRE Department of Natural Resources and Environment (Victoria)RFA Regional forest agreementRWE Round wood equivalentSCF Standing Committee on ForestrySOFR State of the Forests ReportSPIS State Plantations Impact Study, VictoriaTIS Timber Industry StrategyVPC Victorian Plantations CorporationWAPIS Wood and Paper Industry Strategy
Central Highlands Plantation Potential Analysis
1
1. Summary
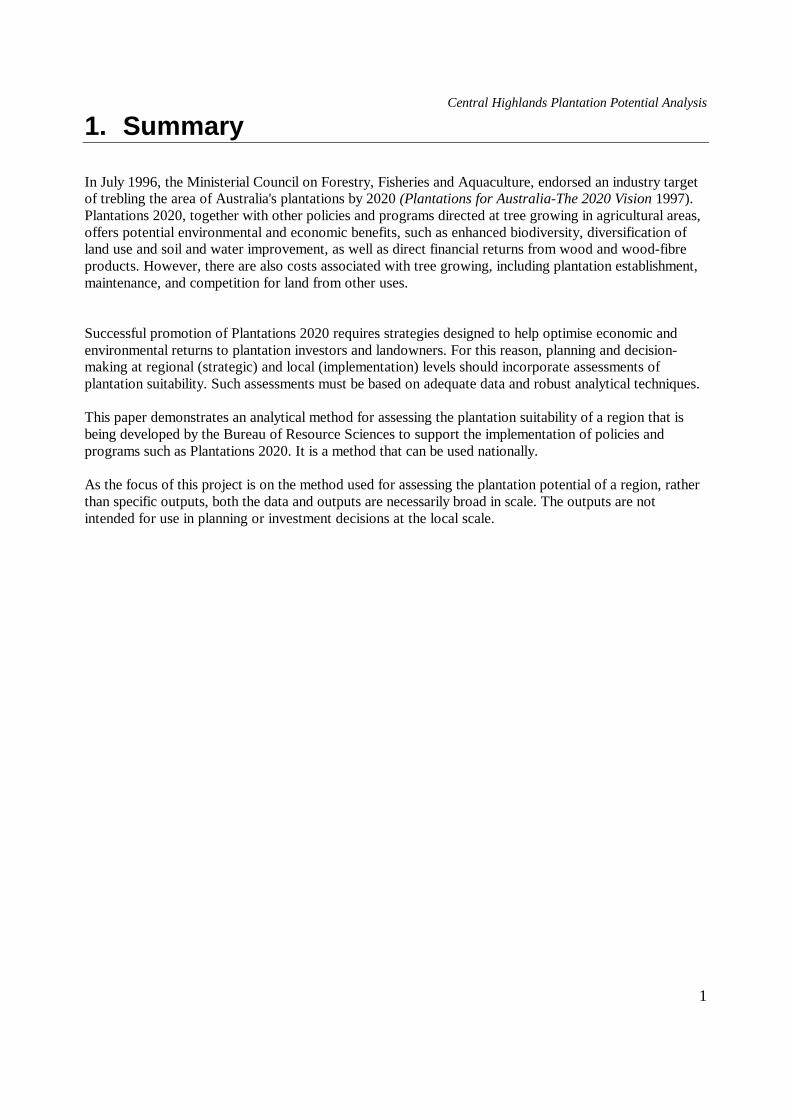
In July 1996, the Ministerial Council on Forestry, Fisheries and Aquaculture, endorsed an industry targetof trebling the area of Australia's plantations by 2020 (Plantations for Australia-The 2020 Vision 1997).Plantations 2020, together with other policies and programs directed at tree growing in agricultural areas,offers potential environmental and economic benefits, such as enhanced biodiversity, diversification ofland use and soil and water improvement, as well as direct financial returns from wood and wood-fibreproducts. However, there are also costs associated with tree growing, including plantation establishment,maintenance, and competition for land from other uses.
Successful promotion of Plantations 2020 requires strategies designed to help optimise economic andenvironmental returns to plantation investors and landowners. For this reason, planning and decision-making at regional (strategic) and local (implementation) levels should incorporate assessments ofplantation suitability. Such assessments must be based on adequate data and robust analytical techniques.
This paper demonstrates an analytical method for assessing the plantation suitability of a region that isbeing developed by the Bureau of Resource Sciences to support the implementation of policies andprograms such as Plantations 2020. It is a method that can be used nationally.
As the focus of this project is on the method used for assessing the plantation potential of a region, ratherthan specific outputs, both the data and outputs are necessarily broad in scale. The outputs are notintended for use in planning or investment decisions at the local scale.
Central Highlands Plantation Potential Analysis
2
2. Introduction
2.1 SCOPE OF THIS STUDYPlantations, as defined by the National Forest Policy Statement (1992), are 'intensively managed stands oftrees of either native or exotic species, created by the regular placement of seedlings or seeds' . In south-eastern Australia, they are typically of either exotic softwoods, commonly P. radiata, or nativehardwoods (Eucalyptus spp.). For the purposes of this study, the definition has been extended to includeirregular and less intensively managed plantings, including those intended for land improvement anderosion control. Plantations of this latter type may play an increasingly important role in the futureagriculture-forestry sector, frequently being referred to as farm forestry.
This study developed and applied a method of identifying areas of cleared freehold land in the CentralHighlands1 that would support hardwood and softwood plantations producing wood for a variety of enduses. Its purpose was to develop an analytical method that could be used to support Plantations 2020 andthe regional forest agreement programs by:
• developing methods to assess land for its capability and suitability for plantation development; and• identifying potential locations for plantation development in terms of biophysical capability and socio-
economic suitability.Outputs of this study include:
- Area statements classifying cleared freehold land in the Central Highlands in terms of its ability
to support plantations of radiata pine and hardwood species.
- Area statements and maps classifying cleared Central Highlands land suitable for plantation
development, based on a number of parameters.• Discussion of the utility and limitations of the assessment and the methodology used
2.2 MARKET OUTLOOK FOR FORESTPRODUCTS
The area of Australia's plantation estate at the end of 1994 was estimated at 1.043 million hectares (NFI1997). This estate provided almost half (48 per cent) of the annual timber harvest in that year (SOFRdraft, unpub.).
Estimates of wood yield from plantations for the year 2010 vary considerably (Turner & James 1997),ranging from 18.1 million cubic metres (Clark 1995), down to 13.5 million cubic metres (New ZealandMinistry of Forestry 1995), with Turner and James' own estimate of 17.3 million cubic metres at thehigher end of the range.
_______________________1Victorian Government policy restricts the clearing of native forest on public land for the establishment of plantations. Clearingnative forest on private lands for conversion to plantations is subject to native vegetation retention control to protect flora andfauna, and local government planning requirements. Consequently, plantation development opportunities are available only oncleared private land and some public lands that currently are not forested.
Central Highlands Plantation Potential Analysis
3
In the following decade, to 2020, it is estimated that wood yield will rise to approximately 20 million cubicmetres (NFI 1997). This latter prediction is based on data supplied by producers about the area and agestructure of existing plantations, and on projections of what the area of new plantations will be in themedium-term, estimated at some 20 000 - 40 000 hectares per year (eg. James et al 1995). (Fulfilling thePlantations 2020 goal requires an average 80 000 per year of new plantations).
2.2.1 Domestic market outlook
Forest products.
Projections of domestic demand for forest products suggest that the existing trade deficit may continue forthe next few years, although as a result of increased domestic production it will start to decline and shouldturn around by about 2005.
Australia has had a trade deficit of about two million cubic metres a year2 since World War II (Turner &James 1997). However, Neufeld (1997) predicts a trade surplus in softwood sawntimber by 2005-6 ,reaching around 0.8 million cubic metres by 2010 - 11 and the trade deficit in hardwood sawntimber isalso expected to reduce slowly, approaching equilibrium by 2010.
Under Neufeld's scenario, an average trade surplus of approximately 0.7 million cubic metres ofsawntimber a year is projected for the period 2005-2010.
Neufeld also expects that the domestic market for paper and fibre-based products will follow a similartrend of a continuing shortfall in the short-term rising to a modest surplus by 2005-10.
Plantation-based forest products.
Despite the projected growth in both exports of plantation products and substitution of locally grownplantation products for forest products currently being imported (import substitution), Australia is likelyto experience a net deficit in the overall trade of plantation products into the next century ( Neufeld 1997).Taking expected new plantings of up to 40 000 hectares per year into account, it is estimated that, inroundwood equivalents, this deficit will be around 1.3 million cubic metres a year by 2015 (Turner &James 1997).
2.2.2 World market outlook
World consumption of industrial wood is expected to increase by about 81 million cubic metres a yearduring the period 1993 to 2010 (FAO 1995 in Ferguson 1997), resulting in an estimated total worldconsumption of around 2.28 billion cubic metres annually.
At the same time, supplies of tropical timber from Malaysia and Indonesia are expected to declinesignificantly - by up to 30 million cubic metres a year (Johnson 1997; de Fégley et al 1997). Moreover,wood supply from the Pacific North-West of the United States and British Columbia in Canada iscurrently 50 per cent of the levels that pertained in the late 1980s, prior to the introduction of harvestingrestrictions aimed at conserving the forest habitat of spotted owls. It is estimated that supply will remainsignificantly below past levels (Ferguson 1997)._______________________2In roundwood equivalents, that is, the amount of unprocessed roundwood (or logs) needed to produce a given quantity of forestproduct. Using this common unit allows comparison between different forest products.
Central Highlands Plantation Potential Analysis
4
The combination of projected global economic growth and increased protection of native forests, withconsequent restrictions on harvesting, is expected to cause shortfalls in the supply of forest products.Ferguson (1997) estimates that by 2010 the global shortfall will be around 93 million cubic metres a yearfor softwood and 48 million cubic metres a year for hardwood. In the Asia-Pacific region it is estimatedthe deficit will be around 60 million cubic metres a year (de Fégley et al 1997). However, the predictedglobal shortfall is less than 5 per cent of total consumption (Ferguson 1997), and is predicated on thecurrently significant, but potentially unstable economies of China, India and Indonesia. Furthermore,should the shortfalls occur as predicted, it is likely that wood prices would rise, causing substitution ofwood products by non-wood products and use of products derived from logs of lower quality (Ferguson1997; de Fégley et al 1997). Nevertheless, the present analyses strongly indicate that the value of woodproducts will rise in response to increasing scarcity of high quality wood resources, especially in the Asia-Pacific region.
2.3 EXISTING PLANTATION RESOURCE
The National Plantation Inventory identified 15 plantation regions in Australia, based on economic woodsupply zones (NFI 1997). The Central Highlands region as defined for regional forest agreement purposesencompasses parts of the inventory's Murray Valley and Central Gippsland regions, and contains 10 320hectares of plantations, of which 7931 hectares (77 per cent) are held by the Victorian PlantationsCorporation and the remainder, 2389 hectares, are owned privately (NFI database unpub.). The resourcesof the Murray Valley and Central Gippsland regions are substantial, and support a significant forest-basedindustry. There is potential for wood from new plantations in the Central Highlands to provide rawmaterials for this existing industry. The Murray Valley and Central Gippsland regions are profiled inmore detail below.
2.3.1 Murray Valley plantation region
The Murray Valley plantation region extends north from Melbourne to the southern New South Walessoftwood district of Tumut and contains 167 400 hectares of plantations, almost all of which (96.3 percent) are softwood, mostly radiata pine-98 per cent of the 161 170 hectares of softwood plantations are P.radiata. There are 250 hectares of hardwood plantations, about 0.1 per cent of the region's total plantationarea (NFI 1997).
Wood flows from the region for 1995-99 are expected to be 1.7 million cubic metres a year, rising toapproximately 2.3 million cubic metres a year in the next two decades (2000-2020).
There are 34 processors of plantation wood in the region, producing wood pulp (from thinnings andharvest residues), sawlogs and veneer logs.
2.3.2 Central Gippsland plantation region
The Central Gippsland plantation region is located between Melbourne and Bairnsdale, and includes theStrzelecki Ranges. The region contains a total of 83 900 hectares of plantations, comprising 62 450hectares of softwoods (predominantly P. radiata) and 21 450 hectares of hardwoods, including E.regnans, E. globulus, E. nitens and a number of other species (NFI 1997). These plantations:
• provide wood flows that are projected to be 0.9 million cubic metres a year during 1995-1999, risingto 1.3 million cubic metres a year by 2010 and 1.7 million cubic metres a year by 2020; and
Central Highlands Plantation Potential Analysis
5
• supply seven major Central Highland processors with wood.
2.4 PLANTATION POLICY
2.4.1 National Forest Policy Statement
Australia's forest policy is prescribed at the highest level by the National Forest Policy Statement (1992).This policy was developed jointly by the Commonwealth Government and the State Governments, andpromotes the following objectives in relation to plantations:
• increasing commercial plantation development on cleared agricultural land and, where possible,integration of plantation enterprises with other agricultural land uses;
• increasing the productivity of existing plantations through improved technology, genetically improvedstock and selection of the best species and provenances; and
• encouraging industrial growers and, where appropriate, public forestry agencies to expand theirplantations to satisfy specific requirements.
The national policy also provides direction on economic, environmental and social issues pertaining toplantations and establishes the role of industry. Its key principles in these regards are:
• decisions to establish plantations for wood production should be based on the economic viability ofthe proposal;
• State and local governments will provide a planning framework that facilitates the development oflarge-scale industrial plantations;
• consistent with ecologically sustainable management objectives, the States should not clear publicland for plantations where this would compromise regional conservation and catchment managementobjectives.
2.4.2 Wood and Paper Industry Strategy
Following the statement of the national forest policy, the Commonwealth introduced the Wood and PaperIndustry Strategy (WAPIS) (Australia [Forests Taskforce] 1995). The strategy has the followingobjectives:
• to expand plantations and associated processing industries and promote full use of plantationresources;
• to develop large regional plantation and commercial farm forestry resources to provide reliable, high-quality supplies of wood for world-scale industries, plus associated landcare and environmentalbenefits; and
• to expand regional opportunities for employment in the plantation industries.
It was recognised that to implement the strategy successfully, it would be necessary to:
• identify and remove impediments to plantation investment;
Central Highlands Plantation Potential Analysis
6
• promote plantation development on cleared agricultural land;• establish farm forestry as an integral part of the plantation program;• improve research and development on plantations, including commercial farm forestry;• promote public access to information on plantations and farm forestry and their place in the wood and
paper industry;• integrate commercial tree growing with other environmental and agriculture initiatives.
Together, the national policy and the industry strategy provide a policy base for expanding Australia'splantations, but investment has been limited. According to Ferguson (1997), however, this situation ispoised to change as a result of work at State and local levels to remove disincentives to plantationinvestment, including freeing the sector from export controls. Although there is still a feeling of unease inthe eastern States, despite the downturn in profitability of the grazing industry-which is a majorcompetitor for land - Ferguson points out that structural adjustment issues favour a change in land use,and that the European Union's recent commitment to reducing greenhouse gas emissions should addmomentum to new plantation establishment.
2.4.3 Standing Committee on Forestry's 'Plantations 2020'
Plantations 2020 (1997) is a Commonwealth Government response to a proposal made by industry in1996 for a national approach to reform and development in the forest-based industries. The statement wasdeveloped by the Standing Committee on Forestry, for the Ministerial Council on Forestry, Fisheries andAquaculture. Fully implemented, it could provide the following outcomes:
• increase investment in Australia's plantation industry by $3 billion between 1997 and 2020;• increase farm incomes by 20 per cent as a result of farm forestry activities in higher rainfall zones;• convert the $2 billion trade deficit in wood and wood products into a surplus;• create 40 000 new jobs in rural areas.
The 2020 implementation plan lists four strategic imperatives and 28 associated actions required toimplement the vision (Plantation 2020 Vision Implementation Committee 1997). The strategicimperatives are to:
• boost the availability of suitable land;• ensure commercial incentives to encourage the development of the plantation growing and processing
industry;• establish a commercial plantations culture;• improve information flows.

Central Highlands Plantation Potential Analysis
7
This study is particularly relevant to Action Four of the first imperative, which is toidentify suitable available land and the existing resource base. The Bureau of ResourceSciences has been nominated to pursue this goal in the context of its work on theNational Plantation Inventory and the comprehensive regional assessment process.
Central Highlands Plantation Potential Analysis
8
3. Plantation capability and suitabilityassessment
The approach taken in this study was to match growth estimates of preferred species with site attributeswithin the socio-economic context of the study area. The methodology and assumptions used are outlinedbelow.
3.1 CONCEPT OF PLANTATION CAPABILITY
Assessing a region for its plantation capability requires identifying locations where the biological growthrequirements of the species under consideration for plantation use are satisfied. Since species vary in theirbiological needs, it is important to define the requirements for each species. Typically, the processinvolves developing a set of edaphic and climatic parameters, collecting information on these parametersfrom each possible site, then comparing the data gained from each site against the biological requirementsof various species.
In a simple analysis, land may only be deemed as either capable or not capable of sustaining particularspecies, based on the interactions of thresholds of various parameters, or the effect of a particular factorthat is considered to be most limiting to growth (eg. Hackett 1988). In more complex analyses, locationsdeemed capable may also be rated according to potential productivity, providing a range of potentialgrowth and yield levels.
Selection of appropriate species for plantations depends on:• the purpose of the plantation (eg. investment, land rehabilitation);• type(s) of product desired (eg. fibre, timber, fodder, firewood, amenity);• availability of markets in the future;• biological requirements of the species; and• availability of management and research data for the species under consideration.
The biological and management aspects are especially important in capability analyses. For example, ifthe biological requirements of the species are not well known, then it will be difficult to make meaningfulestimates of growth and yield under different management regimes. Because of the dearth ofcomprehensive biological data for all but a few tree species, notably P. radiata and E. globulus, the scopefor detailed analysis of plantation capability is limited to a small number of species. However, usingavailable information, indicative estimates of capability can be made for some of the better knownspecies.
3.2 CONCEPT OF SUITABILITY
Land suitability analyses involve the integration of biophysical and socio-economic factors affecting theviability of land for a particular use, such as plantations. Thus, for example, some areas that are capable ofsupporting good plantation growth may be deemed unsuitable because their remote location - or someother factor-makes them uneconomic. Other areas with a high capability may be very suitable from aneconomic standpoint but unsuitable from a social perspective, for instance, an area that, although close toa mill, is in an important watershed that cannot be disturbed by plantation activities.
The incorporation of socio-economic values into an analysis implies the consideration of community
Central Highlands Plantation Potential Analysis
9
values as they affect and are affected by plantation development and management. This could include:
• effect of plantations on community values and infrastructures, for example:
- on employment, and consequent effects on the community;
- on local roads (due to heavy traffic);
- on land prices;
- on the community in general, due to diversification of the socio-economic base from agriculture
to forestry and farm-forestry;
- aesthetic values
• effect of community values on factors related to plantation development, for example:
- landprices;
- extent of financial contribution to regional infrastructure required;
- costs of public consultation;
- costs of unanticipated impediments to development;
- costs of meeting community/government expectations for good management.
From an industrial point of view, a financial cost-benefit analysis would consider a subset of the costsmentioned as they are presented to the investor. Financial factors to be considered include the price ofwood products; the costs of harvesting, transport, fertiliser, silviculture, maintenance and available land;local government planning costs; distance from roading and processing infrastructure; and costsconcerned with meeting environmental protection regulations. However, many social and environmentalcosts are difficult to identify and frequently impossible to quantify (Spencer & Jellinek 1995).
A restricted approach to cost-benefit analysis developed for the present study used land price as the basisfor ranking land for suitability. Assuming good plantation growth rates, an economic minimum plantationsize and an economic haulage distance to market, land price is the most significant economic variableaffecting land suitability for plantation development.
Accordingly, a suitability rating was developed which maps the study area and ranks available landaccording to its size and unimproved price per hectare. The ranking is based on the premise that, all else

Central Highlands Plantation Potential Analysis
10
being equal, land with a high price is less attractive for plantation development than land with a low price.Because of its assumptions, the method is only suitable for appraisals at a regional level.
Central Highlands Plantation Potential Analysis
11
4. Plantation capability study
The plantation capability study was conducted in five stages:
1. Review the methodology and findings of existing studies, identify information gaps and develop anappropriate methodology for this study.
2. Identify plantation species and collect information concerning their environmental requirements (soil,rainfall) and potential wood yields.
3. Prepare digital data maps or 'surfaces' of the Central Highlands , showing the distribution of theenvironmental variables.
4. Determine the land capability classes by evaluating the interactions of the parameters defined in stage3, using GIS techniques to overlay the data.
5. Assign timber yields to the derived plantation capability classes.
4.1 PLANTATION SPECIES
Species were selected for the capability study in accordance with the criteria listed in section 3.1. Thesespecies are detailed in Table I. In selecting these species, the findings of relevant studies were drawn uponand led to a number of assumptions concerning the purpose of plantations in the Central Highlands, theproducts that could be obtained from them, the available markets and the status of relevant research. Abrief discussion of each factor follows.
4.1.1 Purpose of plantations
Land capability has been assessed in relation to a limited variety of proven species that are suited tomedium-to-large scale plantations or wood lots, for production of fibre and solid timber products. Such alimitation is necessary because it is difficult to obtain reliable, quantitative data on the biologicalrequirements of other species that may be appropriate to the Central Highlands. It is assumed, however,that areas capable of supporting high-yielding eucalypt species preferred for industrial use would alsosupport a variety of species for other purposes.
4.1.2 Products
A range of products could be obtained from plantations in the Central Highlands but, as mentioned above,the main emphasis of the capability study was on fibre and timber production. If land is assessed as beingable to support plantations for timber and fibre production, it is assumed that it could also supportplantations for other purposes, such as environmental protection, shelter, firewood, farm poles, etc, eitherexclusively or as by-products of the primary production objective.
4.1.3 Markets
Industry development and consequent demand for plantation timber from the Central Highlands will bestrongly influenced by the size and characteristics of the existing plantations and native forests.Consequently, the preferred plantation species are ash-type eucalypts for hardwood fibre production andradiata pine for long-fibre softwood pulp and timber. Plantations for sawlog production grow the sameeucalypts but with different genetics and silvicultural practices and much longer rotation periods.
Central Highlands Plantation Potential Analysis
12
4.1.4 Research and data
Generally, there is a lack of detailed information on the biological requirements and growth rates of treespecies for Australian sites. However, information is available for a limited number of temperate species -many of which have already been planted in the Central Highlands. Due to the limited data, estimations ofyield are restricted to the better known plantation species.
4.2 REGIONAL PLANTATION SPECIES
A number of hardwood and softwood species have been established in plantations of significant size inand around the Central Highlands. These species include E. regnans and E. nitens, which are endemic tothe area, and are capable of good growth, both in their natural environment and in plantation trials(Cromer 1996). Other species that have been subjected to trials in the region are listed in Table 1.
Table 1: Results of suitability trials in and around the Central Highlands
Species Comment
E. cladocalyx Suited to lower rainfall areas
E. delegatensis Fair-E. regnans usually better
E. diversicolor Unproven but known to need good sitesE. globulus* Significant Amcor plantations
E. nitens* Suited to high elevation areas
E. obliqua Fair-E. nitens usually betterE. regnans* Significant Amcor plantations
P. ponderosa Found inferior to radiata pine in trials
P. radiata* Most prolific species-very adaptable
Pseudotsuga spp. Found inferior to radiata pine in trials
* Species selected in this study for Sources: NFI 1997; Spencer 1989; capability assessment and yield estimation. Booth & Jovanovic 1991.
Data from the National Plantation Inventory show that P. radiata, E. regnans and E. globulus are themost widely planted plantation species in the region (NFI 1997). Although E. regnans was plantedextensively in the past, some large growers (eg. Australian Pulp & Paper) have established substantialareas of E. globulus, for which they have a preference. E. regnans and E. nitens produce similar,commercially acceptable fibre, however E. nitens is superior at higher altitudes where frost limits thegrowth of other species.
From a nation-wide study of hardwood plantation capability (Booth & Jovanovic 1991) it was concludedthat E. globulus, E. nitens and E. regnans would be well adapted to the climate and soils in parts of theCentral Highlands. Booth and Jovanovic also considered land capability in Victoria for E. cladocalyx, E.obilqua and E. delegatensis.
Reports of other trials (eg. Turnbull & Pryor 1978; Cremer 1969), show that although E. delegatensis hasgood frost tolerance and fair growth rates, provenances of E. nitens will almost always perform better.Similarly, E. regnans is usually a better performer than E. obliqua on the quality sites capable of
Central Highlands Plantation Potential Analysis
13
supporting these species. E. cladocalyx has a limited natural distribution in South Australia, but is suitedto rural plantings in dry areas.
4.2.1 Minor species
There are several other species suited to the Central Highlands, especially for small-scale wood-lotplanting and/or to satisfy niche markets. Acacia melanoxylon, for example, produces a high valuespecialty timber. Eucalypt species that have shown some promise in trials at Mt Gambier and elsewhereinclude E. triflora and E. oreades. Both of these species exhibited good growth rates in the early stages ofa species trial that included most of the common temperate hardwood species, such as E. globulus(Spencer 1989), but as yet, no further data are available. Another interesting but largely untestedpossibility is a hybrid of E. nitens and E. globulus currently undergoing trials by North Forests. Thishybrid is reported to have the cold resistance of shining gum (E. nitens), and high growth rates (StateForests n.d).
4.2.2 Species selected for analysis
Taking into consideration other studies, plantation trials, assumptions about demand, market preferenceand availability of accurate data, the following species were selected for analysis in the BRS capabilitystudy:
• E. globulus subsp. globulus
• E. nitens
• E. regnans
• P. radiata.
There are sufficient data available on the growth rates and responses to climatic and edaphic variation ofthese species for it to be possible to make quantitative estimates of their productivity, using a prescribedset of site variables. From these estimates, it is possible to forecast approximate yields for the purposes ofcomparisons between species. One additional species, A. melanoxylon, has been considered, though thereare not sufficient data to support estimates of yield.
4.3 LAND CAPABILITYAND PLANTATION GROWTH
Plantation growth and yield are influenced by several factors, including environmental, genetic andmanagement variables. However, it is often impossible to account for all of the varying influences -especially the future silvicultural decisions of the plantation manager. It is usually assumed thatsilvicultural factors will be relatively 'standard', and predictions are based on edaphic and climaticinfluences on tree growth.
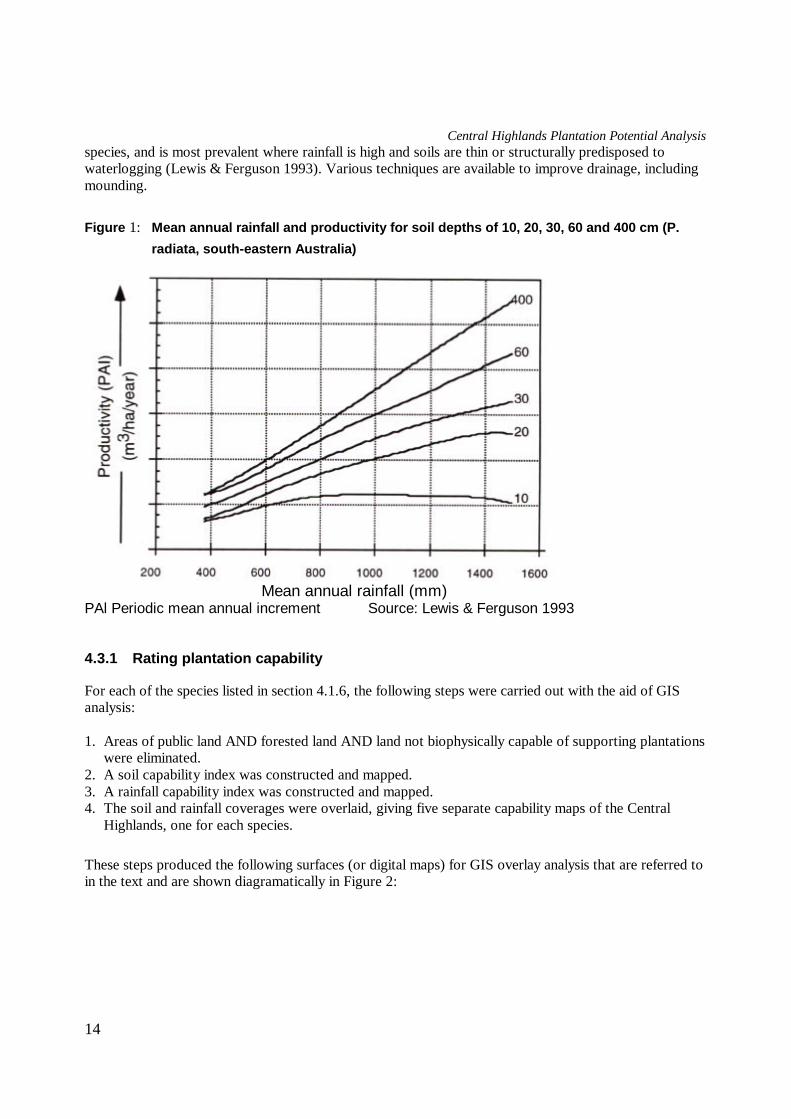
Many plantation studies have focused on just two factors - soil type and rainfall, which interact todetermine moisture availability. Moisture availability is perhaps the most important limitation toplantation growth, provided a number of other factors, such as temperature and solar radiation, are withinthe correct range. It is reasonable to assume that for a given soil depth and type, plantations experiencinghigher rainfall will yield more, provided aeration in the root-zone is adequate (Figure 1 shows, forinstance, that the productivity of P. radiata in southeast Australia is dependent on the interaction betweenrainfall and soil depth). Waterlogging can seriously impede the growth and health of many plantation
Central Highlands Plantation Potential Analysis
14
species, and is most prevalent where rainfall is high and soils are thin or structurally predisposed towaterlogging (Lewis & Ferguson 1993). Various techniques are available to improve drainage, includingmounding.
Figure 1: Mean annual rainfall and productivity for soil depths of 10, 20, 30, 60 and 400 cm (P.
radiata, south-eastern Australia)
Mean annual rainfall (mm)PAl Periodic mean annual increment Source: Lewis & Ferguson 1993
4.3.1 Rating plantation capability
For each of the species listed in section 4.1.6, the following steps were carried out with the aid of GISanalysis:
1. Areas of public land AND forested land AND land not biophysically capable of supporting plantationswere eliminated.
2. A soil capability index was constructed and mapped.3. A rainfall capability index was constructed and mapped.4. The soil and rainfall coverages were overlaid, giving five separate capability maps of the Central
Highlands, one for each species.
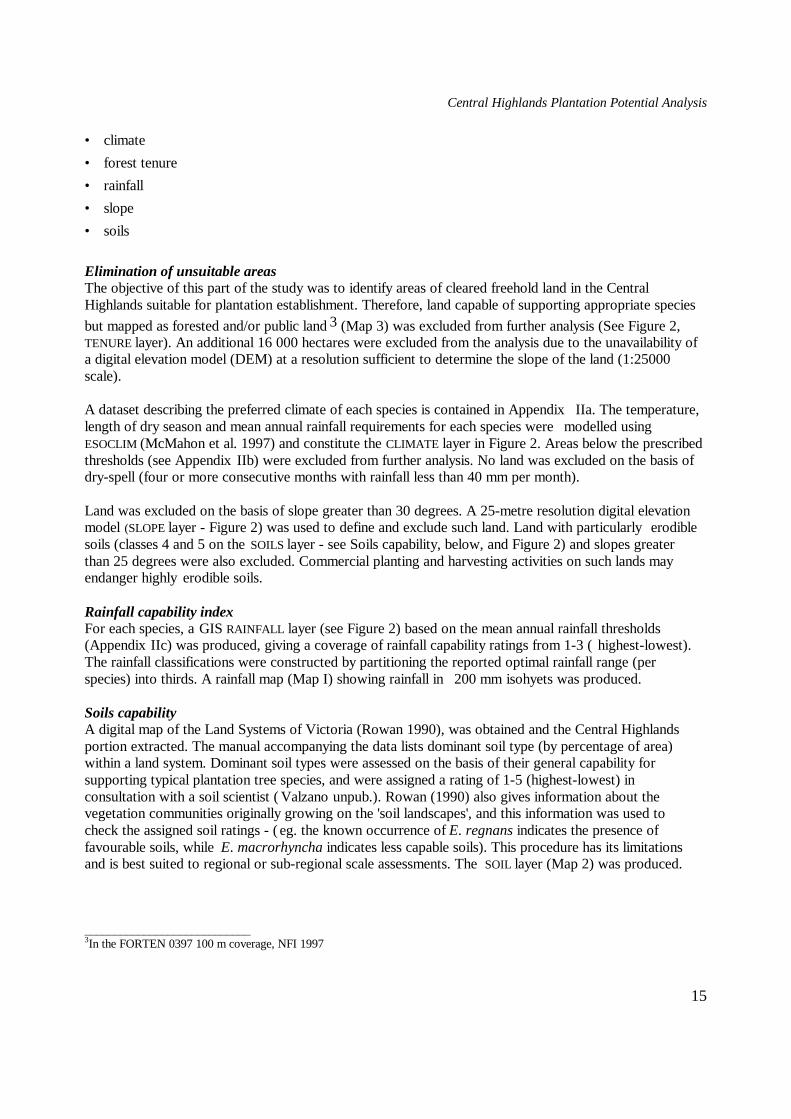
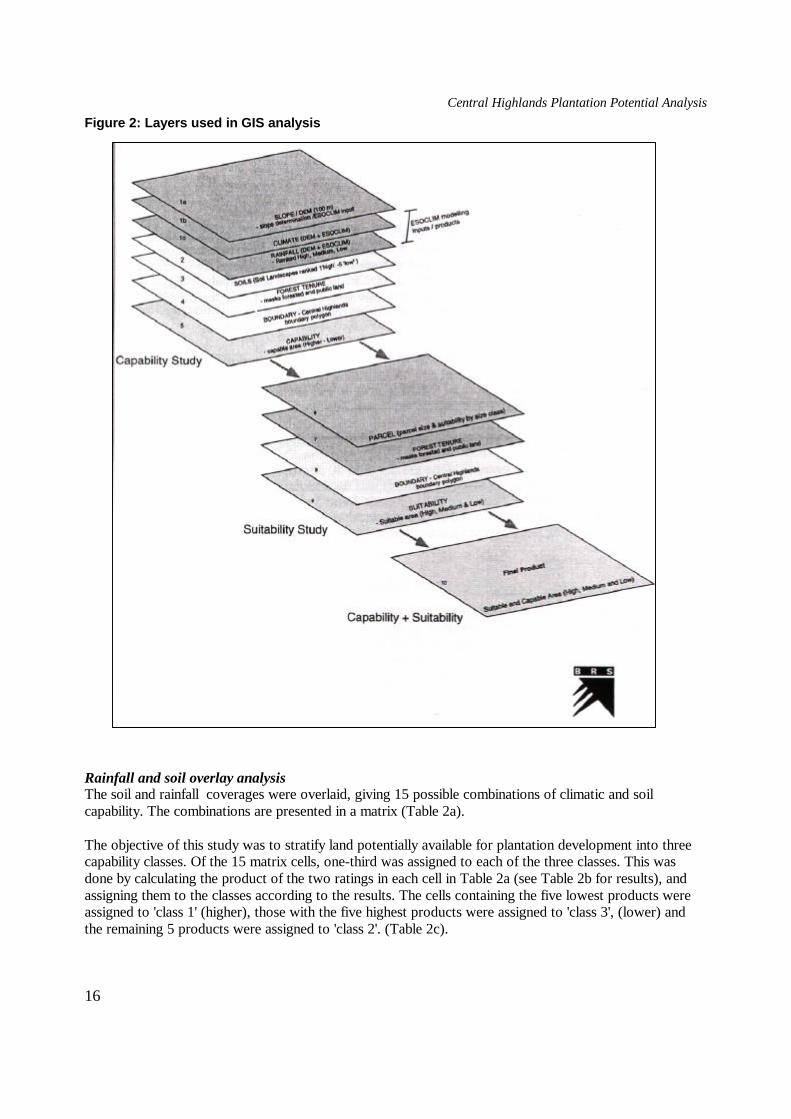
These steps produced the following surfaces (or digital maps) for GIS overlay analysis that are referred toin the text and are shown diagramatically in Figure 2:
Central Highlands Plantation Potential Analysis
15
• climate• forest tenure• rainfall• slope• soils
Elimination of unsuitable areasThe objective of this part of the study was to identify areas of cleared freehold land in the CentralHighlands suitable for plantation establishment. Therefore, land capable of supporting appropriate speciesbut mapped as forested and/or public land 3 (Map 3) was excluded from further analysis (See Figure 2,TENURE layer). An additional 16 000 hectares were excluded from the analysis due to the unavailability ofa digital elevation model (DEM) at a resolution sufficient to determine the slope of the land (1:25000scale).
A dataset describing the preferred climate of each species is contained in Appendix IIa. The temperature,length of dry season and mean annual rainfall requirements for each species were modelled usingESOCLIM (McMahon et al. 1997) and constitute the CLIMATE layer in Figure 2. Areas below the prescribedthresholds (see Appendix IIb) were excluded from further analysis. No land was excluded on the basis ofdry-spell (four or more consecutive months with rainfall less than 40 mm per month).
Land was excluded on the basis of slope greater than 30 degrees. A 25-metre resolution digital elevationmodel (SLOPE layer - Figure 2) was used to define and exclude such land. Land with particularly erodiblesoils (classes 4 and 5 on the SOILS layer - see Soils capability, below, and Figure 2) and slopes greaterthan 25 degrees were also excluded. Commercial planting and harvesting activities on such lands mayendanger highly erodible soils.
Rainfall capability indexFor each species, a GIS RAINFALL layer (see Figure 2) based on the mean annual rainfall thresholds(Appendix IIc) was produced, giving a coverage of rainfall capability ratings from 1-3 ( highest-lowest).The rainfall classifications were constructed by partitioning the reported optimal rainfall range (perspecies) into thirds. A rainfall map (Map I) showing rainfall in 200 mm isohyets was produced.
Soils capabilityA digital map of the Land Systems of Victoria (Rowan 1990), was obtained and the Central Highlandsportion extracted. The manual accompanying the data lists dominant soil type (by percentage of area)within a land system. Dominant soil types were assessed on the basis of their general capability forsupporting typical plantation tree species, and were assigned a rating of 1-5 (highest-lowest) inconsultation with a soil scientist ( Valzano unpub.). Rowan (1990) also gives information about thevegetation communities originally growing on the 'soil landscapes', and this information was used tocheck the assigned soil ratings - ( eg. the known occurrence of E. regnans indicates the presence offavourable soils, while E. macrorhyncha indicates less capable soils). This procedure has its limitationsand is best suited to regional or sub-regional scale assessments. The SOIL layer (Map 2) was produced.
____________________________3In the FORTEN 0397 100 m coverage, NFI 1997
Central Highlands Plantation Potential Analysis
16
Figure 2: Layers used in GIS analysis
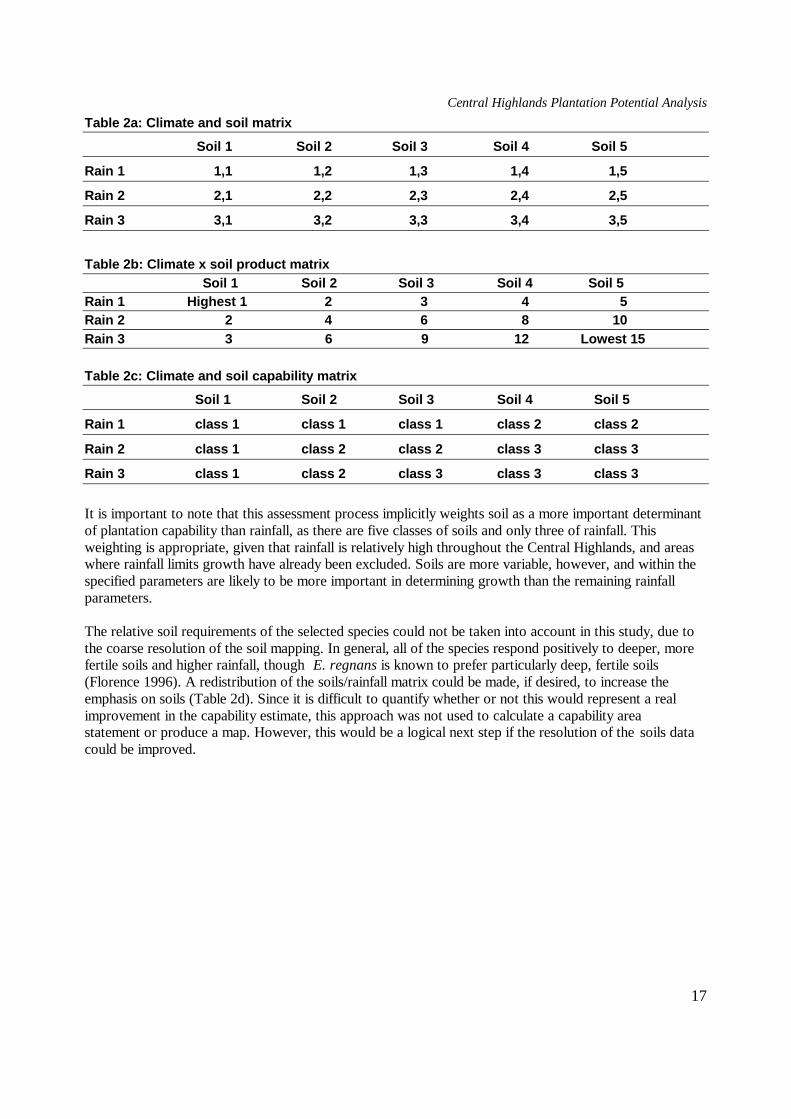
Rainfall and soil overlay analysisThe soil and rainfall coverages were overlaid, giving 15 possible combinations of climatic and soilcapability. The combinations are presented in a matrix (Table 2a).
The objective of this study was to stratify land potentially available for plantation development into threecapability classes. Of the 15 matrix cells, one-third was assigned to each of the three classes. This wasdone by calculating the product of the two ratings in each cell in Table 2a (see Table 2b for results), andassigning them to the classes according to the results. The cells containing the five lowest products wereassigned to 'class 1' (higher), those with the five highest products were assigned to 'class 3', (lower) andthe remaining 5 products were assigned to 'class 2'. (Table 2c).
Central Highlands Plantation Potential Analysis
17
Table 2a: Climate and soil matrix
Soil 1 Soil 2 SoiI 3 Soil 4 Soil 5
Rain 1 1,1 1,2 1,3 1,4 1,5
Rain 2 2,1 2,2 2,3 2,4 2,5
Rain 3 3,1 3,2 3,3 3,4 3,5
Table 2b: Climate x soil product matrix Soil 1 Soil 2 Soil 3 Soil 4 Soil 5
Rain 1 Highest 1 2 3 4 5Rain 2 2 4 6 8 10Rain 3 3 6 9 12 Lowest 15
Table 2c: Climate and soil capability matrix
Soil 1 Soil 2 Soil 3 Soil 4 Soil 5
Rain 1 class 1 class 1 class 1 class 2 class 2
Rain 2 class 1 class 2 class 2 class 3 class 3
Rain 3 class 1 class 2 class 3 class 3 class 3
It is important to note that this assessment process implicitly weights soil as a more important determinantof plantation capability than rainfall, as there are five classes of soils and only three of rainfall. Thisweighting is appropriate, given that rainfall is relatively high throughout the Central Highlands, and areaswhere rainfall limits growth have already been excluded. Soils are more variable, however, and within thespecified parameters are likely to be more important in determining growth than the remaining rainfallparameters.
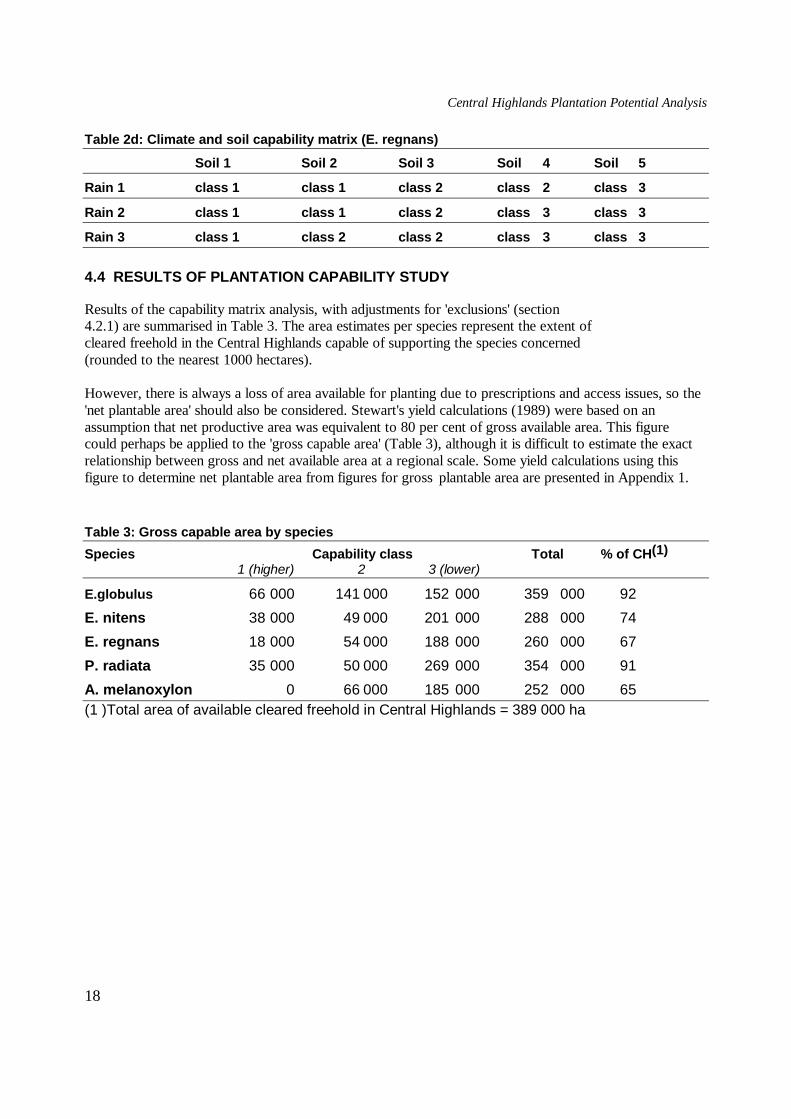
The relative soil requirements of the selected species could not be taken into account in this study, due tothe coarse resolution of the soil mapping. In general, all of the species respond positively to deeper, morefertile soils and higher rainfall, though E. regnans is known to prefer particularly deep, fertile soils(Florence 1996). A redistribution of the soils/rainfall matrix could be made, if desired, to increase theemphasis on soils (Table 2d). Since it is difficult to quantify whether or not this would represent a realimprovement in the capability estimate, this approach was not used to calculate a capability areastatement or produce a map. However, this would be a logical next step if the resolution of the soils datacould be improved.
Central Highlands Plantation Potential Analysis
18
Table 2d: Climate and soil capability matrix (E. regnans)
Soil 1 Soil 2 Soil 3 Soil 4 Soil 5
Rain 1 class 1 class 1 class 2 class 2 class 3
Rain 2 class 1 class 1 class 2 class 3 class 3
Rain 3 class 1 class 2 class 2 class 3 class 3
4.4 RESULTS OF PLANTATION CAPABILITY STUDY
Results of the capability matrix analysis, with adjustments for 'exclusions' (section4.2.1) are summarised in Table 3. The area estimates per species represent the extent ofcleared freehold in the Central Highlands capable of supporting the species concerned(rounded to the nearest 1000 hectares).
However, there is always a loss of area available for planting due to prescriptions and access issues, so the'net plantable area' should also be considered. Stewart's yield calculations (1989) were based on anassumption that net productive area was equivalent to 80 per cent of gross available area. This figurecould perhaps be applied to the 'gross capable area' (Table 3), although it is difficult to estimate the exactrelationship between gross and net available area at a regional scale. Some yield calculations using thisfigure to determine net plantable area from figures for gross plantable area are presented in Appendix 1.
Table 3: Gross capable area by species
Species Capability class Total % of CH(1)1 (higher) 2 3 (lower)
E.globulus 66 000 141 000 152 000 359 000 92
E. nitens 38 000 49 000 201 000 288 000 74
E. regnans 18 000 54 000 188 000 260 000 67
P. radiata 35 000 50 000 269 000 354 000 91
A. melanoxylon 0 66 000 185 000 252 000 65(1 )Total area of available cleared freehold in Central Highlands = 389 000 ha
Central Highlands Plantation Potential Analysis
19
4.5 DISCUSSION OF PLANTATION CAPABILITY
It is important to note that the plantation capability classifications assigned to each species are bestapplied within species only, and not between them. It is not intended that capability ratings be used tomake judgments about the relative productivity of the listed species. Some areas rated as 'class 1' for E.globulus are 'class 2' for P. radiata. This does not imply that E. globulus would be a better species choicefor that area; rather that the area is among the better sites in southeastern Australia for E. globulus,whereas sites offering better growing conditions for P. radiata could be found elsewhere.
The analysis shows that a high percentage of the cleared agricultural land in the Central Highlands hasplantation capability. This capability varies with species: from 65 per cent of the available area for E.regnans to 92 per cent for E. globulus. Areas in the north-west of the Central Highlands are generally ofthe lowest capability; some species were excluded from consideration for this area, because of itsrelatively low rainfall (Map 1).
A limitation of broad-scale capability studies, including this study, is the consideration of micro-climaticvariables such as catena variations on soils, soil nutrient balance, aspect, shelter, cold air drainage andlocal pests and diseases. Eucalypts and certain other species, such as A. melanoxylon, are comparativelysensitive to such variations, relative to P. radiata. E. regnans is regarded as being particularly sensitiveand will only grow well in sheltered aspects on deep soils and where soil moisture is adequate. For thisreason, the species does not lend itself to inclusion in broad-scale capability analyses and, in calculatingthe net plantable area suitable for E. regnans from the gross figure of 62 per cent of private cleared land inthe Central Highlands region, special consideration should be given to microclimatic variation. Suchvariation may well be impossible to account for or model in desktop studies, and was not possible in thecurrent study; on-ground inspection may well be the only way to determine whether a site is capable ofcarrying E. regnans in plantation conditions.
Examination of Map 9 (A. melanoxylon) indicates only a few hectares of land of 'class 1' capability forthis species are available. This is due to the relatively high upper rainfall threshold selected for thisspecies - on the basis of reports in the literature. Such a threshold may reflect the fact that the species isnot normally used for fibre production, and it is probable that high quality sites would be needed toproduce quality sawlogs.
Note that even areas not classed as capable may be able to support the species under consideration,particularly hardy species such as P. radiata-albeit with lower yields. The climatic and soil variablethresholds used in this study reflect current limits to commercially viable plantation establishment.However, if future market prices for wood were to rise relative to those of alternate land uses such asagriculture, land of lesser capability will become increasingly attractive.
Central Highlands Plantation Potential Analysis
20
5. Plantation suitability
A complete plantation suitability study, by definition, considers a variety of economic and social factors(see section 3.2). In this study, only two such factors are considered in detail; transport cost and propertyprice. The suitability study is therefore focused on the economic component of plantation suitability, andwas conducted in four stages:
1. Consideration of transport cost.2. Analysis of the distribution of property sizes throughout the region.3. Determination of the relative price of unimproved land.4. Classification of the whole region - including improved land into suitability classes, based on trends
in unimproved land prices.
5.1 TRANSPORT DISTANCE AND COST
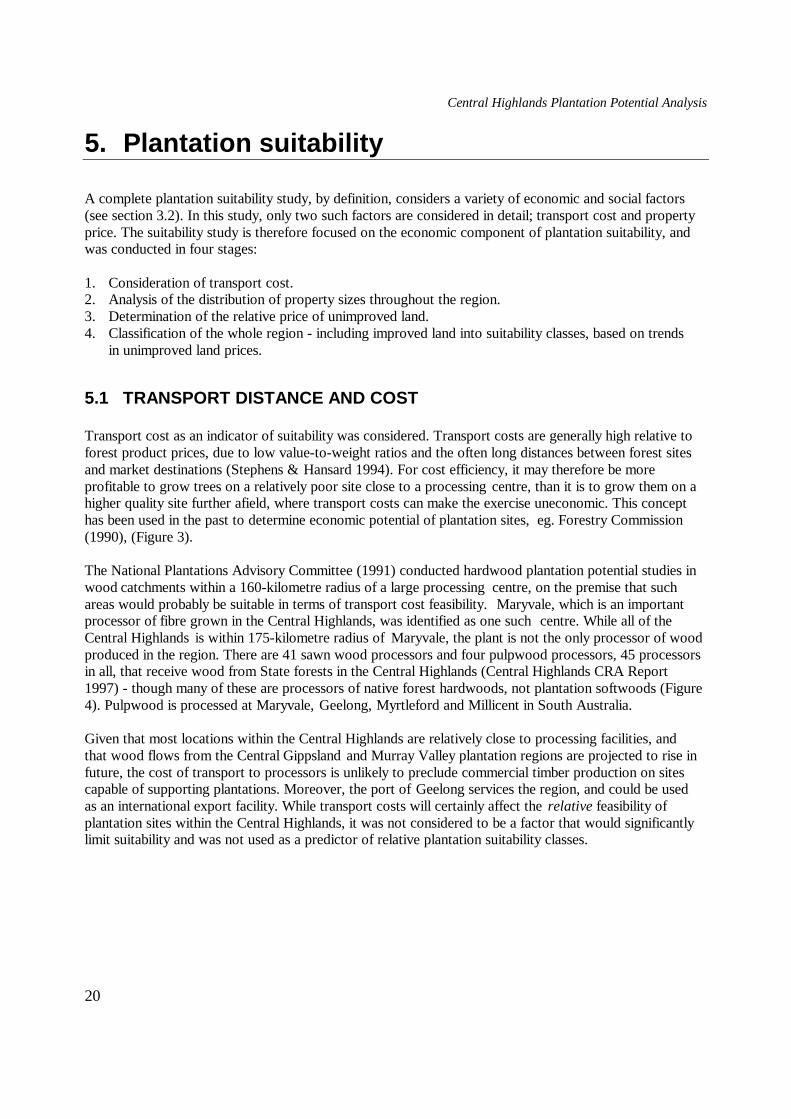
Transport cost as an indicator of suitability was considered. Transport costs are generally high relative toforest product prices, due to low value-to-weight ratios and the often long distances between forest sitesand market destinations (Stephens & Hansard 1994). For cost efficiency, it may therefore be moreprofitable to grow trees on a relatively poor site close to a processing centre, than it is to grow them on ahigher quality site further afield, where transport costs can make the exercise uneconomic. This concepthas been used in the past to determine economic potential of plantation sites, eg. Forestry Commission(1990), (Figure 3).
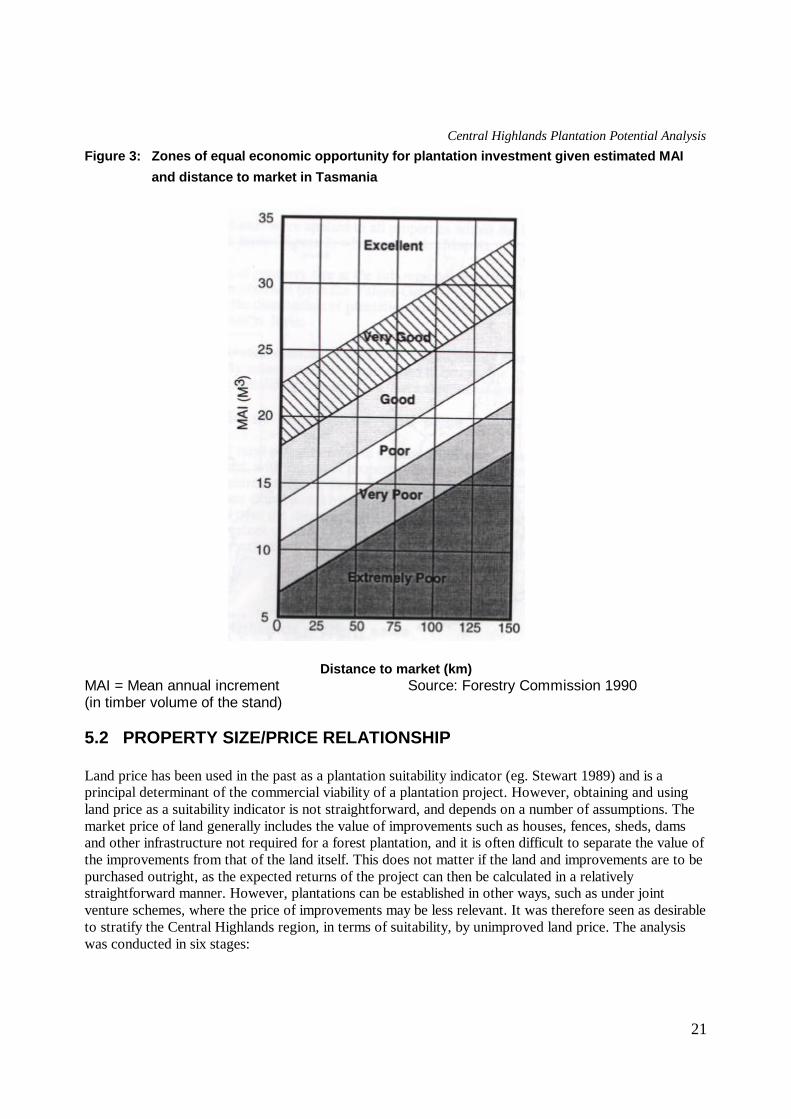
The National Plantations Advisory Committee (1991) conducted hardwood plantation potential studies inwood catchments within a 160-kilometre radius of a large processing centre, on the premise that suchareas would probably be suitable in terms of transport cost feasibility. Maryvale, which is an importantprocessor of fibre grown in the Central Highlands, was identified as one such centre. While all of theCentral Highlands is within 175-kilometre radius of Maryvale, the plant is not the only processor of woodproduced in the region. There are 41 sawn wood processors and four pulpwood processors, 45 processorsin all, that receive wood from State forests in the Central Highlands (Central Highlands CRA Report1997) - though many of these are processors of native forest hardwoods, not plantation softwoods (Figure4). Pulpwood is processed at Maryvale, Geelong, Myrtleford and Millicent in South Australia.
Given that most locations within the Central Highlands are relatively close to processing facilities, andthat wood flows from the Central Gippsland and Murray Valley plantation regions are projected to rise infuture, the cost of transport to processors is unlikely to preclude commercial timber production on sitescapable of supporting plantations. Moreover, the port of Geelong services the region, and could be usedas an international export facility. While transport costs will certainly affect the relative feasibility ofplantation sites within the Central Highlands, it was not considered to be a factor that would significantlylimit suitability and was not used as a predictor of relative plantation suitability classes.
Central Highlands Plantation Potential Analysis
21
Figure 3: Zones of equal economic opportunity for plantation investment given estimated MAIand distance to market in Tasmania
Distance to market (km)MAI = Mean annual increment Source: Forestry Commission 1990(in timber volume of the stand)
5.2 PROPERTY SIZE/PRICE RELATIONSHIP
Land price has been used in the past as a plantation suitability indicator (eg. Stewart 1989) and is aprincipal determinant of the commercial viability of a plantation project. However, obtaining and usingland price as a suitability indicator is not straightforward, and depends on a number of assumptions. Themarket price of land generally includes the value of improvements such as houses, fences, sheds, damsand other infrastructure not required for a forest plantation, and it is often difficult to separate the value ofthe improvements from that of the land itself. This does not matter if the land and improvements are to bepurchased outright, as the expected returns of the project can then be calculated in a relativelystraightforward manner. However, plantations can be established in other ways, such as under jointventure schemes, where the price of improvements may be less relevant. It was therefore seen as desirableto stratify the Central Highlands region, in terms of suitability, by unimproved land price. The analysiswas conducted in six stages:
Central Highlands Plantation Potential Analysis
22
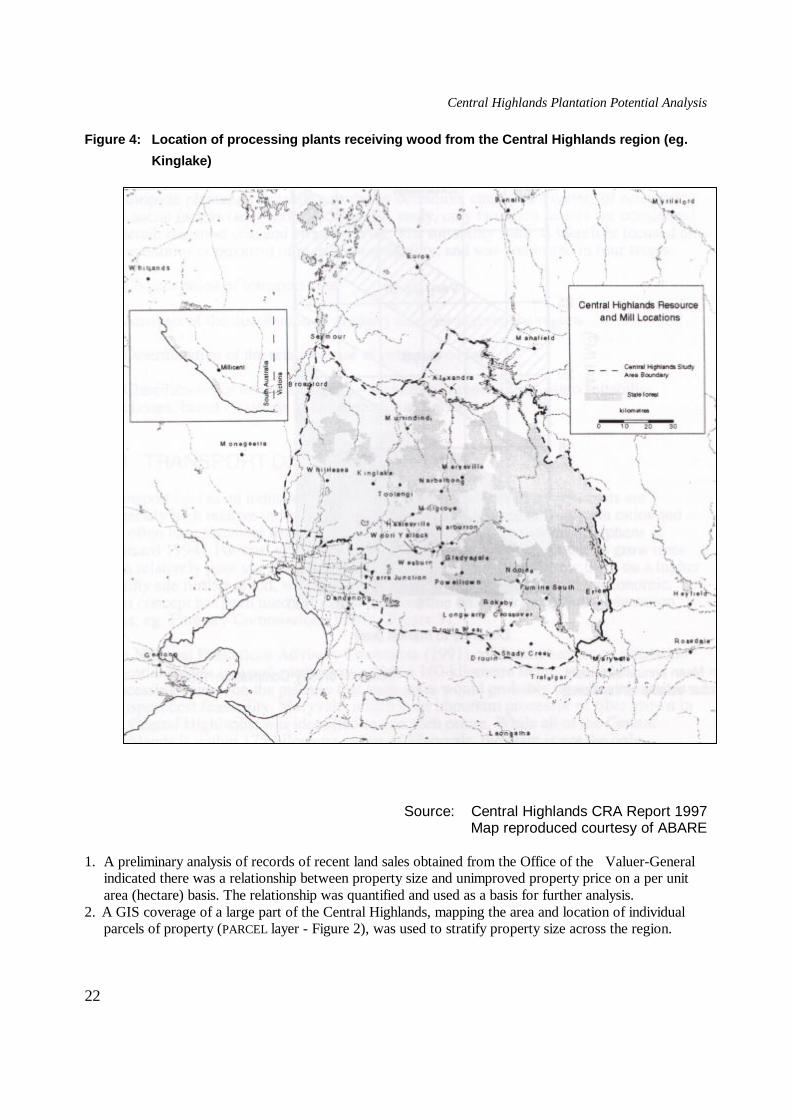
Figure 4: Location of processing plants receiving wood from the Central Highlands region (eg.
Kinglake)
Source: Central Highlands CRA Report 1997Map reproduced courtesy of ABARE
1. A preliminary analysis of records of recent land sales obtained from the Office of the Valuer-Generalindicated there was a relationship between property size and unimproved property price on a per unitarea (hectare) basis. The relationship was quantified and used as a basis for further analysis.
2. A GIS coverage of a large part of the Central Highlands, mapping the area and location of individualparcels of property (PARCEL layer - Figure 2), was used to stratify property size across the region.
Central Highlands Plantation Potential Analysis
23
3. Suitability classes were determined, based on property size and estimated unimproved land value.4. The suitability classes were applied to all properties within the Central Highlands, using the PARCEL
layer (Figure 2) where possible (Map 4).5. The distributions of property size at the sub-regional level were estimated using the sales information
obtained from the Valuer-General's office. The distributions were used to estimate the distribution ofplantation suitability classes for those areas not covered by the PARCEL layer.
6. The nine possible combinations of suitability and capability classes were mapped for each species.Only areas previously determined to be capable (per species) were overlaid with the suitabilityclassification. Area statements were produced.
5.2.1 Estimation of unimproved land price
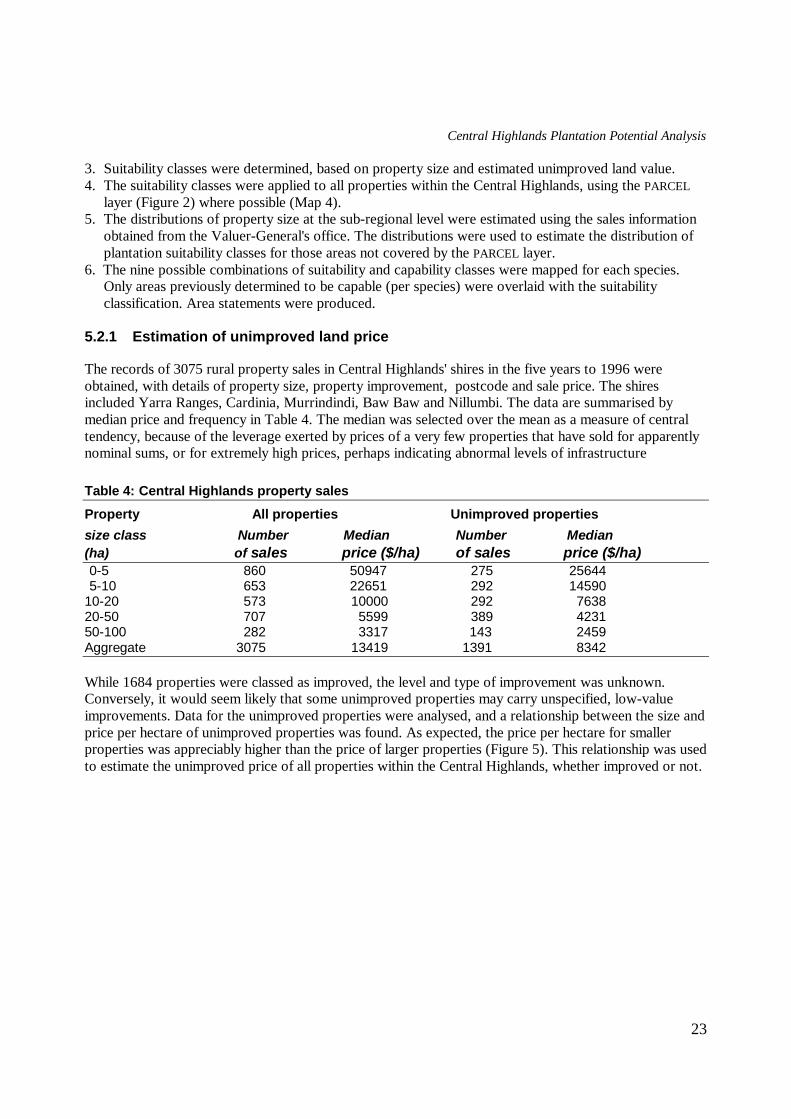
The records of 3075 rural property sales in Central Highlands' shires in the five years to 1996 wereobtained, with details of property size, property improvement, postcode and sale price. The shiresincluded Yarra Ranges, Cardinia, Murrindindi, Baw Baw and Nillumbi. The data are summarised bymedian price and frequency in Table 4. The median was selected over the mean as a measure of centraltendency, because of the leverage exerted by prices of a very few properties that have sold for apparentlynominal sums, or for extremely high prices, perhaps indicating abnormal levels of infrastructure
Table 4: Central Highlands property sales
Property All properties Unimproved propertiessize class Number Median Number Median(ha) of sales price ($/ha) of sales price ($/ha)0-5 860 50947 275 256445-10 653 22651 292 14590
10-20 573 10000 292 763820-50 707 5599 389 423150-100 282 3317 143 2459Aggregate 3075 13419 1391 8342
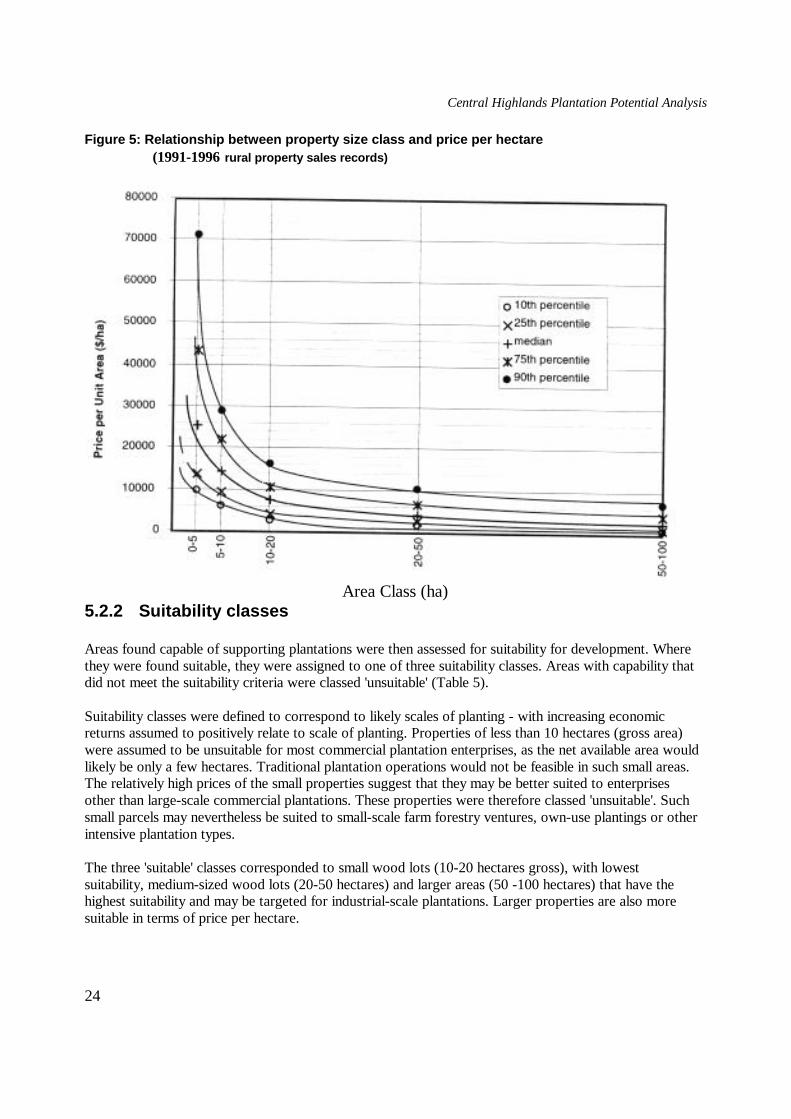
While 1684 properties were classed as improved, the level and type of improvement was unknown.Conversely, it would seem likely that some unimproved properties may carry unspecified, low-valueimprovements. Data for the unimproved properties were analysed, and a relationship between the size andprice per hectare of unimproved properties was found. As expected, the price per hectare for smallerproperties was appreciably higher than the price of larger properties (Figure 5). This relationship was usedto estimate the unimproved price of all properties within the Central Highlands, whether improved or not.
Central Highlands Plantation Potential Analysis
24
Figure 5: Relationship between property size class and price per hectare(1991-1996 rural property sales records)
Area Class (ha)5.2.2 Suitability classes
Areas found capable of supporting plantations were then assessed for suitability for development. Wherethey were found suitable, they were assigned to one of three suitability classes. Areas with capability thatdid not meet the suitability criteria were classed 'unsuitable' (Table 5).
Suitability classes were defined to correspond to likely scales of planting - with increasing economicreturns assumed to positively relate to scale of planting. Properties of less than 10 hectares (gross area)were assumed to be unsuitable for most commercial plantation enterprises, as the net available area wouldlikely be only a few hectares. Traditional plantation operations would not be feasible in such small areas.The relatively high prices of the small properties suggest that they may be better suited to enterprisesother than large-scale commercial plantations. These properties were therefore classed 'unsuitable'. Suchsmall parcels may nevertheless be suited to small-scale farm forestry ventures, own-use plantings or otherintensive plantation types.
The three 'suitable' classes corresponded to small wood lots (10-20 hectares gross), with lowestsuitability, medium-sized wood lots (20-50 hectares) and larger areas (50 -100 hectares) that have thehighest suitability and may be targeted for industrial-scale plantations. Larger properties are also moresuitable in terms of price per hectare.
Central Highlands Plantation Potential Analysis
25
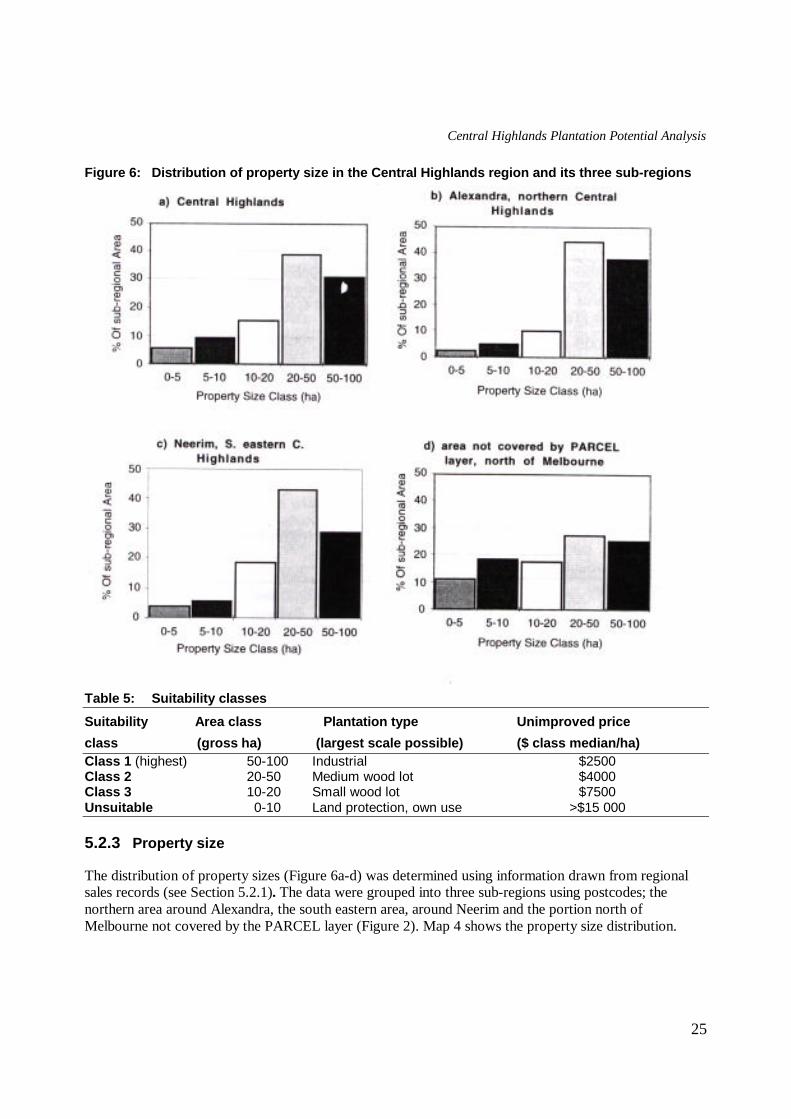
Figure 6: Distribution of property size in the Central Highlands region and its three sub-regions
Table 5: Suitability classes
Suitability Area class Plantation type Unimproved price
class (gross ha) (largest scale possible) ($ class median/ha)Class 1 (highest) 50-100 Industrial $2500Class 2 20-50 Medium wood lot $4000Class 3 10-20 Small wood lot $7500Unsuitable 0-10 Land protection, own use >$15 000
5.2.3 Property size
The distribution of property sizes (Figure 6a-d) was determined using information drawn from regionalsales records (see Section 5.2.1). The data were grouped into three sub-regions using postcodes; thenorthern area around Alexandra, the south eastern area, around Neerim and the portion north ofMelbourne not covered by the PARCEL layer (Figure 2). Map 4 shows the property size distribution.
Central Highlands Plantation Potential Analysis
26
The distributions derived from the sales data indicate that the sub-region just to the north of Melbourne,which is not covered by the PARCEL layer (Figure 2), is likely to consist of relatively smaller properties,whereas larger properties comprise a greater part of the area in the north of the Central Highlands (Figure6).
The distribution of property sizes in Figure 6(d) was applied to the cleared, freehold land not covered bythe PARCEL layer (Figure 2). This allowed the calculation of gross suitable area, by class (1-3 and'unsuitable'), for each species, for the entire Central Highlands (Table 6).
5.3 RESULTS OF PLANTATION SUITABILITYANALYSIS
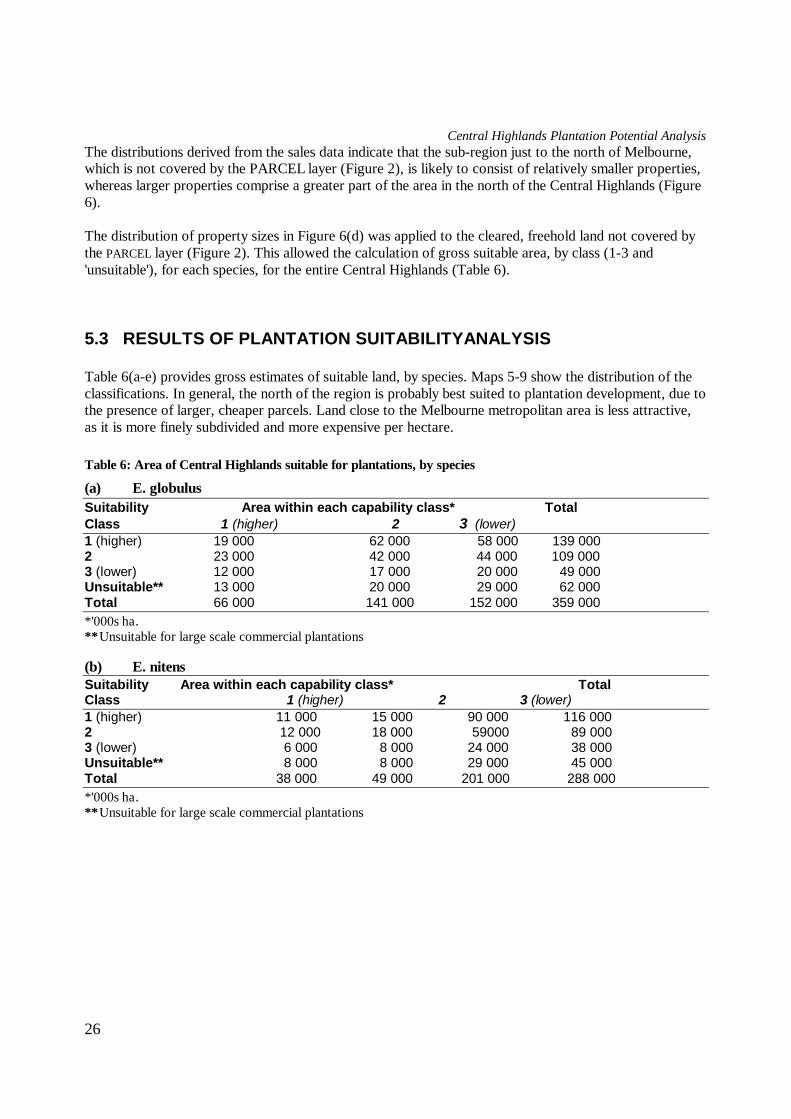
Table 6(a-e) provides gross estimates of suitable land, by species. Maps 5-9 show the distribution of theclassifications. In general, the north of the region is probably best suited to plantation development, due tothe presence of larger, cheaper parcels. Land close to the Melbourne metropolitan area is less attractive,as it is more finely subdivided and more expensive per hectare.
Table 6: Area of Central Highlands suitable for plantations, by species
(a) E. globulusSuitability Area within each capability class* TotalClass 1 (higher) 2 3 (lower)1 (higher) 19 000 62 000 58 000 139 0002 23 000 42 000 44 000 109 0003 (lower) 12 000 17 000 20 000 49 000Unsuitable** 13 000 20 000 29 000 62 000Total 66 000 141 000 152 000 359 000*'000s ha.**Unsuitable for large scale commercial plantations
(b) E. nitensSuitability Area within each capability class* TotalClass 1 (higher) 2 3 (lower)1 (higher) 11 000 15 000 90 000 116 0002 12 000 18 000 59000 89 0003 (lower) 6 000 8 000 24 000 38 000Unsuitable** 8 000 8 000 29 000 45 000Total 38 000 49 000 201 000 288 000*'000s ha.**Unsuitable for large scale commercial plantations
Central Highlands Plantation Potential Analysis
27
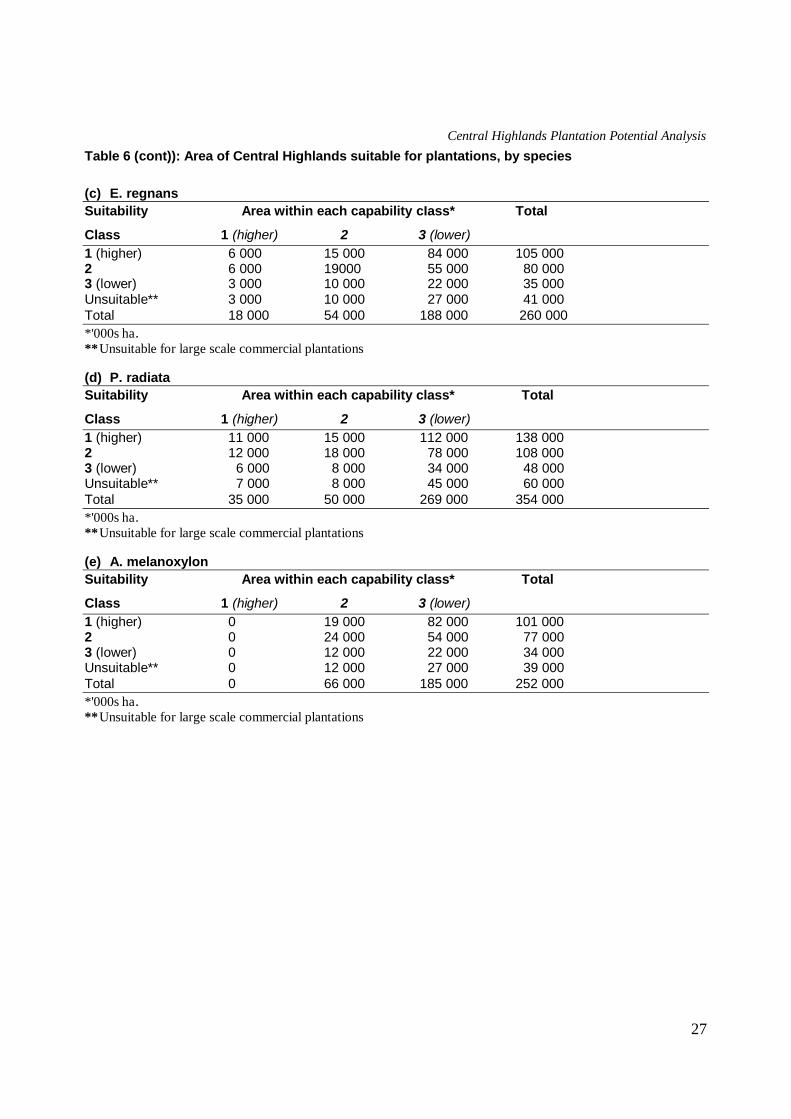
Table 6 (cont)): Area of Central Highlands suitable for plantations, by species
(c) E. regnansSuitability Area within each capability cIass* Total
Class 1 (higher) 2 3 (lower)1 (higher) 6 000 15 000 84 000 105 0002 6 000 19000 55 000 80 0003 (lower) 3 000 10 000 22 000 35 000Unsuitable** 3 000 10 000 27 000 41 000Total 18 000 54 000 188 000 260 000*'000s ha.**Unsuitable for large scale commercial plantations
(d) P. radiataSuitability Area within each capability class* Total
Class 1 (higher) 2 3 (lower)1 (higher) 11 000 15 000 112 000 138 0002 12 000 18 000 78 000 108 0003 (lower) 6 000 8 000 34 000 48 000Unsuitable** 7 000 8 000 45 000 60 000Total 35 000 50 000 269 000 354 000*'000s ha.**Unsuitable for large scale commercial plantations
(e) A. melanoxylonSuitability Area within each capability class* Total
Class 1 (higher) 2 3 (lower)1 (higher) 0 19 000 82 000 101 0002 0 24 000 54 000 77 0003 (lower) 0 12 000 22 000 34 000Unsuitable** 0 12 000 27 000 39 000Total 0 66 000 185 000 252 000*'000s ha.**Unsuitable for large scale commercial plantations
Central Highlands Plantation Potential Analysis
28
5.4 DISCUSSION OF PLANTATION SUITABILITY
The study found that land price, which is an important determinant of plantation suitability, varies acrossthe region. The large proportion of smaller properties in certain areas would limit larger-scale plantings,but larger properties in other parts of the region could be suitable and are generally at the lower end of theprice range per hectare.
This study has broadly stratified the Central Highlands into relative suitability classes for plantationdevelopment, in terms of prevailing land prices and parcel size. However, the results are not of a scaleappropriate for detailed investment decisions.
Stewart's 1989 economic analysis of plantation potential in Victoria, which assumed that land must bepurchased outright, concluded that while there are lands capable of growing plantations in the CentralHighlands region, it would be uneconomic to do so - with land prices at that time being at around$8000 - $10 000 per hectare (Stewart 1989). This may still be the case, with median land price of around$13 000 per hectare4, if land is to be purchased along with its improvements.
If land can be rented at rates reflecting its unimproved value, investment becomes more attractive, withthe median price being around $8300 per hectare (though ranging from $2500 to more than $15000 perhectare). Under joint-venture schemes between commercial growers/processors and property owners, theowners may continue to live on the property, thereby benefiting from the house and other improvements,which may be major components of the improved value. This approach may not only prove cheaper toimplement, but may also help to avoid many of the negative effects and perceptions of plantations thatwere analysed in-depth by the Victorian State Plantations Impact Study (Spencer 1989).
Plantation viability is also strongly dependent on macro-economic conditions (Stephens & Hansard1994). If predicted world market trends for forest products are indicative (Section 2.2), then the 1990conclusion of the Forest and Forest Product Industry Council, that areas of the Central Highlands are oflimited suitability, warrants reexamination. Case studies at a local scale, including thorough sensitivityanalyses, would be required to determine plantation competitiveness. One method for doing this could bethe Forest Resource Use Model (FORUM) using linear programming and involving residual pricing,discounted cash flow analysis and optimised allocation of resources. FORUM has been used to assess thecompetitiveness of plantation ventures in the Bathurst region of New South Wales (Hansard et al 1996).
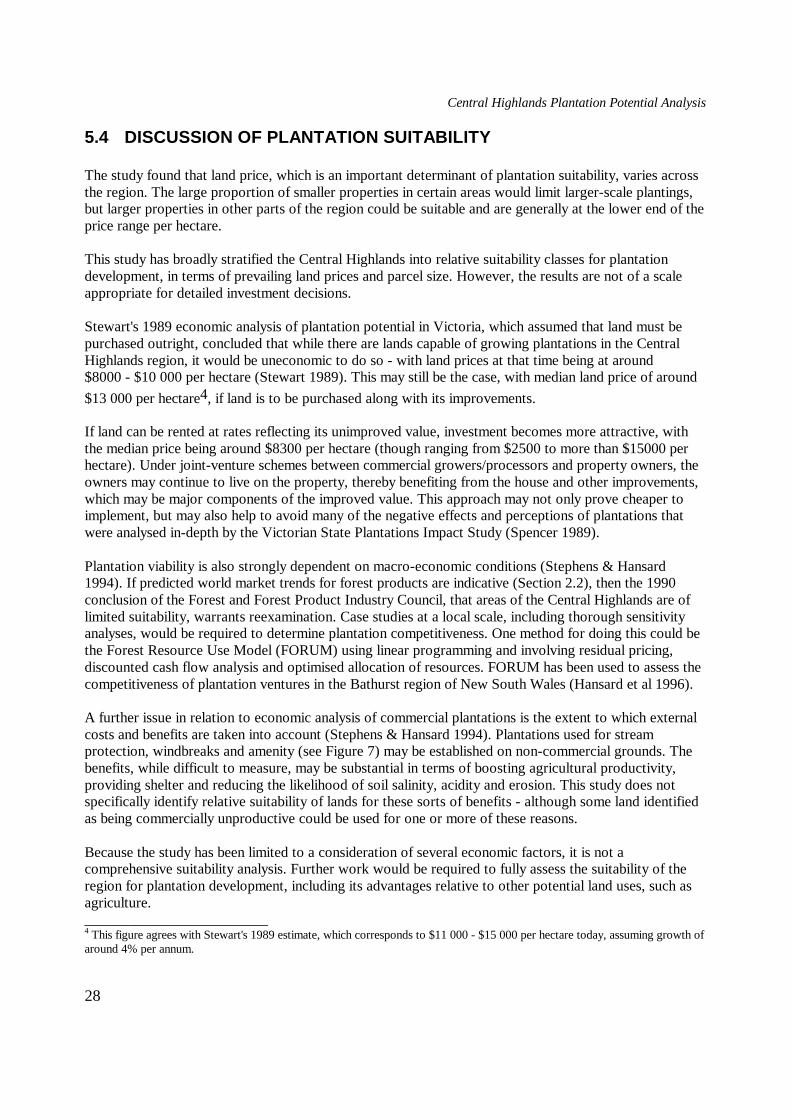
A further issue in relation to economic analysis of commercial plantations is the extent to which externalcosts and benefits are taken into account (Stephens & Hansard 1994). Plantations used for streamprotection, windbreaks and amenity (see Figure 7) may be established on non-commercial grounds. Thebenefits, while difficult to measure, may be substantial in terms of boosting agricultural productivity,providing shelter and reducing the likelihood of soil salinity, acidity and erosion. This study does notspecifically identify relative suitability of lands for these sorts of benefits - although some land identifiedas being commercially unproductive could be used for one or more of these reasons.
Because the study has been limited to a consideration of several economic factors, it is not acomprehensive suitability analysis. Further work would be required to fully assess the suitability of theregion for plantation development, including its advantages relative to other potential land uses, such asagriculture._________________________4 This figure agrees with Stewart's 1989 estimate, which corresponds to $11 000 - $15 000 per hectare today, assuming growth ofaround 4% per annum.
Central Highlands Plantation Potential Analysis
29
Figure 7. Plantation options: Scale and purpose
Central Highlands Plantation Potential Analysis
30
6. Conclusion
This study has shown that there is a substantial area of land in the Central Highlands that is capable ofsupporting plantations of both softwood and hardwood species. Compared with other areas of Australia,the region is rich in land with plantation capability - which is a reflection of its relatively favourableclimate and soils. Suitability, as measured by parcel size, varies significantly within the region - andcompetition from other land uses is undoubtedly high. In addition to factors considered in the currentstudy, the future suitability of Central Highlands land for plantations is likely to be influenced bydemands for agricultural products and for land for subdivision close to urban Melbourne.
The methodology developed for this study was based on numerous assumptions determined by the natureand quantity of data available. These assumptions have been documented and discussed. Many otherfactors will ultimately determine whether or not a plantation project is worth undertaking, particularly theavailability of markets, the opportunity cost of substituting plantations for alternative land uses and theprice of wood, land and capital. For individual investors, a decisive analysis can only be made accordingto their particular circumstances and the specific attributes of individual sites.
Central Highlands Plantation Potential Analysis
31
7. References
For a list of the abbreviations used in the text and following references, see page vi.
Australia (Commonwealth Forests Taskforce) 1995, Wood and Paper Industry Strategy, ForestsTaskforce, Department of Prime Minister and Cabinet, Canberra. 26 pp.
Booth, T.H. & Jovanovic, T. 1991, 'Appendix B: Identification of Land Capable ofPrivate Plantation Development', in Integrating Forestry & Farming: Commercial WoodProduction on Agricultural Land, Report of the National Plantations AdvisoryCommittee, Commonwealth of Australia, Canberra.
Central Highlands CRA Report 1997, joint Commonwealth-Victorian RFA Steering Committee,Canberra. 256 pp.
Clark, J. 1995, Australia's Plantations-Industry, Employment, Environment, Report to the Stateconservation councils, Environment Victoria , Melbourne, 295 pp.
Cremer, K.W. 1969, 'Growth of eucalypts in experimental plantations near Canberra', AustralianForestry, vol 33, pp.135-144.
Cromer, RN. 1996, 'Silviculture of Eucalypt Plantations in Australia', in Nutrition of Eucalypts, eds P. M.Attiwill & M. A Adams, CSIRO, Collingwood, Victoria, 440 pp.
de Fégley, A. R., Meynink R. W. & Vroege, M. 1997, 'Wood products in Asia Pacific - opportunity oroversupply?' in Preparing for the 21st Century: Proceedings of the Australian and New Zealand Instituteof Foresters 1997 Conference, eds Bachelard & Brown, Institute of Foresters of Australia, Canberra.pp.29-44.
Ferguson, I.S. 1997, 'Changes and challenges in trade and investment: An Australianperspective', in Preparing for the 21st Century: Proceedings of the Australian and NewZealand Institute of Foresters 1997 Conference, eds Bachelard & Brown, Institute ofForesters of Australia, Canberra. pp.23-30.
Florence, R.G. 1996, Ecology and silviculture of eucalypt forests, CSIRO, Collingwood, 413 pp.
Forestry Commission. 1990, Plantation Handbook, by W. A. Neilsen, Hobart, Tasmania, 270 pp.
Hackett, C. 1988, 'Matching Plants and Land', Natural Resource Series, no. 11, CSIRO Division of Landand Water Resources, Canberra, 82 pp.
Hansard, A., Dann, T., Stephens, M., Clark, J., 1996, 'An economic model for comprehensive regionalforest assessments: A case study-some issues and considerations', Outlook '96 conference proceedings,Australian Bureau of Agricultural and Resource Economics, Canberra.
Central Highlands Plantation Potential Analysis
32
James, R. N., Florence, R. G., Mahendrarajah, S. & Turner, B. J. 1995, Forest Plantations of Australia:Their Role in Providing Current and Future wood Supplies, Department of Forestry, Australian NationalUniversity, Canberra, 25 pp.
Johnson, S. 1997 . 'Outlook for tropical forest products trade in the Pacific Rim', Proceedings of Outlook'97', Australian Bureau of Agricultural and Resource Economics, Canberra, pp.183-190.
Lewis, N. B. & Ferguson, I. S. 1993, Management of radiata pine, Inkata Press, Melbourne, 404 pp.
Lindenmayer, D. B., Mackey, B. G. & Nix, H. A. 1996, 'The bioclimatic domains of four species ofcommercially important eucalypts from south-eastern Australia', Australian Forestry, vol 59, pp.74-89.
McMahon, J. P, Hutchinson, M. F, Nix, H. A, Houlder, D. J. 1997. ANUCLIM UserGuide, Version 2.0. Centre for Resource and Environmental Studies, The AustralianNational University, Canberra, 87 pp.
National Forest Policy Statement 1992, National Forest Policy Statement A New Focus for Australia'sForests, AGPS. 52 pp.
National Plantations Advisory Committee 1991, Integrating Forestry and Farming:commercial wood production on cleared agricultural land: Appendices A, B & C, Department of PrimaryIndustries and Energy, Canberra.(A) 142 pp, (B) 253 pp, (C)359 pp.
Neufeld, B. 1997, 'Key influences on domestic production and consumption of forest products, inProceedings of Outlook '97', Australian Bureau of Agricultural and Resource Economics, Canberra,pp.191-198.
New Zealand Ministry of Forestry 1995, A Report on Wood Supply and Demand in Australia, NewZealand, 30 pp.
NH 1997, National Plantation Inventory of Australia, Bureau of Resource Sciences, Canberra, 96 pp.
Plantation 2020 Vision Implementation Committee 1997, 'The plantations 2020 vision implementationplan (draft), Report to the Standing Committee on Forestry, Ministerial Council on Forestry, Fisheries &Aquaculture, Canberra, 29 pp.
Plantations for Australia: The 2020 Vision 1997, Plantation 2020 VisionImplementation Committee, Department of Primary Industries and Energy, Canberra.88 pp.
Rowan, J. 1990, Land systems of Victoria, Land Conservation Council/Department of Conservation andEnvironment, Victoria. 80 pp.
SOFR unpub, second draft, NFI, Bureau of Resource Sciences, Canberra.
Spencer, R. D. ed. 1989, Consultant's Report to State Plantations Impact Study. Centre for Farm Planningand Land Management, Faculty of Agriculture and Forestry, University of Melbourne, 214 pp.
Central Highlands Plantation Potential Analysis
33
Spencer, R. D. & Jellinek, L. 0.1995, 'Public concerns about pine plantations in Victoria', AustralianForestry, vol 58, no.3, pp.99-106.
State Forests n.d. Eucalypt Plantations in NSW, by B. Furrer, Sydney, 22 pp.
Stephens, M. L. & Hansard, A. W. 1994, 'An economic appraisal of timber management options forprivate forests in northern Tasmania', Proceedings of the biennial conference of the Australian ForestGrowers, Launceston, Tasmania, 2-5 May1994.
Stewart, H. T. L. 1989, 'Suitability of freehold land in Victoria for eucalypt plantations' in Potential Roleof Hardwood Plantations in Supplementing Australia’s Forest Resources: Statement by the ForestProducts Industry Council-Appendices, Canberra, 98 pp.
Tasmanian-Commonwealth RFA 1996, Background Report Part D, Social &Economic Report Vol Ii, Tasmanian Public Land Use Commission in conjunction withCommonwealth Forests Taskforce, Hobart, 201 pp.
Tumbull, J.W. & Pryor, L.D. 1978, 'Choice of species and seed sources' in Eucalypts for woodproduction, eds A.G. Brown & W. E. Hillis, CSIRO Melbourne. pp.6-65.
Turner, B. J. & James, R. N. 1997, 'Australian forest plantations-how much will they produce? inPreparing for the 2Jst Century: Proceedings of the Australian and New Zealand Institute of Foresters1997 Conference, eds Bachelard & Brown, Canberra. pp.45-52.
Valzano, F. unpub, 'Capability of soils for plantation use', Consultant's report to the Bureau of ResourceSciences.
Central Highlands Plantation Potential Analysis
Appendix I - Growth and yield estimates
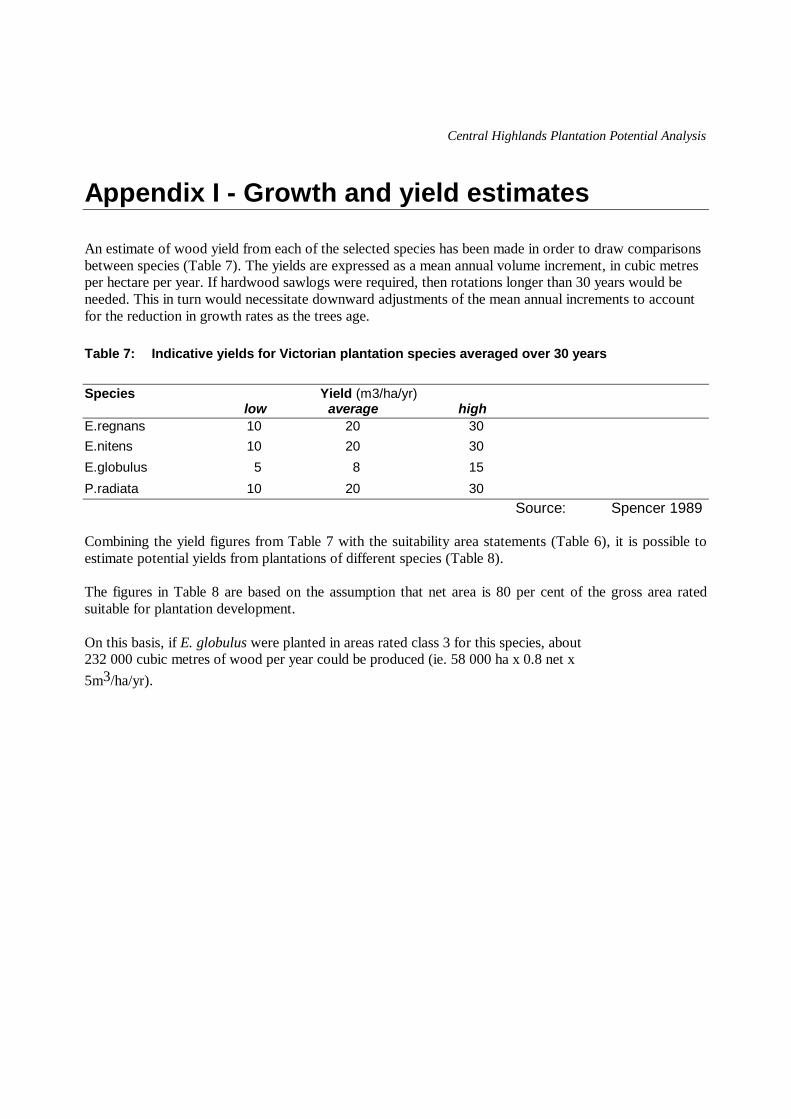
An estimate of wood yield from each of the selected species has been made in order to draw comparisonsbetween species (Table 7). The yields are expressed as a mean annual volume increment, in cubic metresper hectare per year. If hardwood sawlogs were required, then rotations longer than 30 years would beneeded. This in turn would necessitate downward adjustments of the mean annual increments to accountfor the reduction in growth rates as the trees age.
Table 7: Indicative yields for Victorian plantation species averaged over 30 years
Species Yield (m3/ha/yr)low average high
E.regnans 10 20 30E.nitens 10 20 30E.globulus 5 8 15
P.radiata 10 20 30Source: Spencer 1989
Combining the yield figures from Table 7 with the suitability area statements (Table 6), it is possible toestimate potential yields from plantations of different species (Table 8).
The figures in Table 8 are based on the assumption that net area is 80 per cent of the gross area ratedsuitable for plantation development.
On this basis, if E. globulus were planted in areas rated class 3 for this species, about232 000 cubic metres of wood per year could be produced (ie. 58 000 ha x 0.8 net x5m3/ha/yr).
Central Highlands Plantation Potential Analysis
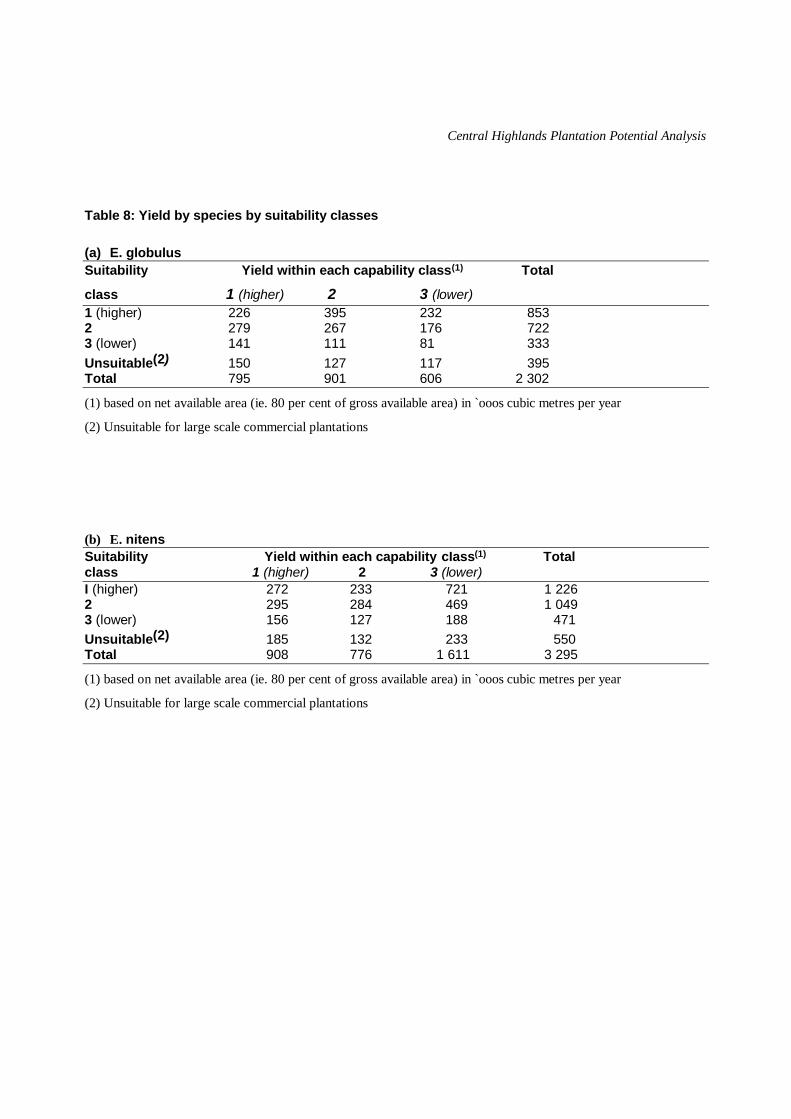
Table 8: Yield by species by suitability classes
(a) E. globulusSuitability Yield within each capability class(1) Total
class 1 (higher) 2 3 (lower)1 (higher) 226 395 232 8532 279 267 176 7223 (lower) 141 111 81 333Unsuitable(2) 150 127 117 395Total 795 901 606 2 302
(1) based on net available area (ie. 80 per cent of gross available area) in `ooos cubic metres per year
(2) Unsuitable for large scale commercial plantations
(b) E. nitensSuitability Yield within each capability cIass(1) Totalclass 1 (higher) 2 3 (lower)I (higher) 272 233 721 1 2262 295 284 469 1 0493 (lower) 156 127 188 471Unsuitable(2) 185 132 233 550Total 908 776 1 611 3 295
(1) based on net available area (ie. 80 per cent of gross available area) in `ooos cubic metres per year
(2) Unsuitable for large scale commercial plantations
Central Highlands Plantation Potential Analysis
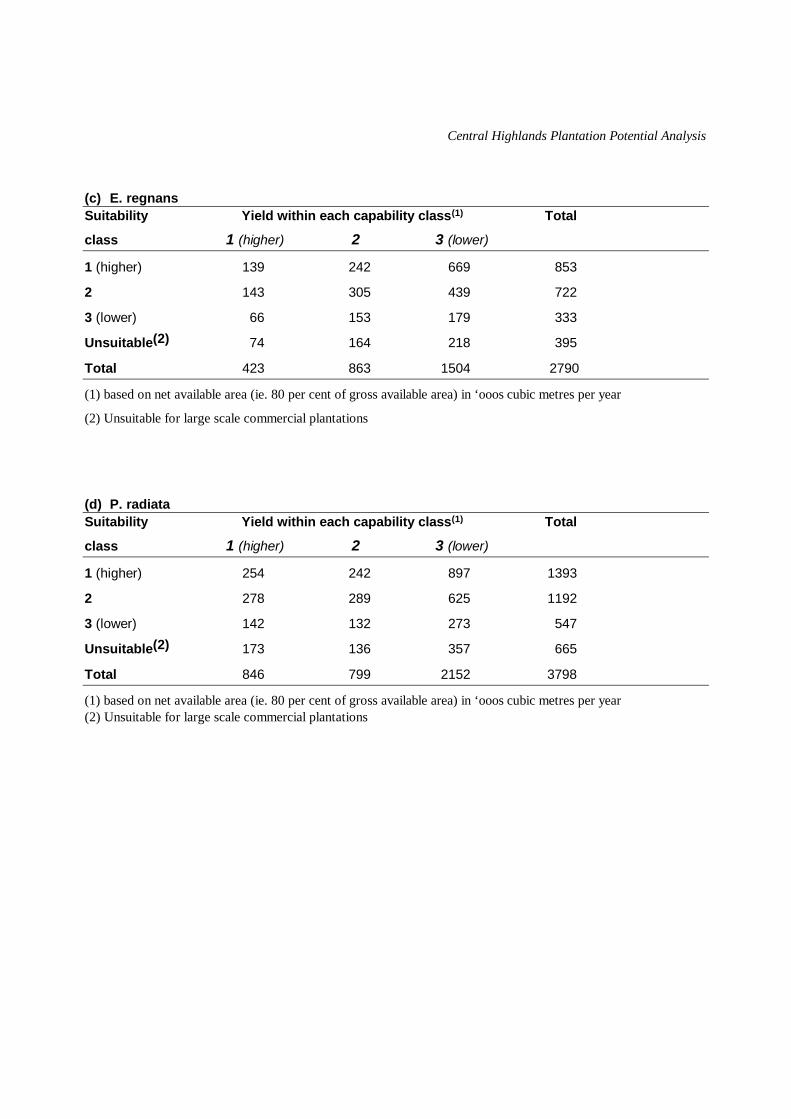
(c) E. regnansSuitability Yield within each capability class(1) Total
class 1 (higher) 2 3 (lower)
1 (higher) 139 242 669 853
2 143 305 439 722
3 (lower) 66 153 179 333
Unsuitable(2) 74 164 218 395
Total 423 863 1504 2790
(1) based on net available area (ie. 80 per cent of gross available area) in ‘ooos cubic metres per year
(2) Unsuitable for large scale commercial plantations
(d) P. radiataSuitability Yield within each capability class(1) Total
class 1 (higher) 2 3 (lower)
1 (higher) 254 242 897 1393
2 278 289 625 1192
3 (lower) 142 132 273 547
Unsuitable(2) 173 136 357 665
Total 846 799 2152 3798
(1) based on net available area (ie. 80 per cent of gross available area) in ‘ooos cubic metres per year(2) Unsuitable for large scale commercial plantations
Central Highlands Plantation Potential Analysis
Appendix II - Climatic variables and speciesthresholds
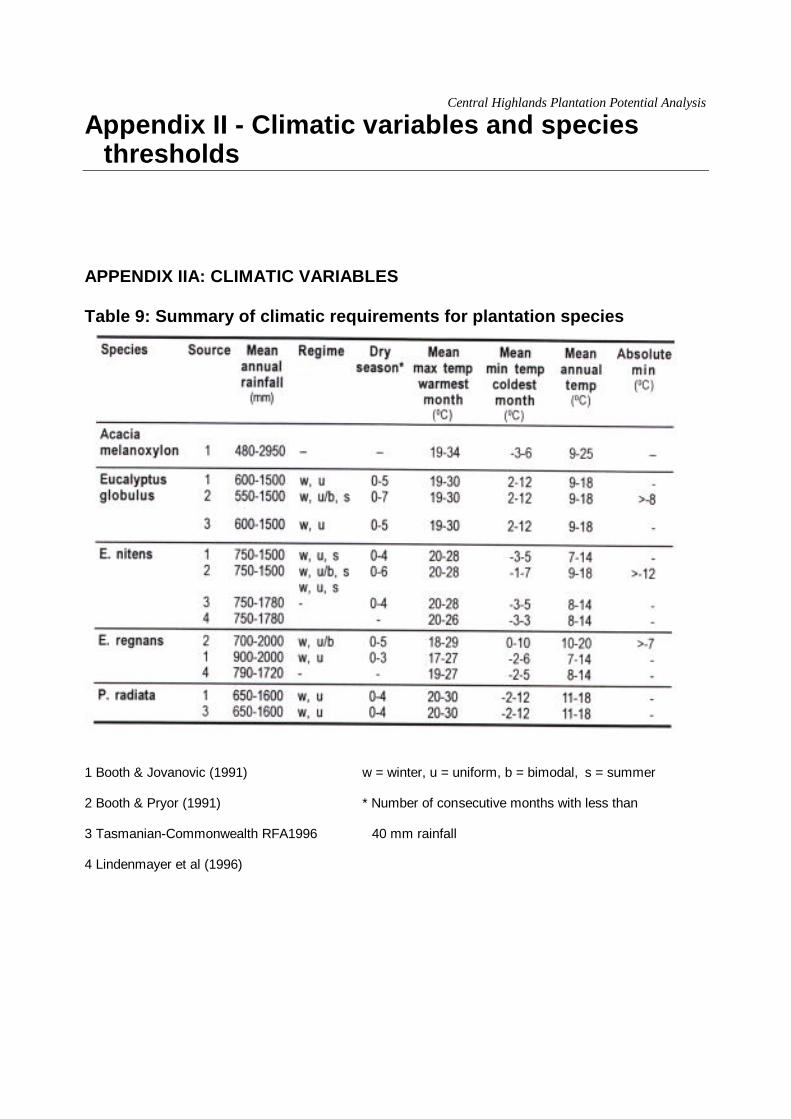
APPENDIX IIA: CLIMATIC VARIABLES
Table 9: Summary of climatic requirements for plantation species
1 Booth & Jovanovic (1991) w = winter, u = uniform, b = bimodal, s = summer
2 Booth & Pryor (1991) * Number of consecutive months with less than
3 Tasmanian-Commonwealth RFA1996 40 mm rainfall
4 Lindenmayer et al (1996)
Central Highlands Plantation Potential Analysis
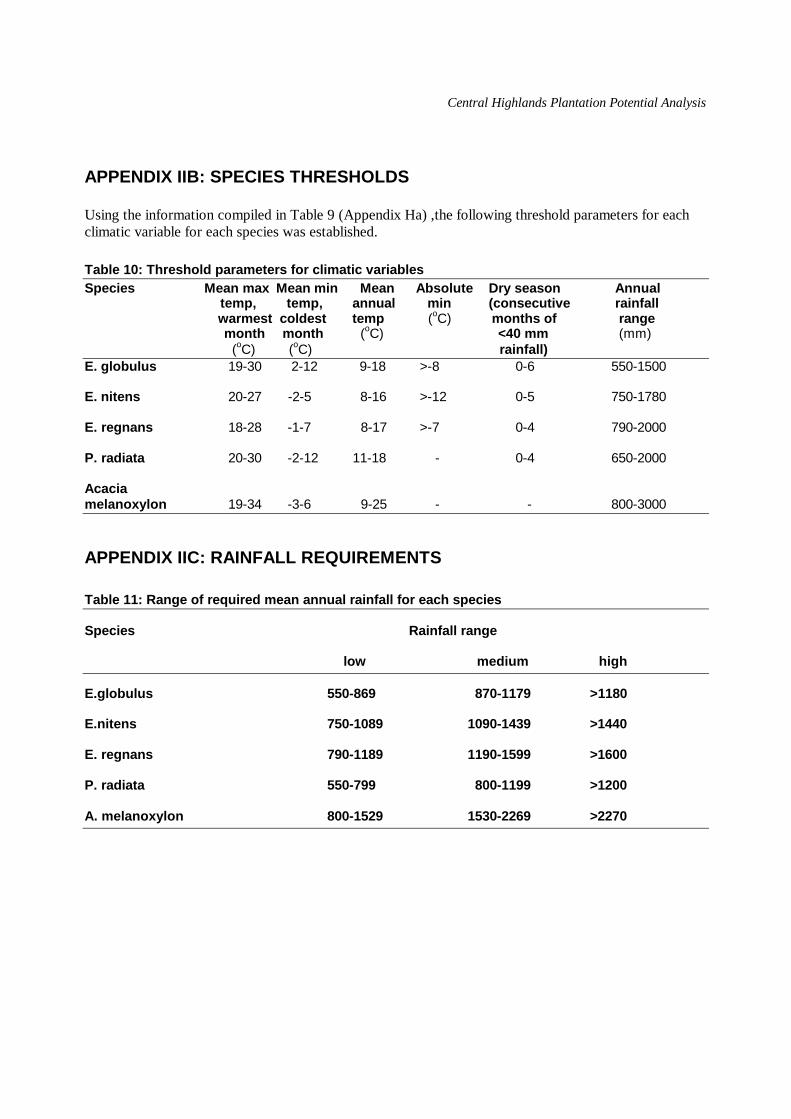
APPENDIX IIB: SPECIES THRESHOLDS
Using the information compiled in Table 9 (Appendix Ha) ,the following threshold parameters for eachclimatic variable for each species was established.
Table 10: Threshold parameters for climatic variablesSpecies Mean max Mean min Mean Absolute Dry season Annual
temp, temp, annual min (consecutive rainfall warmest coldest temp (oC) months of range month month (oC) <40 mm (mm)
(oC) (oC) rainfall)E. globulus 19-30 2-12 9-18 >-8 0-6 550-1500
E. nitens 20-27 -2-5 8-16 >-12 0-5 750-1780
E. regnans 18-28 -1-7 8-17 >-7 0-4 790-2000
P. radiata 20-30 -2-12 11-18 - 0-4 650-2000
Acaciamelanoxylon 19-34 -3-6 9-25 - - 800-3000
APPENDIX IIC: RAINFALL REQUIREMENTS
Table 11: Range of required mean annual rainfall for each species
Species Rainfall range
low medium high
E.globulus 550-869 870-1179 >1180
E.nitens 750-1089 1090-1439 >1440
E. regnans 790-1189 1190-1599 >1600
P. radiata 550-799 800-1199 >1200
A. melanoxylon 800-1529 1530-2269 >2270
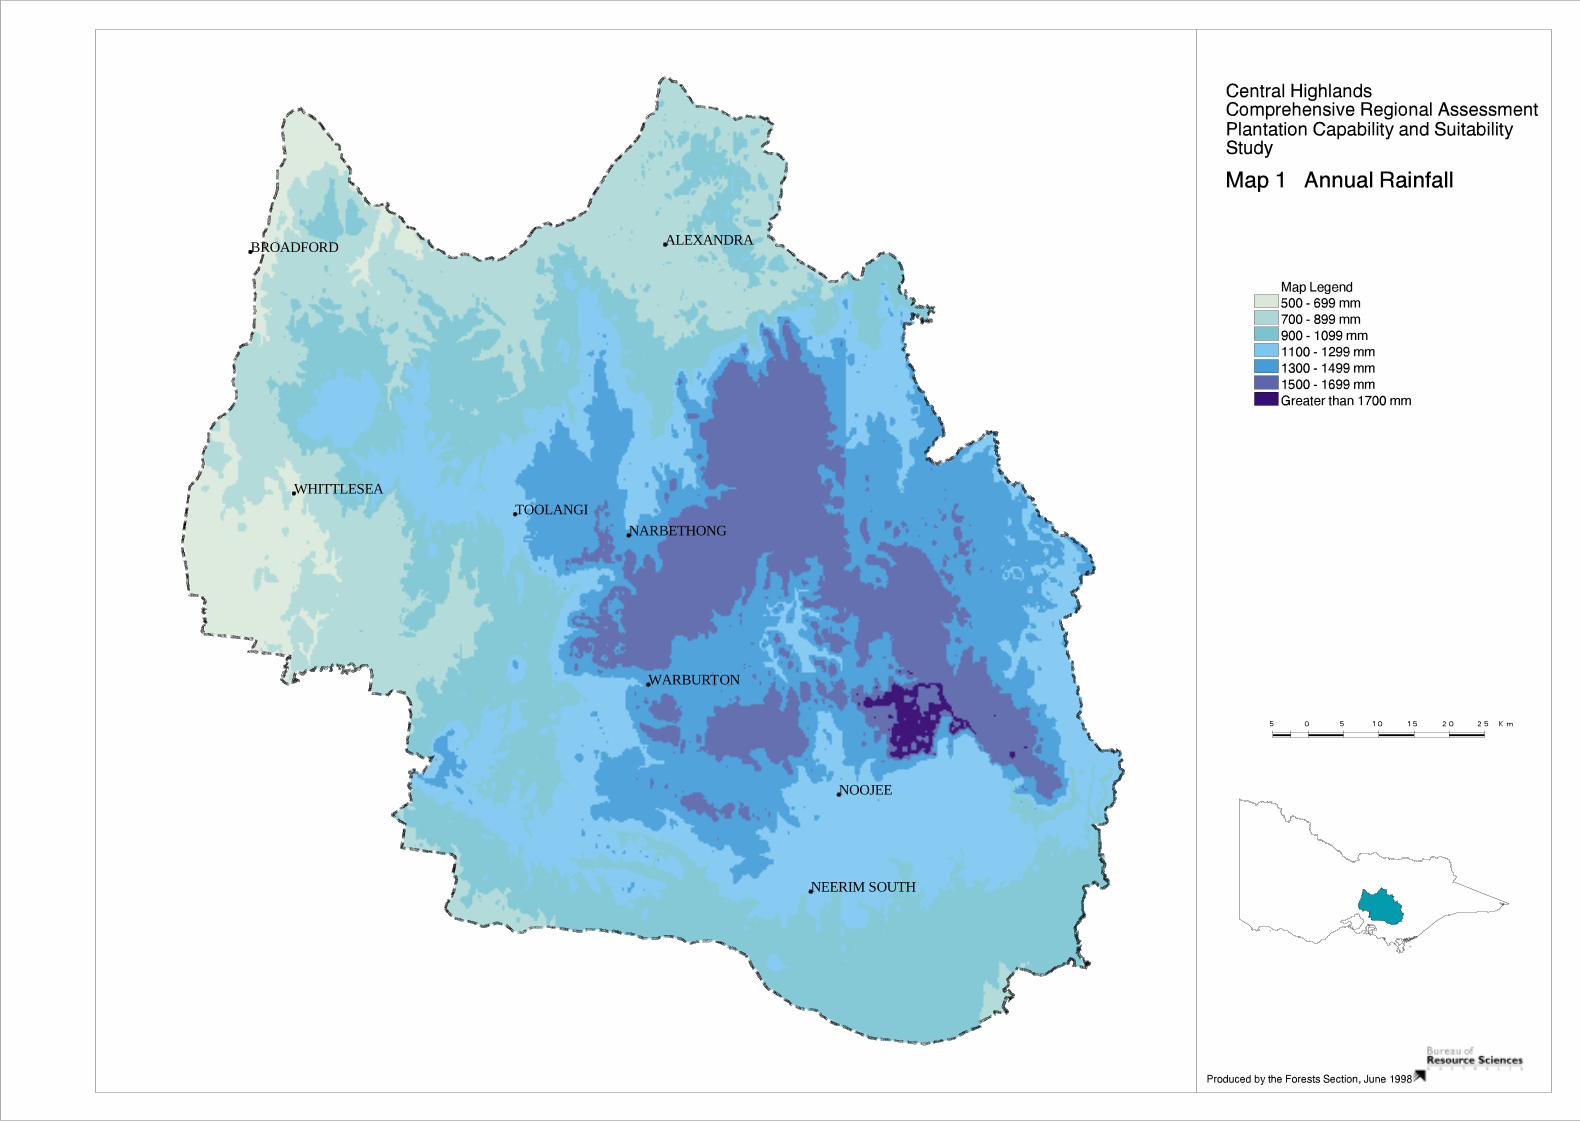
TOOLANGI
BROADFORD
WHITTLESEA
ALEXANDRA
WARBURTON
NARBETHONG
NOOJEE
NEERIM SOUTH
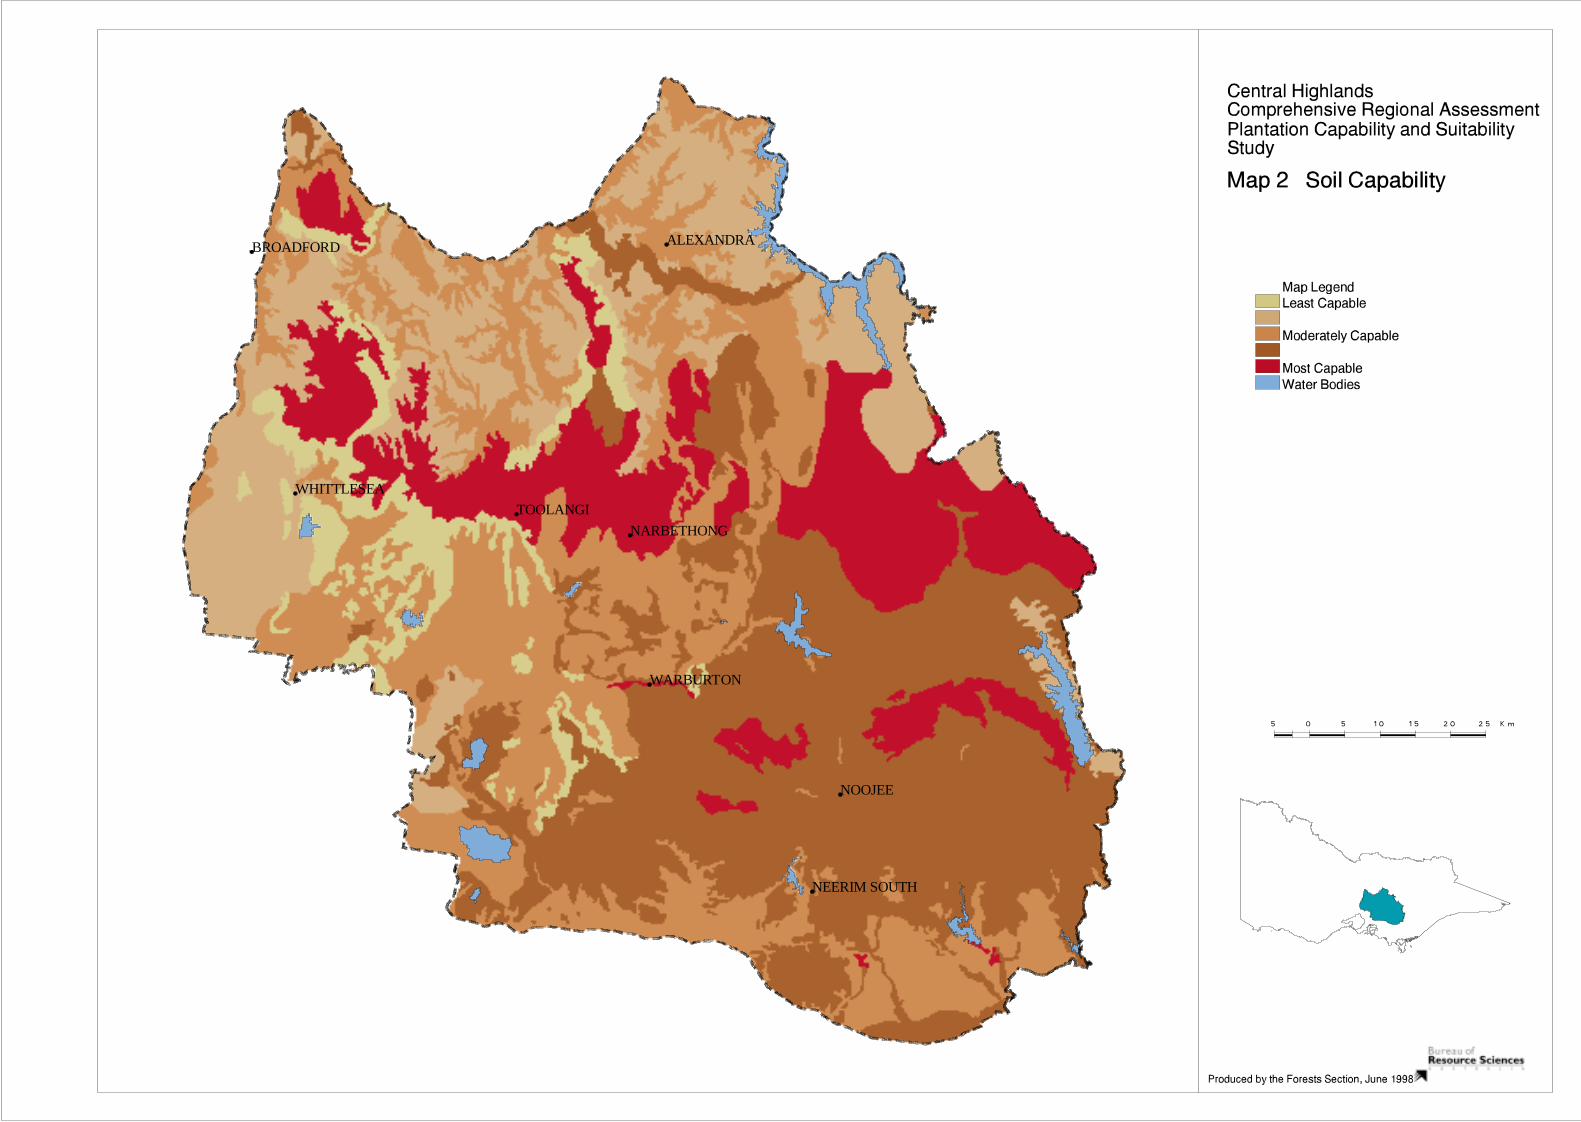
TOOLANGI
BROADFORD
WHITTLESEA
ALEXANDRA
WARBURTON
NARBETHONG
NOOJEE
NEERIM SOUTH
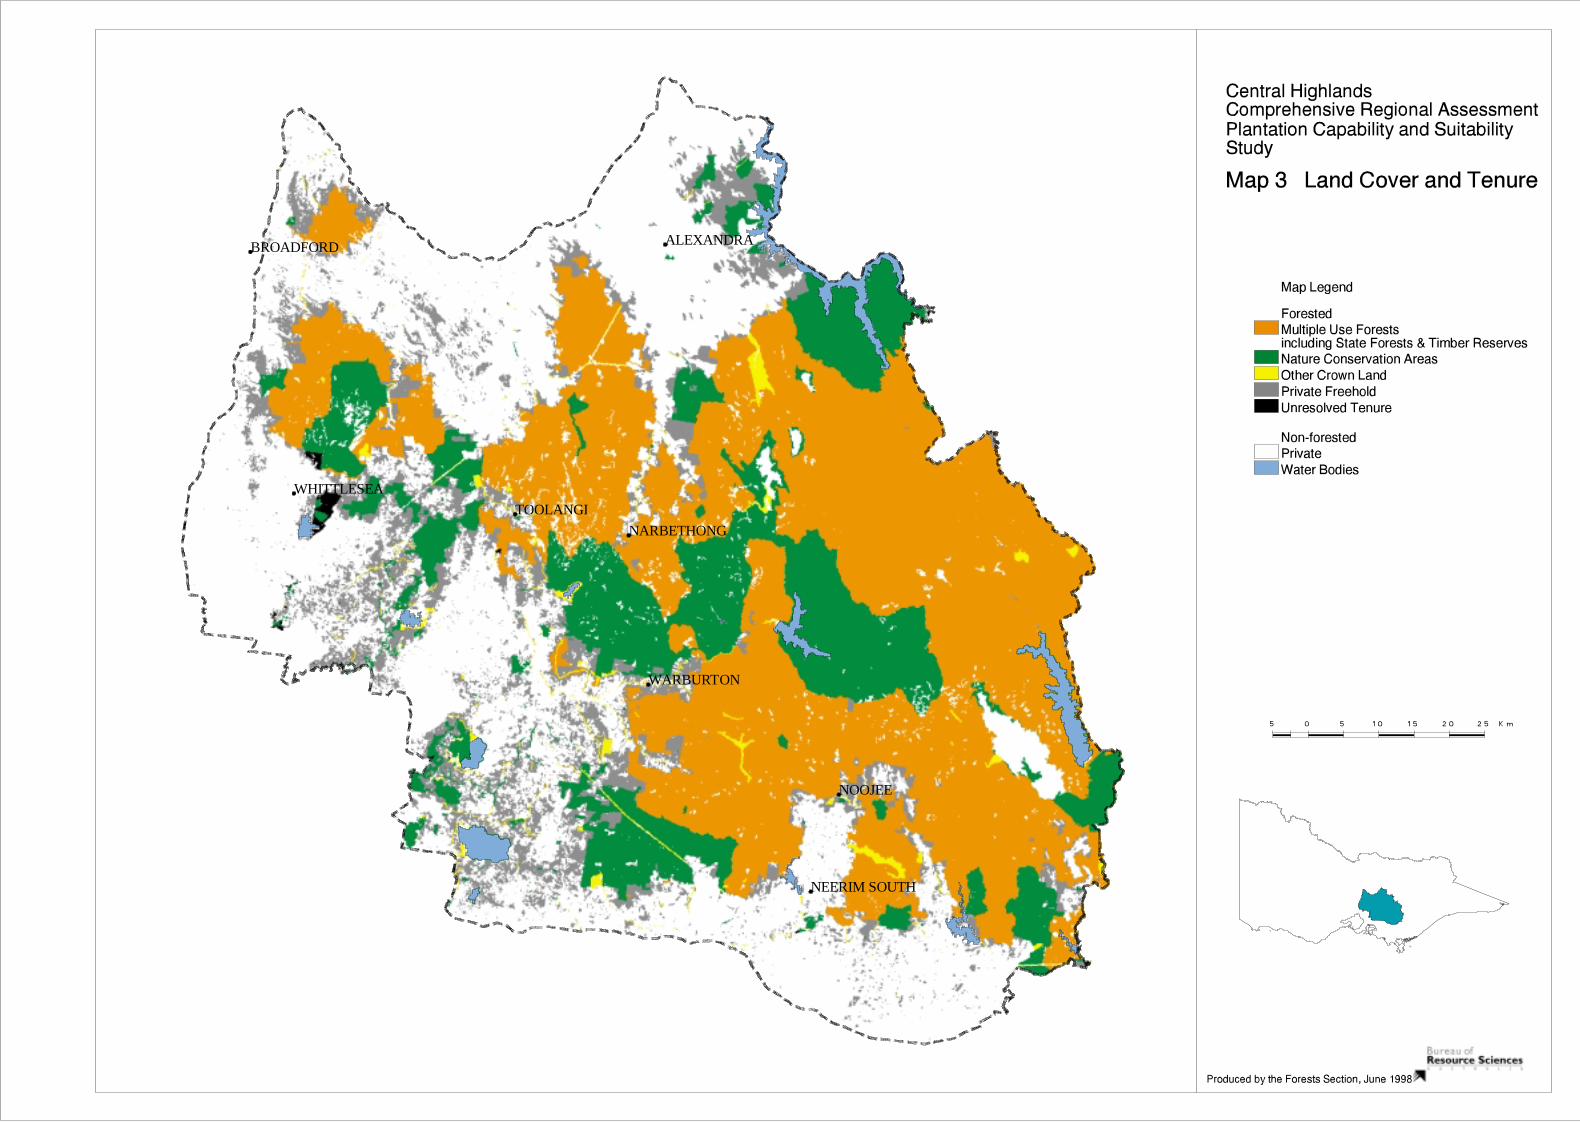
TOOLANGI
BROADFORD
WHITTLESEA
ALEXANDRA
WARBURTON
NARBETHONG
NOOJEE
NEERIM SOUTH
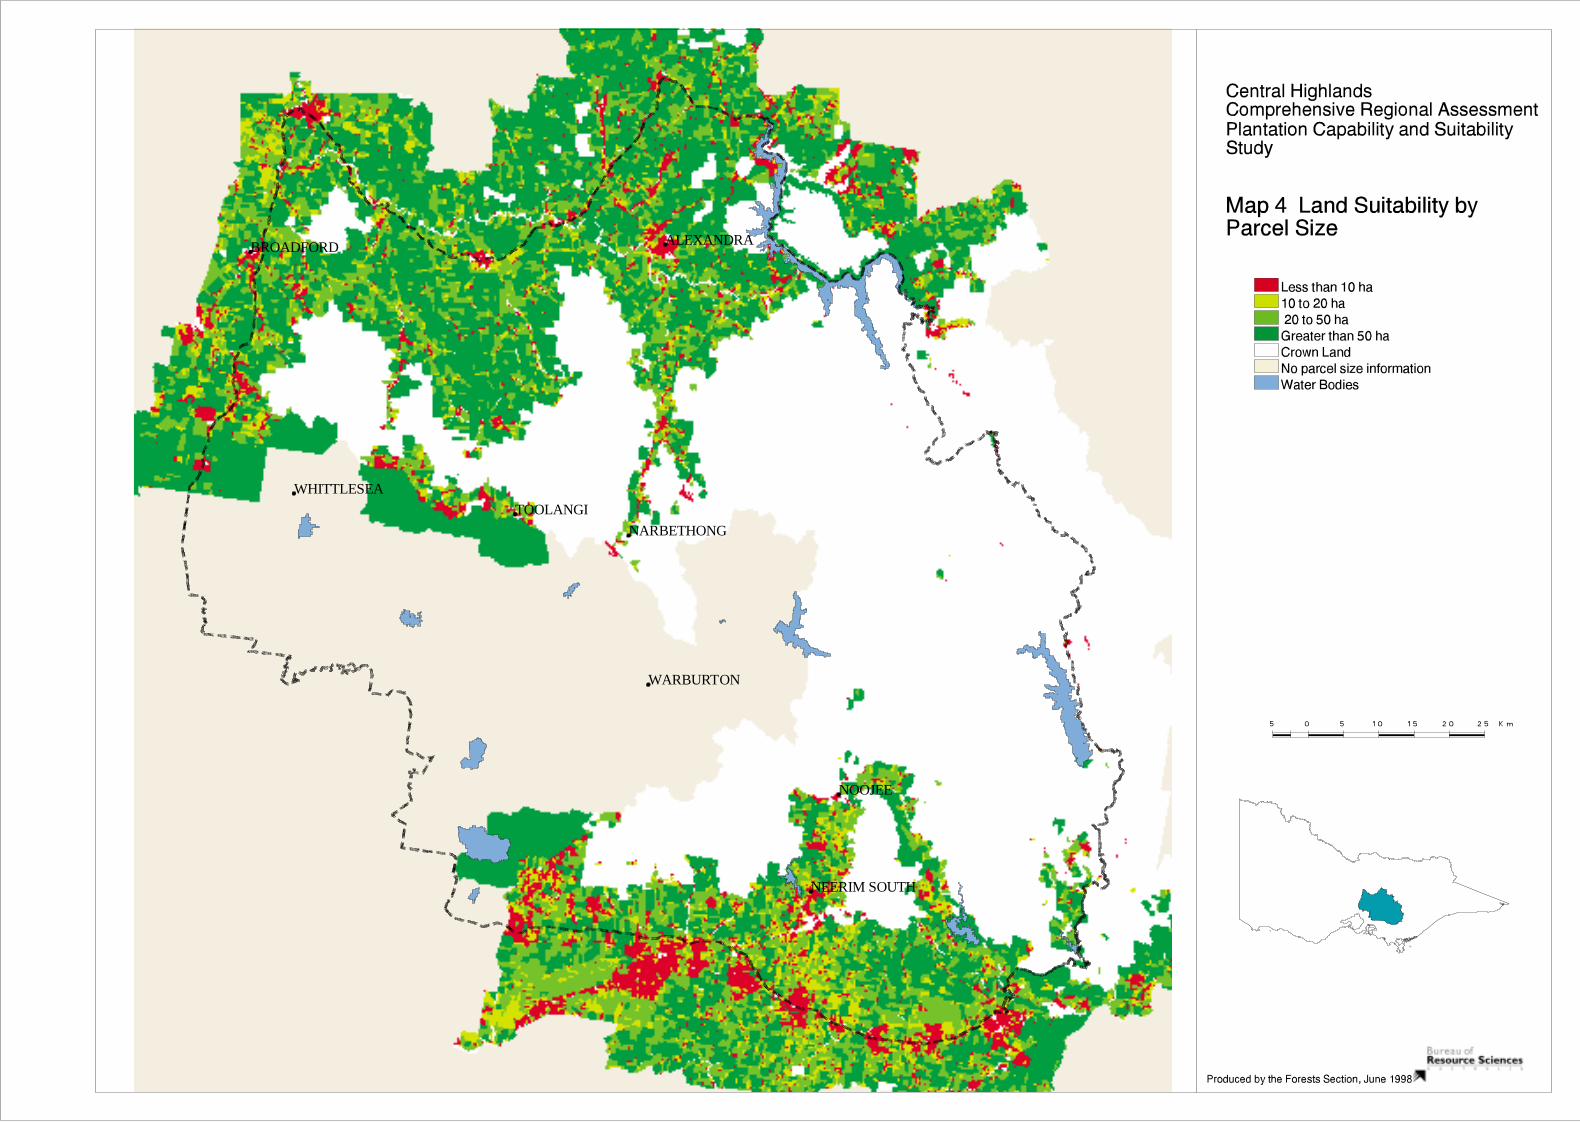
TOOLANGI
BROADFORD
WHITTLESEA
ALEXANDRA
WARBURTON
NARBETHONG
NOOJEE
NEERIM SOUTH
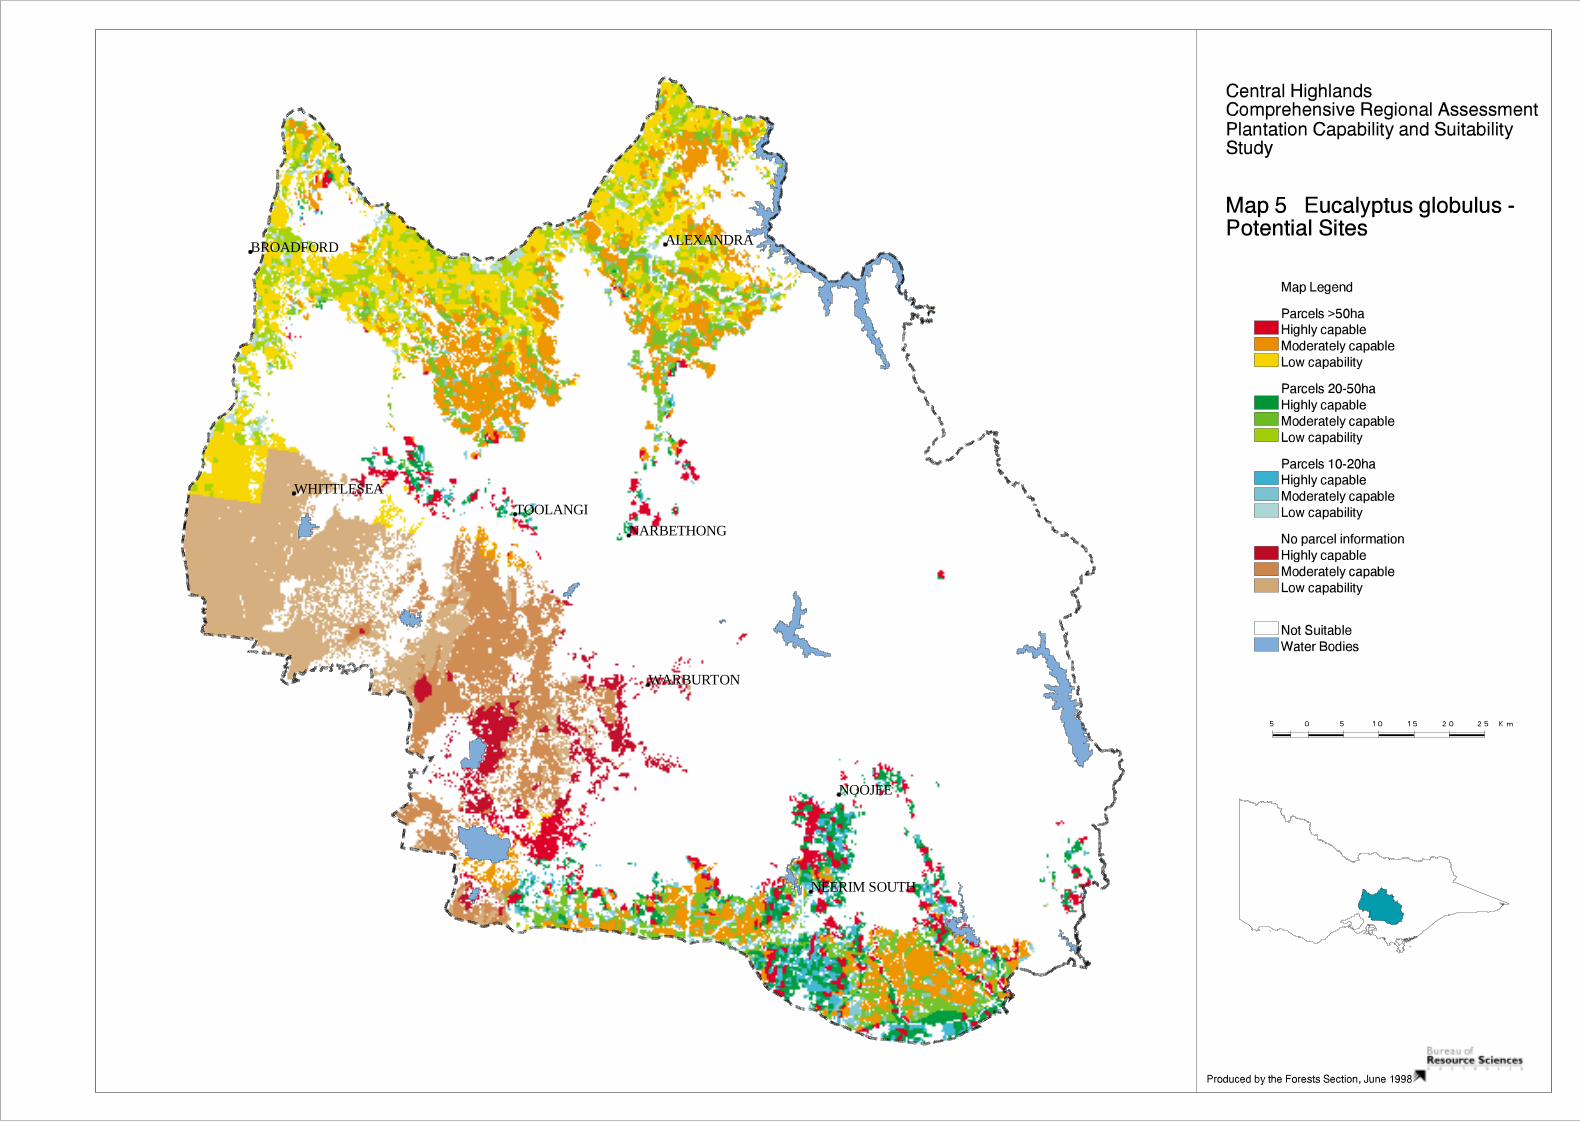
TOOLANGI
BROADFORD
WHITTLESEA
ALEXANDRA
WARBURTON
NARBETHONG
NOOJEE
NEERIM SOUTH

TOOLANGI
BROADFORD
WHITTLESEA
ALEXANDRA
WARBURTON
NARBETHONG
NOOJEE
NEERIM SOUTH
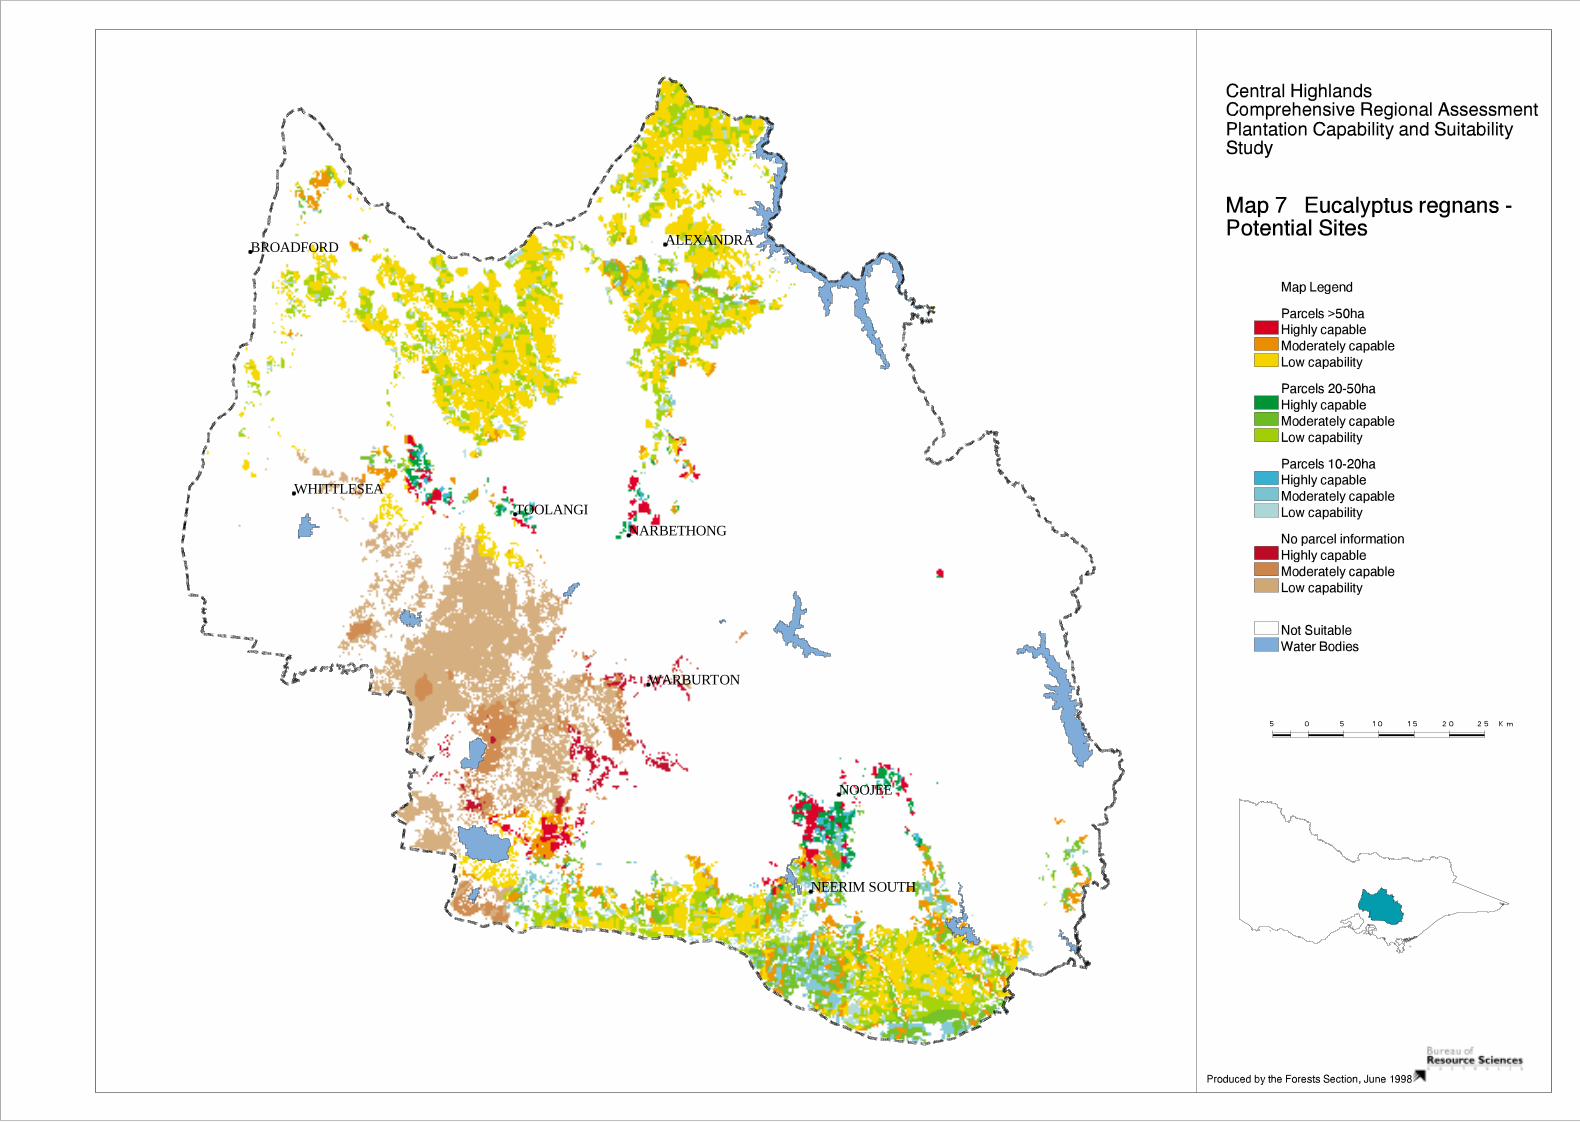
TOOLANGI
BROADFORD
WHITTLESEA
ALEXANDRA
WARBURTON
NARBETHONG
NOOJEE
NEERIM SOUTH
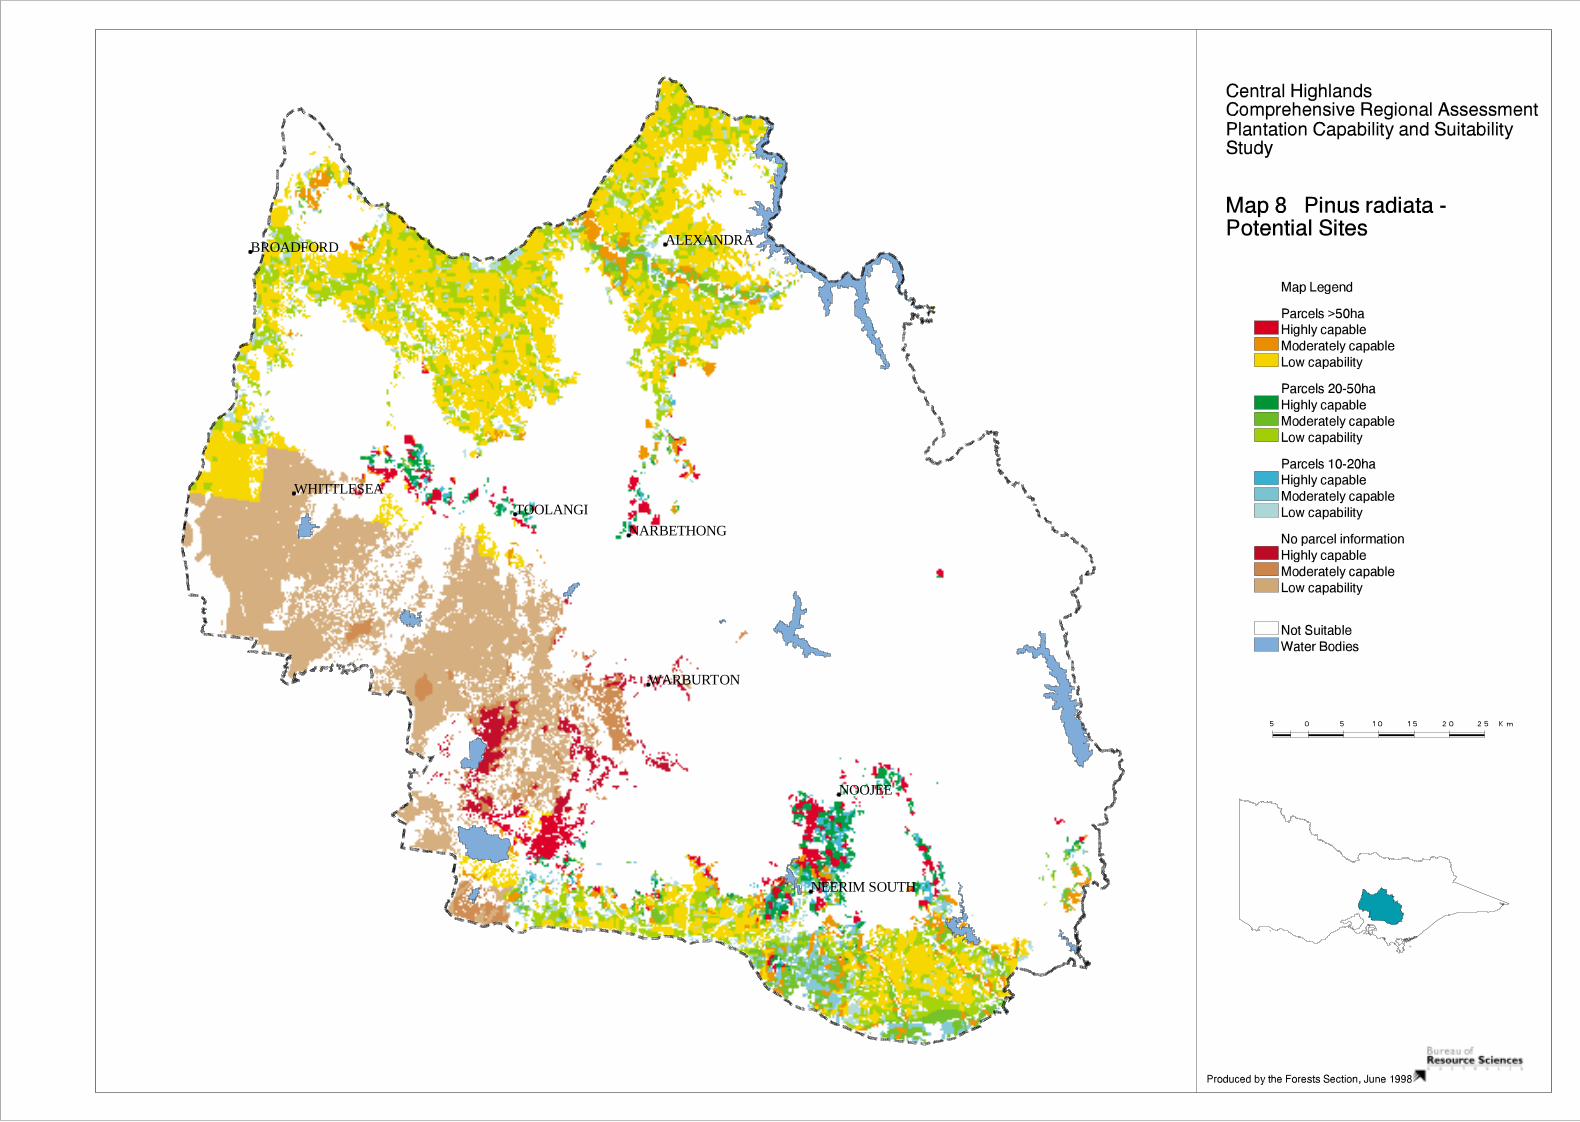
TOOLANGI
BROADFORD
WHITTLESEA
ALEXANDRA
WARBURTON
NARBETHONG
NOOJEE
NEERIM SOUTH
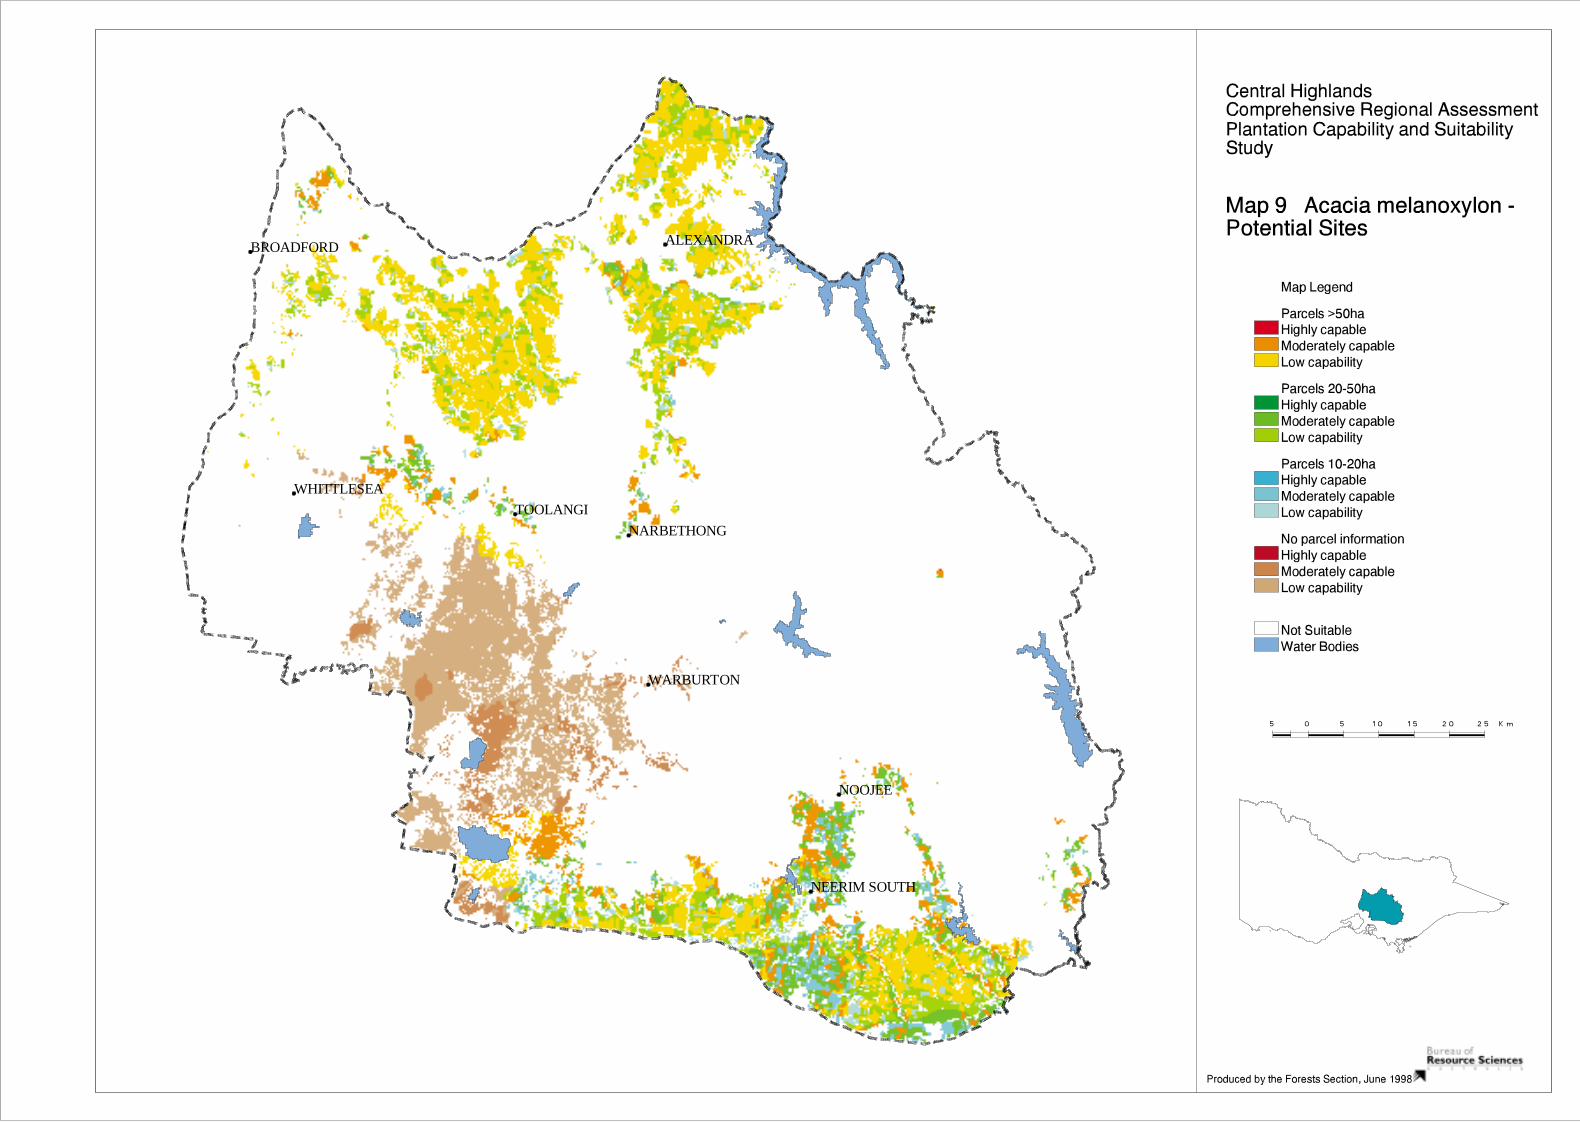
TOOLANGI
BROADFORD
WHITTLESEA
ALEXANDRA
WARBURTON
NARBETHONG
NOOJEE
NEERIM SOUTH