central asia metals · central asia metals (caml) has increased its annual dividend by 24%...
TRANSCRIPT

NB: this marketing communication has been prepared for Central Asia Metals by Marten & Co (which is authorised and regulated by the Financial Conduct Authority) and is non-independent research as defined under the Financial Services Act 2000 (Financial Promotion) Order 2005. It is intended for use by investment professionals as defined in article 19.(5) of that Order. Marten & Co is not authorised to give advice to retail clients and, if you are not a professional investor, or in any other way are prohibited or restricted from receiving this information you should disregard it. Charts and data are sourced from Morningstar unless otherwise stated. Please read the important information at the back of this document.
A consistent dividend payer with a high yield
Central Asia Metals (CAML) has increased its annual dividend by 24% year-on-year, to 15.5p per share, providing shareholders with a 6.6% yield. The company recorded its fifth consecutive year of profits and has paid out in excess of the funds it raised in its 2010 IPO.
CAML’s main asset is its Kounrad copper dump treatment operation, in Kazakhstan, which produces copper through a solvent extraction - electrowinning (SX-EW) plant.
CAML has a long and stable future production profile and, as one of the lowest-cost copper producers in the industry, it should continue to deliver a high dividend yield for many years.
It currently outperforms its peer group of copper producers on most value metrics and has a better EBITDA margin and dividend yield than some of the more prominent London-listed copper producers.
Although ex-production growth, CAML is prudently looking at opportunities to grow its output. The company had cash of US$40 million at the end of 2016 and is debt-free.
Year Cu Prod
(kt)
Cash costs (USc/
lb)
Rev. (U$m)
EBITDA (U$m)
EBITDA margin
(%)
EPS (USc)
2017f 13.5 50 78.3 46.6 60 0.27
2018f 13.2 52 81.6 49.4 60 0.29
2019f 13.2 53 87.0 54.3 62 0.32
Source: Marten & Co
Given our bullish forecast for the copper price, we believe the company offers reliable returns for investors wishing to participate in the commodity sector.
Valuation summary
Our sum-of-the-parts NAV valuation of CAML is 268.5 pence per share, implying that the company is currently trading at a 13% discount to NAV.
M A R T E N & C O
Annual overview | Mining companies 25 April 2017
Central Asia Metals
Listed LSE
Ticker CAML LN
Base currency GBP
Price 234.00p
Daily volume (1-year avg.) 119k shares
1-year high 245.75p
1-year low 138.00p
1-month performance 3.9%
3-month performance 0.4%
1-year performance 27.5%
Calendar YTD perf. 2.9%
Yield 6.6%
Perf. vs MSCI ACWI Nat Res.rebased Time period 23 April 2015 to 23 April 2017
Source: Bloomberg
Net cash US$40.4m
NAV8%/share 268.5p
P/NAV 87%
Market cap £262.3m
Shares outstanding 112.1m
EV/EBITDA 4.5
Click here for our initiation note Click here for our most recent update note
60
80
100
120
140
160
Apr/15 Oct/15 Apr/16 Oct/16
CAML Share PriceMSCI ACWI Natural Resources (GBP adjusted)
M A R T E N & C O Central Asia Metals
Annual overview │ 25 April 2017 Page 02
Contents
4 Introduction
4 Key investment points
5 Investment case
5 Impressive financial results for 2016
5 Figure 1: 2016 financial highlights
6 Figure 2: Comparison of 2016 and 2015 operating costs
6 Industry-leading cost of production
7 Figure 3: Copper mining industry cost curve 2016 (C1 US$/t)
7 A consistent dividend payer with high yield
8 Figure 4: Dividends paid (pence per share)
8 Figure 5: Forecast dividends
8 Proven operational success
9 Figure 6: Annual copper production and costs
9 Western dumps – the key to longevity
9 Valuation
10 Figure 7: Valuation model for CAML
10 Figure 8: Annual copper production forecast
11 Figure 9: projected C1 and fully-allocated costs at Kounrad
11 Figure 10: Comparative copper production and costs
12 Comparative valuation
13 Figure 11: Comparative copper production and costs
13 Figure 12: Comparative copper production and EPS
14 Figure 13: Comparative EBITDA
14 Figure 14: Comparative EV/EBITDA ratios
15 Figure 15: Comparison of production and profitability metrics for CAML and larger London-listed copper producers
15 Sensitivity analysis
15 Figure 16: NAV sensitivity analysis
16 Assets – Kounrad
16 Location
16 History
17 Geology and mineralisation
17 Resources
17 Figure 17: 2013 Resource estimate
18 Figure 18: Remaining copper in Eastern dumps
18 Figure 19: Aerial view of the dumps
19 Processing
19 Figure 20: Schematic Kounrad SX-EW process flowsheet
19 Product sales
M A R T E N & C O Central Asia Metals
Annual overview │ 25 April 2017 Page 03
Contents - continued
19 Expansion complete; transition to Western dumps underway
20 Assets - Copper Bay
20 Assets – Shuak
21 Risks
21 Copper prices
21 Figure 21: LME spot copper price (US$/t)
22 Figure 22: LME copper price plotted against Chinese PMI
23 Figure 23: Forecast copper supply and demand
23 Exchange rate exposure
24 Political
24 Fiscal
25 Technical
25 Capital structure
25 Figure 24: Major shareholders
26 Directors and management
27 Previous research publications
27 Figure 25: Marten & Co. previously published research on CAML
28 Figure 26: CAML summary table
29 Appendix 1 – CAML’s cost advantage explained
30 Appendix 2 - How CAML achieves targeted copper production rate
31 Figure 27: Leach curves for blocks
31 Figure 28: Average flow rates and PLS grade
32 Appendix 3 – Ownership
32 Appendix 4 - Resource definition work
32 Figure 29: Resource definition work at Kounrad

M A R T E N & C O Central Asia Metals
Annual overview │ 25 April 2017 Page 04
Introduction CAML’s primary focus is a low-cost, copper dump treatment operation associated with the Kounrad copper mine, in Kazakhstan.
Elsewhere in Kazakhstan, the company is exploring a copper prospect and, in Chile, it holds a 75% interest in Copper Bay Ltd, a private company that has completed a feasibility study on a copper tailings treatment project.
CAML was incorporated in the UK in 2005 and in 2007 successfully tendered for a 60% interest in the Subsoil Use Contract (SUC) at Kounrad, which allowed it to explore and process the mineralised dumps.
In 2010, the company completed an IPO on AIM, raising gross proceeds of US$60m (net proceeds of £35m), the equivalent of which has been returned to shareholders through dividends.
CAML’s corporate headquarters are in London, with operational management in Balkhash, Kazakhstan.
Key investment points 2016 EPS of US23.7c, up 17% (see page 5).
Net profit increased substantially from US$22.4m in 2015 to US$26.2m in 2016.
EBITDA was US$39.1m, up 12% and representing a margin of 56%.
Final dividend increased by 25% to 10.0p (see page 7).
Record copper production of 14,020t (14.0kt) in 2016, up 16% from 2015 (see page5).
Copper sales up 16% year-on-year to 13.9kt.
Substantial reduction in C1 unit costs in 2016, to US43c/lb (2015: US60c/lb) (seepage 5 and 6).
Internally-funded Western dumps exploitation project close to completion andunder budget (see page 19).
CAML has guided copper production of 13.0-14.0kt in 2017 from the Kounradoperation (see page 6).
The Copper Bay definitive feasibility study (DFS), completed in Q4 2016, is an option on higher copper prices (see page 20).
Significant uplift in NAV8% to 268.5p per share (see page 9).
The company outperforms its peer group of copper producers, but seems relativelyundervalued (see page 12).
Shares currently trading at 13% discount to NAV.
52-week stock market performance – 28% rise.
Company has cash of US$40.4m and no debt (31 December 2016).
Further information about CAML can be found on the company’s website: www.centralasiametals.com

M A R T E N & C O Central Asia Metals
Annual overview │ 25 April 2017 Page 05
Investment case
Impressive financial results for 2016
The company reported increased earnings and EPS in 2016 and on the back of this has increased the total annual dividend by 24%.
Earnings in 2016 were US$26.2m (2015: US$22.4m) and EPS increased by 17%, to US23.7c (2015: US20.1c). Earnings in 2015 benefitted from an extraordinary foreign exchange gain of US$9.0m.
Figure 1: 2016 financial highlights
US$m y-o-y
Revenue 69.3 3%
EBITDA 39.1 12%
Earnings 26.2 17%
EPS (USc) 23.7 17%
Cash at end 40.4 -3%
Total dividend (paid and proposed) (pence) 15.5 24%
Source: CAML
Profitability as measured by EBITDA, was US$39.1m, an increase of 12% on 2015, representing an EBITDA margin of 56% (2015: 52%).
Revenue was up marginally to US$69.3m owing to higher copper cathode production and volume of sales, and despite a fall in the average copper price received from US$5,336/t to US$4,994/t.
In 2016, copper production at Kounrad was a record 14.0kt, representing a 16% increase on 2015, which the company was able to achieve because of the successful completion of the SX-EW plant expansion in 2015.
Copper cathode sales for the year were 13.9t, which was a 16% increase on 2015.
Cost of sales in the income statement were US$18.4m, a dramatic improvement on the previous year when costs were US$25.5m. The decrease was principally due to a substantial reduction in depreciation and amortisation charges (-US$5.3m). The company has been able to change its accounting approach and is now depreciating and amortising certain assets over a longer productive life since the approval for development of the Western dumps at the end of 2015, which will extend the operation through to 2034.
The remaining improvement in costs was due to a reduction in minesite operating costs as a result of a devaluation of the Kazakh tenge against the US dollar, which resulted in a 30% reduction in minesite costs year-on-year.
Unit costs of copper production in 2016 showed a dramatic improvement to US43c/lb on a C1 cost basis and US$1.06/lb on a fully inclusive basis.
The decrease was in part because of the higher production base, but primarily as a result of the depreciation of the tenge, as mentioned above. 70% of C1 costs are incurred in the local currency. In 2016, the tenge stabilised and remains stable in 2017 thus far.
Figure 2 shows the breakdown of unit costs with variances from the previous year.
Annual dividend increased by 24% on the back of increased earnings
Record copper production of 14kt
C1 costs reduced to US43c/lb

M A R T E N & C O Central Asia Metals
Annual overview │ 25 April 2017 Page 06
Figure 2: Comparison of 2016 and 2015 operating costs
Costs (USc/lb) 2016 2015 y-o-y
Labour 9 13 -31%
Reagents 5 8 -38%
Power 5 9 -44%
Materials 5 6 -17%
Other 4 4 0% Cost of production 28 40 -30%
Distribution & selling 9 12 -25%
Local G&A 6 8 -25% C1 costs 43 60 -28%
MET & local taxes 14 19 -26%
Depreciation 16 39 -59%
Inventory impairment 0 2 -100%
Corporate G&A 33 38 -13% Full inclusive cost 106 158 -33%
Source: CAML
Kounrad generated operating cashflow of US$44.7m, up from US$33.6m in 2015. CAML paid out US$20.4m in dividends and expended US$12.3m on the expansion project and sustaining capital. As at 31 December 2016, the company held cash and equivalents of US$40.4m and had no debt.
CAML’s production guidance for 2017 is between 13.0-14.0kt of copper cathode from Kounrad. The Eastern dumps will provide the majority of the copper production with the Western dumps providing an increasing amount of overall copper production from Q2 2017 onwards.
In Q1 2017, Kounrad produced 3.4kt of copper, up almost 5% on the corresponding period of 2015. Given that production in the winter period is generally lower than in the warmer summer months, the company is well on track to meet its target production of 13-14kt for the year.
Q1 production benefitted from the introduction of an intermediate leaching circuit (ILC), which enabled a higher overall recovery of copper from the covered winter blocks.
Industry-leading cost of production
CAML recorded a profit in its first year of operation, 2012, and has remained profitable ever since.
The key to this profitability is the great advantage that CAML has at its Kounrad operation, in that it treats, through a SX-EW process, copper-bearing material that has already been mined and dumped in heaps by a third party. As there is no mining involved, unit costs of production are very low.
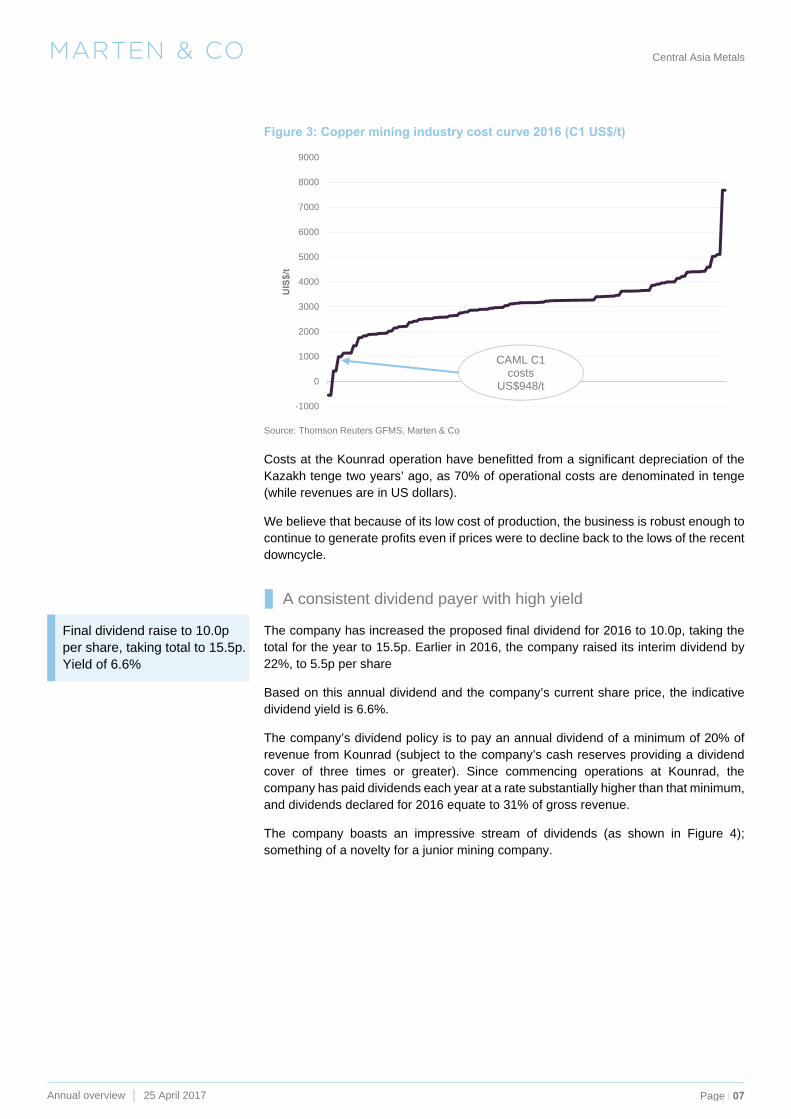
In 2016 cash costs were just US43c/lb (US$948/t), making the company one of the lowest-cost copper producers in the industry, well inside the top 4%.
Figure 3 shows, on a cumulative basis, how the cost of producing one tonne of copper varies throughout the industry, with CAML firmly located at the lower end of the cost curve.
CAML’s guidance is production of 13-14kt of copper for 2017
Cash costs in the lowest 4% of the industry
M A R T E N & C O Central Asia Metals
Annual overview │ 25 April 2017 Page 07
Figure 3: Copper mining industry cost curve 2016 (C1 US$/t)
Source: Thomson Reuters GFMS, Marten & Co
Costs at the Kounrad operation have benefitted from a significant depreciation of the Kazakh tenge two years’ ago, as 70% of operational costs are denominated in tenge (while revenues are in US dollars).
We believe that because of its low cost of production, the business is robust enough to continue to generate profits even if prices were to decline back to the lows of the recent downcycle.
A consistent dividend payer with high yield
The company has increased the proposed final dividend for 2016 to 10.0p, taking the total for the year to 15.5p. Earlier in 2016, the company raised its interim dividend by 22%, to 5.5p per share
Based on this annual dividend and the company’s current share price, the indicative dividend yield is 6.6%.
The company’s dividend policy is to pay an annual dividend of a minimum of 20% of revenue from Kounrad (subject to the company’s cash reserves providing a dividend cover of three times or greater). Since commencing operations at Kounrad, the company has paid dividends each year at a rate substantially higher than that minimum, and dividends declared for 2016 equate to 31% of gross revenue.
The company boasts an impressive stream of dividends (as shown in Figure 4); something of a novelty for a junior mining company.
-1000
0
1000
2000
3000
4000
5000
6000
7000
8000
9000
UIS
$/t
CAML C1 costs
US$948/t
Final dividend raise to 10.0p per share, taking total to 15.5p. Yield of 6.6%
M A R T E N & C O Central Asia Metals
Annual overview │ 25 April 2017 Page 08
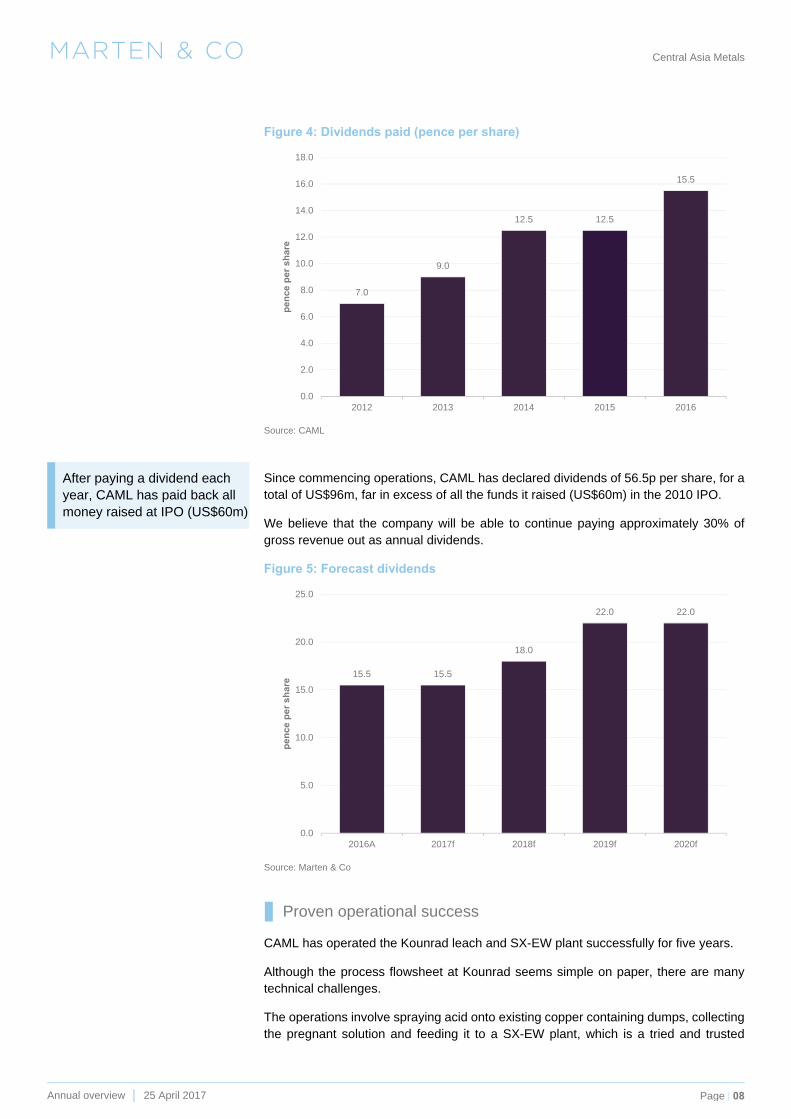
Figure 4: Dividends paid (pence per share)
Source: CAML
Since commencing operations, CAML has declared dividends of 56.5p per share, for a total of US$96m, far in excess of all the funds it raised (US$60m) in the 2010 IPO.
We believe that the company will be able to continue paying approximately 30% of gross revenue out as annual dividends.
Figure 5: Forecast dividends
Source: Marten & Co
Proven operational success
CAML has operated the Kounrad leach and SX-EW plant successfully for five years.
Although the process flowsheet at Kounrad seems simple on paper, there are many technical challenges.
The operations involve spraying acid onto existing copper containing dumps, collecting the pregnant solution and feeding it to a SX-EW plant, which is a tried and trusted
7.0
9.0
12.5 12.5
15.5
0.0
2.0
4.0
6.0
8.0
10.0
12.0
14.0
16.0
18.0
2012 2013 2014 2015 2016
pen
ce p
er s
har
e
15.5 15.5
18.0
22.0 22.0
0.0
5.0
10.0
15.0
20.0
25.0
2016A 2017f 2018f 2019f 2020f
pen
ce p
er s
har
e
After paying a dividend each year, CAML has paid back all money raised at IPO (US$60m)

M A R T E N & C O Central Asia Metals
Annual overview │ 25 April 2017 Page 09
recovery technology in the copper industry. However, the chemical composition of the dumps is seldom uniform and ongoing chemical activity can alter the effectiveness and speed of the leaching process, affecting the strength of the copper in solution feed to the plant. Moreover, management has to manage flow rates and solution grades in severe winter climatic conditions, with temperatures down to -40°C at times.
This is an achievement in itself, but on top of that the company has successfully completed a 50% increase in the capacity of the plant so that it now can produce up to 13-14kt/y of copper. It funded this expansion from cash resources.
Figure 6: Annual copper production and C1 costs
Source: CAML
Western dumps – the key to longevity
With the installation of infrastructure to allow the exploitation of copper resources in the Western dumps, CAML can maintain production of over 13kt/y for at least another 14 years until 2032, by our estimation.
The adoption of an innovative re-leaching system – the intermediate leaching circuit — in Q1, seems to have already enhanced leach recovery from the Eastern dumps. If this circuit proves to be successful and is retained, it could well add to production volumes from both dumps.
Valuation We value CAML on a sum-of-the-parts basis taking into account the NPV of the Kounrad operation using a discount rate of 8%.
Given that the company has decided not to proceed with the Copper Bay project at this stage, we treat it as an investment and value it at CAML’s cost of acquisition of its 75% interest. We attach no value at this stage to the Shuak exploration property.
Our analysis results in an NAV for CAML of 268.5p per share.
Figure 7 summarises our NAV model.
0
10
20
30
40
50
60
70
80
0
2
4
6
8
10
12
14
16
2012 2013 2014 2015 2016
Co
sts (US
c/lb)
Cu
pro
du
ctio
n (
kt)
Cu Production (kt) (LHS) Cash costs (USc/lb) (RHS)
NAV @ 8% of 268.5 per share
M A R T E N & C O Central Asia Metals
Annual overview │ 25 April 2017 Page 10
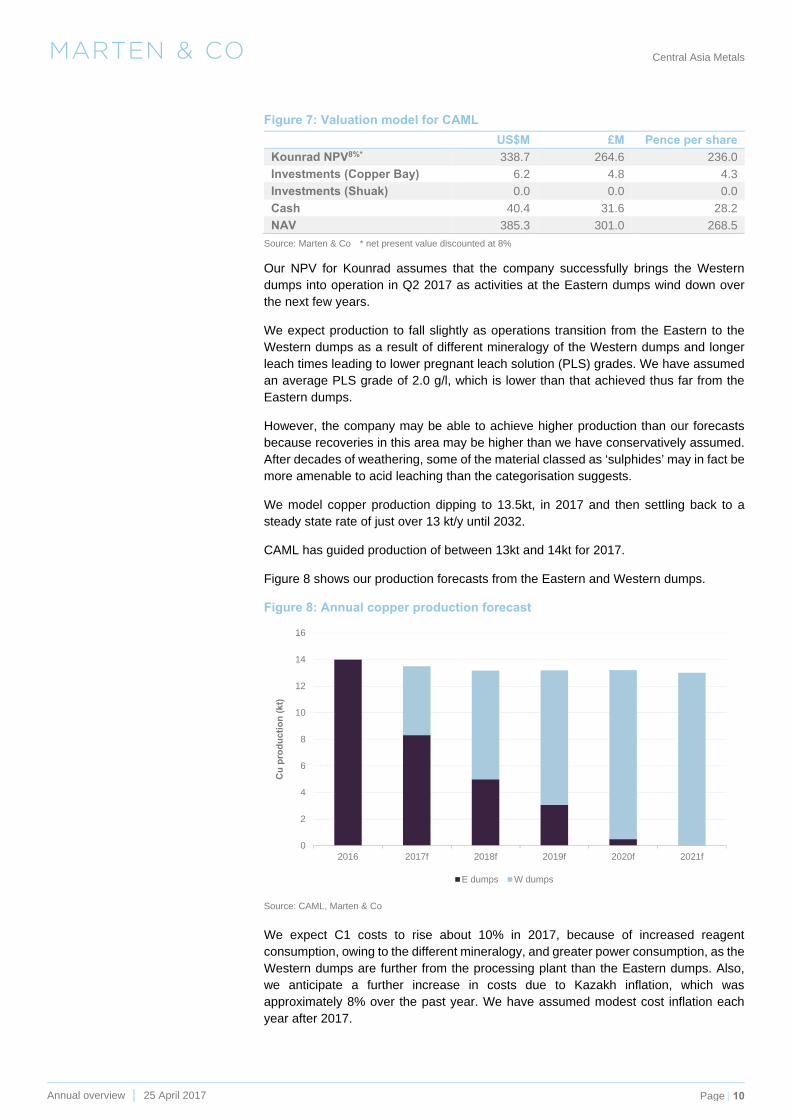
Figure 7: Valuation model for CAML
US$M £M Pence per share
Kounrad NPV8%* 338.7 264.6 236.0
Investments (Copper Bay) 6.2 4.8 4.3
Investments (Shuak) 0.0 0.0 0.0
Cash 40.4 31.6 28.2
NAV 385.3 301.0 268.5
Source: Marten & Co * net present value discounted at 8%
Our NPV for Kounrad assumes that the company successfully brings the Western dumps into operation in Q2 2017 as activities at the Eastern dumps wind down over the next few years.
We expect production to fall slightly as operations transition from the Eastern to the Western dumps as a result of different mineralogy of the Western dumps and longer leach times leading to lower pregnant leach solution (PLS) grades. We have assumed an average PLS grade of 2.0 g/l, which is lower than that achieved thus far from the Eastern dumps.
However, the company may be able to achieve higher production than our forecasts because recoveries in this area may be higher than we have conservatively assumed. After decades of weathering, some of the material classed as ‘sulphides’ may in fact be more amenable to acid leaching than the categorisation suggests.
We model copper production dipping to 13.5kt, in 2017 and then settling back to a steady state rate of just over 13 kt/y until 2032.
CAML has guided production of between 13kt and 14kt for 2017.
Figure 8 shows our production forecasts from the Eastern and Western dumps.
Figure 8: Annual copper production forecast
Source: CAML, Marten & Co
We expect C1 costs to rise about 10% in 2017, because of increased reagent consumption, owing to the different mineralogy, and greater power consumption, as the Western dumps are further from the processing plant than the Eastern dumps. Also, we anticipate a further increase in costs due to Kazakh inflation, which was approximately 8% over the past year. We have assumed modest cost inflation each year after 2017.
0
2
4
6
8
10
12
14
16
2016 2017f 2018f 2019f 2020f 2021f
Cu
pro
du
ctio
n (
kt)
E dumps W dumps

M A R T E N & C O Central Asia Metals
Annual overview │ 25 April 2017 Page 11
We also expect fully-allocated costs to rise on higher depreciation and administration costs spread over a lower volume of sales.
Figure 9 charts our projected C1 and fully-allocated costs.
Figure 9: Projected C1 and fully-allocated costs at Kounrad
Source: CAML, Marten & Co
We have modified our short-term copper price forecasts to reflect the improved market conditions from the end of last year and into this year, and a slightly more conservative slope upward to our long-term forecast (see discussion on copper prices, page 21).
We use a copper price of US$5,800/t (US$2.63/lb) in 2017, US$6,200/t (US$2.81/lb) in 2018 and thereafter a long-term price of US$6,600/t (US$3.00/lb).
Our forecasts are summarised in Figure 10.
Figure 10: Comparison of original and revised copper price forecasts
2017 2018 2019 2020
Original forecast (Feb 2016) 5,500 6,600 6,600 6,600
New forecast (April 2017) 5,800 6,200 6,600 6,600
Source: Marten & Co
Our NAV valuation has increased from 197.5p per share to 268.5p per share since our initiation note of February 2016 because of:
A reduction in operating costs, principally as a result of the depreciation of the tenge
A 30% reduction in capital costs for completion of the Western dumps infrastructure
The completion of the major capital spending programme this year, and
The use of a lower exchange rate of £1.28/US$ (against £1.45/US$) when calculating the NAV to reflect the weakness of the pound following the Brexit vote
Given that CAML has decided not to proceed with the Copper Bay project at this point in time we have not included an NPV for the project based on DCF analysis. Instead, we have valued the project in our NAV analysis at the cost of CAML’s investment, that is US$6.2m.
Clearly, with a recent DFS, the project remains a near-term option on higher copper prices. Meanwhile, there are opportunities to enhance the project economics and we believe that CAML will investigate the potential to expand the current seven-year mine
0
20
40
60
80
100
120
140
160
2016 2017f 2018f 2019f 2020f 2021f
Co
sts
(US
c/lb
)
C1 cost (Usc/lb) Total costs (Usc/lb)
NAV raised from 197.5p in February 2016
M A R T E N & C O Central Asia Metals
Annual overview │ 25 April 2017 Page 12
life by including resources from two other areas that lie adjacent to the main Bay Zone, which hosts the mineable resource that underpins the DFS.
The current estimated capital cost of the project is US$88.5m and it is likely that to fund the capex CAML would have to look at debt financing, at least in part.
We believe that management will not consider Copper Bay, or any other potential investment, if it jeopardises its ability to pay dividends in line with its policy, which has been one of the pillars of its success and a major key to its attractiveness as an investment.
The company is in the great position of not having to do any deals – it has resources at Kounrad to keep operations generating cashflow beyond 2030.
At the end of 2016, the company had US$40m in cash and after paying US$13.8m for the final dividend and with the expansion project now paid for, it will still have around US$26m with which it can pursue suitable investment opportunities.
Comparative valuation
In addition to the absolute valuation of CAML as described above, it is useful to compare the company to other members of its peer group, although the universe of junior copper producing companies is not large.
Most copper producers are significantly larger in production scale or market value terms (Antofagasta and Kaz Minerals, for example, in London) and a large proportion of the world’s copper production derives from multi-commodity, diversified miners such as BHP Billiton, Rio Tinto and Glencore.
We have identified three copper producers of similar size with whom we can compare CAML’s operating and market performance. Although comparisons with larger copper producers are not as insightful, we have also shown some comparable metrics for Antofagasta and Kaz Minerals (see Figure 15 page 15).
The three copper producers that we use as comparison are:
Amerigo Resources (TSX:ARG). Amerigo is a TSX-listed copper producer that produces copper and molybdenum concentrates by treating fresh and historic tailings from the El Teniente mine, in Chile.
Aeris Resources (ASX:AIS). Aeris (formerly Straits Resources) is Australia’s fifth largest independent copper producer and operates underground mines at Tritton, in New South Wales, to produce copper concentrates.
Weatherly International (WTI:AIM). Weatherly is a London-listed copper miner which operates an open-pit, heap leach and SX-EW mine at Tschudi, in Namibia.
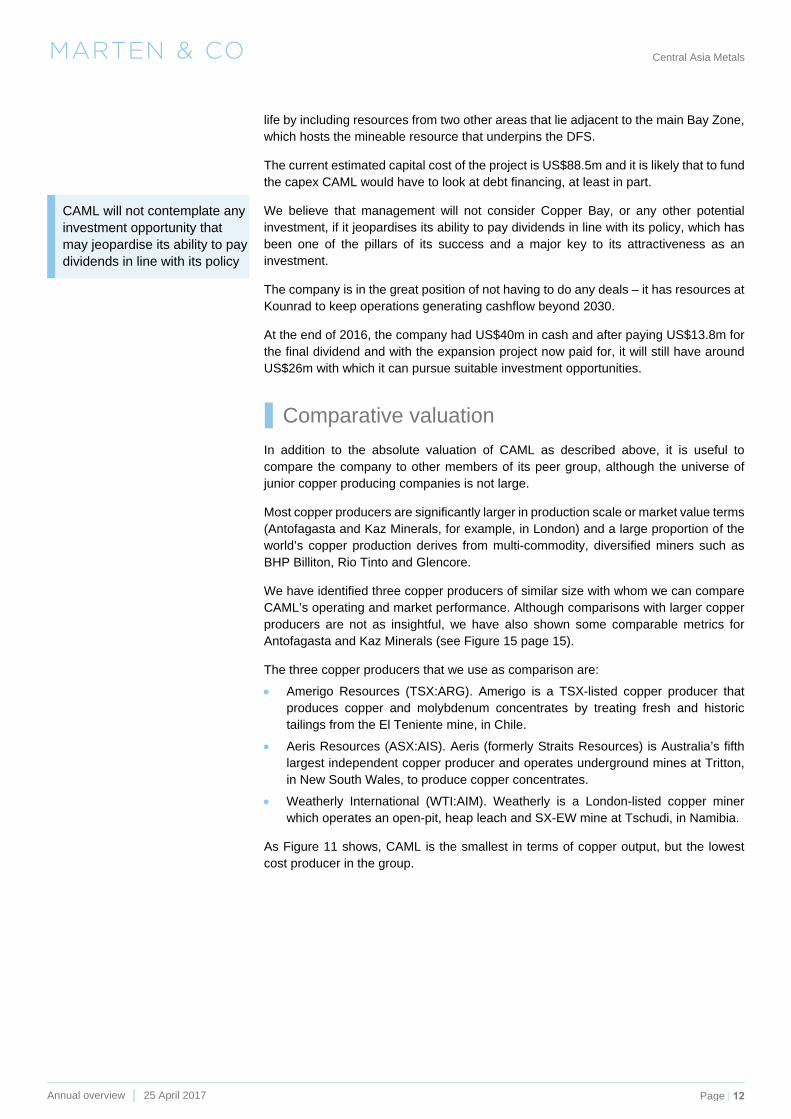
As Figure 11 shows, CAML is the smallest in terms of copper output, but the lowest cost producer in the group.
CAML will not contemplate any investment opportunity that may jeopardise its ability to pay dividends in line with its policy
M A R T E N & C O Central Asia Metals
Annual overview │ 25 April 2017 Page 13
Figure 11: Comparative copper production and costs
Source: Marten & Co, published company information, end-March 2017
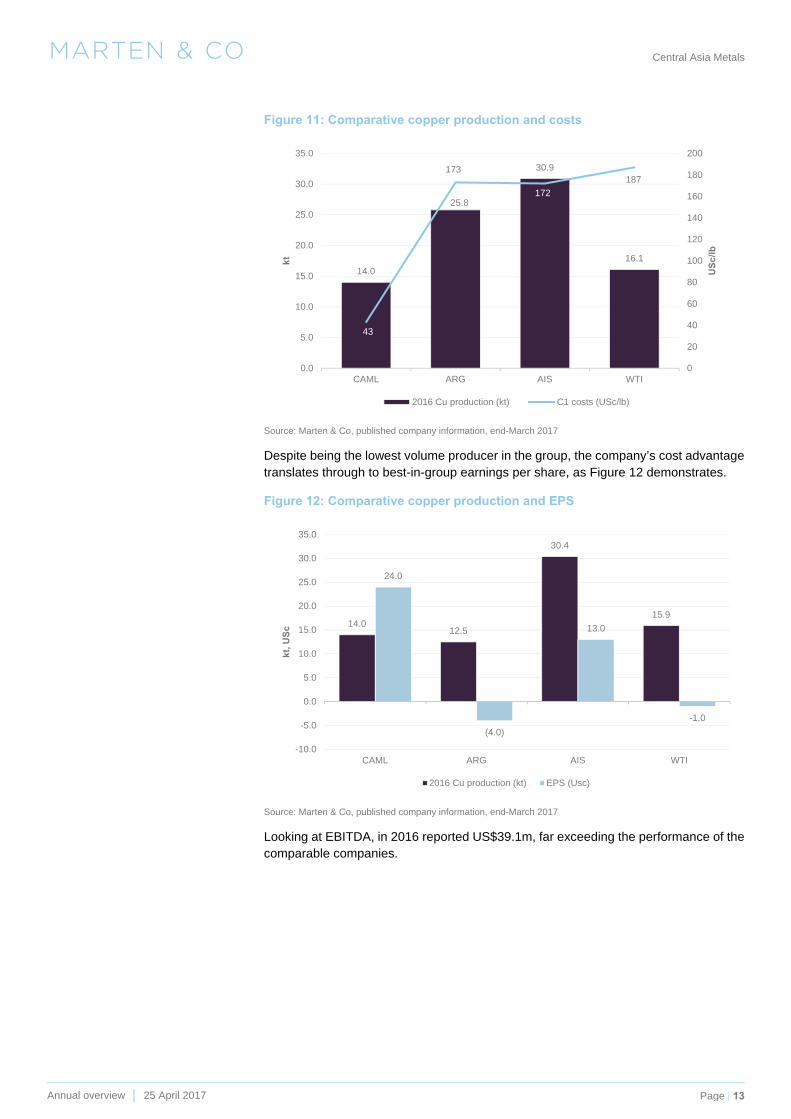
Despite being the lowest volume producer in the group, the company’s cost advantage translates through to best-in-group earnings per share, as Figure 12 demonstrates.
Figure 12: Comparative copper production and EPS
Source: Marten & Co, published company information, end-March 2017
Looking at EBITDA, in 2016 reported US$39.1m, far exceeding the performance of the comparable companies.
14.0
25.8
30.9
16.1
43
173
172
187
0
20
40
60
80
100
120
140
160
180
200
0.0
5.0
10.0
15.0
20.0
25.0
30.0
35.0
CAML ARG AIS WTI
US
c/l
b
kt
2016 Cu production (kt) C1 costs (USc/lb)
14.012.5
30.4
15.9
24.0
(4.0)
13.0
-1.0
-10.0
-5.0
0.0
5.0
10.0
15.0
20.0
25.0
30.0
35.0
CAML ARG AIS WTI
kt, U
Sc
2016 Cu production (kt) EPS (Usc)
M A R T E N & C O Central Asia Metals
Annual overview │ 25 April 2017 Page 14
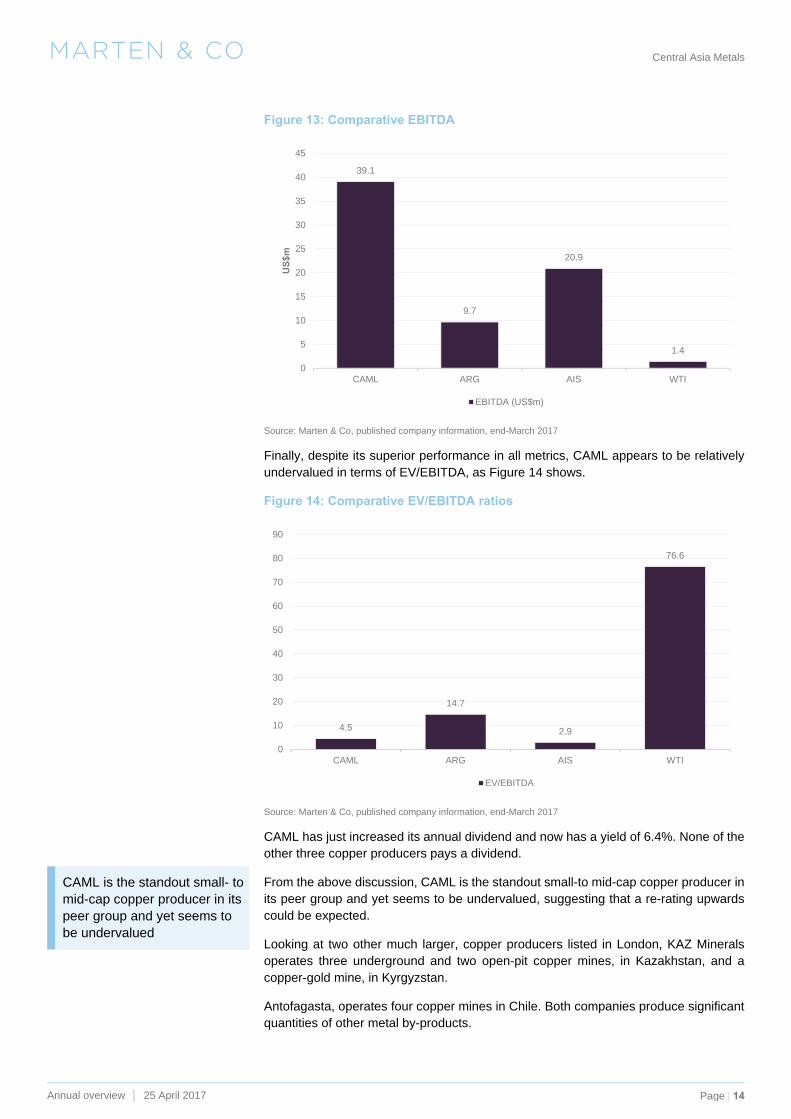
Figure 13: Comparative EBITDA
Source: Marten & Co, published company information, end-March 2017
Finally, despite its superior performance in all metrics, CAML appears to be relatively undervalued in terms of EV/EBITDA, as Figure 14 shows.
Figure 14: Comparative EV/EBITDA ratios
Source: Marten & Co, published company information, end-March 2017
CAML has just increased its annual dividend and now has a yield of 6.4%. None of the other three copper producers pays a dividend.
From the above discussion, CAML is the standout small-to mid-cap copper producer in its peer group and yet seems to be undervalued, suggesting that a re-rating upwards could be expected.
Looking at two other much larger, copper producers listed in London, KAZ Minerals operates three underground and two open-pit copper mines, in Kazakhstan, and a copper-gold mine, in Kyrgyzstan.
Antofagasta, operates four copper mines in Chile. Both companies produce significant quantities of other metal by-products.
39.1
9.7
20.9
1.4
0
5
10
15
20
25
30
35
40
45
CAML ARG AIS WTI
US
$m
EBITDA (US$m)
4.5
14.7
2.9
76.6
0
10
20
30
40
50
60
70
80
90
CAML ARG AIS WTI
EV/EBITDA
CAML is the standout small- to mid-cap copper producer in its peer group and yet seems to be undervalued

M A R T E N & C O Central Asia Metals
Annual overview │ 25 April 2017 Page 15
Figure 15: Comparison of production and profitability metrics for CAML and larger London-listed copper producers
Metric Unit CAML ANTO KAZ
2016 copper production
kt 14.0 709.4 140.3
C1 cash cost USc/lb 43 120 59
Revenue US$M 69 3,622 766
EBITDA US$M 39.1 1,626 351
EBITDA margin
% 56 45 46
Market cap US$M 298 10,349 2,561
EV US$M 257 11,420 5,230
EV/EBITDA 4.5 7.0 14.9
EPS USc 23.7 12.1 40.0
Dividend USc 15.5 18.4 0
Dividend yield % 6.6 2.7 na
Source: Marten & Co, published company information
As Figure 15 illustrates, despite being the smallest by some way in terms of production and market value, CAML delivers the best EBITDA margin and dividend yield through its low cash costs.
Sensitivity analysis We have analysed the sensitivity of our NAV estimate for CAML to changes in the key variables; copper price and discount rate, as shown in Figure 16.
Figure 16: NAV sensitivity analysis
Copper price (US$/lb)
NAV (p/sh): discount rate
-30% -20% -10% Base +10% +20% +30%
NAV @ 5% 173 219 266 312 358 405 451
NAV @ 8% 152 191 230 268 307 346 385
NAV @ 10% 141 176 211 246 281 315 350
NAV @ 12% 131 163 195 226 258 290 321
Source: Marten & Co Assumptions: US$1.28/£; shares outstanding 112.1 million
Because of its low cost of production, the company is protected against downturns in the copper price and should continue to generate free cashflow even at prices lower than we have seen in the recent seven-year low.
Page 23 provides more details on our base case copper price assumptions. These are US$5,800/t (US$2.63/lb) in 2017, US$6,200/t (US$2.81/lb) in 2018 and thereafter a long-term price of US$6,600/t (US$3.00/lb). If the copper price remains at the current level of US$5,826/t, the NAV8% would be 230p.

M A R T E N & C O Central Asia Metals
Annual overview │ 25 April 2017 Page 16
Assets - Kounrad
Location
The Kounrad mine and surrounding dumps are located in the Balkhash area of south-central Kazakhstan, 15 km north of the town of Balkhash and 600 km northwest of the largest city, Almaty. Balkhash is on the northern bank of the Lake Balkhash, which stretches 600 km in an east-west direction. The town has a flotation concentrator and smelter, which has treated Kounrad ore in the past.
The region is characterised by a semi-arid climate and typically flat topography, or steppe.
History
The Kounrad open pit copper mine was state-operated from 1936 to 1992, and managed by copper mining company, Kazakhmys, until 2006. Despite mining both oxide and sulphide material, the operation only treated the sulphide ore, which was amenable to its flotation technology, while discarding and stockpiling the oxide material (in the Eastern dumps) and the below cut-off grade sulphide material to the west of the open pit. It is this stockpiled material that CAML treats to extract copper.
The mine struggled over 2006-2007 with depleting grades and was consequently closed in late 2008, although Kazakhmys attempted limited mining again in 2011.
In October 2014, Kazakhmys was restructured with key and growth assets retained in the listed entity and rebranded KAZ Minerals plc. At this time Kounrad was transferred into private firm Cuprum Holdings along with several other mature assets, which were collectively rebranded as Kazakhmys Corporation.
The potential to treat the dumps using SX-EW technology to recover copper was first recognised in the 1960s by the Ural Research & Project Institute of Copper Industry (Unipromed Plc). Unipromed completed pilot plant scale tests over 1969-1970, which led to limited copper production between 1975 and 1992.
A joint venture in 1993 was established to build a commercial SX-EW plant but, having started building in 1995, work was terminated a year later and ownership of the dumps passed back into state hands. Jalyn Mining then tendered successfully for the rights over the Eastern dumps and designed an SX-EW plant. However, it pulled financing of the project in 2005, triggering the cancellation of the SUC and allowing CAML to tender for the licence.
CAML completed a technical evaluation of a dump leach project in 2006 before winning the SUC in 2007 as a private company and then forming a joint venture to operate the project.
The company commissioned a pilot scale SX-EW plant near Dump 6 in 2008, which operated through 2009.
In November 2009, CAML commissioned the Beijing General Research Institute of Mining and Metallurgy (BGRIMM) to complete a feasibility study on a 10 kt/y commercial copper SX-EW plant.

M A R T E N & C O Central Asia Metals
Annual overview │ 25 April 2017 Page 17
After its 2010 IPO, CAML began constructing a SX-EW plant, plus the infrastructure required to irrigate the dumps and transport pregnant solution to the plant. It completed the plant in April 2012, at a cost of US$39m, some US$8m under budget.
Geology and mineralisation
The Kounrad copper deposit is located within the North Balkhash metallogenic belt, part of the much larger Central Asian Orogenic Belt that extends 7,000 km from west to east and from the Siberian Craton in the north to the Tarim Craton in the south. It is a prolific host of major porphyry copper deposits.
The primary Kounrad deposit is a typical copper porphyry associated with calc-alkaline magmas, formed in a Carboniferous age (327–312 Ma) subduction-related setting.
Kounrad is made up of unconsolidated sediments and granitic bedrock units. Weathering and supergene enrichment have produced a general zonation of mineralisation:
Oxidised cap: characterised by hematite, limonite, manganese oxyhydroxide, malachite, azurite, cuprite, native copper and chrysocolla mineralisation
Leached zone: characterised by moderate oxidation in the upper part and destabilisation of sulphide minerals under acidic conditions in the lower parts
Supergene blanket: characterised by chalcocite and covellite mineralisation
Primary sulphide zone: characterised by disseminated and stockwork ore with pyrite, chalcopyrite, enargite and chalcocite mineralisation.
Resources
The dump resources are contained within Eastern and Western waste dumps that have accumulated over some 70 years of open-pit mining and processing from the primary Kounrad porphyry.
In 2013, consultant Wardell Armstrong International (WAI) estimated total resources (indicated and inferred) containing 614 kt of copper, suggesting a potential mine life of well over 20 years during which it would extract some 230 kt of recoverable copper.
The following table summarises the 2013 resource estimate.
Figure 17: 2013 Resource estimate
Tonnes (Mt) Grade (% Cu)
Contained copper
(kt)
Eastern Dumps (oxide)
Indicated 89.7 0.10 85.8
Inferred 79.6 0.10 81.7
Western Dumps (sulphide)
Indicated 275.4 0.10 276.2
Inferred 169.4 0.09 160.3
Western Dumps (mixed)
Indicated 20.9 0.03 6.2
Inferred 12.1 0.03 4.0
Source: Wardell Armstrong International

M A R T E N & C O Central Asia Metals
Annual overview │ 25 April 2017 Page 18
Note: Although the material in the West was originally classified as low-grade sulphide material, exposure to the atmosphere as well as natural chemical and bacterial activity has broken down some of these minerals converting them to acid leaching amenable species. Thus, the material in the Western dumps is now more accurately identified as ‘mineralised waste’ as it is characterised by acid soluble contents in the range 30% to 40%. Appendix 4 shows the resource definition work completed on the Western dumps.
CAML has been exploiting the Eastern dumps for five years and the resources there have only a limited life remaining. At the end of 2016, CAML’s reconciliation between the 2013 resources and the material extracted through to the end of 2016 indicates that 25.2kt remain to be recovered.
Figure 18: Remaining copper in Eastern dumps
Copper contained (kt)
Total resources 167.5
Recovered 2012-16 54.3
Remaining 25.2
Source CAML
The company started to leach the Western dumps in April 2017.
Figure 19 shows the location of the dumps relative to the open pit and the SX-EW plant.
Figure 19: Aerial view of the dumps
Source: CAML

M A R T E N & C O Central Asia Metals
Annual overview │ 25 April 2017 Page 19
Processing
The Kounrad operation is essentially a processing operation with no mining necessary. The existing dumps are leached in-situ and the resultant copper-containing solution is treated through an SX-EW process, which is an established route for dump leach projects around the world.
Figure 20: Schematic Kounrad SX-EW process flowsheet
Source: CAML
Details of the processes and of how CAML manages to control flow rates and pregnant leach solution (PLS) grade to achieve its target copper output, can be found in Appendix 2.
Product sales
CAML has an off-take agreement with international commercial services group, Traxys, which is in force until the end of 2018, for the bulk (90%) of the copper cathodes produced. Pricing, on an ex-plant basis, is linked to the LME copper price, less set selling costs.
CAML also makes minor sales to local customers.
Expansion complete; transition to Western dumps underway
In May 2015, the company completed and commissioned a 50% expansion of the SX-EW plant to a PLS throughput capacity of 1,200 m3/hr and can now produce up to 14kt/y of copper cathode. Consequently, the company was able to increase production to 12.1kt in 2015 and 14.0kt in 2016. CAML funded the project internally.
Off-take agreement with Traxys until end-2018 ensures sales

M A R T E N & C O Central Asia Metals
Annual overview │ 25 April 2017 Page 20
However, with reserves in the Eastern dumps rapidly becoming depleted, a critical element in maintaining feed to the expanded plant is the transition of leaching operations to the larger Western dumps. This project, which CAML terms Expansion Stage 2, is nearing completion with first production expected in May 2017.
The company has installed two 12 km pipelines to allow for the PLS and raffinate solution flows to be cross-transferred to the expanded SX-EW plant and added other infrastructure, including a 15km water pipe to Lake Balkhash.
The budgeted capital cost of the project was originally estimated at US$19.5m but with the project now virtually complete, the company expects costs to come in some 30% lower. Once again, the full cost was covered by cash generated from operations.
Assets - Copper Bay Seventy-five percent owned Copper Bay Limited (Copper Bay) has evaluated a project to process beach-deposited copper tailings at Chañaral, in northern Chile. CAML released the results of an independent definitive feasibility study (DFS) in January 2017.
The study was based on a mineable resource of 34.8Mt at a grade of 0.24% copper (84.6kt copper contained) with a production profile of 8.6kt/y of copper for seven years at an average C1 cash cost of US$1.37/lb.
With an initial capital investment of US$88.5 million and using a forecast copper price of US$3.00/lb, the project would deliver an after-tax IRR of 19.1%.
However, despite the positive result, the company has decided not to go ahead with the project at this time, citing the current uncertainty with regard to the near and medium term expectations for copper.
The company maintains its interest in Copper Bay.
Assets - Shuak Shuak is an exploration prospect in Kazakhstan in which CAML has an 80% interest. It represents the company’s first venture beyond its Kounrad copper dump retreatment operation in the country.
In September 2016, CAML incorporated Shuak BV to hold the Shuak SUC and in February 2017 transferred 20% of the company to local partners.
The 197km2 licence area hosts a copper and gold exploration project in the Akmola Oblast region of north Kazakhstan, approximately 300km north of the capital city, Astana.
There are two identified mineralisation styles on the property - near-surface saprolite-hosted oxide copper and a deeper copper porphyry.
In the short term, CAML is particularly interested in three targets, with the priority area being Mongol V that hosts a non-JORC resource of approximately 327kt of contained copper at a grade of 0.66% copper.
Despite a positive feasibility result, CAML has deferred a production decision
M A R T E N & C O Central Asia Metals
Annual overview │ 25 April 2017 Page 21
The company has already achieved recoveries in excess of 90% in column leach tests on the material at the Kounrad plant.
To retain its 80% interest, CAML must spend US$2m on exploration within five years and plans to spend US$1.3m in 2017 on trenching (1,800m) and drilling (22,000m).
Risks
Copper prices
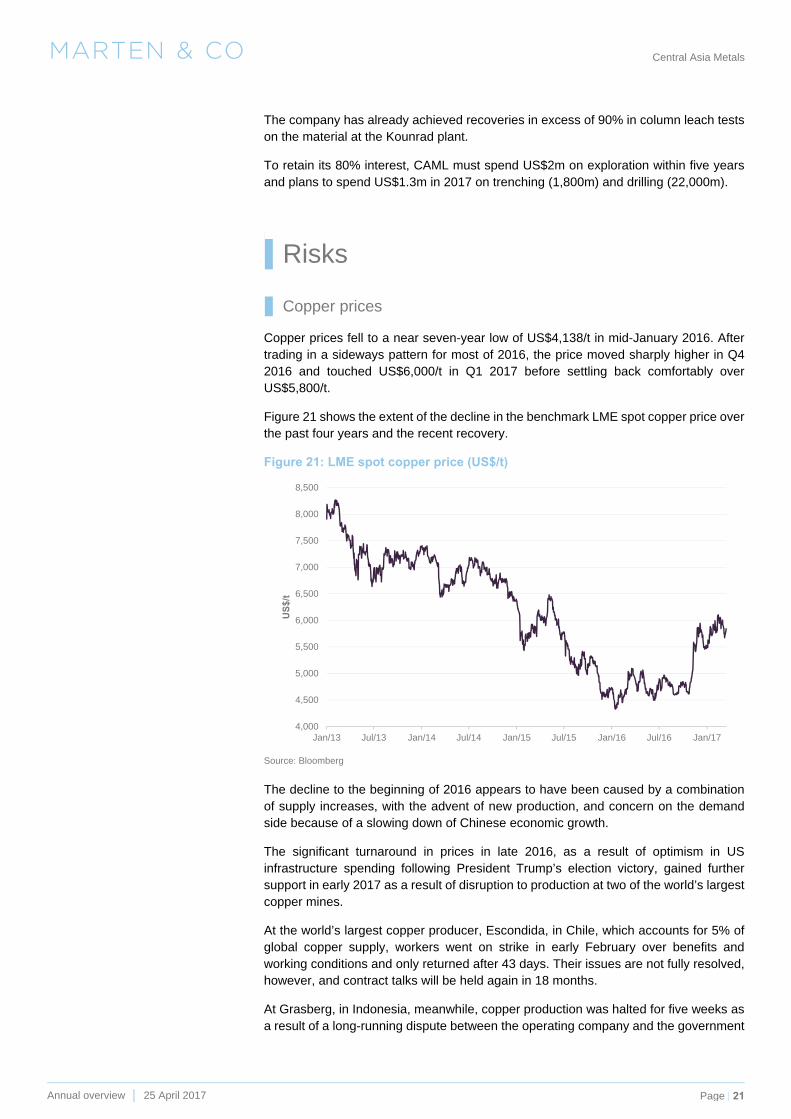
Copper prices fell to a near seven-year low of US$4,138/t in mid-January 2016. After trading in a sideways pattern for most of 2016, the price moved sharply higher in Q4 2016 and touched US$6,000/t in Q1 2017 before settling back comfortably over US$5,800/t.
Figure 21 shows the extent of the decline in the benchmark LME spot copper price over the past four years and the recent recovery.
Figure 21: LME spot copper price (US$/t)
Source: Bloomberg
The decline to the beginning of 2016 appears to have been caused by a combination of supply increases, with the advent of new production, and concern on the demand side because of a slowing down of Chinese economic growth.
The significant turnaround in prices in late 2016, as a result of optimism in US infrastructure spending following President Trump’s election victory, gained further support in early 2017 as a result of disruption to production at two of the world’s largest copper mines.
At the world’s largest copper producer, Escondida, in Chile, which accounts for 5% of global copper supply, workers went on strike in early February over benefits and working conditions and only returned after 43 days. Their issues are not fully resolved, however, and contract talks will be held again in 18 months.
At Grasberg, in Indonesia, meanwhile, copper production was halted for five weeks as a result of a long-running dispute between the operating company and the government
4,000
4,500
5,000
5,500
6,000
6,500
7,000
7,500
8,000
8,500
Jan/13 Jul/13 Jan/14 Jul/14 Jan/15 Jul/15 Jan/16 Jul/16 Jan/17
US
$/t

M A R T E N & C O Central Asia Metals
Annual overview │ 25 April 2017 Page 22
over the terms of the mining company’s operating licence. Again, the situation is far from resolved.
With the market thought to be more or less in balance in 2016, and with analysts expecting a small surplus this year, there appear to be no short-term catalysts for a further price rise.
However, there could well be further disruption to production at Escondida and Grasberg and there is some positive news from the demand side as Chinese PMI is climbing. PMI, the purchasing managers’ index, is a forward-looking index that is a measure of future construction activity and it has climbed to the highest level for five years. As copper is a key commodity in construction its price shows a good correlation to the PMI.
Figure 22: LME copper price plotted against Chinese PMI
Source: Bloomberg, Marten & Co
In the longer term, production from existing mines is expected to decline by 17% over the next 10 years, meaning that any shortfall will have to be met by new projects
Although there are a number of projects scheduled to come on stream over the next five years, many analysts believe that projects will be deferred, or at least delayed, because of difficulties in arranging finance (head grades are falling and capital intensity increasing); problems securing adequate water supplies; and increasingly stringent permitting conditions, resulting in a shortfall in production targets.
On the demand side, economic growth, which drives copper consumption, is expected to be strong in Asia (particularly China), with the market forecast to grow by over 30% over the next 10 years.
3500
4000
4500
5000
5500
6000
6500
49
49.5
50
50.5
51
51.5
52
Apr/15 Jul/15 Oct/15 Jan/16 Apr/16 Jul/16 Oct/16 Jan/17 Apr/17
US
$/t
PM
I
PMI (LHS) LME Cu price (US$/t) (RHS)
M A R T E N & C O Central Asia Metals
Annual overview │ 25 April 2017 Page 23
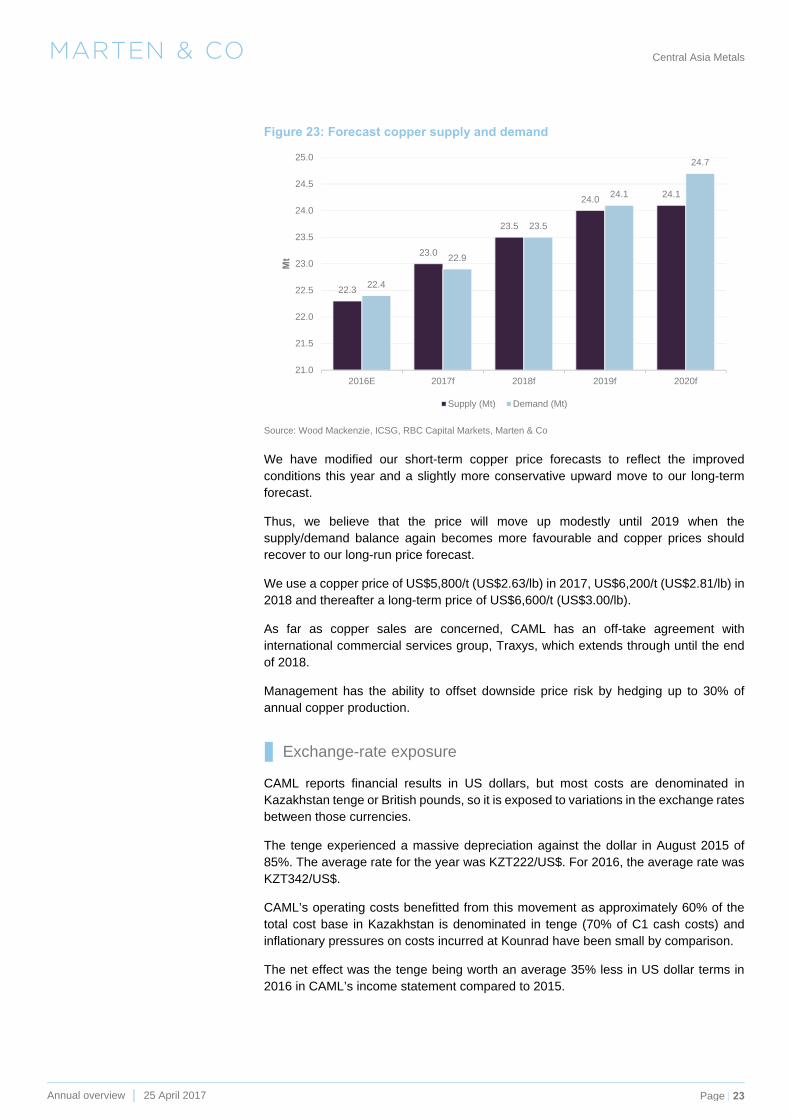
Figure 23: Forecast copper supply and demand
Source: Wood Mackenzie, ICSG, RBC Capital Markets, Marten & Co
We have modified our short-term copper price forecasts to reflect the improved conditions this year and a slightly more conservative upward move to our long-term forecast.
Thus, we believe that the price will move up modestly until 2019 when the supply/demand balance again becomes more favourable and copper prices should recover to our long-run price forecast.
We use a copper price of US$5,800/t (US$2.63/lb) in 2017, US$6,200/t (US$2.81/lb) in 2018 and thereafter a long-term price of US$6,600/t (US$3.00/lb).
As far as copper sales are concerned, CAML has an off-take agreement with international commercial services group, Traxys, which extends through until the end of 2018.
Management has the ability to offset downside price risk by hedging up to 30% of annual copper production.
Exchange-rate exposure
CAML reports financial results in US dollars, but most costs are denominated in Kazakhstan tenge or British pounds, so it is exposed to variations in the exchange rates between those currencies.
The tenge experienced a massive depreciation against the dollar in August 2015 of 85%. The average rate for the year was KZT222/US$. For 2016, the average rate was KZT342/US$.
CAML’s operating costs benefitted from this movement as approximately 60% of the total cost base in Kazakhstan is denominated in tenge (70% of C1 cash costs) and inflationary pressures on costs incurred at Kounrad have been small by comparison.
The net effect was the tenge being worth an average 35% less in US dollar terms in 2016 in CAML’s income statement compared to 2015.
22.3
23.0
23.5
24.024.1
22.4
22.9
23.5
24.1
24.7
21.0
21.5
22.0
22.5
23.0
23.5
24.0
24.5
25.0
2016E 2017f 2018f 2019f 2020f
Mt
Supply (Mt) Demand (Mt)

M A R T E N & C O Central Asia Metals
Annual overview │ 25 April 2017 Page 24
Any strengthening of the floating tenge will have a reverse and negative impact on Kounrad’s operating costs but will have minimal effect on the company’s cash position as it holds only a small proportion of cash in tenge.
From 1 January 2016, the CAML board increased salaries by 25% for staff at Kounrad to compensate employees for the negative effects of the devaluation.
Political
The Kazakh government has maintained a strong state-influence since the collapse of the Iron Curtain and its hold over its mineral resources has been enforced through state-owned miners, as well as government-private joint ventures enforced as part of mining right issuances.
More recently, however, the Kazakh government has shown a more liberal attitude to foreign investment and an integral part of this more relaxed policy is a proposal for a completely new mining code based on the Western Australian mining framework. One of the key themes is believed to be a removal of extensive governmental approvals for exploration and mining. If the government accepts the proposals, the new mining code could come into force in 2017.
One of the most authoritative reports on mining investment attitudes each year is conducted by Canada’s Fraser Institute. The Fraser Institute surveys mining companies worldwide and compiles a Policy Potential Index (PPI), which, as the Institute explains, serves as a report card to governments on how attractive their policies are from the point of view of an exploration manager.
The PPI is a composite index that measures the effects on exploration of government policies including uncertainty concerning the administration, interpretation and enforcement of existing regulations; environmental regulations; regulatory duplication and inconsistencies; taxation; uncertainty concerning native land claims and protected areas; infrastructure; socioeconomic agreements; political stability; labour issues; geological databases; and security.
In the latest survey, published in 2017, Kazakhstan is ranked 90 (out of the 104 jurisdictions surveyed), although the findings should be taken in the light of the fact that the sample size was very small.
Fiscal
Kazakh tax legislation is subject to different and changing interpretations, as well as inconsistent enforcement.
The company manages this risk by complying locally with all corporate tax regulations (paying monthly) and ensuring that its local accounting staff are adequately trained. CAML also receives tax advice on local issues from its tax advisers. The two key tax regulations that apply to CAML - the levels of corporate taxation and mineral extraction tax (MET) – have remained constant for a number of years.
The company maintains a strong local presence at every level throughout the group including the board.
In 2016, the company recovered US$3.5m in outstanding VAT from the Kazakhstan authorities. As at 31 December 2016, a further US$2.8m of VAT receivable was still owed to the company (US$0.2m was refunded in February 2017).

M A R T E N & C O Central Asia Metals
Annual overview │ 25 April 2017 Page 25
CAML is working closely with its advisors to recover the remaining portion. The planned means of recovery will be through a combination of the local sales of copper cathode to effectively offset VAT liabilities and by a continued dialogue with the authorities.
Technical
The Kounrad operation is now in its fifth full year of production from the dumps on the eastern side of the open pit (Eastern dumps) and has outperformed expectations each year.
CAML has a very good understanding of how the Kounrad ore in the dumps behaves in the SX-EW process and has operating expertise in scheduling leaching cycles and managing flow rates to achieve production targets, despite having to operate in extremely low temperatures (down to -40°C) in winter.
There is some risk associated with treating the Western dump material from April 2017 onwards as it has different characteristics, which may affect processing rates and operational performance. Countering that is the likelihood that recoveries in this area may be higher than we have conservatively assumed because after decades of weathering, some of the material classed as ‘sulphides’ may in fact more amenable to acid leaching than the categorisation suggests.
Capital structure The company has 112.1 million shares issued, which were trading at 234.0 pence per share giving the company a market capitalisation of £262.3 million.
Collectively, the directors own 26.7 million shares, which include the 21.2 million shares owned by non-executive director and Kazakh businessman, Kenges Rakishev (see page 26).
There are 2.3 million options outstanding with expiry dates out to May 2025.
The remainder of the shareholder base is largely institutional, as shown in Figure 24.
Figure 24: Major shareholders
%
Kenges Rakishev 19.1
Hargreave Hale 10.2
FIL Investment International 8.9
Majedie Asset Management 7.3
Commonwealth American Partners 6.4
Blackrock Investment 5.8
D&A Income 5.1
CAML Share Trust 4.2
Miton Asset Management 4.0
Source: CAML (as at 28 February 2017)
The Western dumps have different characteristics, which may affect processing rates

M A R T E N & C O Central Asia Metals
Annual overview │ 25 April 2017 Page 26
Directors and management The CAML board includes directors with the requisite engineering, metallurgical and financial experience who have a successful track record of financing, constructing and operating the Kounrad plant.
Nick Clarke is executive chairman and a director. He is a chartered engineer with 40 years’ mining industry experience, 16 of which were spent in senior posts managing production and technical services in Africa and Saudi Arabia.
Nick was formerly managing director of AIM-listed Oriel Resources Plc until it was sold to Mechel OAO of Russia in 2008 for US$1.5 billion. From 1992-2004, he was the managing director of mineral consultancy Wardell Armstrong International Ltd, where he managed numerous multidisciplinary mining projects in Kazakhstan, Kyrgyzstan, Uzbekistan, Romania, Macedonia and Tajikistan. Nick is a non-executive director of Wolf Minerals Limited.
Nigel Hurst-Brown is deputy chairman and a director. He is a Fellow of the Institute of Chartered Accountants in England & Wales and was formerly chairman of Lloyds Investment Managers (1986-1990), a director of Mercury Asset Management and more recently, managing director of Merrill Lynch Investment Managers.
He is currently chief executive of Hotchkis and Wiley (UK) Ltd and a non-executive director of Borders & Southern Petroleum Plc.
Nigel Robinson is chief financial officer and a director. He is a member of the Institute of Chartered Accountants in England and Wales and a former Royal Navy officer in the Fleet Air Arm.
He qualified with KPMG on exiting the military and spent three years with the firm before leaving to work in commerce. Mr Robinson spent six years in various management roles with British Airways before pursuing smaller enterprise roles in 2002. He joined CAML in 2007 and became CFO in 2009. Mr Robinson is also a director of Copper Bay Ltd.
Gavin Ferrar is an executive director responsible for business development. He holds post-graduate degrees in geology and finance and has been involved in the mining sector for 21 years. His career in industry began at Anglo American in the New Mining Business Division. He spent 10 years in the investment banking sector focusing on equity and debt financing for junior and major mining clients of Barclays Capital and Investec. Since 2011, he has worked with junior mining companies arranging finance and providing corporate advisory services before joining CAML in June 2014.
Kenges Rakishev is the company’s largest shareholder (he holds a 19% interest following the ownership consolidation at the Kounrad operation in 2014) and is a non-executive director of the company. He holds a BA from the Kazakh State Law Academy, a BA (International Economics) from the Kazakh Economic University and an AMP Diploma from the University of Oxford.
Mr Rakishev serves as board chairman for SAT & Company, which is a diversified industrial holding firm for industrial entities including Jinsheng SAT (Tianjin) Commercial and Trading Co Ltd, Baicheng Jinsheng Nickel Industry Co Ltd, Taonan City Jinsheng Metallurgical Products Co Ltd and Ulanhot Jinyuanda Heavy Chemical Industry Co Ltd. Mr Rakishev also serves as chairman of NASDAQ-listed Net Element International Inc. He is a founder of Genesis Angels, a private investment fund dedicated to early-stage advanced technology companies.

M A R T E N & C O Central Asia Metals
Annual overview │ 25 April 2017 Page 27
Other non-executive directors are former managing director and head of oil and gas at Canaccord Europe, Robert Cathery (chairman of the remuneration committee); Kazakh national and executive director of Investment Banking at UBS (Kazakhstan), Nurlan Zhakupov; chartered accountant and experienced resources executive, David Swan (chairman of the audit committee; and Roger Davey, a mining engineer and company director.
Howard Nicholson is technical director of CAML, although he does not sit on the board. He is a metallurgist with 33 years of experience in project development and mine operations management.
Of specific relevance is his role as European Minerals Corporation chief operating officer during the development of the Varvarinskoye copper-gold mine, in Kazakhstan. Mr Nicholson has held senior management positions with Ashanti Goldfields, Lonrho, and Anglo American. He is a director of Copper Bay Ltd, CAML’s partner at the Chañaral Bay project.
The Kazakhstan management team is led by Pavel Semenchenko who is general director for Sary Kazna, one of CAML’s two Kazakh subsidiaries. He has more than 15 years of experience in managing businesses in Kazakhstan and a proven record in the resources industry.
Oleg Telnoi is general director for KCC. Oleg joined CAML in 2007 with over 10 years’ of experience in finance management within the mining industry in Central Asia. He is a qualified engineer and received an MBA in 1997.
Nick Shirley is the CSR Director and the only ex-pat in Kazakhstan. Nick has over 20 years’ of experience in the fields of environmental sciences, social responsibility and hydrogeology gained predominantly in the international overseas mining industry in Central Asia, the Former Soviet Union and West Africa. He has previously worked for the Environment Agency in the United Kingdom, Avocet Mining, Newmont-BHP’s joint venture in Guinea and Orsu Metals as well as running his own consultancy practice.
Previous research publications Readers interested in further information about CAML may wish to read our previous research publications, as detailed in Figure 25. You can read the notes by clicking on them in Figure 25 or by visiting our website, www.martenandco.com.
Figure 25: Marten & Co. previously published research on CAML
Title Note type Date
Dividend-paying, low cost copper producer Initiation 24 February 2016
Defending the dividend Update 21 April 2016
Profits soar as costs slashed Update 13 September 2016
Source: Marten & Co.
M A R T E N & C O Central Asia Metals
Annual overview │ 25 April 2017 Page 28
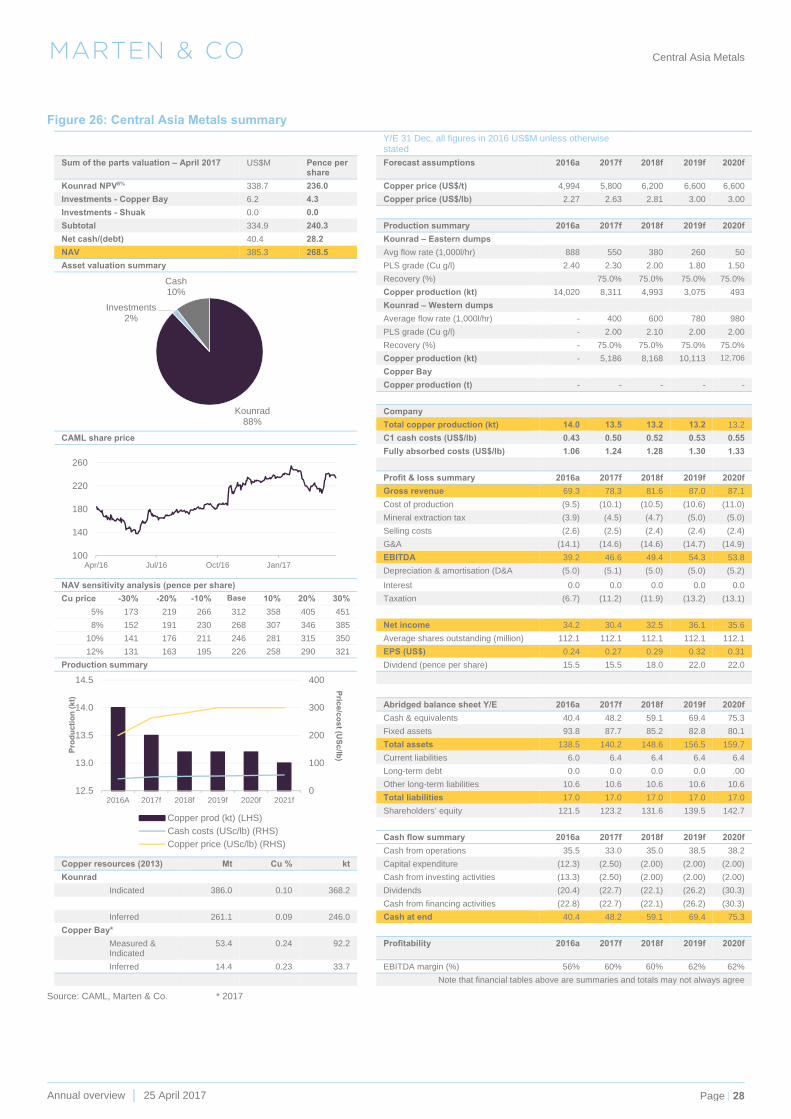
Figure 26: Central Asia Metals summary Y/E 31 Dec, all figures in 2016 US$M unless otherwise
stated
Sum of the parts valuation – April 2017 US$M Pence per share
Forecast assumptions 2016a 2017f 2018f 2019f 2020f
Kounrad NPV8% 338.7 236.0 Copper price (US$/t) 4,994 5,800 6,200 6,600 6,600
Investments - Copper Bay 6.2 4.3 Copper price (US$/lb) 2.27 2.63 2.81 3.00 3.00
Investments - Shuak 0.0 0.0
Subtotal 334.9 240.3 Production summary 2016a 2017f 2018f 2019f 2020f
Net cash/(debt) 40.4 28.2 Kounrad – Eastern dumps
NAV 385.3 268.5 Avg flow rate (1,000l/hr) 888 550 380 260 50
Asset valuation summary PLS grade (Cu g/l) 2.40 2.30 2.00 1.80 1.50
Recovery (%) 75.0% 75.0% 75.0% 75.0%
Copper production (kt) 14,020 8,311 4,993 3,075 493
Kounrad – Western dumps
Average flow rate (1,000l/hr) - 400 600 780 980
PLS grade (Cu g/l) - 2.00 2.10 2.00 2.00
Recovery (%) - 75.0% 75.0% 75.0% 75.0%
Copper production (kt) - 5,186 8,168 10,113 12,706
Copper Bay
Copper production (t) - - - - -
Company
Total copper production (kt) 14.0 13.5 13.2 13.2 13.2
CAML share price C1 cash costs (US$/lb) 0.43 0.50 0.52 0.53 0.55
Fully absorbed costs (US$/lb) 1.06 1.24 1.28 1.30 1.33
Profit & loss summary 2016a 2017f 2018f 2019f 2020f
Gross revenue 69.3 78.3 81.6 87.0 87.1
Cost of production (9.5) (10.1) (10.5) (10.6) (11.0)
Mineral extraction tax (3.9) (4.5) (4.7) (5.0) (5.0)
Selling costs (2.6) (2.5) (2.4) (2.4) (2.4)
G&A (14.1) (14.6) (14.6) (14.7) (14.9)
EBITDA 39.2 46.6 49.4 54.3 53.8
Depreciation & amortisation (D&A (5.0) (5.1) (5.0) (5.0) (5.2)
NAV sensitivity analysis (pence per share) Interest 0.0 0.0 0.0 0.0 0.0
Cu price -30% -20% -10% Base 10% 20% 30% Taxation (6.7) (11.2) (11.9) (13.2) (13.1)
5% 173 219 266 312 358 405 451
8% 152 191 230 268 307 346 385 Net income 34.2 30.4 32.5 36.1 35.6
10% 141 176 211 246 281 315 350 Average shares outstanding (million) 112.1 112.1 112.1 112.1 112.1
12% 131 163 195 226 258 290 321 EPS (US$) 0.24 0.27 0.29 0.32 0.31
Production summary Dividend (pence per share) 15.5 15.5 18.0 22.0 22.0
Abridged balance sheet Y/E 2016a 2017f 2018f 2019f 2020f
Cash & equivalents 40.4 48.2 59.1 69.4 75.3
Fixed assets 93.8 87.7 85.2 82.8 80.1
Total assets 138.5 140.2 148.6 156.5 159.7
Current liabilities 6.0 6.4 6.4 6.4 6.4
Long-term debt 0.0 0.0 0.0 0.0 .00
Other long-term liabilities 10.6 10.6 10.6 10.6 10.6
Total liabilities 17.0 17.0 17.0 17.0 17.0
Shareholders’ equity 121.5 123.2 131.6 139.5 142.7
Cash flow summary 2016a 2017f 2018f 2019f 2020f
Cash from operations 35.5 33.0 35.0 38.5 38.2
Copper resources (2013) Mt Cu % kt Capital expenditure (12.3) (2.50) (2.00) (2.00) (2.00)
Kounrad Cash from investing activities (13.3) (2.50) (2.00) (2.00) (2.00)
Indicated 386.0 0.10 368.2 Dividends (20.4) (22.7) (22.1) (26.2) (30.3)
Cash from financing activities (22.8) (22.7) (22.1) (26.2) (30.3)
Inferred 261.1 0.09 246.0 Cash at end 40.4 48.2 59.1 69.4 75.3
Copper Bay*
Measured & Indicated
53.4 0.24 92.2 Profitability 2016a 2017f 2018f 2019f 2020f
Inferred 14.4 0.23 33.7 EBITDA margin (%) 56% 60% 60% 62% 62%
Note that financial tables above are summaries and totals may not always agree
Source: CAML, Marten & Co. * 2017
Kounrad88%
Investments2%
Cash10%
100
140
180
220
260
Apr/16 Jul/16 Oct/16 Jan/17
0
100
200
300
400
12.5
13.0
13.5
14.0
14.5
2016A 2017f 2018f 2019f 2020f 2021f
Pric
e/c
os
t (US
c/lb
)
Pro
du
ctio
n (
kt)
Copper prod (kt) (LHS)
Cash costs (USc/lb) (RHS)
Copper price (USc/lb) (RHS)

M A R T E N & C O Central Asia Metals
Annual overview │ 25 April 2017 Page 29
Appendix 1 – CAML’s cost advantage explained
In running a resource business, management must focus on controlling costs to grow its bottom line as the price of its product is a variable usually outside its control.
Probably CAML’s most attractive investment feature is the fact that it is a low-cost copper producer; one of the lowest, if not the lowest, in the industry. This gives it a significant advantage over other copper producers, especially in the low-price environment that the industry has having to contend with over the past four years. It can make money when others may be struggling.
CAML’s competitive advantage derives principally from the nature of its business model. Its copper extraction business is low cost because the operation simply involves processing pre-mined material. This means that mining costs, which are usually the largest component of total operating costs for a traditional copper mining company, are zero.
In 2016, the company strengthened its competitive position further by reducing its already low unit operating (C1) costs by 28%, by virtue of increased production, exchange rate movements that worked in its favour. Total costs were reduced on lower depreciation and amortisation charges for some of assets, with the Western dumps extending production through to 2034.
C1 costs are a standard metric used in copper mining as a reference point to denote the basic cash costs of running a mining operation to allow a comparison across the industry. Although producers are not bound to adhere strictly to any convention, the most widely accepted definition is that from consultants, Wood Mackenzie.
Under this definition, C1 costs are direct costs, which include costs incurred in mining and processing (labour, power, reagents, materials) plus local G&A, freight and realisation and selling costs. Any by-product revenue is credited against costs at this stage. Costs are reported in US dollars per pound of copper produced.
Increasing production invariably leads to a reduction in unit operating costs. Although there are certain variable costs that will increase as the treatment rate increases, for instance the costs of chemical reagents, a large proportion of costs, such as overheads, are fixed. Increased copper production means that fixed costs are spread over a wider volume resulting in a lower cost figure per pound of copper sales.
Furthermore, most of CAML’s operating costs (70% of C1 costs) are in the local currency whereas the company reports its results in US dollars. With a massive depreciation of the tenge in 2015, the company is fortunate to report US dollar-denominated costs that have automatically declined.
Of course, however, any reversal of the depreciating trend of the tenge against the US dollar will impact negatively on costs and lead to a rise in those costs.
With C1 costs of just US43c/lb, we believe that CAML is one of the lowest cost producers in the world, based on the 2016 industry C1 cost data from GFMS Thomson Reuters.

M A R T E N & C O Central Asia Metals
Annual overview │ 25 April 2017 Page 30
Appendix 2 - How CAML achieves targeted copper production rate
The leach process at Kounrad involves the irrigation of the dumps with sulphuric acid at a controlled rate through a network of dripper pipes. The acid leaches (dissolves) the copper ions as it percolates through the material and the resultant copper-PLS is collected in a trench surrounding the dump and then allowed to settle in ponds to release remaining solids before being pumped to the solvent extraction and electrowinning (SX-EW) plant.
In the SX section, the PLS is contacted with an organic solvent which extracts the copper leaving an acidic aqueous solution (raffinate), which is pumped back to the dumps. The copper-bearing aqueous phase is stripped of the copper by strong acid before being sent to the EW stage where the copper is reduced from copper sulphate in solution to a metallic copper cathode.
The key to achieving target copper cathode production is to control the grade of the PLS to the plant, which can be tricky given the variability of grade within each weathered dump. The company has the flexibility to manage the process two ways. Firstly, by working a number of individual dumps within the Eastern dumps at any one time and, secondly, by varying the flow rate of the raffinate.
The dumps are divided into blocks. Leaching of any one block is essentially a three-phase process, with a ‘bloom’ (high grade) phase, a steady phase and finally a tail recovery phase over a roughly six-month time period. The first 120 days recover about 40% of the copper with the remaining 10-11% over the final 60 days during which time the blocks are allocated rest periods.
New ore blocks are sequentially started developing a ‘nest’ of contiguous leach curves and thus by having a number of blocks undergoing leaching at any one time and phasing the commencement of leach, CAML is able to avoid major peaks and troughs in the grade of the PLS and deliver a fairly constant grade to the SX-EW plant.
In Figure 27, below, which shows the leach curves for block in 2012, as the PLS grade of block 5-6 falls off, blocks 4-1 and 4-2 come into play and support the PLS average grade until blocks 2-1 and 2-2 commence. Thus, the PLS grade averaged 2.24 g/l in 2014 (which is close to the most efficient grade of 2.00 g/t) despite a wide range between 8 g/l and less than 1 g/l.

M A R T E N & C O Central Asia Metals
Annual overview │ 25 April 2017 Page 31
Figure 27: Leach curves for blocks
Source CAML
The second main variable that CAML can control is the flow rate. Although the average grade of the PLS since the start up has declined year-by-year as planned, and is reaching its long-term average of 2.00-2.30 g/l as predicted in the feasibility study, CAML has increased flow rates and with the expansion of the plant now complete can achieve up to 1,200 m3/hr (in summer).
Figure 28 shows the average flow rates since operations began.
Figure 28: Average flow rates and PLS grade
Source: CAML
With the plant expansion in 2015, copper cathode deposition rates have improved from 35 t/d up to 50 t/d (summer) and from 18 t/d up to 35 t/d (winter).
0
2
4
6
8
10
12
Apr/12 May/12 Jun/12 Jul/12 Aug/12 Sep/12 Oct/12 Nov/12 Dec/12
PL
S C
u g
pl
PLS grade block 5-6 block 4-1/4-2 block 2-1/2-2 block 3-1/3-2
0
100
200
300
400
500
600
700
800
900
1000
0
0.5
1
1.5
2
2.5
3
3.5
4
4.5
2012 2013 2014 2015 2016
Flo
w rate (m
3/hr)P
LS
gra
de
(g/l)
PLS grade (g/l) (LHS) Flow rate (m3/hr) (RHS)

M A R T E N & C O Central Asia Metals
Annual overview │ 25 April 2017 Page 32
Appendix 3 – Ownership After consolidating ownership in 2014, CAML owns 100% of the project through two wholly-owned subsidiaries - Kounrad Copper Company LLP (KCC), which is the holding company for CAML’s 100% interest in the project’s SX-EW facility and Sary Kazna LLP (SK), which is the holding company for CAML’s 100% interest in the SUC. The SUC covers 22.5 km2 and expires in 2034.
The SUC was operated as a 60:40 joint venture between SK and government organisation, SEC Saryarka (SA) from 2007. The SX-EW plant was built and operated by KCC, a 60:40 joint venture between CAML Kazakhstan BV (CAML BV) and SA, from 2008. Subsequently, SA sold its 40% stake to Kazakh businessman, Kenges Rakishev, via his company SAT & Co (SAT). CAML obtained 100% ownership in 2014.
CAML completed the consolidation of Kounrad in two parts: the transfer of the 40% interest in KCC from SAT to Mr Rakishev and subsequently to CAML BV, which was completed in October 2013; followed by the transfer of the 40% interest in the SUC to Mr Rakishev and subsequently to SK in May 2014.
CAML appointed Mr Rakishev as a non-executive director in November 2013 following the KCC consolidation. Consideration for the remaining 40% of the Kounrad operation was paid to Mr Rakishev in the form of 21.2m ordinary CAML shares and £848,470 in lieu of dividends once the transfer was complete
Appendix 4 - Resource definition work Figure 29: Resource definition work at Kounrad
Year Work Location Remarks
2007 10 drillholes Dumps 6, 7 and 9-10 Samples throughout the programme were assayed for total copper (Cutotal), acid soluble copper (Cuacid) and cyanide soluble copper (Cucyan)
2008-09 85 drillholes plus 10 channel trenches
Dumps 1, 1a, 5, 6, 7, 9-10, 15, 16, 21 and 22
2010 137 pits, nine surface trenches within dump 21a plus a further 13 pits.
10 kg composite sub-samples used for metallurgical testing
2011 98 RC drill holes to 3 m below the base of the dumps
Western dumps 1, 15 and 16 and Eastern dumps 5, 6, 7, and 9-10
2012 131 RC drill holes to 3 m below the base of the dumps
Eastern dump 2 plus Western dumps 13, 15, 16, 20, 21 and 22
Source: Wardell Armstrong International

M A R T E N & C O Central Asia Metals
Annual overview │ 25 April 2017 Page 33
Authorised and regulated by the Financial Conduct Authority 123a Kings Road, London SW3 4PL 0203 691 9430
www.martenandco.com
Registered in England & Wales number 07981621, 2nd Floor Heathmans House 19 Heathmans Road, London SW6 4TJ
Sales contacts: Edward Marten
Christopher Bunstead([email protected])
Research contacts:
Resources analyst - Paul Burton ([email protected])
James Carthew ([email protected])
Matthew Fernley([email protected])
Matthew Read ([email protected]
IMPORTANT INFORMATION
This marketing communication has been prepared for Central Asia Metals Plc by Marten & Co (which is authorised and regulated by the Financial Conduct Authority) and is non-independent research as defined under the Financial Services Act 2000 (Financial Promotion) Order 2005. It is intended for use by investment professionals as defined in article 19.(5) of that Order. Marten & Co is not authorised to give advice to retail clients and, if you are not a professional investor, or in any other way are prohibited or restricted from
receiving this information you should disregard it. The research does not have regard to the specific investment objectives, financial situation and needs of any specific person who may receive it.
The research has not been prepared in accordance with legal requirements designed to promote the independence of investment research and as such is considered to be a marketing communication. The analysts who prepared this research are not constrained
from dealing ahead of it but, in practice and in accordance with our internal code of good conduct, will refrain from doing so. Nevertheless they may have an interest in any of the securities mentioned in this research.
This note has been compiled from publicly available information. This note is not directed at any person in any jurisdiction where (by reason of that person’s nationality, residence or otherwise) the publication or availability of this note is prohibited.
Accuracy of Content: Whilst Marten & Co uses reasonable efforts to obtain information from sources which we believe to be reliable and to ensure that the information in this note is up to date and accurate, we make no representation or warranty that the information contained in this note isaccurate, reliable or complete. The information contained in this note is provided by Marten & Co for personal use and information purposes generally. You are solely liable for any use you may make of this information. The information is inherently subject to change without notice and may become outdated. You, therefore, should verify any information obtained from this note before you use it.
Investment Performance Information: Please remember that past performance is not necessarily a guide to the future and that the value of shares and the income from them can go down as well as up. Exchange rates may also cause the value of underlying overseas investments to go down as well as up. Marten & Co may write on companies that use gearing in a number of forms that can increase volatility and, in some cases, to a complete loss of an investment.
No Advice: Nothing contained in this note constitutes or should be construed to constitute investment, legal, tax or other advice.
No Representation or Warranty: No representation, warranty or guarantee of any kind, express or implied is given by Marten & Co in respect of anyinformation contained on this note.
Exclusion of Liability: To the fullest extent allowed by law, Marten & Co shall not be liable for any direct or indirect losses, damages, costs orexpenses incurred or suffered by you arising out or in connection with the access to, use of or reliance on any information contained on this note. In no circumstance shall Marten & Co and its employees have any liability for consequential or special damages.
Governing Law and Jurisdiction: These terms and conditions and all matters connected with them, are governed by the laws of England and Wales and shall be subject to the exclusive jurisdiction of the English courts. If you access this note from outside the UK, you are responsible for ensuring compliance with any local laws relating to access.
No information contained in this note shall form the basis of, or be relied upon in connection with, any offer or commitment whatsoever in any jurisdiction.