central asia experiences in drought management by galina stulina, sic - icwc, gwp central asia and...
TRANSCRIPT

Central Asia experiences In
drought management
Bratislava
October, 2012
Vadim Sokolov, Galina Stulina
GPW, SIC ICWC
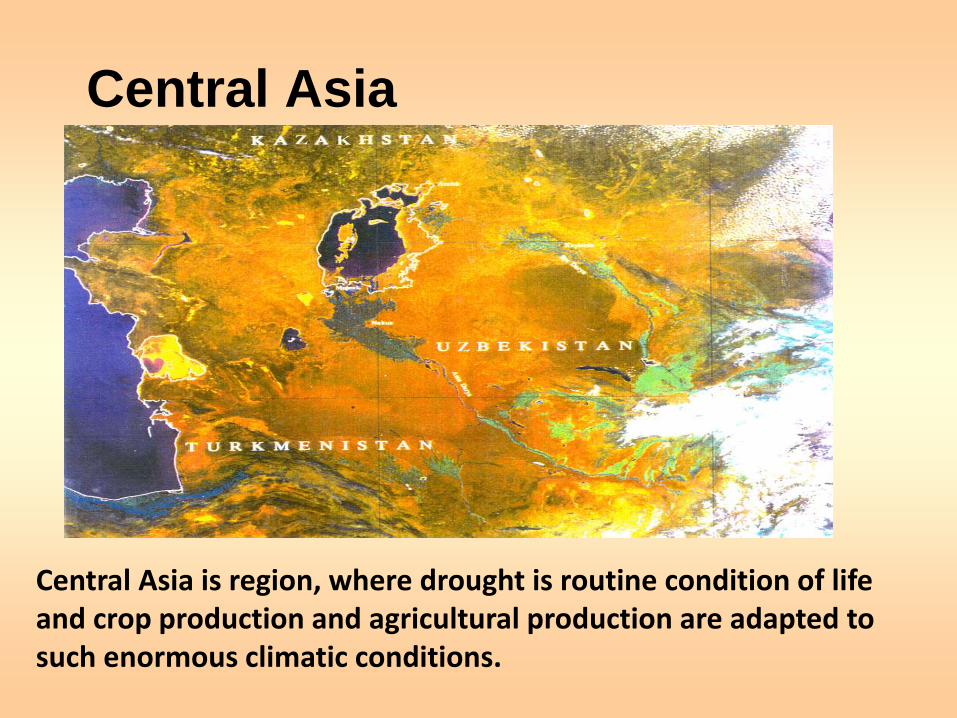
Central Asia
Central Asia is region, where drought is routine condition of life and crop production and agricultural production are adapted to such enormous climatic conditions.

The Basic Indicators of Water and Land
Resources Development in the Aral Sea Basin
Indicator Unit 1960 1980 1990 2010 Forecast (2020) Optimistic Pessimistic
Population
Irrigated area
Irrigated area per capita
Total water withdrawal
Including for irrigation
Specific withdrawal per 1 hectare
Specific withdrawal per capita
GNP
million
thousand
hectares
ha/capita
km3/year
km3/year
m3/ha
m3/capita
bln.USD
14,4
4510
0,32
60,61
56,15
12450
4270
16,1
26,8
6920
0,26
120,69
106,79
15430
4500
48,1
33,6
7600
0,23
116,27
106,4
14000
3460
74,0
48.5
8201
0.17
109.5
91.6
11171
2259
76.7
54,0
9330
0,17
104,5
86,8
9300
1935
109
70,0
9300
0,12
117,0
96,7
10400
1670
77,0

b) Climate change
Uzhydromet
0
20
40
60
80
100
120
140
160
180
200
1933 1939 1945 1951 1957 1963 1969 1975 1981 1987 1993 1999
-0.6
-0.4
-0.2
0
0.2
0.4
0.6
1860 1880 1900 1920 1940 1960 1980 2000
Ano1320 > 40 40 - 60 60 - 80 80 - 100100 - 120120 - 140 >160
N
EW
S
Long-term changes of the annual sums of precipitations
-2.5
-2
-1.5
-1
-0.5
0
0.5
1
1.5
1933 1939 1945 1951 1957 1963 1969 1975 1981 1987 1993 1999
Ant13200-1.2-0.8-0.4 0.0 0.4 0.8 1.2 1.6
N
EW
S
evaporation
Regional indicators of change of a climate

Annual national temperatures increased by:
• 0.29 0C every 10 years in Uzbekistan (1950–2005);
• 0.26 0C every 10 years in Kazakhstan (1936–2005);
• 0.18 0C every 10 years in Turkmenistan (1961–1995);
• 0.10 0C every 10 years in Tajikistan (1940–2005);
• 0.08 0C every 10 years in Kyrgyzstan (1883–2005).

Суммарный сток Нарын, Карадарья, Чирчик
0
5
10
15
20
25
30
35
40
1 3 5 7 9 11 13 15 17 19
Средний период повторения маловодья
4,25 года
км
3
1945-1965
Средний
уровень
Суммарный сток Нарын, Карадарья, Чирчик
0.00
5.00
10.00
15.00
20.00
25.00
30.00
35.00
40.00
1 3 5 7 9 11 13 15 17 19 21 23 25
Средний период повторения маловодья
3 года
км
31980-2004
Средний
уровень
Extreme events
occurrence
Total Runoff of
Naryn, Karadarya
and Chirchik Rivers
Frequency of dry
year occurrence is
4.25 year on average
Frequency of dry year
occurrence is 3 year on
average

Amu Darya River
0
10000
20000
30000
40000
50000
60000
70000
80000
90000
100000
1932
1935
1938
1941
1944
1947
1950
1953
1956
1959
1962
1965
1968
1971
1974
1977
1980
1983
1986
1989
1992
1995
1998
mln
.m3
Pyandj+Vaksh Kerki Tuyamuyun Chatly
Syr Darya River
0
5000
10000
15000
20000
25000
30000
35000
193
2
193
5
193
8
194
1
194
4
194
7
195
0
195
3
195
6
195
9
196
2
196
5
196
8
197
1
197
4
197
7
198
0
198
3
198
6
198
9
199
2
199
5
199
8
mln
.m3
Total w ater resources Kal Bekabad
c) Anthropogenic drought
Most
dangerous type
of drought it’s
anthropogenic,
manmade,
which is
caused by
wrong methods
of water
managing,
allocation and
operation.

Change in landscape on the exposed bed of the Aral Sea
Amudarya channel
Change in vegetation. Withered trees and bushes
Tamarix Populus Asiana

•Public Awareness •Adaptation
Principal directions of Climate changes program in Central Asia

Forecasting activity and broad information allow designing and implementing adaptive complex.
All adaptation measures related to agriculture and
water should be divided on three levels: • national measures, including strategy; • regional measures (taking into account
transboundary waters); • local level, especially farm level - adaptive response.

И зм е н е н и е п р о до лж и т е ль н о с т и п е р и о да в е г е т а ц и и х ло п ч а т н и к а
( С р е дн е г о с о р т а )
2 0
1 6
4 3
4 3
2 9
3 0
4 8
4 5
2 1
1 9
0 2 0 4 0 6 0 8 0 1 0 0 1 2 0 1 4 0 1 6 0 1 8 0
Б а зо в ы й
П о п р о г н о зу H a dC M 2 н а у р о в е н ь
2 0 2 0 г .
С е в - в с х о ды
В с х о ды - б у т о н и за ц и я
Б у т о н и за ц и я - ц в е т е н и е
Ц в е т е н и е р а с к р ы т и е 1 - ы х к о р о б о ч е к
Р а с к р ы т и е 1 - ы х к о р о б о ч е к с о зр е в а н и е 7 0 % к о р о б о ч е к
Change of growing period

Скороспелые сорта
0
50
Фенологическая фаза
Дн
и
Базовый
вариант
19 43 28 42
Изменение
климата
15 40 29 39
Сев- Всходы-
Change in vegetation cover
early ripening
variety
late ripening variety
Base option
Climate change
Base option
Climate change
Early ripening variety
0
50
Phenological phase
Da
ys
Base option 19 43 28 42
Climate change 15 40 29 39
Soving- Sprouting- Budding Flowering-
Late ripening variety
0
20
40
60
80
Phenological phase
Da
ys
Base option 20 47 30 64
Climate change 16 46 30 56
Soving-
sprouting
Sprouting-
buddingBudding
Flowering-
opening

25-Jan
4-Feb
14-Feb24-Feb
5-Mar
15-Mar
25-Mar4-Apr
14-Apr
24-Apr
0 5 10 15 20
(оС)
date
Ташкент Ср Ташкент 1 Карши Ср Карши 1
Crossing over
the Limits
Established for
Air
Temperatures
Ср – present conditions, 1 – under climate changes: using data of
weather stations in Tashkent and Kashkadarya provinces)
Tashkent average

Flow Measurement
Practices used by farmers
Practices used by farmers

Water monitoring
and management

Traditional method of water saving in time of drought is “alternative” irrigation - water is applied not to each furrow, but to every other one

Water productivity
Irrigation schemes
Inflow (growing season)
Inflow changes
against the control
Yield Yield changes against the
control
Irrigation water productivity
Productivity changes against
the control
m3/ha kg/ha
Alternate irrigation (with filmy) 725 -20 5400 35 7.4 69
Every furrow irrigation (with filmy) 915 1 5520 38 6.0 37
Alternate irrigation (without filmy) 730 -20 3400 -15 4.7 6
Every furrow irrigation (without filmy) 907 0 4000 0 4.4 0

Irrigation by water mixed with manure (local name “sharvat”). Water to irrigated field flows through a big hole, in which
manure is put preliminary for proper mixing with water and following delivery to furrow
30% attempted to reduce losses by mulching of furrow or installation of polyethylene strip in head of furrow.

Actual water delivery
Change in area of water-allowance zones Improving
accuracy of water delivery from ±10% to ±2%

Use of water by winter wheat, depending on year’s water availability

Regional (transboundary) management
SCADA system of automation control

Farmer training in adapting to climate change
Training Seminar

Stabilization and use of the dried Aral Sea bed

• Central Asian countries have to develop their own National Policies to deal with climate change, where the development of alternative environmentally friendly energy sources and energy efficiency should become key priorities. They should also take responsibility for financing the implementation of these policies.
• Policies and activities for preventing climate change and climate change adaptation should be integrated into the socioeconomic development policies. The countries of the region should improve intersectoral and interdepartmental coordination.

• The transfer of new techniques and methods for climate change adaptation and emissions reduction should be combined with the transfer of relevant knowledge and skills to local experts in order to develop and establish local production, service industry, and to build capacity in whole.
• The process of development and implementation of policy in the sphere of climate change should be open and transparent. Governments and governmental bodies need to hold broad consultations with communities and take into account opinions of public organizations while making decisions.