central and heart of texas care coordination and
TRANSCRIPT

Central and Heart of Texas Care Coordination and Medication
Safety Coalition Meeting
Quarter 2 2015 Readmission Data

Agenda
National, TMF QIN, state and community readmission reports
2

3

4

5
National Quarterly Admissions and Readmissions per 1,000
Admissions per
1,000 benes Readmissions per
1,000 benes
Readmission
Percent
Start Date End Date Admissions Readmissions Live
Discharges
Eligible Beneficiaries
Observed Seasonall
y Adjusted
Observed Seasonall
y Adjusted
Observed /
Live Discharge
s
7/1/2013 9/30/2013 2,591,654 471,075 2,514,085 37,199,414 69.67 71.21 12.66 12.83 18.74%
10/1/2013 12/31/2013 2,561,072 458,060 2,476,521 37,405,564 68.47 69.71 12.25 12.53 18.50%
1/1/2014 3/31/2014 2,629,658 472,299 2,538,145 37,067,545 70.94 67.98 12.74 12.21 18.61%
4/1/2014 6/30/2014 2,602,567 471,032 2,522,505 37,198,891 69.96 70.14 12.66 12.74 18.67%
7/1/2014 9/30/2014 2,525,396 459,017 2,449,052 37,315,969 67.68 69.22 12.30 12.47 18.74%
10/1/2014 12/31/2014 2,580,269 464,860 2,494,170 37,483,659 68.84 70.08 12.40 12.68 18.64%
1/1/2015 3/31/2015 2,675,375 475,571 2,579,307 37,177,878 71.96 69.00 12.79 12.26 18.44%
4/1/2015 6/30/2015 2,526,080 443,919 2,448,761 37,265,584 67.79 67.96 11.91 11.99 18.13%
Source: NCC Scorecard Dec 2015. CMS FFS data 7/1/2013 – 6/30/2015

Source: NCC Scorecard Dec 2015. CMS FFS data 7/1/2013 -6/30/2015 6

Source: NCC Scorecard Dec 2015. CMS FFS data 7/1/2013 -6/30/2015 7

QIN Region: Discharge Disposition After Inpatient Hospitalization and 30-Day Readmission Rates
QIN Region (AK, OK, MO,
PR, TX) Setting
Number of Discharges
% of All Discharges
30-day Readmits
Rate of 30-day
Readmits
Region
Home Health Agency 21,076 7.5% 3,409 16.2%
Home 186,653 66.3% 29,498 15.8%
Hospice 10,563 3.8% 251 2.4% Inpatient Rehabilitation Facility 14,766 5.2% 2,300 15.6%
Long-Term Acute Care 5,477 1.9% 666 12.2%
Skilled Nursing Facility 42,833 15.2% 8,146 19.0%
All 281,368 100.0% 44,270 15.7%
Source: Medicare FFS Claims. Time Period: 5/1/2015 -7/31/2015.
8

Texas: Discharge Disposition After Inpatient Hospitalization and 30-Day Readmission Rates
Setting
Number of Discharges
% of All Discharges
30-day Readmits
Rate of 30-day
Readmits
Texas
Home Health Agency 25,373 15.7% 4,436 17.5%
Home 87,497 54.3% 16,246 18.6%
Hospice 7,146 4.4% 183 2.6%
Inpatient Rehabilitation Facility 9,912 6.1% 1,717 17.3%
Long-Term Acute Care 5,764 3.6% 683 11.9%
Nursing Home 25,549 15.8% 5,258 20.6%
All 161,241 100.0% 28,523 17.7%
Source: Medicare FFS Claims. Time Period: 5/1/2015 -7/31/2015
9

QIN Region and Texas Rate of 30-Day Hospital Readmissions
10
Source: Medicare FFS Claims. Time Period: 5/1/2015 -7/31/2015

QIN Region and Texas 30-Day Hospital Discharges, Readmissions and Rates by Quarter
11/1/2014 -1/31/2015
2/1/2015-4/30/2015
5/1/2015- 7/31/2015
Texas
Inpatient hospital discharges 160,969 159,801 155,449
Readmits with 30 days 26,047 25,517 24,956
Rate of 30-day readmits (%) 16.2% 16.0% 16.1%
Goal (%) 14.0% 14.0% 14.0%
QIN Region Rate of 30-day readmits (%) 15.9% 15.8% 15.7%
Source: Medicare FFS Claims. Time Period: 5/1/2015 -7/31/2015
11

QIN Region and Texas Readmission Rates by Care Setting Quarterly
QIN Region Setting
11/1/2014 1/31/2015
2/1/2015-4/30/2015
5/1/2015- 7/31/2015
Home Health Agency 16.4% 15.6% 16.2%
Home 15.9% 15.8% 15.8%
Hospice 1.9% 2.0% 2.4%
Inpatient Rehabilitation Facility 16.4% 16.6% 15.6%
Long-Term Acute Care 12.0% 11.9% 12.2%
Nursing Home 19.6% 19.5% 19.0%
Texas Setting
11/1/2014 1/31/2015
2/1/2015-4/30/2015
5/1/2015- 7/31/2015
Home Health Agency 16.5% 15.9% 16.2%
Home 16.5% 16.2% 16.4%
Hospice 2.3% 2.2% 2.6%
Inpatient Rehabilitation Facility 16.2% 16.5% 15.6%
Long-Term Acute Care 11.4% 11.0% 12.0%
Nursing Home 19.1% 19.2% 19.1%
Source: Medicare FFS Claims. Time Period: 5/1/2015 -7/31/2015
12

Top Five MS DRGs with 30-Day Readmit Rates for QIN Region and Texas
State and Community DRG Code DRG Description
Number of Discharges
30-day Readmits
Rate of 30-day Readmits
QIN Region
871 Septicemia or severe sepsis w/o mv 96+ hours w mcc 13,094 2,156 16.5%
291 Heart failure & shock w mcc 5,718 1,323 23.1%
292 Heart failure & shock w cc 5,489 1,193 21.7%
682 Renal failure w mcc 3,738 866 23.2%
683 Renal failure w cc 4,839 864 17.9%
Texas
871 Septicemia or severe sepsis w/o mv 96+ hours w mcc 7,365 1,213 16.5%
291 Heart failure & shock w mcc 3,195 742 23.2%
292 Heart failure & shock w cc 3,026 677 22.4%
682 Renal failure w mcc 2,138 510 23.9%
683 Renal failure w cc 2,692 492 18.3%
Source: Medicare FFS Claims. Time Period: 5/1/2015 -7/31/2015.
13
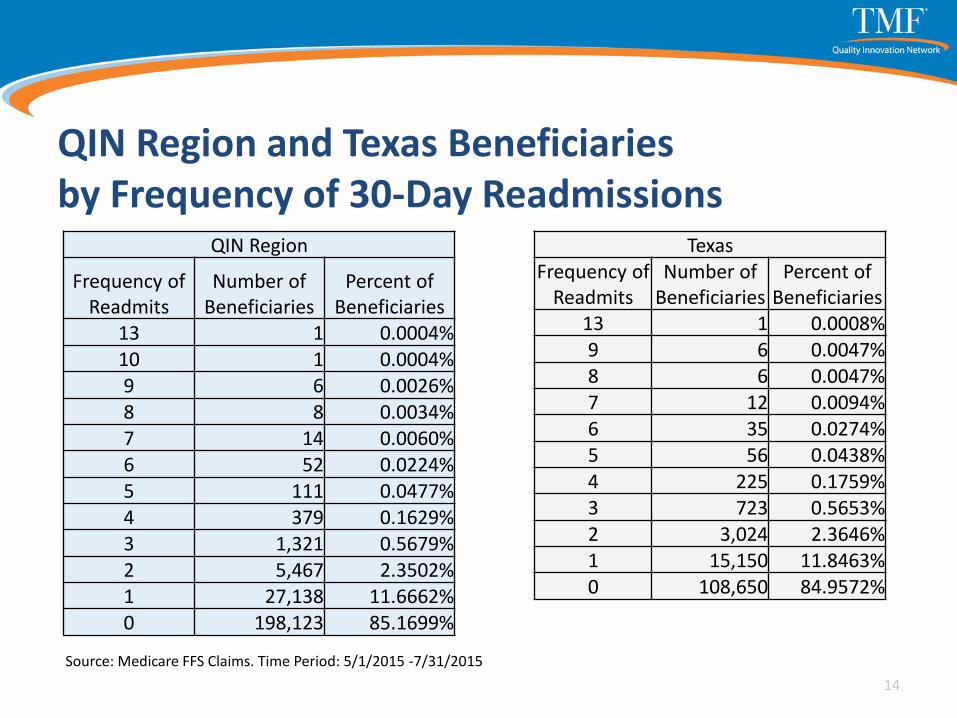
QIN Region and Texas Beneficiaries by Frequency of 30-Day Readmissions
QIN Region
Frequency of Readmits
Number of Beneficiaries
Percent of Beneficiaries
13 1 0.0004% 10 1 0.0004% 9 6 0.0026% 8 8 0.0034% 7 14 0.0060% 6 52 0.0224% 5 111 0.0477% 4 379 0.1629% 3 1,321 0.5679% 2 5,467 2.3502% 1 27,138 11.6662% 0 198,123 85.1699%
Texas
Frequency of Readmits
Number of Beneficiaries
Percent of Beneficiaries
13 1 0.0008% 9 6 0.0047% 8 6 0.0047% 7 12 0.0094% 6 35 0.0274% 5 56 0.0438% 4 225 0.1759% 3 723 0.5653% 2 3,024 2.3646% 1 15,150 11.8463% 0 108,650 84.9572%
Source: Medicare FFS Claims. Time Period: 5/1/2015 -7/31/2015
14

Texas Rate of 30-Day Readmits for Specific Diseases
Source: Medicare FFS Claims. Time Period: 5/1/2015 -7/31/2015 15

Medicare Penalty Diagnoses Diagnosis ICD-9 Code for TMF Readmission Reports
Congestive Heart Failure (CHF) 40201 40211 40291 40401 40403 40411 40413 40491 40493
4280 4281 42820 42821 42822 42823 42830 42831 42832
42833 42840 42841 42842 42843 4289
Acute Myocardial Infarction (AMI) 41000 41001 41010 41011 41020 41021 41030 41031 41040
41041 41050 41051 41060 41061 41070 41071 41080 41081
41090 41091
Pneumonia (PNE) 4800 4801 4802 4803 4808 4809 481 4820 4821 4822 48230
48231 48232 48239 48240 48241 48249 48281 48282 48283
48284 48289 4829 4830 4831 4838 485 486 4870
Chronic Obstructive Pulmonary Disease (COPD) 4928 496 4912 49120 49121 49122 490 4910 4911 4918 4919 4920
494 4940 4941
Diabetes (DM) V6546 V5391 V4585 7916 7915 79029 79022 79021 7902 25001
24900 25000 25093 25092 25002 25091 25090 25083 25071 25073
25063 25062 25053 25051 25050 25043 25042 25041 25040 25033
25032 25052 25031 25030 25023 25022 25021 25020 25061 25070
25013 25012 25072 25011 25060 25010 25003 25080 25082 25081
24991 24990 24981 24980 24971 24970
24961 24960 24951 24941 24940 24931 24930
24911 24910 24920 24921 24901 24950
Hip/Knee (THK) 81.51 81.54 16

Central and Heart of Texas Care Coordination and Medication Safety Coalition Meeting
17

Central and Heart of Texas Readmission Rates by Provider Type
Setting
Number of Discharges
% of All Discharges
30-day Readmits
Rate of 30-day
Readmits
Your Community
Home Health Agency 456 8.3% 105 23.0%
Home 3,581 65.0% 575 16.1%
Hospice 250 4.5% 9 3.6% Inpatient Rehabilitation Facility 89 1.6% 15 16.9%
Long-Term Acute Care 52 0.9% 7 13.5%
Nursing Home 1,081 19.6% 206 19.1%
All 5,509 100.0% 917 16.7%
Source: Medicare FFS Claims. Time Period: 5/1/2015 -7/31/2015
18

Central and Heart of Texas: Community Top Five MS DRGs and Their 30-Day Inpatient Readmission Rates
DRG Code DRG Description
Number of Discharges
30-day Readmits
Rate of 30-day
Readmits
Your Community
871 Septicemia or severe sepsis w/o mv 96+ hours w mcc 328 56 17.1%
291 Heart failure & shock w mcc 148 34 23.0%
292 Heart failure & shock w cc 118 31 26.3%
392 Esophagitis, gastroent & misc digest disorders w/o mcc 117 20 17.1%
682 Renal failure w mcc 62 19 30.6%
Source: Medicare FFS Claims. Time Period: 5/1/2015 -7/31/2015.
19

Central and Heart of Texas: Community Medicare Beneficiaries Profiled by Frequency of 30-day Readmissions
20
Frequency of Readmits
Number of Beneficiaries
Percent of Beneficiaries
9 1 0.0222%
8 1 0.0222%
6 1 0.0222%
5 3 0.0665%
4 9 0.1995%
3 35 0.7757%
2 100 2.2163%
1 538 11.9238%
0 3,824 84.7518%
Source: Medicare FFS Claims. Time Period: 5/1/2015 -7/31/2015

Readmission
Percent
NameStart
Date
End
Date
Admissi
ons
Readmi
ssions
Live
Dischar
ges
Eligible
Benefici
aries
Admissi
ons
Readmissi
ons
Observed /
Live
Discharges
Rates per 1,000
benes
Community Cohort A North Texas Health
Coalition (Denton) 7/1/2013 6/30/2014 13,569 2,236 13,141 46,866 289.53 47.71
Central and Heart of
Texas 7/1/2013 6/30/2014 22,539 4,032 21,965 83,085 271.28 48.53 18.36%
Central and Heart of
Texas
10/1/2013
9/30/2014 22,517 4,021 21,926 83,246 270.49 48.30 18.34%
Central and Heart of
Texas 1/1/2014 12/31/2014 22,905 4,126 22,273 83,309 274.94 49.53 18.52%
Central and Heart of
Texas 4/1/2014 3/31/2015 23,199 4,245 22,547 83,436 278.05 50.88 18.83%
Central and Heart of
Texas 7/1/2014 6/30/2015 23,438 4,313 22,803 83,503 280.68 51.65 18.91%
21 Source: NCC Scorecard Dec 2015. CMS FFS data 7/1/2013 – 6/30/2015

Rolling 4-Quarter Admissions per 1,000
22 Source: NCC Scorecard Dec 2015. CMS FFS data 7/1/2013 – 6/30/2015
264.00
266.00
268.00
270.00
272.00
274.00
276.00
278.00
280.00
282.00
1 2 3 4 5
CTX Admissions

Rolling 4-Quarter Readmissions per 1,000
23
Source: NCC Scorecard Dec 2015. CMS FFS data 7/1/2013 – 6/30/2015
46.00
47.00
48.00
49.00
50.00
51.00
52.00
1 2 3 4 5
CTX Readmissions

Successful Interventions
Utilize data to drive change
Build a foundation of trust in the community
Best practice interventions
› Coleman Care Transitions Intervention Model
› INTERACT
› Project RED
› Home Health Quality Improvement
24

Resources TMF QIN-QIO Website: http://tmfqin.org/
Home Health Quality Improvement National Campaign: www.homehealthquality.org
INTERACT II: http://Interact2.net
Care Transitions Intervention: www.caretransitions.org
Re-engineering Discharge: http://www.bu.edu/fammed/projectred/index.html
Project BOOST: http://www.hospitalmedicine.org/Web/Quality_Innovation/Implementation_Toolkits/Project_BOOST/Web/Quality___Innovation/Implementation_Toolkit/Boost/Overview.aspx
25

Resources, cont. Agency for Healthcare Research and Quality: www.ahrq.gov
PEPPER: http://PEPPERresouces.org
Hospital to Home: http://cvquality.acc.org/en/Initiatives/H2H/About-H2H.aspx
Institute for Healthcare Improvement: http://www.ihi.org/resources/Pages/Tools/HowtoGuideImprovingTransitionsfromHospitaltoHomeHealthCareReduceAvoidableHospitalizations.aspx
26

About the QIN-QIO Program
Leading rapid, large-scale change in health quality:
Goals are bolder.
The patient is at the center.
All improvers are welcome.
Everyone teaches and learns.
Greater value is fostered.
27

About the TMF QIN-QIO TMF Health Quality Institute has partnered with the Arkansas Foundation for Medical Care, Primaris in Missouri and the Quality Improvement Professional Organization, Inc. in Puerto Rico to form the TMF Quality Innovation Network Quality Improvement Organization (TMF QIN-QIO), under contract with the Centers for Medicare & Medicaid Services (CMS). The TMF QIN-QIO works with providers across all care settings to provide quality improvement services in the states of Arkansas, Missouri, Oklahoma and Texas, and the territory of Puerto Rico.
28

TMF QIN-QIO Website http://www.tmfqin.org
Provides targeted technical assistance and engages providers and stakeholders in improvement initiatives through numerous Learning and Action Networks (LANs).
The networks serve as information hubs to monitor data, engage relevant organizations, facilitate learning and sharing of best practices, reduce disparities and elevate the voice of the patient.
29

LANs Join any of the following TMFQIN.org networks and you can sign up to receive email notifications to stay current on announcements, emerging content, events and discussions in the online forums. Cardiovascular Health
and Million Hearts
Health for Life – Everyone with Diabetes Counts
Healthcare-Associated Infections
Meaningful Use
Medication Safety
Nursing Home Quality Improvement
Patient and Family
Quality Improvement Initiative
Readmissions
Value-Based Improvement and Outcomes
30

All Are Welcome
To join, create a free account at http://www.tmfqin.org/. Visit the Networks tab for more information.
As you complete registration, follow the prompts to choose the network(s) you would like to join.
31

Contact
Nanci Newberry, RN, M.Ed
Quality Improvement Consultant
TMF Health Quality Institute
Phone: 830-358-2105
32
This material was prepared by TMF Health Quality Institute, the Medicare Quality Innovation Network Quality Improvement Organization, under contract with the Centers for Medicare & Medicaid Services (CMS), an agency of the U.S. Department of Health and Human Services. The contents do not necessarily reflect CMS policy. 11SOW-QINQIO-C3-15-29