central and eastern europe private equity statistics 2016 · central and eastern europe private...
TRANSCRIPT

Central and Eastern Europe Private Equity Statistics 2016August 2017
Central and Eastern Europe Private Equity Statistics 2016August 2017
Our partner:

DisclaimerThe information contained in this report has been produced by Invest Europe, based on data collected as part of the European Data Cooperative (EDC) and other third party information. While Invest Europe has made every effort to ensure the reliability of the data included in this report, Invest Europe cannot guarantee the accuracy of the information collected and presented. Therefore, Invest Europe cannot accept responsibility for any decision made or action taken based upon this report or the information provided herein.
This presentation is for the exclusive use of the persons to whom it is addressed and is intended for general information purposes only. It is not intended to constitute legal or other professional advice and should not be treated as such. Appropriate legal advice must be sought before making any decision, taking any action or refraining from taking any action in reliance on the information contained in this presentation. Invest Europe does not assume any responsibility for any person’s reliance upon the information contained herein.
In furnishing this presentation, Invest Europe undertakes no obligation to provide any additional information or to update this presentation or any additional information or to correct any inaccuracies which may become apparent.
Unless otherwise specified, this presentation is confidential and may not be distributed, published, reproduced or disclosed to any other person or used for any other purpose, without the written permission of Invest Europe.
Copyright informationNo part of this publication may be reproduced by any process except in accordance with the provisions of the Copyright Act 1968. Copyright enquiries should be directed to Invest Europe. Tel: + 32 2 715 00 20.
© Copyright Invest Europe August 2017
Version Presentation as of 21/08/2017
Central and Eastern Europe Statistics 2016 Our partner: Gide
2

3Central and Eastern Europe Statistics 2016Our partner: Gide
Invest Europe
Invest Europe is the voice of investors in privately-held companies in Europe.
> Invest Europe is the association representing Europe’s private equity, venture capital and infrastructure sectors, as well as their investors.
> Our members take a long-term approach to investing in privately held companies, from start-ups to established fi rms. They inject not only capital but dynamism, innovation and expertise. This commitment helps deliver strong and sustainable growth, resulting in healthy returns for Europe’s leading pension funds and insurers, to the benefi t of the millions of European citizens who depend on them.
> Invest Europe aims to make a constructive contribution to policy affecting private capital investment in Europe. We provide information to the public on our members’ role in the economy. Our research provides the most authoritative source of data on trends and developments in our industry.
> Invest Europe is the guardian of the industry’s professional standards, demanding accountability, good governance and transparency from our members.
> Invest Europe is a non-profi t organisation with 25 employees in Brussels, Belgium.
> For more information please visit www.investeurope.eu

4Central and Eastern Europe Statistics 2016Our partner: Gide
About this report
> This report was compiled with the help of Invest Europe’s Central and Eastern Europe Task Force. It provides annual activity statistics for the private equity and venture capital markets of Central and Eastern Europe in 2016 and prior years. The statistics contained herein are based solely on the “market approach”, wherein information is compiled to show activity in a particular country, regardless of the origin or location of private equity fund managers. This contrasts with the “industry approach” that shows the activity of fund managers based in a particular country, and which is not applied in this paper. Invest Europe believes using the market approach gives a more accurate picture of the overall investment trends and activities in the markets of Central & Eastern Europe (CEE) due to the predominance of regional funds and fund managers. For the purposes of this publication, CEE comprises the countries of Bosnia and Herzegovina, Bulgaria, Croatia, the Czech Republic, Estonia, Hungary, Latvia, Lithuania, Macedonia, Moldova, Montenegro, Poland, Romania, Serbia, Slovakia, Slovenia and Ukraine. These countries have a total population of about 170 million and registered a total GDP of €1.3 trillion in 2016.
> We refer readers to the methodology and defi nitions sections at the back of this document to aid in understanding the data and terminology used throughout the text.
> The European Data Cooperative (EDC) is a joint initiative developed by Invest Europe and its national association partners to collect Europe-wide industry activity on fundraising, investments and divestments.
> The EDC platform is jointly owned and operated by the private equity and venture capital associations across Europe. Using one platform with a standardised methodology that allows us to have consistent, robust pan-European statistics that are comparable across the region. As a result we produce the most comprehensive overview of Europe’s private equity and venture capital markets available, allowing us to better inform fund managers, investors, policymakers, regulators and other stakeholders. These efforts enhance Invest Europe’s goal to be the most trusted and comprehensive source of European private equity and venture capital market data.
> The EDC replaces Invest Europe’s previous database PEREP_Analytics. All relevant historic data was migrated to the EDC system.
> All data since 2007 was restated and complemented with additional information. All audit efforts are conducted in close coordination with data contributors and partnering national associations to ensure the best coverage and consistent application of methodology and defi nitions.
> For further information and more comprehensive data contact Invest Europe Research ([email protected]) or visit www.investeurope.eu/research.
5Central and Eastern Europe Statistics 2016Our partner: Gide
Contents
1. FUNDRAISINGSummary 7
Fundraising for CEE 8
Sources of capital 9
Geographic sources 10
By stage 11
Fund stage focus 12
2. INVESTMENTSSummary 13
Annual investment values 14
By country 15
By sector 17
As percentage of GDP 18
Types of investment 19
Executive Summary 6
3. EXITSSummary 21
Annual divestment values 22
By country 23
Exit routes 25
By sector 26
4. VENTURE CAPITALSummary 27
By stage 28
By sector 30
By exit route 31
5. BUYOUT AND GROWTHSummary 32
By type 33
By sector 36
By exit route 37
6. APPENDIXAmendments of prior years’ statistics 38
Methodology 39
Defi nitions Fundraising 40
Defi nitions Investments 41
Defi nitions Exits 42

6Central and Eastern Europe Statistics 2016Our partner: Gide
Source: Invest Europe\EDC
Executive Summary
FundraisingIn 2016, total private equity fundraising in Central and Eastern Europe (CEE) reached €621 million, a 62% year-on-year increase. This was in line with the wider trend across all of Europe, where fundraising rose by 38%. CEE’s share of total European fundraising rose from 0.7% in 2015 to 0.8% in 2016, as larger fund managers returned to the market.
Funds of funds were the largest source of capital, accounting for 27% of the region’s capital raised in 2016, followed by pension funds with 16%. Government agencies, including multilateral organisations, were the leading source of capital in CEE from 2009-2015, but comprised just 15% of the total in 2016.
From a geographic perspective, European investors from outside the CEE region were the leading source of funds in 2016 and accounted for 58% of the total capital raised. Funding from domestic sources within CEE returned to an historically low level and comprised only 5% of total fundraising in 2016.
CEE buyout funds raised €445 million in 2016, compared with just €94 million in 2015. However, the region’s venture capital fundraising dipped to €102 million, lower than the previous two relatively strong years.
Investment activityPrivate equity investment in the CEE region reached €1.6 billion in 2016, slightly exceeding the previous year’s result, and was the highest since 2009. This underlines the trend of increasing annual investment value in the region since the recent market bottom in 2013. By comparison, Europe-wide investments were stable year-on-year, with investment activity in the CEE region representing around 3% of the European total. A drop in venture capital-backed companies in the region meant the number of companies receiving private equity funding decreased by 5% in 2016 to 337.
As in prior years, CEE private equity investment activity in 2016 was concentrated in a few countries. Poland remained the leading country with 45% of the region’s total investment value and home to almost a quarter of the companies receiving funding. It was followed by the Czech Republic, Lithuania, Romania and Hungary. These fi ve countries comprised an aggregate 81% of total CEE investment value and two thirds of the companies receiving private equity investment.
Buyout investments remained stable year-on-year at €1.2 billion, while growth capital funding continued as the region’s second most important type of private equity investment at €285 million and grew 16% year-on-year. Venture capital investments reached €100 million, equalling 2015’s level.
Exit activityPrivate equity exits across CEE in 2016 reached €1 billion, measured at historical investment cost. Despite a year-on-year decrease of 19% – compared to a 15% drop in divestments across all of Europe – CEE divestments remained at just under 3% of total exit value in Europe. Importantly, the 2016 result confi rms a continuing trend of elevated CEE exit activity that commenced in 2011.
The total number of companies divested in CEE increased to an all-time high of 112 in 2016, mainly driven by a growth in the number of exited venture-backed companies.
Sale to another private equity house – the secondary market – took over as 2016’s most popular exit route in CEE, accounting for 46% of the region’s total divestment value at historical cost. Trade sale, the region’s most prominent exit route for the previous six years, was second at 31% of total divestment value at cost but remained the most popular route in terms of the number of companies divested at 37.
Poland was again the largest market in the region for exits in 2016, accounting for 35% of regional divestments by value at cost. The Czech Republic was the second most active country, comprising a quarter of the regional total exit value.

7Central and Eastern Europe Statistics 2016Our partner: Gide
Source: Invest Europe\EDC
Fundraising Summary
Total CEE fundraising reached €621 million in 2016, a 62% increase compared with 2015. This was in line with the trend across all of Europe, where fundraising grew at an impressive, although slower, pace of 38%. CEE’s share of total European fundraising rose from 0.7% in 2015 to 0.8% in 2016, as larger fund managers returned to the market.
Funds of funds were the largest contributor to CEE fundraising, accounting for 27% of all capital raised in 2016. Pension funds accounted for the second largest source of capital, comprising 16% of the total raised. Government agencies, including multilateral organizations – the leading source of capital in CEE during the prior seven years – were in third place with just 15% of 2016’s total. Notably, academic institutions, endowments and foundations, which were historically not very active as a funding source in the region, accounted for a more substantial 14% of total CEE fundraising in 2016.
From a geographic perspective, European investors from outside the CEE region were the leading source of funds and accounted for 58% of the total capital raised in 2016. In absolute terms, funding from non-CEE European investors tripled compared with the prior year and amounted to €363 million. Funding from investors outside of Europe was strong in 2016 and grew nearly nine-fold in absolute terms to €133 million, comprising 21% of total CEE fundraising and driven mainly by funding from US-based investors. Domestic funding sources from within the CEE region returned to an historically low level, comprising just 5% of total fundraising in 2016.
CEE buyout funds raised €445 million in 2016 and accounted for 72% of the total capital raised across the region, a signifi cant increase compared with the year before, both in absolute terms and as a percentage of total fundraising. CEE venture funds raised €102 million, a 28% drop compared with 2015, amounting to 16% of total funds raised in 2016. The decrease was mainly driven by a decline in funds raised for venture capital in Poland. Meanwhile, growth capital fundraising increased eightfold in 2016 compared with the previous year and comprised 6% of total CEE fundraising, with €40 million raised.
It’s worth noting that the fundraising fi gures in this section only cover private equity funds that are dedicated to the CEE region and those pan-European or global funds that have a clearly defi ned investment allocation to the region. The universe of funds active in CEE is wider, as other pan-European and global managers have deployed capital in CEE and their activity is covered by the investment section of this report.

8Central and Eastern Europe Statistics 2016Our partner: Gide
Source: Invest Europe/EDC for 2007-2016 data. Invest Europe/Thomson Reuters/PricewaterhouseCoopers for previous years’ data.
Fundraising Summary
0
500
1,000
1,500
2,000
2,500
3,000
3,500
4,000
4,500
20162015201420132012201120102009200820072006200520042003
Figure 1: Fundraising for CEE private equity, 2003-2016
496312
1,293
2,254
4,030
2,509
378
638801 692
482
1,480
384621
€ m
illio
n

9Central and Eastern Europe Statistics 2016Our partner: Gide
Source: Invest Europe\EDC
Fundraising
Figure 2: Sources of capital raised for CEE private equity in 2013-2016 (% of total)
*Other sources contain: Capital markets and Unclassified.
2016201520142013
27%14%
13%
16%8%
11%5%
15%31%
39%43%
14%
1%
9%19%
2%1%
6%17%
3%3%
5%3%
6%
13%13%
7%23%
2%1%
8%
16%
6%
Fund of funds
Pension funds
Government agencies
Other asset managers
Family offices and Private Individuals
Corporate investors
Sovereign wealth funds
Insurance companies
Banks
Other sources*
0% 5% 10% 15% 20% 25% 30% 35% 40% 45%
Academic institutions, Endowments and
foundations

10Central and Eastern Europe Statistics 2016Our partner: Gide
Source: Invest Europe\EDC
Fundraising
0%
10%
20%
30%
40%
50%
60%
70%
80%
90%
100%
2016201520142013201220112010200920082007
UnclassifiedOutside EuropeEurope (excl. CEE)Within CEE
Figure 3: Geographic sources of funds raised for CEE private equity, 2007-2016
5.0%1.9%
29.4%
18.5%
50.1%
49.8%
36.7%
8.5%
18.7%
53.0%
5.3%
23.0%
15.5%
64.1%
0.3%
20.0%
32.8%
40.5%
19.7%
7.0%
6.5%
46.7%
34.6%
12.2%
13.1%
50.6%
12.6%
23.7%
17.5%
28.0%
34.8%
19.6%
51.7%
31.3%
3.9%
13.1%
5.0%
58.4%
21.4%
15.2%

11Central and Eastern Europe Statistics 2016Our partner: Gide
Source: Invest Europe\EDC
Fundraising
0
500
1,000
1,500
2,000
2,500
3,000
3,500
4,000
4,500
2016201520142013201220112010200920082007
Generalist fundMezzanine fundBuyout fundGrowth capitalVenture capital95 184 52 217 121 54
1995104242
41
1762
1,131
172
1415 9470
75
10240
445
34
468
150
94368
140
77
13910713045
1254
197146
1,913
221
44
741
2,954
160
80
Figure 4: Fundraising by stage – incremental closings, 2007-2016
€ m
illio
n

12Central and Eastern Europe Statistics 2016Our partner: Gide
Source: Invest Europe\EDC
Fundraising
Table 1: CEE funds raised – incremental closings during the year (in € thousands)
2015 2016
Fund stage focus Amount % Amount %
Early-stage 49,098 12.8 61,502 9.9
Later stage venture 40,327 10.5 0 0.0
Venture (all stages) 51,227 13.3 40,101 6.5
Total venture 140,653 36.6 101,603 16.4
Growth capital 5,000 1.3 40,000 6.4
Buyout 93,701 24.4 445,374 71.7
Mezzanine 70,000 18.2 0 0.0
Generalist 74,950 19.5 33,969 5.5
Total funds raised for CEE
384,303 100.0 620,945 100.0
Total funds raised in Europe
53,460,272 73,758,063
Table 2: CEE funds raised – fi nal closings in the year by independent funds – cumulative amount raised since inception (in € thousands)
2015 2016
Fund stage focus Amount Number of funds
Amount Number of funds
Early-stage 0 0 60,912 2
Later stage venture 0 0 0 0
Venture (all stages) 0 0 40,101 1
Total venture 0 0 101,013 3
Growth capital 108,000 1 0 0
Buyout 99,600 1 82,000 1
Mezzanine 70,000 1 0 0
Generalist 15,750 1 118,669 3
Independent funds raised
293,350 4 301,682 7

13Central and Eastern Europe Statistics 2016Our partner: Gide
Source: Invest Europe\EDC
Investments Summary
Private equity investment in the CEE region reached €1.6 billion in 2016, slightly exceeding the previous year’s result, and was the highest since 2009. This underlines the trend of increasing annual investments in the region since the recent market bottom in 2013. The number of CEE companies receiving private equity fi nancing decreased by 5% to 337, mainly because of a drop in the number of venture-backed companies. In the same period, Europe-wide investment values were stable, at just 2% less than in 2015. Investment activity in the CEE region represented around 3% of the total investment value across Europe in 2016.
CEE private equity investment measured as a percentage of the region’s GDP again reached a level of 0.120% in 2016. This remains less than half of the total European average of 0.329%, in line with previous years. Notable exceptions are two of the Baltic states: Lithuania reached 0.404%, driven by a large transaction that took place in that market, while Estonia achieved 0.361%. Meanwhile, Poland, Serbia and Slovenia also showed results above the CEE regional average.
As in previous years, CEE private equity investment activity in 2016 was concentrated in a few countries. Poland remained the leading country, with 45% of the region’s total value and home to almost a quarter of the companies receiving investment. In terms of value, it was followed by the Czech Republic (11% of value, 5% of companies), Lithuania (10% of value, 8% of companies), Romania (9% of value and 5% of companies) and Hungary (6% of value, 24% of companies). These fi ve countries comprised an aggregate 81% of total CEE investments by value and two thirds of the companies receiving private equity investment.
It should be noted that the annual investment results in the CEE region and in individual CEE countries can be infl uenced by large single investments in particular markets. In 2016, the four largest investments accounted for 31% of the total regional amount invested: particularly investments in Lithuania and Poland. In 2015, the two largest transactions comprised 38% of the total.
The consumer goods and services sector was the most targeted area for CEE private equity investment in 2016, with 23% of capital invested into 69 companies. Investment in the ICT sector ranked a close second with a 22% share of invested value: a year-on-year increase of over 150%, driven by the region’s largest single deal of the year. ICT was the strongest performing sector in terms of the number of companies receiving investment, with 135 in 2016 – 40% of the CEE total – driven largely by venture capital activity. The biotech and healthcare sector ranked third by investment value, with €240 million or 15% of the regional total value, invested into 37 companies. Together these three sectors comprised 60% of investment in 2016, compared with 2015 when 63% of the total capital was deployed into just two sectors: consumer goods and services as well as energy and environment.
Buyout investments accounted for €1.2 billion in 2016, similar to the previous year. Buyouts comprised 75% of total CEE investments by value, slightly above the 69% level seen across all of Europe. The number of companies receiving buyout fi nancing was 43 in 2016 versus 39 in 2015. Growth capital fi nancing remained the region’s second most important type of private equity investment at €285 million, with 16% year-on-year growth and comprising 18% of the region’s total investment value. The number of CEE companies backed by growth funding grew year-on-year from 53 to 57. Venture investments in CEE remained stable in 2016 with a total of €100 million. By number of companies, venture capital registered its third best year on record, with 233 companies backed, after the two strong years of 2014 and 2015.

14Central and Eastern Europe Statistics 2016Our partner: Gide
Source: Invest Europe/EDC for 2007-2016 data. Invest Europe/Thomson Reuters/PricewaterhouseCoopers for previous years’ data.
Investments Summary
0
500
1,000
1,500
2,000
2,500
20162015201420132012201120102009200820072006200520042003
Figure 5: Annual investment value in the CEE region, 2003-2016
448546 508
1,667
1,981
2,4982,440
1,3701,262
1,055
847
1,331
1,582 1,596
€ m
illio
n

15Central and Eastern Europe Statistics 2016Our partner: Gide
Source: Invest Europe\EDC
Investments
0
100
200
300
400
500
600
700
800
900
Other*UkraineSlovakiaBulgariaLatviaCroatiaSerbiaSloveniaEstoniaHungaryRomaniaLithuaniaCzechRepublic
Poland
2016201520142013
Figure 6: Annual investment value in CEE, 2013-2016
430
258
725
818
1416
8
22 39 4915
6
8914
714
7
148
296
74 58 23 21 5 13 48
4213
41 26
3 3 15 30 1334 23 20 4 11 817
329
13 12 73
169
158
89 26 76
229
21 1051
10
41
€ m
illio
n
* Other consists of Bosnia & Herzegovina, Macedonia, Moldova and Montenegro.

16Central and Eastern Europe Statistics 2016Our partner: Gide
Source: Invest Europe\EDC
Investments
0
20
40
60
80
100
120
140
Other*UkraineSlovakiaBulgariaLatviaCroatiaSerbiaSloveniaEstoniaHungaryRomaniaLithuaniaCzechRepublic
Poland
2016201520142013
Figure 7: Annual investments in CEE, 2013-2016 (number of companies)
9486
8212
8
1714
17
26
1723
14 16
4472
6181
1016 18
22
6 8 6 6 3 3 4 4 7 7 6 512 12
2227
5 5 5
14
34 32 32
3 3 2 1 16 4
12
3945
35
Num
ber
of c
ompa
nies
* Other consists of Bosnia & Herzegovina, Macedonia, Moldova and Montenegro.

17Central and Eastern Europe Statistics 2016Our partner: Gide
Source: Invest Europe\EDC
Investments
Table 3: Investments by sector, 2015-2016
2015 2016
Amount (€ thousands)
% Number of companies
% Amount (€ thousands)
% Number of companies
%
Agriculture 37,905 2.4 8 2.3 11,548 0.7 3 0.9
Biotech and healthcare 135,399 8.6 33 9.3 240,318 15.1 37 11.0
Business products and services 113,609 7.2 62 17.6 100,113 6.3 42 12.5
Chemicals and materials 1,254 0.1 9 2.5 27,486 1.7 7 2.1
Construction 688 0.0 2 0.6 46,239 2.9 6 1.8
Consumer goods and services 511,214 32.3 80 22.7 365,674 22.9 69 20.5
Energy and environment 489,414 30.9 14 4.0 192,490 12.1 14 4.2
Financial and insurance activities 88,538 5.6 12 3.4 149,023 9.3 12 3.6
ICT (information and communication technology) 136,999 8.7 124 35.1 344,680 21.6 135 40.1
Real estate 7,389 0.5 2 0.6 113 0.0 1 0.3
Transportation 59,257 3.7 7 2.0 101,193 6.3 9 2.7
Other 0 0.0 0 0.0 16,863 1.1 2 0.6
Total investment in year 1,581,664 100.0 353 100.0 1,595,740 100.0 337 100.0

18Central and Eastern Europe Statistics 2016Our partner: Gide
Source: Invest Europe/EDC for investment dataIMF – World Economic Outlook Database for GDP data
Investments
0.0%
0.5%
1.0%
1.5%
2.0%
2.5%
Gre
ece
Ukr
aine
Slov
akia
Aust
ria
Bulg
aria
Hun
gary
Rom
ania
Croa
tia
Czec
h Re
publ
ic
Latv
ia
CEE
Serb
ia
Pola
nd
Slov
enia
Port
ugal
Ger
man
y
Nor
way
Irel
and
Belg
ium
Euro
pe
Spai
n
Ital
y
Uni
ted
King
dom
Esto
nia
Swit
zerl
and
Swed
en
Finl
and
Lith
uani
a
Den
mar
k
Fran
ce
Net
herl
ands
Luxe
mbo
urg
Figure 8: Private equity investments as a percentage of GDP, 2016 (by country of destination of investment)
2.13
8%
0.53
1%
0.53
0%
0.51
6%
0.40
4%
0.39
9%
0.39
1%
0.37
1%
0.36
1%
0.35
4%
0.34
3%
0.33
7%
0.32
9% 0.19
8%
0.18
3%
0.17
2%
0.14
2%
0.12
0%
0.10
3%
0.09
6%
0.09
0%
0.08
7%
0.07
8%
0.04
9%
0.03
0%
0.01
6%
0.01
3%
0.00
0%
% of
GD
P
0.27
8%
0.27
7%
0.27
2%
0.21
1%

19Central and Eastern Europe Statistics 2016Our partner: Gide
Source: Invest Europe\EDC
Investments
Table 4: Type of investment in CEE vs. Europe, 2016 (in € thousands)
Total CEE % of total
Total Europe
% of total
Seed 13,175 0.8 440,533 0.8
Start-up 75,004 4.7 2,049,138 3.9
Later-stage venture 12,110 0.8 1,817,577 3.5
Total venture 100,289 6.3 4,307,248 8.2
Growth 285,333 17.9 9,708,891 18.5
Rescue/Turnaround 0 0.0 365,021 0.7
Replacement capital 20,014 1.3 1,626,238 3.1
Buyout 1,190,104 74.6 36,460,497 69.5
Total 2016 1,595,740 100.0 52,467,895 100.0
Total 2015 1,581,664 53,579,623
Table 5: Type of investment in CEE, 2015-2016 (in € thousands)
2015 2016
Amount Number of companies
Amount Number of companies
Seed 12,469 70 13,175 55
Start-up 65,377 152 75,004 163
Later-stage venture 22,188 41 12,110 20
Total venture 100,034 259 100,289 233
Growth 246,937 53 285,333 57
Rescue/Turnaround 0 0 0 0
Replacement capital 22,708 2 20,014 5
Buyout 1,211,986 39 1,190,104 43
Total 1,581,664 353 1,595,740 337

20Central and Eastern Europe Statistics 2016Our partner: Gide
Source: Invest Europe\EDC
Investments
Table 6: Type of investment by CEE country, 2015-2016 (in € thousands)
2016Stage Focus Bulgaria Croatia Czech Rep. Estonia Hungary Latvia Lithuania Poland Romania Serbia Slovakia Slovenia Ukraine Other*Seed 950 0 712 400 3,117 1,950 1,026 1,671 0 80 3,170 0 0 100Start-up 4,550 3,814 3,488 4,727 26,025 5,515 2,189 15,067 860 1,000 6,801 967 0 0Later stage venture 0 0 0 1,380 2,109 425 0 4,696 1,500 0 0 2,000 0 0Total venture 5,500 3,814 4,200 6,507 31,251 7,890 3,215 21,434 2,360 1,080 9,971 2,967 0 100Growth 17,525 0 4,860 48,568 57,111 13,793 1,762 113,080 15,121 0 2,750 0 10,763 0Rescue/Turnaround 0 0 0 0 0 0 0 0 0 0 0 0 0 0Replacement capital 0 10,056 0 0 0 0 0 9,958 0 0 0 0 0 0Buyout 0 27,150 159,059 20,493 365 4,027 151,000 580,940 129,776 47,350 0 69,946 0 0Total 23,025 41,020 168,119 75,568 88,726 25,710 155,977 725,413 147,257 48,430 12,721 72,913 10,763 100
2015Stage Focus Bulgaria Croatia Czech Rep. Estonia Hungary Latvia Lithuania Poland Romania Serbia Slovakia Slovenia Ukraine Other*Seed 0 0 300 480 3,021 251 1,377 4,691 459 0 1,740 150 0 0Start-up 3,050 1,000 1,300 2,937 18,729 6,189 7,968 17,761 0 425 4,619 1,400 0 0Later stage venture 3,000 0 70 550 3,068 1,225 603 6,421 1,375 0 2,750 150 2,976 0Total venture 6,050 1,000 1,670 3,967 24,818 7,665 9,949 28,873 1,834 425 9,109 1,700 2,976 0Growth 5,250 11,547 8,750 9,859 38,482 33,169 35,608 79,385 4,505 0 7,000 0 13,381 0Rescue/Turnaround 0 0 0 0 0 0 0 0 0 0 0 0 0 0Replacement capital 0 0 0 0 0 0 0 22,708 0 0 0 0 0 0Buyout 22,239 0 3,407 7,269 95,000 0 3,499 686,784 140,730 228,657 13,400 10,000 1,001 0Total 33,539 12,547 13,827 21,095 158,300 40,834 49,056 817,750 147,069 229,082 29,509 11,700 17,358 0
* Other consists of Bosnia & Herzegovina, Macedonia, Moldova and Montenegro.

21Central and Eastern Europe Statistics 2016Our partner: Gide
Source: Invest Europe\EDC
Exits Summary
CEE private equity divestments in 2016 reached €1 billion, measured at historical investment cost. Despite a 19% year-on-year decrease – in the context of a wider 15% drop in divestments across the whole of Europe – CEE divestments remained at just under 3% of the total exit value in Europe. Importantly, the 2016 result confi rms a continuing trend of elevated CEE exit activity that commenced in 2011. The total number of companies divested in CEE increased to an all-time high of 112, mainly driven by a growth in the number of venture-backed companies exited in 2016.
Poland was again the largest market in the region for exits in 2016 with €363 million of divestment at cost – 35% of the CEE total - and the highest number of companies exited at 29, or 26% of the total. The Czech Republic, historically also a strong CEE exit market, was the second most active country by value of exits, with €255 million at cost, a quarter of the regional total. Hungary was the second most active country in terms of number of companies divested, with 26, or 23% of the regional total. Romania was in third place in both value of exits (13% of total) and number of companies (16% of total). Of note is Lithuania, which registered €106 million of exits at investment cost, the largest amount in recorded history in this country and driven by a large transaction. The fi ve countries mentioned above accounted for a total of 89% of total CEE divestment value and 86% of exited companies in 2016.
It should be noted that CEE exit values can be affected by a limited number of large deals. The 2016 results include four larger transactions that in the aggregate account for 51% of the total CEE exit value. These larger transactions took place in the Czech Republic, Lithuania and Poland.
Sale to another private equity house – the secondary market – was the most popular exit route in CEE in 2016, accounting for €476 million of value at cost, or 46% of total divestment value, with 15 exited companies. In value terms, this represents a record level of secondary exits in CEE and is atypical for the region. It was driven by three relatively large transactions that accounted for 38% of total divestment value for the whole CEE region in 2016.
Trade sale – the most prominent exit route in the CEE region for the previous six years – was the second most accessed route in 2016 with €314 million at cost, 31% of the regional total. At the same time, with 37 companies exited to trade buyers, this channel remained the most popular in terms of number of companies divested. Write–offs remained at a low level in 2016, which is typical for the CEE region, with just 2 companies falling into this category, accounting for less than 1% of the total exit value at cost.
Information and communication technology (ICT) was the most important sector for exits both in value terms with €348 million at cost – over a third of the region’s total – and by number of companies exited with 31 companies, 28% of the total. Notably, two out of four of the largest exits in CEE in 2016 were recorded in the ICT sector. The second largest divested sector by value was transportation with €214 million at historical cost; however, with only 3 companies exited and mainly driven by one large transaction. Other notable sectors of exit activity were consumer goods and services (€160 million at cost, or 16% of total) and energy and environment (€118 million at cost, or 12% of total), with the latter driven largely by one transaction.

22Central and Eastern Europe Statistics 2016Our partner: Gide
Exits Summary
0
200
400
600
800
1,000
1,200
1,400
1,600
1,800
20162015201420132012201120102009200820072006200520042003
Figure 9: Divestment value in CEE, 2003-2016 (exit value at investment cost)
236
123
422 442 450 464
179
346
1,634
1,098
966
1,311
1,027
1,262
€ m
illio
n
Source: Invest Europe/EDC for 2007-2016 data. Invest Europe/Thomson Reuters/PricewaterhouseCoopers for previous years’ data.

23Central and Eastern Europe Statistics 2016Our partner: Gide
Source: Invest Europe\EDC
Exits
0
100
200
300
400
500
600
700
800
Other*SerbiaSlovakiaLatviaCroatiaEstoniaUkraineSloveniaBulgariaHungaryLithuaniaRomaniaCzechRepublic
Poland
2016201520142013
Figure 10: Divestments at cost by CEE country, 2013-2016 (exit value at investment cost)
288
550
783
363 38
924
9
255
4366 66
128
106
163
70 62
8121
937 86 10
6
29
3
24 6
3512 22 34
2 12 17 9 13 13
463 15 21 3 4 36 7 16623
2
€ m
illio
n
* Other consists of Bosnia & Herzegovina, Macedonia, Moldova and Montenegro.

24Central and Eastern Europe Statistics 2016Our partner: Gide
Source: Invest Europe\EDC
Exits
0
10
20
30
40
50
Other*SerbiaSlovakiaLatviaCroatiaEstoniaUkraineSloveniaBulgariaHungaryLithuaniaRomaniaCzechRepublic
Poland
2016201520142013
Figure 11: Divestments by CEE country, 2013-2016 (number of companies)
36 3750
29
137 7
11
57
5
712 11
915
26
4 4
5
3 24
7 73
5
3 2 2 2 2
4
7
18
2 2 1 2 2 1 1 1 12 1
Num
ber
of c
ompa
nies
* Other consists of Bosnia & Herzegovina, Macedonia, Moldova and Montenegro.

25Central and Eastern Europe Statistics 2016Our partner: Gide
Source: Invest Europe\EDC
Exits
Table 7: Exits in CEE, 2015-2016 (in € thousands)
2015 2016
Amount at cost
Number of companies
Amountat cost
Number of companies
Sale to another private equity fi rm
278,005 7 475,793 15
Trade sale 645,869 41 314,396 37
Sale to fi nancial institutions
77,084 6 62,447 6
Divestment by public offering
206,101 7 58,242 8
Repayment of preference shares/loans or mezzanine
21,218 17 38,283 16
Management/Owner buy-back
23,345 21 36,404 16
Write-off 7,050 1 319 2
Divestment by other means 3,659 5 41,242 13
Total 1,262,330 104 1,027,125 112
0 13 26 39 52
Divestment by other means
Write off
Management/Owner buy-back
Repayment of preference shares/loans or mezzanine
Divestment by public offering
Sale to financial institutions
Trade sale
Sale to another private equity firm
% of total CEE% of total Europe
Figure 12: Exits routes in CEE vs. total Europe, 2016(% of exit value at investment cost)
46%29%
31%28%
6%5%
6%17%
4%6%
4%7%
0%2%
4%7%

26Central and Eastern Europe Statistics 2016Our partner: Gide
Source: Invest Europe\EDC
Exits
Table 8: CEE divestments by sector, 2015-2016 (exit value at investment cost)
2015 2016
Amount (€ thousands)
% Number of companies
% Amount (€ thousands)
% Number of companies
%
Agriculture 0 0.0 0 0.0 0 0.0 0 0.0
Biotech and healthcare 73,906 5.9 9 8.7 31,303 3.0 9 8.0
Business products and services 159,326 12.6 23 22.1 72,459 7.1 14 12.5
Chemicals and materials 35,131 2.8 3 2.9 30,026 2.9 7 6.3
Construction 499 0.0 1 1.0 13,749 1.3 4 3.6
Consumer goods and services 466,974 37.0 21 20.2 159,983 15.6 25 22.3
Energy and environment 11,472 0.9 9 8.7 118,443 11.5 9 8.0
Financial and insurance activities 187,440 14.8 10 9.6 35,591 3.5 8 7.1
ICT (information and communication technology) 321,746 25.5 26 25.0 347,626 33.8 31 27.7
Real estate 0 0.0 0 0.0 3,948 0.4 1 0.9
Transportation 5,836 0.5 2 1.9 213,947 20.8 3 2.7
Other 0 0.0 0 0.0 50 0.0 1 0.9
Total divestment in year 1,262,330 100.0 104 100.0 1,027,125 100.0 112 100.0

27Central and Eastern Europe Statistics 2016Our partner: Gide
Source: Invest Europe\EDC
The CEE venture capital market
In 2016, €100 million of venture capital (VC) funding was invested into the Central and Eastern Europe region, matching 2015’s result and comprising 6% of the region’s total private equity investments by value. With 233 CEE companies receiving VC backing, it’s the third largest number on record and represents 69% of the total number of all CEE private equity backed companies invested in 2016.
The CEE share of total European venture capital investment value was 2.3% in 2016 while the region accounted for 7.5% of total European companies receiving venture funding. The average venture capital investment per company in CEE was €0.43 million, less than a third of the European average of €1.4 million.
As in previous years, start-up stage investments was the largest VC category, accounting for 75% of total CEE venture investments by value and 70% by number of companies. The proportion of start-up stage investments has been growing for the last three years and in 2016 reached a level similar to that last observed in 2012.
Hungary was the leading destination for venture capital investment in CEE in 2016 with €31 million, accounting for 31% of the regional VC sector total. The country also took the lead in terms of number of companies, with an all-time high of 73 VC-backed companies. Poland followed with €21 million, or 21% of the regional total, and 46 companies receiving VC investment, though this is down from 88 companies the year before. Together, these two countries accounted for over half of the CEE region’s venture capital fi nancings in 2016, both by value and number of companies.
By sector, information and communication technology (ICT) led once again, with €49 million invested into 111 companies – almost half of the regional total on both measures. Consumer goods and services was second, comprising €17 million, invested into 37 companies, at around 16% of the CEE total on both counts. Biotech and healthcare followed with €14 million of investment into 28 companies. These three sectors together accounted for nearly 80% of the total venture investments in CEE by value and in number of companies.
Divestment values in CEE venture capital increased by almost a third in value in 2016, to reach €34 million measured at historical cost. The number of venture-backed companies exited followed this upward trend and increased substantially to 51 compared to 39 in the previous year. Trade sale was again the most prominent exit route, both in value and number of companies exited, and accounted for 61% of the venture exit value at cost and 31% of companies divested. The ICT sector remained the leading area for venture capital divestments, comprising 37% of total CEE venture divestments in value at historical cost and the largest number of companies exited at 19, followed by the energy and environment sector with 22% of the total divested value.

28Central and Eastern Europe Statistics 2016Our partner: Gide
Source: Invest Europe\EDC
The CEE venture capital market
0
50
100
150
200
250
300
350
2016201520142013201220112010200920082007
Later stageventureStart-upSeed
Figure 13: CEE venture capital investments by stage, 2007-2016
5 2 11
31
45
330
28
61
5
55
42
101
3
79
26
108
632
56
94
10
50
12
65
22
10012
75
13
100
45
106
27
301
4
73
62
140
332
€ m
illio
n

29Central and Eastern Europe Statistics 2016Our partner: Gide
Source: Invest Europe\EDC
The CEE venture capital market
0
50
100
150
200
250
300
2016201520142013201220112010200920082007
Later stageventureStart-upSeed
Figure 14: CEE venture capital investments by stage, 2007-2016 (number of companies)
8
41
42
13 3 16
39
29
100
61
11 19
81
39
78
44
161
56
127
60
23841
259
152
7055
20233
163
34
134
1267
201133
45
61
117
91
Num
ber
of c
ompa
nies

30Central and Eastern Europe Statistics 2016Our partner: Gide
Source: Invest Europe\EDC
The CEE venture capital market
Table 9: CEE venture capital investments by sector, 2015-2016
2015 2016
Amount (€ thousands)
% Number of companies
% Amount (€ thousands)
% Number of companies
%
Agriculture 2,463 2.5 5 1.9 25 0.0 1 0.4
Biotech and healthcare 12,566 12.6 28 10.8 13,991 14.0 28 12.0
Business products and services 14,796 14.8 43 16.6 11,279 11.2 32 13.7
Chemicals and materials 1,254 1.3 9 3.5 261 0.3 4 1.7
Construction 688 0.7 2 0.8 1,000 1.0 1 0.4
Consumer goods and services 19,007 19.0 51 19.7 16,503 16.5 37 15.9
Energy and environment 821 0.8 7 2.7 3,070 3.1 6 2.6
Financial and insurance activities 2,740 2.7 6 2.3 2,052 2.0 5 2.1
ICT (information and communication technology) 42,568 42.6 105 40.5 48,897 48.8 111 47.6
Real estate 120 0.1 1 0.4 113 0.1 1 0.4
Transportation 3,012 3.0 2 0.8 3,035 3.0 6 2.6
Other 0 0.0 0 0.0 63 0.1 1 0.4
Total investment 100,034 100.0 259 100.0 100,289 100.0 233 100.0

31Central and Eastern Europe Statistics 2016Our partner: Gide
Source: Invest Europe\EDC
The CEE venture capital market
Table 10: CEE venture capital divestments by exit route, 2015-2016 (exit value at investment cost, in € thousands)
2015 2016
Amount at cost
% Number of companies
% Amount at cost
% Number of companies
%
Trade sale 18,589 73.1 16 41.0 20,580 61.3 16 31.4
Management/Owner buy-back 4,117 16.2 15 38.5 7,198 21.4 13 25.5
Divestment by public offering 0 0.0 0 0.0 2,971 8.9 2 3.9
Write-off 0 0.0 0 0.0 319 0.9 2 3.9
Sale to another private equity fi rm 0 0.0 0 0.0 300 0.9 7 13.7
Repayment of preference shares/ loans or mezzanine
2,417 9.5 6 15.4 250 0.7 3 5.9
Sale to fi nancial institutions 0 0.0 0 0.0 31 0.1 1 2.0
Other 300 1.2 2 5.1 1,909 5.7 7 13.7
Total divestment in year 25,423 100.0 39 100.0 33,558 100.0 51 100.0

32Central and Eastern Europe Statistics 2016Our partner: Gide
Note: For the purposes of this section and unless otherwise stated, “buyout and growth” refers collectively to buyouts, growth capital, rescue/turnaround and replacement capital transaction. This defi nition is consistent with previous years’ editions of this paper.
The CEE buyout and growth market
Total buyout and growth investments in the CEE region remained stable in 2016 at €1.5 billion, while the number of companies receiving this type of funding grew by 11% to 104. In line with the previous year, buyout and growth investments comprised the vast majority – 94% – of the region’s total private equity investment value. By number of companies fi nanced, this market segment’s share of total CEE activity grew from 27% in 2015 to 31% in 2016.
CEE’s share of the overall European buyout and growth segment in 2016 remained stable at around 3% in terms of value but rose to 3.6% by number of companies from 3.0% the previous year.
Buyout was again the largest sub-segment, decreasing 2% from 2015 in amount, reaching €1.2 billion and with 43 companies backed compared with 39 the previous year. The concentration of buyouts among larger transactions was not as pronounced as in the previous year. In 2016, the four largest investments accounted for 41% of the buyout total amount invested, driven by investments in Lithuania and Poland. In 2015 just the two largest transactions comprised the same 41% of the total buyout sub-segment.
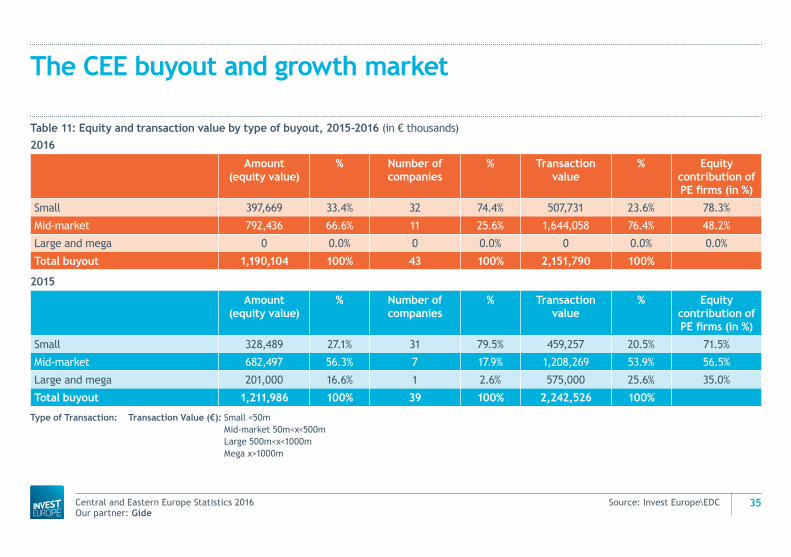
Within the buyout sub-segment, the CEE market in 2016 remained concentrated on mid-market transactions and to a lesser extent on small buyouts. There were no mega or large buyouts of over €500 million in total transaction size in the region. Mid-market buyouts registered €792 million of investments, just over two thirds of the total CEE buyout investment value, invested across 11 companies. By number of companies, small buyouts remained the most robust with 32 CEE companies involved in €398 million of small buyout transactions.
The growth capital investment sub-segment rose by 16% in value in 2016 and continued to be a signifi cant area of activity with €285 million invested into 57 companies.
Poland was again the most active buyout and growth market in the CEE region with €704 million of capital invested across 36 companies, accounting for almost half of the regional segment value in 2016. The next most active countries were Czech Republic (€164 million), Lithuania (€153 million), and Romania (€145 million). These four countries together accounted for 78% of the CEE buyout and growth segment by value and almost 60% by number of companies invested.
Consumer goods and services was the most targeted sector for CEE buyout and growth investors in 2016, attracting €350 million of investment or 23% of the segment’s total. This was followed by the ICT sector (€296 million, 20% of total), biotech and healthcare (€226 million, 15% of total), and energy and environment (€189 million, 13% of total). The sectoral concentration of buyout and growth investments was signifi cantly higher the previous year, when just two sectors received two thirds of the total buyout and growth investment value.
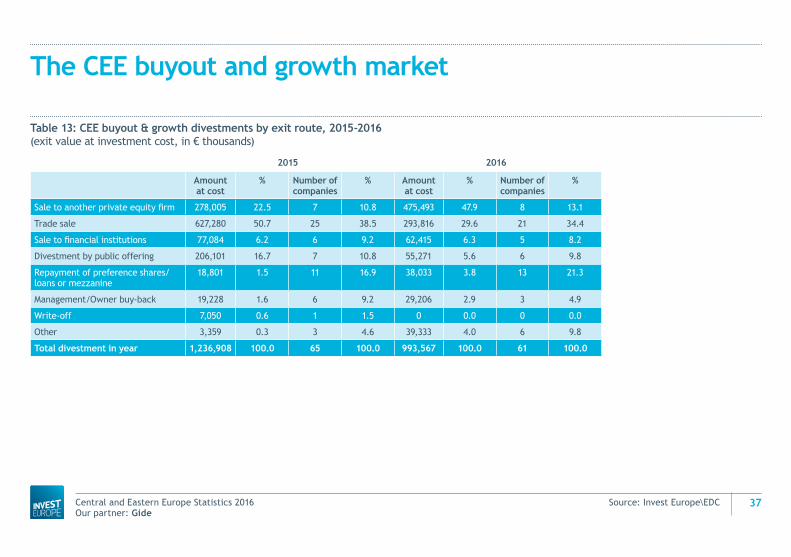
Exits in the CEE buyout and growth segment in 2016 totalled €994 million, measured at historical investment cost, representing a 20% decrease compared with 2015. At the same time, the number of companies exited decreased from 65 to 61. Sale to another private equity fi rm increased signifi cantly in value and was the most popular exit route with almost half of the total segment’s exit value in 2016. Trade sale, although down more than 50% from the previous year, ranked as the second most important exit route in the segment with 30% of total exit value at cost.
The most exited sectors were ICT (€335 million, 34% of total), transportation (€213 million, 21% of total), consumer goods and services (€157 million, 16% of total), and energy and environment (€111 million, 11% of total). Together these four sectors accounted for 82% of buyout and growth exits by value at historical cost.

33Central and Eastern Europe Statistics 2016Our partner: Gide
Source: Invest Europe\EDC
The CEE buyout and growth market
0
500
1,000
1,500
2,000
2,500
2016201520142013201220112010200920082007
BuyoutRescue/turnaround andreplacementcapitalGrowth capital
Figure 15: CEE buyout & growth investments by type, 2007-2016 (in € million)
580
55
1,207
370 373520
283
25
852
201
110
636
302 26132
247 285
20
1,190
1,495
23
1,212
1,482
932
1,225
31
420
753
946
1,160
54
736
1,310
155
1,867
2,396
157
1,640
2,166
1,842
€ m
illio
n

34Central and Eastern Europe Statistics 2016Our partner: Gide
Source: Invest Europe\EDC
The CEE buyout and growth market
0
20
40
60
80
100
120
140
2016201520142013201220112010200920082007
BuyoutRescue/turnaround and replacementcapitalGrowth capital
Figure 16: CEE buyout & growth investments by type, 2007-2016 (number of companies)
39 40
7
16
39
65
4
63
11
71
7
55
6
55
2
53
5
57
43
104
39
94
31
91
33
9432
111
38
102
118
50
39
5
55
99
9
61
106
Num
ber
of c
ompa
nies
93
35Central and Eastern Europe Statistics 2016Our partner: Gide
Source: Invest Europe\EDC
The CEE buyout and growth market
Table 11: Equity and transaction value by type of buyout, 2015-2016 (in € thousands)
2016
Amount (equity value)
% Number of companies
% Transaction value
% Equity contribution of PE fi rms (in %)
Small 397,669 33.4% 32 74.4% 507,731 23.6% 78.3%
Mid-market 792,436 66.6% 11 25.6% 1,644,058 76.4% 48.2%
Large and mega 0 0.0% 0 0.0% 0 0.0% 0.0%
Total buyout 1,190,104 100% 43 100% 2,151,790 100%
2015
Amount (equity value)
% Number of companies
% Transaction value
% Equity contribution of PE fi rms (in %)
Small 328,489 27.1% 31 79.5% 459,257 20.5% 71.5%
Mid-market 682,497 56.3% 7 17.9% 1,208,269 53.9% 56.5%
Large and mega 201,000 16.6% 1 2.6% 575,000 25.6% 35.0%
Total buyout 1,211,986 100% 39 100% 2,242,526 100%
Type of Transaction: Transaction Value (€): Small <50mMid-market 50m<x<500mLarge 500m<x<1000mMega x>1000m

36Central and Eastern Europe Statistics 2016Our partner: Gide
Source: Invest Europe\EDC
The CEE buyout and growth market
Table 12: CEE buyout & growth investments by sector, 2015-2016
2015 2016
Amount (€ thousands)
% Number of companies
% Amount (€ thousands)
% Number of companies
%
Agriculture 35,442 2.4 3 3.2 11,523 0.8 2 1.9
Biotech and healthcare 122,833 8.3 5 5.3 226,328 15.1 9 8.7
Business products and services 98,813 6.7 19 20.2 88,834 5.9 10 9.6
Chemicals and materials 0 0.0 0 0.0 27,225 1.8 3 2.9
Construction 0 0.0 0 0.0 45,239 3.0 5 4.8
Consumer goods and services 492,207 33.2 29 30.9 349,171 23.3 32 30.8
Energy and environment 488,593 33.0 7 7.4 189,420 12.7 8 7.7
Financial and insurance activities 85,798 5.8 6 6.4 146,971 9.8 7 6.7
ICT (information and communication technology) 94,431 6.4 19 20.2 295,783 19.8 24 23.1
Real estate 7,269 0.5 1 1.1 0 0.0 0 0.0
Transportation 56,245 3.8 5 5.3 98,158 6.6 3 2.9
Other 0 0.0 0 0.0 16,800 1.1 1 1.0
Total investment 1,481,630 100.0 94 100.0 1,495,452 100.0 104 100.0
37Central and Eastern Europe Statistics 2016Our partner: Gide
Source: Invest Europe\EDC
The CEE buyout and growth market
Table 13: CEE buyout & growth divestments by exit route, 2015-2016 (exit value at investment cost, in € thousands)
2015 2016
Amount at cost
% Number of companies
% Amount at cost
% Number of companies
%
Sale to another private equity fi rm 278,005 22.5 7 10.8 475,493 47.9 8 13.1
Trade sale 627,280 50.7 25 38.5 293,816 29.6 21 34.4
Sale to fi nancial institutions 77,084 6.2 6 9.2 62,415 6.3 5 8.2
Divestment by public offering 206,101 16.7 7 10.8 55,271 5.6 6 9.8
Repayment of preference shares/ loans or mezzanine
18,801 1.5 11 16.9 38,033 3.8 13 21.3
Management/Owner buy-back 19,228 1.6 6 9.2 29,206 2.9 3 4.9
Write-off 7,050 0.6 1 1.5 0 0.0 0 0.0
Other 3,359 0.3 3 4.6 39,333 4.0 6 9.8
Total divestment in year 1,236,908 100.0 65 100.0 993,567 100.0 61 100.0

38Central and Eastern Europe Statistics 2016Our partner: Gide
Source: Invest Europe\EDC
Appendix – Amendments of prior years’ statistics
All data from 2007 through 2016 reported in this publication is based on the European Database Cooperative (EDC), which replaced Invest Europe’s previous database from PEREP_Analytics. All relevant historic data was migrated to the EDC system in 2017. All data since 2007 has been restated and additional information was gathered during the transition and verifi cation process. The EDC system, like its predecessor, is continually updated as new information is obtained to achieve the highest level of accuracy. However, the results depend on the timely, complete and accurate submissions of information from private equity fund managers.
> Changes in amounts of funds raised, investments and divestments in certain years
> To ensure the best coverage, the European Database Cooperative offers private equity fi rms the possibility to submit surveys, audit historical data and validate previously gathered data captured from public sources. In addition, more information on the CEE market has become available. This has enriched the dataset, as a substantial number of new private equity fi rms submitted data on their activity in the CEE region to the new EDC system. In addition, if fund managers corrected previous years’ data, this was amended in the dataset and may include changes to the values and timing of funds raised, investments and exits as well as re-classifi cations of transactions by type.
> Reclassifi ed sector methodology
> The historical CEE data has been restated to match the new European sector classifi cation profi le. From 2016, certain industry sectors that historically were presented separately are now combined into one category. This refers to “ICT”, which replaces communications plus computer and consumer electronics; “business and industrial products and services”, which combines two previous categories; and “consumer goods and services”, which also combines two prior categories.
Invest Europe strongly recommends that readers use the most recent CEE statistics publication when analysing historical data to ensure highest level of accuracy.

39Central and Eastern Europe Statistics 2016Our partner: Gide
Source: Invest Europe\EDC
Appendix – Methodology
Fundraising
The vast majority of private equity funds raised for CEE were for the region as a whole rather than for any specifi c country. Therefore, fundraising is presented in this paper as a total pool of capital raised for the region. Moreover, fundraising is limited to capital raised by funds that have declared CEE to be their target region. The data does not include those funds that may allocate a portion of their capital to the CEE region but whose primary focus is elsewhere.
The funds included in the statistics are:
> private equity funds making direct private equity investments
> mezzanine private equity funds
> direct co-investment funds
> rescue/turnaround funds
The following funds are excluded from the statistics:
> infrastructure funds
> real estate funds
> distress debt funds
> primary funds-of-funds
> secondary funds-of-funds
Geographical sources of fundsCapital raised from an LP located in the same country as the fund it commits to is usually considered to be domestically raised according to the Invest Europe classifi cation. However, the CEE fundraising data includes private equity funds located outside of CEE but fully dedicated to the CEE region (e.g, a UK-based fund focused on the CEE region).
For the purposes of this report, domestic fundraising (“Within CEE” category) only includes capital raised from CEE-based LPs, regardless of the location of the private equity fund itself. We believe this gives the most accurate picture of actual commitments made by CEE-based LPs to CEE-focused funds.
Industry statistics are an aggregation of fi gures according to the country of the private equity fi rm’s offi ce in charge of the investment or divestment. At the European level, this relates to investments or divestments made by European private equity fi rms regardless of the location of the portfolio company.
Market statistics are an aggregation of fi gures according to the location of the portfolio company. At the European level, this relates to investments or divestments in European companies regardless of the location of the private equity fi rm.
Equity value: The amount of capital invested to acquire shares in an enterprise. The equity value includes equity, quasi-equity, mezzanine, unsecured debt and secured debt provided by the private equity fi rm. No co-investments by LPs are included.
Divestment amounts (including write-offs) are recorded at cost (i.e. the total amount divested is equal to the total amount invested earlier).

40Central and Eastern Europe Statistics 2016Our partner: Gide
Source: Invest Europe\EDC
Appendix – Defi nitions Fundraising
Fund stage focus > Buyout fund: Funds acquiring companies by purchasing
majority or controlling stakes, fi nancing the transaction through a mix of equity and debt.
> Early-stage fund: Venture capital funds focused on investing in companies in the early stages of their lives.
> Generalist fund: Funds investing in all stages of private equity.
> Growth fund: Funds that make private equity investments (often minority investments) in relatively mature companies that are looking for primary capital to expand and improve operations or enter new markets to accelerate the growth of the business.
> Later-stage fund: Venture capital funds providing capital for an operating company which may or may not be profi table. Typically in C or D rounds.
> Mezzanine fund: Funds using a hybrid of debt and equity fi nancing, comprising equity-based options (such as warrants) and lower-priority (subordinated) debt.
> Venture fund: Venture capital funds focused on both early and later stage investments.
Types of investors > Corporate investor: Corporations manufacturing
products or delivering non-fi nancial services.
> Endowment: An investment fund established by a foundation, university or cultural institution providing capital donations for specifi c needs or to further a company’s operating process. They are generally structured so that the principal amount invested remains intact (for perpetuity, for a defi ned period of time or until suffi cient assets have been accumulated to achieve a designated purpose).
> Family offi ce: An entity that provides services to one or more affl uent families, including investment management and other services (accounting, tax, fi nancial and legal advice etc.).
> Foundations: A non-profi t organisation through which private wealth is distributed for the public good. It can either donate funds and support other organisations, or provide the sole source of funding for their own charitable activities.
> Fund of funds: A private equity fund that primarily takes equity positions in other funds.
> Government agencies: Country, regional, governmental and European agencies or institutions for innovation and development.
> Other asset manager: A fi nancial institution (other than a bank, endowment, family offi ce, foundation, insurance company or pension fund) managing a pool of capital by investing it across different asset classes with the purpose of generating fi nancial returns. It may include private equity direct funds that occasionally do indirect investments, but excludes fund of funds that are a standalone option.
> Pension funds: A pension fund that is regulated under private or public sector law.
> Sovereign wealth funds: State-owned investment funds investing in foreign direct private equity funds to diversify their portfolio.
Independent and captive funds > Captive funds: Funds that are 100% owned by the parent
organisation.
> Independent funds: Semi-captive funds (those in which the parent owns less than 100%) as well as wholly independent funds.

41Central and Eastern Europe Statistics 2016Our partner: Gide
Source: Invest Europe\EDC
Appendix – Defi nitions Investments
Venture capital > Seed: Funding provided before the investee company
has started mass production/distribution with the aim to complete research, product defi nition or product design, also including market tests and creating prototypes. This funding will not be used to start mass production/distribution.
> Start-up: Funding provided to companies, once the product or service is fully developed, to start mass production/distribution and to cover initial marketing. Companies may be in the process of being set up or may have been in business for a shorter time, but have not sold their product commercially yet. The destination of the capital would be mostly to cover capital expenditures and initial working capital.
> Later-stage fi nancing: Financing provided for an operating company, which may or may not be profi table. Late stage venture tends to be fi nancing into companies already backed by VCs. Typically in C or D rounds.
Growth > A type of private equity investment (often a minority
investment) in relatively mature companies that are looking for primary capital to expand and improve operations or enter new markets to accelerate the growth of the business.
Buyout > Financing provided to acquire a company. It may use
a signifi cant amount of borrowed capital to meet the cost of acquisition. Typically by purchasing majority or controlling stakes.
Rescue / Turnaround > Financing made available to an existing business, which
has experienced fi nancial distress, with a view to re-establishing prosperity.
Replacement capital > Minority stake purchase from another private equity
investment organisation or from another shareholder or shareholders.

42Central and Eastern Europe Statistics 2016Our partner: Gide
Source: Invest Europe\EDC
Appendix – Defi nitions Exits
> Management/Owner buy-back: The buyer of the company is its management team.
> Public offering:
> First divestment following fl otation (IPO): The sale or distribution of a private company’s shares to the public for the fi rst time by listing the company on the stock exchange.
> Sale of quoted equity post fl otation: It includes sale of quoted shares only if connected to a former private equity investment, e.g. sale of quoted shares after a lock-up period.
> Repayment of preference shares/loans or mezzanine: If the private equity fi rm provided loans or bought preference shares in the company at the time of investment, then their repayment according to the amortisation schedule represents a decrease of the fi nancial claim of the fi rm into the company, and hence a divestment.
> Sale to another private equity fi rm: The buyer of the portfolio company is a private equity fi rm.
> Sale to fi nancial institution: A fi nancial institution is an entity that provides fi nancial services for its clients:
> Depositary Institutions: deposit-taking institutions that accept and manage deposits and make loans, including banks, building societies, credit unions, trust companies, and mortgage loan companies
> Contractual Institutions: Insurance companies and pension funds
> Investment Institutes other than direct private equity fi rms.
> Trade sale: The sale of a company’s shares to industrial investors.
> Write-off: The value of the investment is eliminated and the return to investors is zero or negative.

About Gide
Founded in Paris in 1920, Gide law fi rm operates today from 15 offi ces on four continents: Europe, with a focus on Central and Eastern Europe, as well as Asia, North America and Africa. With its over 25 years of experience in Central and Eastern Europe, Gide is well-established as a law fi rm in this area, known for advising on all aspects of business and fi nance law.
Gide has marked its presence throughout Central and Eastern Europe, with offi ces in Warsaw (since 1991), Moscow (since 1993), and Istanbul (since 1997). Our local teams can also call upon our Central and Eastern Europe Desk, as well as a network of local partner fi rms.
Central and Eastern Europe, although perceived by investors as one market, comprises many different jurisdictions. Therefore, setting up and doing business in this region requires an in-depth knowledge of local regulations and specifi c market conditions. The organisation of Gide’s business in this region allows it to perfectly meet the needs and expectations of institutions, investors and other companies operating on the CEE market.
Private EquityGide has an extensive private equity practice and is one of the leading legal teams advising on all forms of private equity transactions. The Private Equity Group’s expertise covers increasingly complex corporate, fi nancial, regulatory, tax and contractual legal issues that affect private equity funds, their sponsors and investors. We have experience in all types of private equity investment vehicles, including leveraged buyout funds, venture capital funds and real estate funds, and we advise numerous international and local investors, sponsors, management teams and industrial players on all forms of transactions involving private equity and real estate funds, from the provision of capital to start-up businesses and early-stage fi nancing or the acquisition of properties to the largest pan-European LBOs.
We also offer full assistance in the context of recapitalisation transactions, build-ups and exits. The Private Equity Group has a recognised expertise in assisting numerous investment bankers, senior, mezzanine and “bridge” lenders with arranging complex bank fi nancing projects for LBOs and real estate transactions.
Contact details
Central and Eastern Europe Statistics 2016Our partner: Gide
43
Warsaw (Poland)
CEE Desk (France)
Moscow (Russia) Istanbul (Turkey)
Dariusz [email protected]
Paweł Grześ[email protected]
Stanislas [email protected]
Hugues [email protected]
Matthieu [email protected]
Tim Thé[email protected]

Invest Europe Place du Champ de Mars 5B-1050 Brussels, Belgium
T +32 2 715 00 20 F +32 2 725 07 04