centers for disease control and prevention controlmalariasurveys.org/documents/household survey...
TRANSCRIPT
Household Survey Indicators for Malaria Control
·
C e n t e r s f o r D i s e a s eControl and Prevention
President’s Malaria Initiative

Household Survey Indicators
for Malaria Control
June 2013
MEASURE Evaluation
MEASURE DHS
President’s Malaria Initiative
Roll Back Malaria Partnership
UNICEF
World Health Organization
Acknowledgements
This document is a result of many months of work initiated by the Roll Back Malaria Monitoring and
Evaluation Reference Group Survey and Indicator Task Force. The development of the Household Survey
Indicators for Malaria Control would not have been possible without the assistance of numerous
individuals and organizations. We would especially like to thank the MEASURE Evaluation Project and
Elizabeth Ivanovich in particular for documenting these indicators, bringing partners together around key
issues and shepherding this document through to completion.
Overall guidance was provided by Fred Arnold, Richard Cibulskis and Holly Newby. Important inputs were
provided by Lia Florey, Samantha Herrera, Albert Kilian and Abdisalan Noor.
We acknowledge with gratitude the contributions of the individuals who reviewed this document and
provided important feedback. Special thanks go to Liliana Carvajal, Misun Choi, Erin Eckert and Leopoldo
Villegas.
We would also like to thank all individuals and organizations involved in the preparation of previous
versions of this document and the U.S. Agency for International Development for funding the project.
MEASURE Evaluation is funded by the U.S. Agency for International Development (USAID) through
cooperative agreement GHA-A-00-08-00003-00. The views expressed in this publication do not necessarily
reflect the views of USAID or the United States Government.

Page iii
Table of Contents
Acronyms ...................................................................................................................................... iv
1. Introduction .............................................................................................................................1
1.1 Background ................................................................................................................................. 1
1.2 Purpose and Content of Manual ................................................................................................. 8
2. Monitoring and Evaluation .................................................................................................... 10
2.1 Principles of Monitoring and Evaluation ................................................................................... 10
2.2 Household Surveys .................................................................................................................... 11
2.3 Sampling .................................................................................................................................... 12
2.4 Interpretation ............................................................................................................................ 13
3. Guidelines for Constructing Indicators from Household Surveys .............................................. 15
3.1 Prevention Using Insecticide-treated Nets and Indoor Residual Spraying................................ 15
3.2 Intermittent Preventive Treatment during Pregnancy ............................................................. 30
3.3 Case Management (among Children under Five Years Old) ..................................................... 34
3.4 Impact Indicators ...................................................................................................................... 39
References .................................................................................................................................... 51
Annex 1: Previously Recommended Indicators ............................................................................... 55
Annex 2: Sample Stata® Code for Calculating Intermediate Variable for Indicator 3 –
Proportion of Population with Access to an ITN within Their Household .......................................... 56
List of Tables:
Table 1: Updated GMAP Objectives, Targets, and Milestones Beyond 2011 ........................................ 2
Table 2: Indicators for Measuring Progress towards GMAP Objectives and Targets ............................ 4
Table 3: Household Survey Indicators for Assessing Progress towards GMAP Targets ......................... 7
Table 4: Changes to the Indicators in the 2012 Indicators Manual ....................................................... 9
Table 5: Summary of Vector Control Indicators ................................................................................... 16
Table 6: Strengths and Limitations of All ITN Indicators ...................................................................... 17
Table 7: Strengths and Limitations of All Prompt and Effective Treatment Indicators ....................... 35
Table 8: Strengths and Limitations of Impact Indicators ..................................................................... 39
Table 9: Strengths and Limitations of Using Rapid Diagnostic Tests and Microscopy for Population-
based Surveys ....................................................................................................................... 43
Page iv
Acronyms
ACT Artemisinin-based Combination Therapies
ANC Antenatal Care
CCM Community Case Management
CHERG Child Health Epidemiology Reference Group
DHS Demographic and Health Survey
GMAP Global Malaria Action Plan
Hb Hemoglobin
HIV Human Immunodeficiency Virus
HMIS Health Management Information Systems
IPTp Intermittent Preventive Treatment in Pregnancy
IRS Indoor Residual Spraying
ITN Insecticide-Treated Net
LiST Lives Saved Tool
LLIN Long-Lasting Insecticidal Net
M&E Monitoring and Evaluation
MDG Millennium Development Goal
MICS Multiple Indicator Cluster Survey
MIS Malaria Indicator Survey
NGO Non-Governmental Organization
PMI President's Malaria Initiative
RBM Roll Back Malaria
RDT Rapid Diagnostic Test
SP Sulfadoxine-pyrimethamine
SSA Sub-Saharan Africa
U5MR Under-five Mortality Rate
UN United Nations
UNICEF United Nations Children’s Fund
5q0 All-cause Under Five Mortality
WHO World Health Organization
Page 1
1. Introduction
1.1 Background
Malaria poses a tremendous public health problem across the globe with an estimated 3.3 billion, or 40 percent of
the world’s population, living in areas of malaria risk. Worldwide, an estimated 219 million malaria episodes and
660,000 malaria deaths occurred in 2010 [1]. While malaria is endemic within most tropical and subtropical regions
of the world, over 90 percent of all malaria deaths currently occur in sub-Saharan Africa (SSA). Young children and
pregnant women represent those at greatest risk of malaria-related morbidity and mortality, especially in areas of
stable transmission. It has recently been estimated that malaria is responsible for approximately 15 percent of all
deaths among children less than five years of age in SSA and that 86 percent of all deaths due to malaria are
among children under five [2]. Malaria also places an enormous toll on already overburdened health systems
across SSA and elsewhere.
The last 15 years have seen a resurgence of interest in malaria as a disease of major public health importance. To
coordinate the efforts of the international community, the Roll Back Malaria (RBM) partnership was launched in
1998 with the vision of a world free of malaria. Its initial goal has been to halve the number of malaria cases and
deaths by 2010, as described in the Global Malaria Action Plan (GMAP) [3]. Although this goal has not yet been
met, significant strides in malaria control efforts have reduced malaria deaths in many countries. In the Africa
Region, the estimated number of deaths per 100,000 population fell from 125 per 100,000 in 2000 to 84 per
100,000 in 2010. Eight countries in sub-Saharan Africa reported at least a 50 percent reduction in the number of
confirmed malaria or malaria admissions and deaths between 2000 and 20101 and another four showed reductions
of 25–50 percent. In all countries, the decreases are associated with intense malaria control interventions. In other
regions, the number of reported cases of confirmed malaria decreased between 2000 and 2010 by more than 50
percent in 35 of the 53 malaria-endemic countries with ongoing transmission. Downward trends of 25-50 percent
were seen in four other countries. In 2010, the European Region was on target to eliminate malaria, reporting only
176 indigenous cases [1].
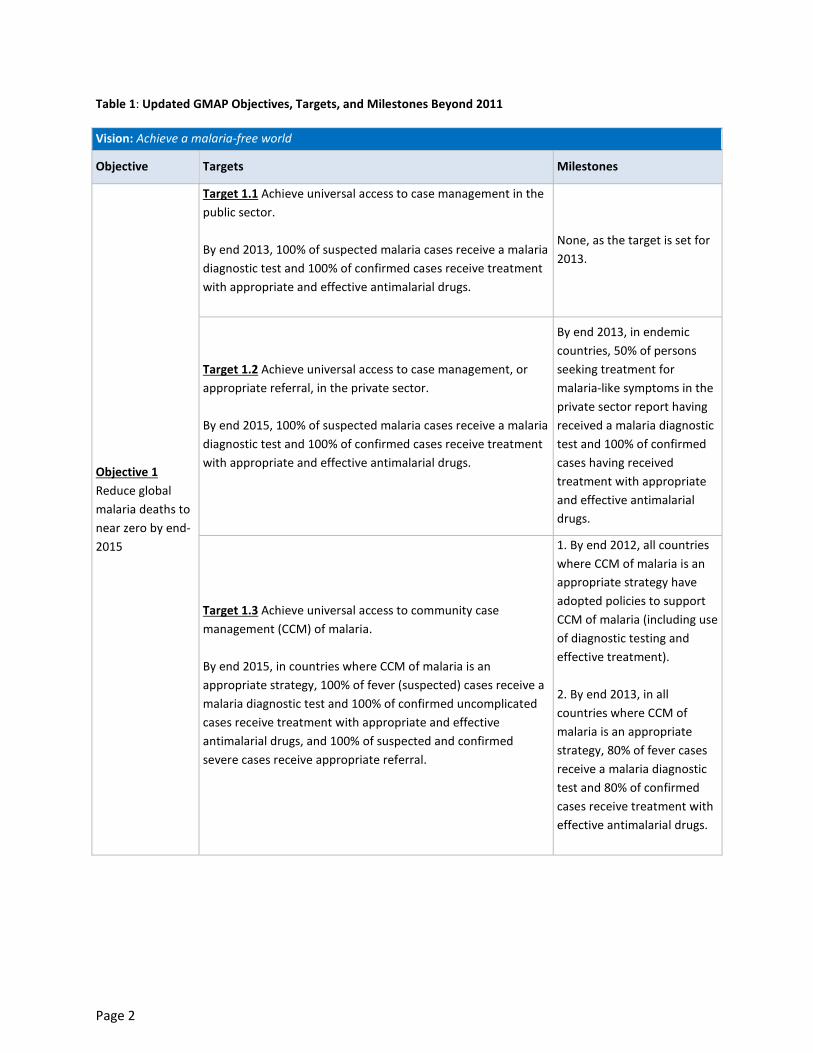
In the light of progress made by 2010, RBM updated the GMAP goals, objectives and targets in June 2011 (Table 1).
Maintaining an overall vision of a “malaria-free world” [4], the objectives are now to:
(i) reduce global malaria deaths to near zero by end-20152;
(ii) reduce global malaria cases by 75 percent from 2000 levels by end-2015; and
(iii) eliminate malaria by end-2015 in 10 new countries since 2008, including in the World Health
Organization (WHO) European Region.
These targets will be met by achieving and sustaining universal access to and utilization of preventive measures
including vector control; achieving universal access to diagnostic testing and treatment in the public and private
sectors and in the community (including appropriate referral); and accelerating the development of surveillance
systems [4].
1 Botswana, Cape Verde, Namibia, Rwanda, Sao Tome and Principe, South Africa, Swaziland, and United Republic of Tanzania (Zanzibar)
2 This differs from the target set by the World Health Assembly to reduce deaths by 75% by 2015.
Page 2
Table 1: Updated GMAP Objectives, Targets, and Milestones Beyond 2011
Vision: Achieve a malaria-free world
Objective Targets Milestones
Objective 1
Reduce global
malaria deaths to
near zero by end-
2015
Target 1.1 Achieve universal access to case management in the
public sector.
By end 2013, 100% of suspected malaria cases receive a malaria
diagnostic test and 100% of confirmed cases receive treatment
with appropriate and effective antimalarial drugs.
None, as the target is set for
2013.
Target 1.2 Achieve universal access to case management, or
appropriate referral, in the private sector.
By end 2015, 100% of suspected malaria cases receive a malaria
diagnostic test and 100% of confirmed cases receive treatment
with appropriate and effective antimalarial drugs.
By end 2013, in endemic
countries, 50% of persons
seeking treatment for
malaria-like symptoms in the
private sector report having
received a malaria diagnostic
test and 100% of confirmed
cases having received
treatment with appropriate
and effective antimalarial
drugs.
Target 1.3 Achieve universal access to community case
management (CCM) of malaria.
By end 2015, in countries where CCM of malaria is an
appropriate strategy, 100% of fever (suspected) cases receive a
malaria diagnostic test and 100% of confirmed uncomplicated
cases receive treatment with appropriate and effective
antimalarial drugs, and 100% of suspected and confirmed
severe cases receive appropriate referral.
1. By end 2012, all countries
where CCM of malaria is an
appropriate strategy have
adopted policies to support
CCM of malaria (including use
of diagnostic testing and
effective treatment).
2. By end 2013, in all
countries where CCM of
malaria is an appropriate
strategy, 80% of fever cases
receive a malaria diagnostic
test and 80% of confirmed
cases receive treatment with
effective antimalarial drugs.
Page 3
Objective 2
Reduce global
malaria cases by
75% by end 2015
(from 2000 levels)
Target 2.1 Achieve universal access to and utilization of prevention
measures.
By end 2013, in countries where universal access and utilization have
not yet been achieved, achieve 100% access to and utilization of
prevention measures for all populations at risk with locally appropriate
interventions.
None, as the target is set for
2013.
Target 2.2 Sustain universal access to and utilization of prevention
measures.
By 2015 and beyond, all countries sustain universal access to and
utilization of an appropriate package of preventive interventions.
From 2013 through 2015,
universal access to and
utilization of appropriate
preventive interventions are
maintained in all countries.
Target 2.3 Accelerate development of surveillance systems.
By end 2015, all districts are capable of reporting monthly numbers of
suspected malaria cases, number of cases receiving a diagnostic test
and number of confirmed malaria cases from all public health facilities,
or a consistent sample of them.
By end 2013, 50% of malaria
endemic countries have met the
2015 target.
Objective 3
Eliminate malaria by
end 2015 in 10 new
countries (since
2008) and in the
WHO European
Region
By end 2013, malaria is
eliminated in 3 new countries.
The updated targets not only provide direction for the design of malaria control programs but also provide a
framework for monitoring and evaluation; in particular, they influence the choice of the indicators that should be
used to monitor progress. A list of recommended indicators against each target is shown in Table 2. Indicators that
can be generated from household surveys are shown in red. In some cases, the indicators generated by household
surveys do not measure a target directly, such as parasite prevalence, but the indicator is in widespread use so it
has been placed by the most appropriate target.
Page 4
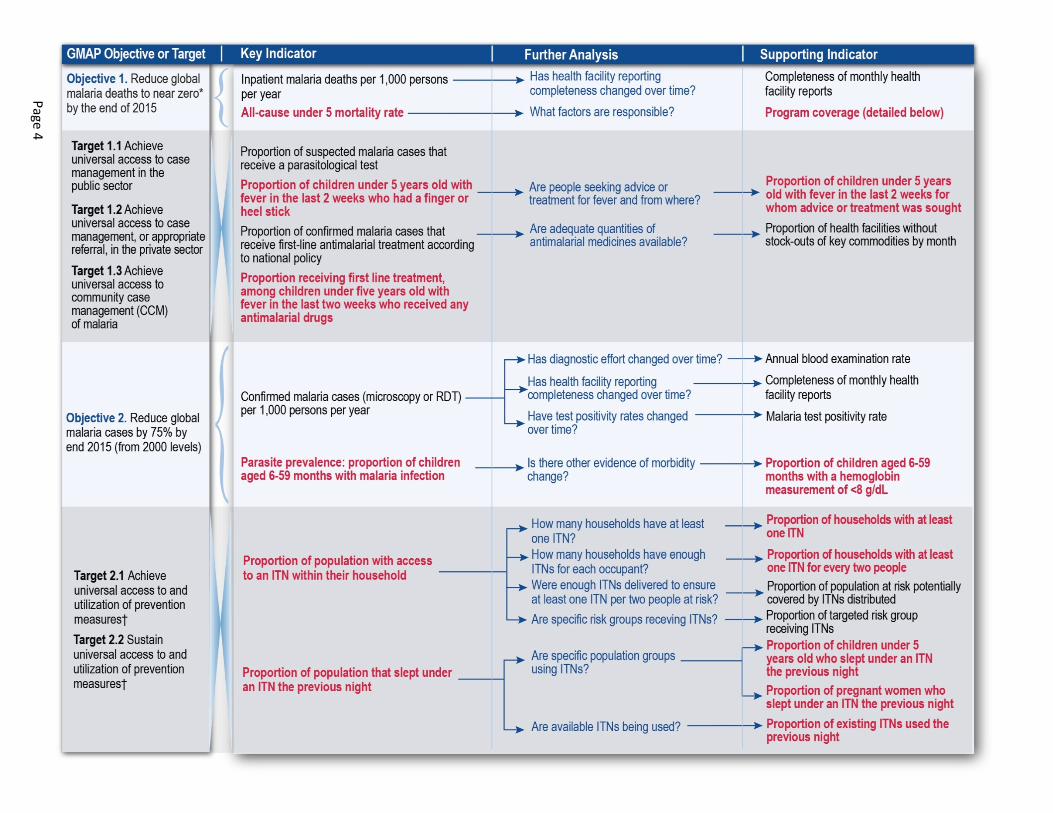
Table 2: Indicators for Measuring Progress towards GMAP Objectives and Targets
Pa
ge
4
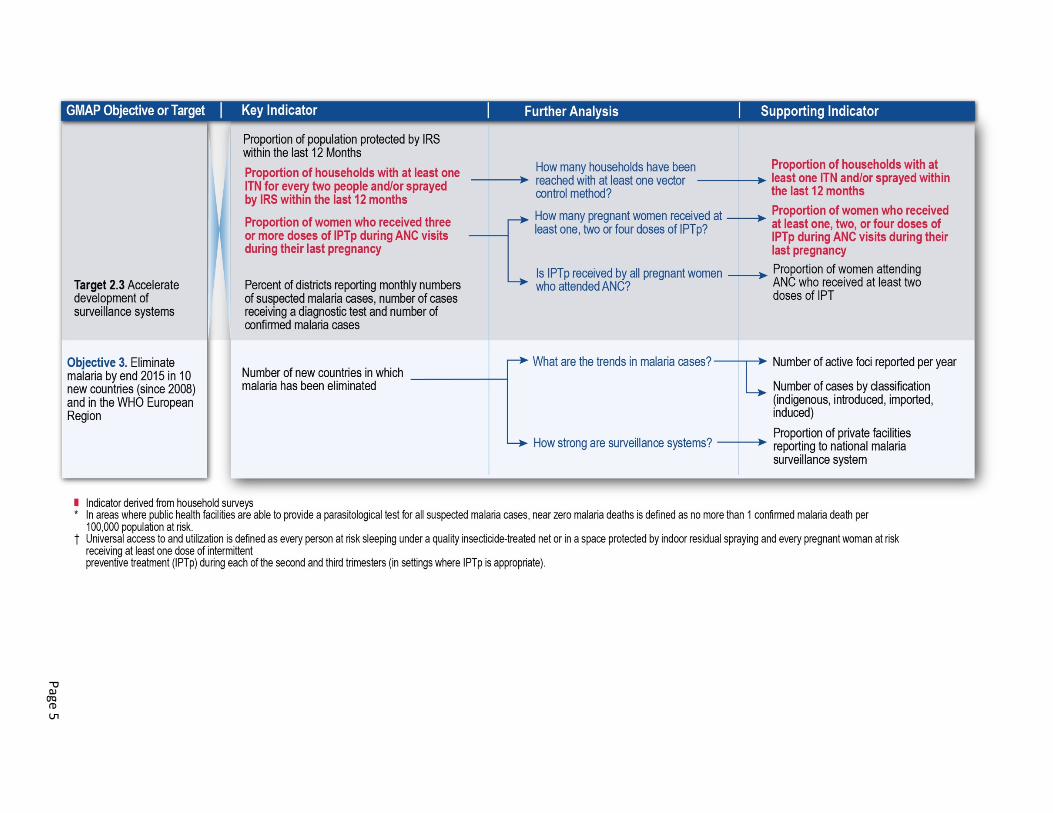
Pa
ge
5
Page 6
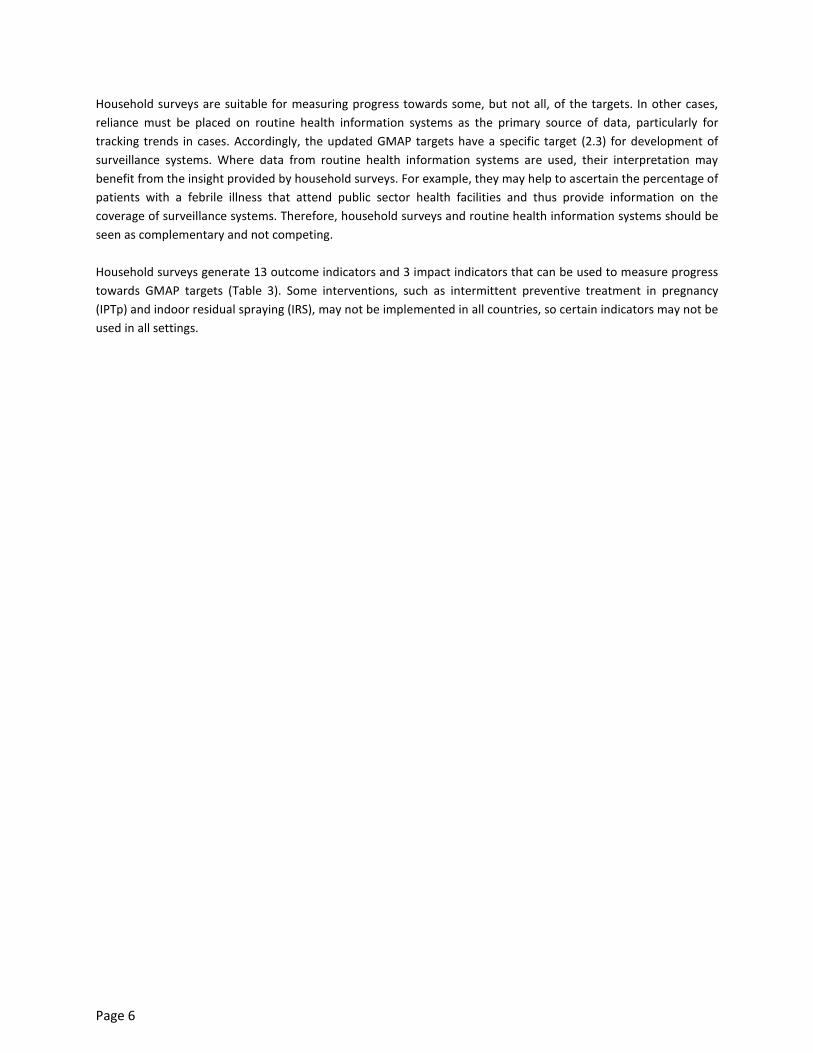
Household surveys are suitable for measuring progress towards some, but not all, of the targets. In other cases,
reliance must be placed on routine health information systems as the primary source of data, particularly for
tracking trends in cases. Accordingly, the updated GMAP targets have a specific target (2.3) for development of
surveillance systems. Where data from routine health information systems are used, their interpretation may
benefit from the insight provided by household surveys. For example, they may help to ascertain the percentage of
patients with a febrile illness that attend public sector health facilities and thus provide information on the
coverage of surveillance systems. Therefore, household surveys and routine health information systems should be
seen as complementary and not competing.
Household surveys generate 13 outcome indicators and 3 impact indicators that can be used to measure progress
towards GMAP targets (Table 3). Some interventions, such as intermittent preventive treatment in pregnancy
(IPTp) and indoor residual spraying (IRS), may not be implemented in all countries, so certain indicators may not be
used in all settings.
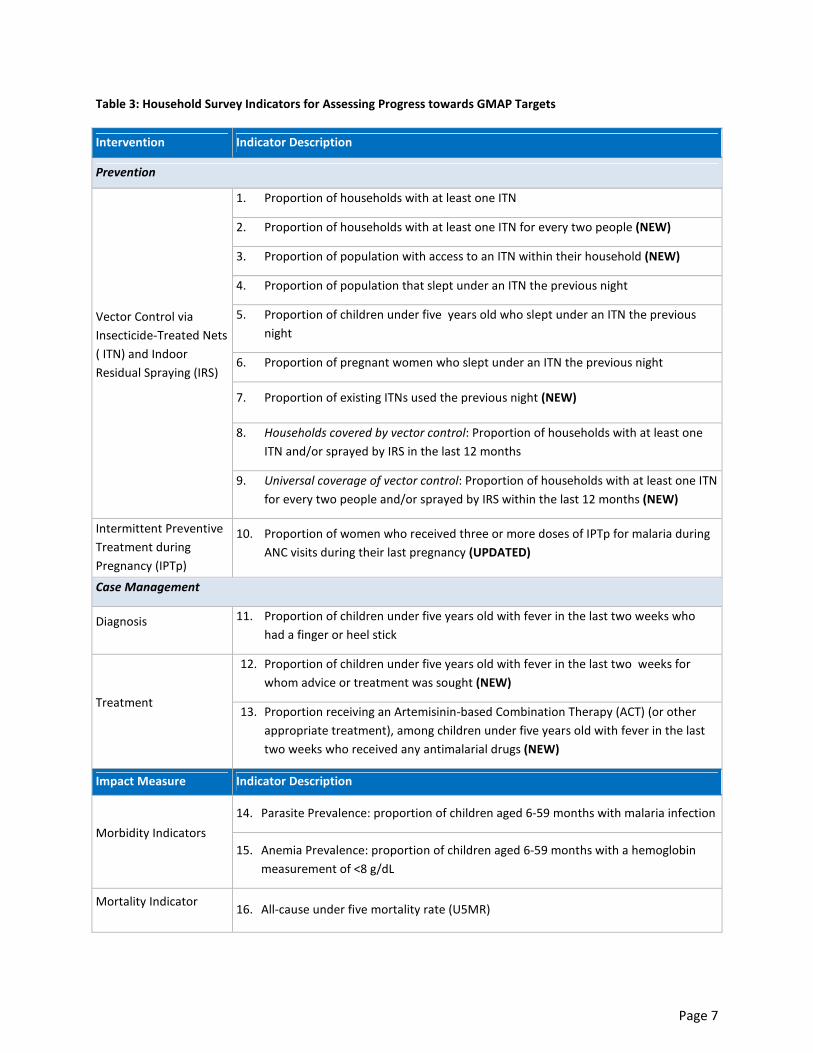
Page 7
Table 3: Household Survey Indicators for Assessing Progress towards GMAP Targets
Intervention Indicator Description
Prevention
Vector Control via
Insecticide-Treated Nets
( ITN) and Indoor
Residual Spraying (IRS)
1. Proportion of households with at least one ITN
2. Proportion of households with at least one ITN for every two people (NEW)
3. Proportion of population with access to an ITN within their household (NEW)
4. Proportion of population that slept under an ITN the previous night
5. Proportion of children under five years old who slept under an ITN the previous
night
6. Proportion of pregnant women who slept under an ITN the previous night
7. Proportion of existing ITNs used the previous night (NEW)
8. Households covered by vector control: Proportion of households with at least one
ITN and/or sprayed by IRS in the last 12 months
9. Universal coverage of vector control: Proportion of households with at least one ITN
for every two people and/or sprayed by IRS within the last 12 months (NEW)
Intermittent Preventive
Treatment during
Pregnancy (IPTp)
10. Proportion of women who received three or more doses of IPTp for malaria during
ANC visits during their last pregnancy (UPDATED)
Case Management
Diagnosis 11. Proportion of children under five years old with fever in the last two weeks who
had a finger or heel stick
Treatment
12. Proportion of children under five years old with fever in the last two weeks for
whom advice or treatment was sought (NEW)
13. Proportion receiving an Artemisinin-based Combination Therapy (ACT) (or other
appropriate treatment), among children under five years old with fever in the last
two weeks who received any antimalarial drugs (NEW)
Impact Measure Indicator Description
Morbidity Indicators
14. Parasite Prevalence: proportion of children aged 6-59 months with malaria infection
15. Anemia Prevalence: proportion of children aged 6-59 months with a hemoglobin
measurement of <8 g/dL
Mortality Indicator 16. All-cause under five mortality rate (U5MR)

Page 8
1.2 Purpose and Content of Manual
The purpose of this manual is to provide detailed specifications for the indicators that can be measured through
household surveys and the data that is required for their construction, as well as the issues related to their
interpretation. Details of the data collection methods required for estimating these indicators through national-
level household surveys are also provided. This manual is intended to maximize internal consistency and
comparability of the indicators and the types of data collection methods used across countries and over time.
It should be noted that the indicators and measurement tools described in this guide were developed in the
context of the high malaria burden countries of Africa. While children under five and pregnant women are most at
risk for malaria in these settings, programs are attempting to attain universal coverage and utilization of vector
control interventions across all age groups. Monitoring and evaluation efforts will reflect this program emphasis. In
other settings, such as Southeast Asia and Latin America, where the distribution of malaria is more focal, a more
targeted approach to monitoring and evaluation may be necessary and large, nationally representative surveys to
measure coverage may be less useful or may be conducted less frequently. Likewise, the indicators to measure ITN
use or IPTp may not reflect the preventive strategies used in some settings. This guide focuses on indicators for
monitoring progress in Africa and other high transmission settings because of the critical need to track the scale up
of key interventions and provide evidence of their impact in areas with the highest disease burden and greatest
investment in malaria control.
Due to increased funding in the past few years, malaria control efforts have expanded rapidly, and interventions
have evolved with the changing funding climate. Technical strategies for the control and prevention of malaria
have also evolved according to new evidence from the field and changes in technical recommendations and
strategic targets. For example, WHO recommended in 2009 that all suspected cases of malaria should receive a
diagnostic test [5] and, in 2012, updated its recommendation regarding IPTp [6]. Given these changes, this manual
has been reviewed and revised substantially from the version published in 2009. The principal changes are
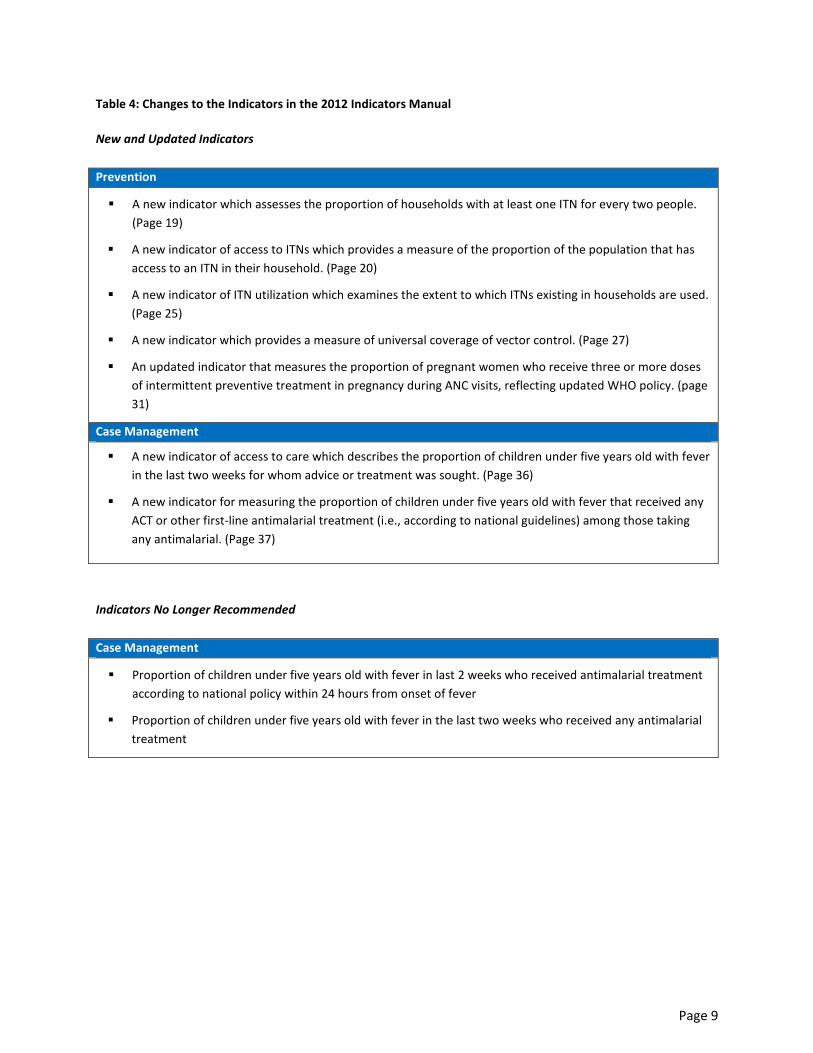
summarized in Table 4.
This manual begins with a brief discussion of the basic principles of monitoring and evaluation. It then discusses
the different types of household surveys commonly used in monitoring and evaluation of malaria programs. Issues
related to measurement, as well as interpretation of indicators from household surveys, are then discussed. The
manual concludes with detailed guidelines for constructing each indicator; outcome indicators are organized by
intervention and are followed by impact indicators. A brief explanation of each intervention is provided. Indicators
that are no longer recommended for use are presented in Section 3.3 (33), as well as in Annex 1.
Page 9
Table 4: Changes to the Indicators in the 2012 Indicators Manual
New and Updated Indicators
Prevention
� A new indicator which assesses the proportion of households with at least one ITN for every two people.
(Page 19)
� A new indicator of access to ITNs which provides a measure of the proportion of the population that has
access to an ITN in their household. (Page 20)
� A new indicator of ITN utilization which examines the extent to which ITNs existing in households are used.
(Page 25)
� A new indicator which provides a measure of universal coverage of vector control. (Page 27)
� An updated indicator that measures the proportion of pregnant women who receive three or more doses
of intermittent preventive treatment in pregnancy during ANC visits, reflecting updated WHO policy. (page
31)
Case Management
� A new indicator of access to care which describes the proportion of children under five years old with fever
in the last two weeks for whom advice or treatment was sought. (Page 36)
� A new indicator for measuring the proportion of children under five years old with fever that received any
ACT or other first-line antimalarial treatment (i.e., according to national guidelines) among those taking
any antimalarial. (Page 37)
Indicators No Longer Recommended
Case Management
� Proportion of children under five years old with fever in last 2 weeks who received antimalarial treatment
according to national policy within 24 hours from onset of fever
� Proportion of children under five years old with fever in the last two weeks who received any antimalarial
treatment
Page 10
2. Monitoring and Evaluation
2.1 Principles of Monitoring and Evaluation
Monitoring is a continuous process of gathering and using data on program implementation with the aim of
ensuring programs are proceeding satisfactorily or making adjustments, if necessary. It often uses administrative
data and tracks inputs, processes and outputs, although it can also consider program outcomes and impacts.
Evaluation is a more comprehensive assessment of a program, which is normally undertaken at discrete points in
time and focuses on the longer term outcomes and impacts of programs. The overall goal of M&E is to improve
program efficiency, effectiveness and equity. M&E may be focused on local initiatives as well as measuring
program effectiveness at the national and regional levels. Ideally, M&E tools can be used to demonstrate to
planners and other decision-makers that program efforts have had measurable impacts on the outcomes of
interest. M&E can also provide insight as to where resources are being used most efficiently versus where new
strategies should be considered.
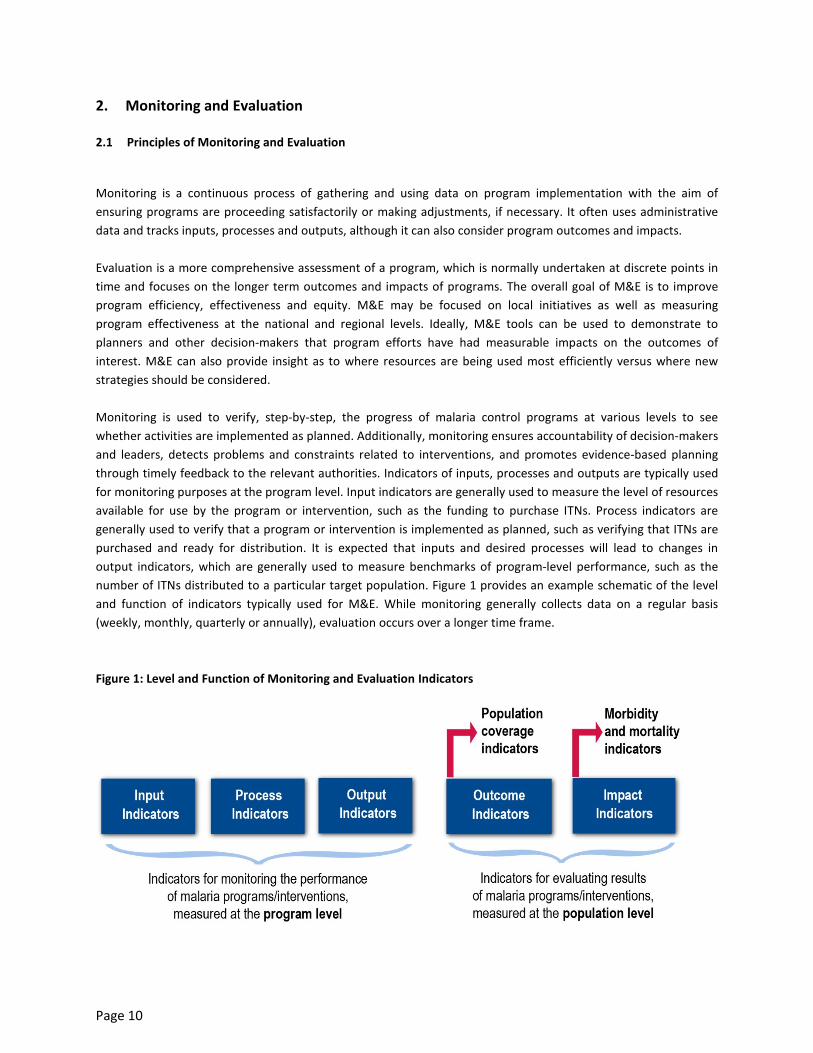
Monitoring is used to verify, step-by-step, the progress of malaria control programs at various levels to see
whether activities are implemented as planned. Additionally, monitoring ensures accountability of decision-makers
and leaders, detects problems and constraints related to interventions, and promotes evidence-based planning
through timely feedback to the relevant authorities. Indicators of inputs, processes and outputs are typically used
for monitoring purposes at the program level. Input indicators are generally used to measure the level of resources
available for use by the program or intervention, such as the funding to purchase ITNs. Process indicators are
generally used to verify that a program or intervention is implemented as planned, such as verifying that ITNs are
purchased and ready for distribution. It is expected that inputs and desired processes will lead to changes in
output indicators, which are generally used to measure benchmarks of program-level performance, such as the
number of ITNs distributed to a particular target population. Figure 1 provides an example schematic of the level
and function of indicators typically used for M&E. While monitoring generally collects data on a regular basis
(weekly, monthly, quarterly or annually), evaluation occurs over a longer time frame.
Figure 1: Level and Function of Monitoring and Evaluation Indicators
Page 11
While monitoring is a continuous process that serves to inform programmatic decision-making, evaluation is
undertaken at discrete points of time, typically every few years. Evaluation may assess whether activities have
been undertaken as planned (normative evaluation) or may seek to determine whether changes in results are
attributable to a particular malaria control program, as measured through outcome and impact indicators. Such
evaluation is known as impact evaluation. Impact evaluation involves measuring changes in impact level indicators,
such as morbidity and mortality, and empirically linking the observed change with a specific program or
intervention. This type of evaluation requires rigorous experimental design to make a causal association between
program inputs and resulting impacts. In the field of public health, where programs operate in the context of
existing communities and not in controlled trial settings, evaluators must use observational evidence to make
inferences about causality. Difficulties in measuring malaria-specific morbidity and mortality consistently over time
present further challenges to conducting impact evaluations.
For these reasons, emphasis is often placed on measuring changes in indicators at the outcome level, such as the
level of ITN utilization among a particular target population that can be attributed to a program. There is
substantial empirical evidence to support the efficacy of current technical strategies in different programmatic
contexts. Hence, it is expected that increasing coverage of these key interventions will result in the desired
reductions in morbidity and mortality. It is, therefore, crucial that countries implementing these interventions have
clear definitions and appropriate tools for measuring the outcome indicators for population-level coverage as part
of their overall monitoring and evaluation strategy.
This guide provides basic information for measuring a selection of impact indicators, in order to allow countries to
assess whether scale-up of the key interventions has resulted in the intended impact at the population level over
the longer term. Assessing key interventions at the population level through population-based surveys can be very
useful in making comparisons over time within and across countries.
2.2 Household Surveys
Nationally representative, population-based household surveys are a principal measurement tool to collect data
for measuring outcome and impact indicators. These surveys complement routine data collection carried out by
national governments and national malaria control programs (NMCP). Three large survey efforts that currently
collect data on malaria are the Demographic and Health Survey (DHS), the Multiple Indicator Cluster Survey (MICS)
and the Malaria Indicator Survey (MIS).
Demographic and Health Surveys: DHS surveys are nationally representative, population-based household surveys
that are routinely undertaken every four to five years to collect data on a wide variety of demographic and health
indicators. Since the inception of DHS in 1985, more than 275 DHS surveys have been conducted in more than 90
countries. DHS surveys are designed to produce data that are comparable over time and across countries. DHS
surveys include a household listing to ascertain the age, sex and relationship to the head of household for all
individuals within selected households. The surveys are typically designed to provide relatively precise population-
level estimates by age groups, sex, urban/rural residence and regions. DHS surveys include malaria-related
questions that are required for the calculation of the indicators in this manual. Published reports, questionnaires
and materials related to DHS surveys can be found online at http://www.measuredhs.com.
Multiple Indicator Cluster Surveys: MICS surveys are nationally representative, population-based household
surveys developed by the United Nations Children’s Fund (UNICEF) to support countries in filling critical data gaps
for monitoring the situation of children and women. Initially designed to collect indicators marking progress
Page 12
towards the World Summit for Children goals, MICS surveys have been an important component of national data
collection in many countries. MICS surveys are currently conducted in rounds approximately every three years, and
since its inception in 1995, 240 surveys have been conducted in approximately 100 countries worldwide. MICS
surveys are designed to produce data that are comparable over time and across countries and are harmonized
with data collected through other major household survey programs, such as DHS and MIS. The MICS survey
package includes a module for malaria that allows the collection of necessary data for the construction of the
indicators in this manual. However, a full net roster and ITN use among pregnant women were not included prior
to Round 4 (2009-2011) of the MICS surveys. Published reports, questionnaires and datasets related to the MICS
surveys can be found online at http://www.childinfo.org.
Malaria Indicator Surveys (MIS): In addition to the ongoing survey efforts of DHS and MICS, RBM partners have
developed a standard MIS package for assessing the key household coverage indicators and morbidity indicators.
This includes a core questionnaire and data tabulation plan, as well as related materials for organizing and
conducting fieldwork. This stand-alone survey is designed to be implemented in a similar manner to the DHS
surveys, producing nationally representative, population-based data from which most indicators in this manual can
be constructed. The MIS surveys also produce a wide range of data for in-depth assessment of the malaria
situation within countries. At the time of this publication, more than 25 national MIS surveys have been
completed. Information about these surveys can be found online at http://www.malariasurveys.org. The MIS
survey questionnaire and other related materials can be found online at
http://www.rbm.who.int/toolbox/tool_MISToolkit.html.
It is recommended that the indicators described in this document be measured using either the DHS or MICS
surveys because of their sampling design rigor and reliability over time and across countries. Furthermore, a
comprehensive package of demographic and health data is collected during both of these surveys, which allows
additional analyses to be conducted. However, these surveys are only implemented every three to five years. If
immediate data collection is required that does not fit within the implementation schedule of either the DHS or
MICS surveys for a particular country, it is recommended that the MIS survey be used to obtain the necessary data
for measuring the indicators. This will ensure their comparability with the DHS and MICS surveys over time and
across countries, subject to considerations of the seasonality of malaria transmission discussed in Section 2.4.
2.3 Sampling
To ensure that indicators and their accompanying standard errors can be measured accurately, it is recommended
that sampling procedures follow similar methods to those used by the DHS, MICS or MIS surveys. Such procedures
typically entail a two-stage cluster sampling design with primary sampling units selected with probability
proportional to size. Additionally, these samples are typically stratified by region, and by urban/rural residence, as
stipulated by survey objectives. For further details of this general type of sampling method, please refer to the
sampling guidelines for the DHS, MICS or MIS surveys.
To remain consistent with global targets, the coverage indicators are intended to be measured among the
population “at risk for malaria,” which in some instances may create complications for survey design.
Both the DHS and MICS surveys typically include all primary sampling units for an entire country in their sampling
frames to ensure nationally representative estimates. In countries with endemic or epidemic-prone malaria
throughout, it is indeed appropriate to include all primary sampling units within the country in the sampling frame,
given that pre-stratification by urban and rural residence is also undertaken. However, if a DHS or MICS survey is
Page 13
used to measure the indicators in countries with defined areas without endemic or epidemic-prone malaria, such
as those with mountainous areas or deserts, it should be noted that national estimates will include populations not
at risk for malaria. This will need to be taken into account when interpreting the values of national-level indicators
for some countries. Please refer to the MIS Sampling Guidelines for a more detailed description of how best to
construct a sampling frame for countries with widely varying levels of malaria endemicity. It is available at
http://www.rbm.who.int/toolbox/tool_MISToolkit.html.
2.4 Interpretation
There are two particular issues that can affect the interpretation of results obtained from household surveys.
Malaria Endemicity
The first issue that may affect the interpretation of the values of indicators involves the definition of the target
population. As stated previously, the RBM targets stipulate that the coverage indicators are intended to be
measured among the target population defined as those at risk for malaria. For countries in which malaria is
endemic or epidemic-prone throughout, this issue should not be of particular concern as long as stratification by
urban and rural residence is undertaken, as is typically the case with the DHS, MICS and MIS surveys. However,
within countries that contain large populations in areas absent of malaria, such as those with mountainous areas
or deserts, national-level estimates, such as those obtained from the DHS and MICS surveys, will likely result in an
underestimate of coverage for those at risk for malaria. In such a situation, it may be advisable to collect additional
information that can establish whether an enumeration area is within or outside a malaria risk area; then, during
data analysis one can limit the analysis to survey domains that are deemed to be malarious.
Despite the difficulties associated with varying levels of endemicity, progress in malaria intervention coverage is
generally monitored at the national level in high-burden countries in Africa, rather than among sub-national at-risk
populations. There are many important reasons for relying on national-level estimates of malaria intervention
coverage. For many countries, it is difficult to accurately define at-risk areas and subsequently to identify
households surveyed within those areas since surveys do not always geo-code the households or villages where
survey interviews occur [7] or the geo-codes are randomly offset to protect confidentiality. Additionally, the at-risk
population will continue to change, and therefore it would be difficult to measure progress with the indicators
proposed. Finally, if a strategy is being implemented in an effort to achieve elimination, high coverage levels must
be sustained at the national level in order to continue to control malaria and prevent against future resurgence.
Consequently, indicator estimates obtained from DHS and MICS surveys will not be expected to correspond
specifically to malaria endemic areas, but will be nationally-representative, even in those countries with non-
malarious regions. The MIS guidelines should be consulted in order to incorporate an appropriate subsampling
design in countries which include non-malarious regions.
Seasonality
A second consideration that affects the interpretation of the survey findings is the timing of survey
implementation relative to the malaria transmission season (rainy and early post-rainy seasons). Generally
speaking, MIS surveys are conducted during and immediately after the rainy season and should end no later than
four to six weeks after the rains end, as this timeframe is associated with peak transmission. However, for

Page 14
operational reasons, both DHS and MICS surveys are typically conducted during the dry season and therefore
outside of the peak malaria transmission period. As intervention coverage or usage levels may differ significantly
between seasons, and malaria morbidity and mortality will differ by season, interpretation of the data obtained
must take into account the seasonality of the survey period. It is also important to note that parasite prevalence
data from surveys conducted outside of peak transmission periods is not a reliable indicator of peak transmission;
therefore, biomarker measurement is recommended only during the malaria transmission season. Further analysis
of these data is needed to better understand the extent of the relationship between survey timing and
intervention coverage. Notes on significant assumptions and potential biases associated with specific indicators are
provided separately in Section 4, under the description of each indicator.
Page 15
3. Guidelines for Constructing Indicators from Household Surveys
3.1 Prevention Using Insecticide-treated Nets and Indoor Residual Spraying
At full coverage under trial conditions, ITNs have been shown to reduce all-cause child mortality by 17 percent in
sub-Saharan Africa and uncomplicated malaria cases among children under five by 50 percent across a range of
malaria transmission settings [8]. ITNs also appear to display similar effectiveness under field conditions [9]. Efforts
to scale up coverage of ITNs to reach universal utilization among the population at risk of malaria are underway in
most African countries [1].
There are two categories of ITNs: conventionally-treated nets and long-lasting insecticidal nets (LLIN).
Conventionally treated nets are mosquito nets that have been soaked with an insecticide within the past 12
months. An LLIN is a factory-treated net that does not require any treatment. It is designed to maintain efficacy
against mosquito vectors for at least three years. Since 2007, WHO has recommended that malaria control
programs and their partners procure only LLINs [10]. For the purpose of these guidelines, LLINs and conventionally-
treated nets are included in the category of ITNs. Past editions of this guidance noted that pretreated nets were
also commonly included in data collection as a separate type of net and could be considered either an ITN or
not, depending on date of purchase and timing of last insecticide retreatment. As pretreated nets are rarely
distributed anymore, this category has been removed from the current version of these guidelines and the core
MIS questionnaire. However, in countries where these nets are still available, this category of nets should be
included in the MIS questionnaire for the purpose of calculation of indicators. While untreated nets can still
sometimes be found in markets in a few countries, they are not considered part of a formal malaria prevention
strategy.
Since 2007, WHO has recommended that ITNs be made available to all people at risk, regardless of age, i.e.,
universal access [10]. In assessing universal access, it is assumed that two people can sleep under one ITN. Given
the new focus on achieving universal access to and utilization of ITNs, the following three new indicators have
been recommended:
� Proportion of households with at least one ITN for every two people
� Proportion of population with access to an ITN in their household
� Proportion of population who slept under an ITN the previous night
IRS is the organized, timely spraying of an insecticide on the inside walls of houses or dwellings. It is designed to
interrupt malaria transmission by killing adult female mosquitoes that enter houses and rest on walls after feeding
but before they transmit the infection to another person [11]. IRS has been shown to be effective in reducing
vectorial capacity and malarial disease in a wide variety of settings; it is particularly effective in locations where
mosquitoes are indoor-resting and malaria is seasonally transmitted [12]. IRS is often conducted in smaller
communities rather than entire districts or cities.
A new indicator is included to measure universal coverage of vector control. By including ITN and IRS interventions
in a single indicator, one can assess universal coverage of preventive control measures within a country, or
conversely, the percentage of the population not fully covered by either strategy.
� Proportion of households with at least one ITN for every two people and/or sprayed by IRS within the last
12 months
Page 16
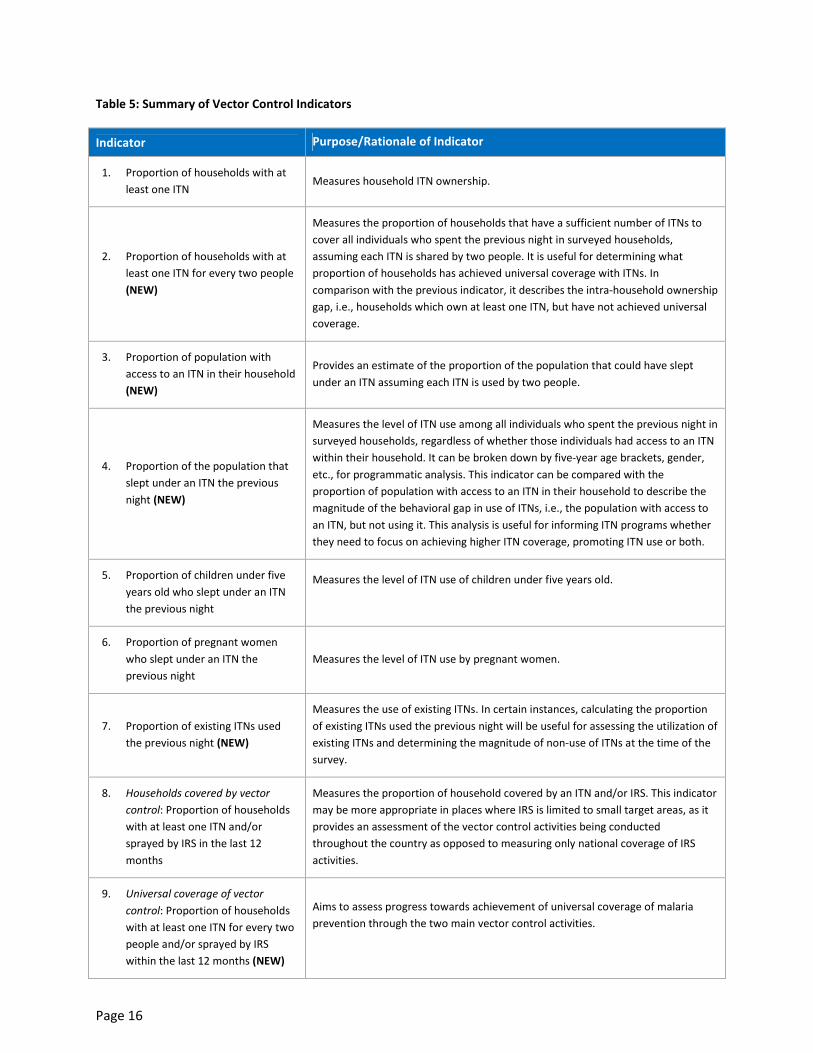
Table 5: Summary of Vector Control Indicators
Indicator Purpose/Rationale of Indicator
1. Proportion of households with at
least one ITN Measures household ITN ownership.
2. Proportion of households with at
least one ITN for every two people
(NEW)
Measures the proportion of households that have a sufficient number of ITNs to
cover all individuals who spent the previous night in surveyed households,
assuming each ITN is shared by two people. It is useful for determining what
proportion of households has achieved universal coverage with ITNs. In
comparison with the previous indicator, it describes the intra-household ownership
gap, i.e., households which own at least one ITN, but have not achieved universal
coverage.
3. Proportion of population with
access to an ITN in their household
(NEW)
Provides an estimate of the proportion of the population that could have slept
under an ITN assuming each ITN is used by two people.
4. Proportion of the population that
slept under an ITN the previous
night (NEW)
Measures the level of ITN use among all individuals who spent the previous night in
surveyed households, regardless of whether those individuals had access to an ITN
within their household. It can be broken down by five-year age brackets, gender,
etc., for programmatic analysis. This indicator can be compared with the
proportion of population with access to an ITN in their household to describe the
magnitude of the behavioral gap in use of ITNs, i.e., the population with access to
an ITN, but not using it. This analysis is useful for informing ITN programs whether
they need to focus on achieving higher ITN coverage, promoting ITN use or both.
5. Proportion of children under five
years old who slept under an ITN
the previous night
Measures the level of ITN use of children under five years old.
6. Proportion of pregnant women
who slept under an ITN the
previous night
Measures the level of ITN use by pregnant women.
7. Proportion of existing ITNs used
the previous night (NEW)
Measures the use of existing ITNs. In certain instances, calculating the proportion
of existing ITNs used the previous night will be useful for assessing the utilization of
existing ITNs and determining the magnitude of non-use of ITNs at the time of the
survey.
8. Households covered by vector
control: Proportion of households
with at least one ITN and/or
sprayed by IRS in the last 12
months
Measures the proportion of household covered by an ITN and/or IRS. This indicator
may be more appropriate in places where IRS is limited to small target areas, as it
provides an assessment of the vector control activities being conducted
throughout the country as opposed to measuring only national coverage of IRS
activities.
9. Universal coverage of vector
control: Proportion of households
with at least one ITN for every two
people and/or sprayed by IRS
within the last 12 months (NEW)
Aims to assess progress towards achievement of universal coverage of malaria
prevention through the two main vector control activities.
Page 17
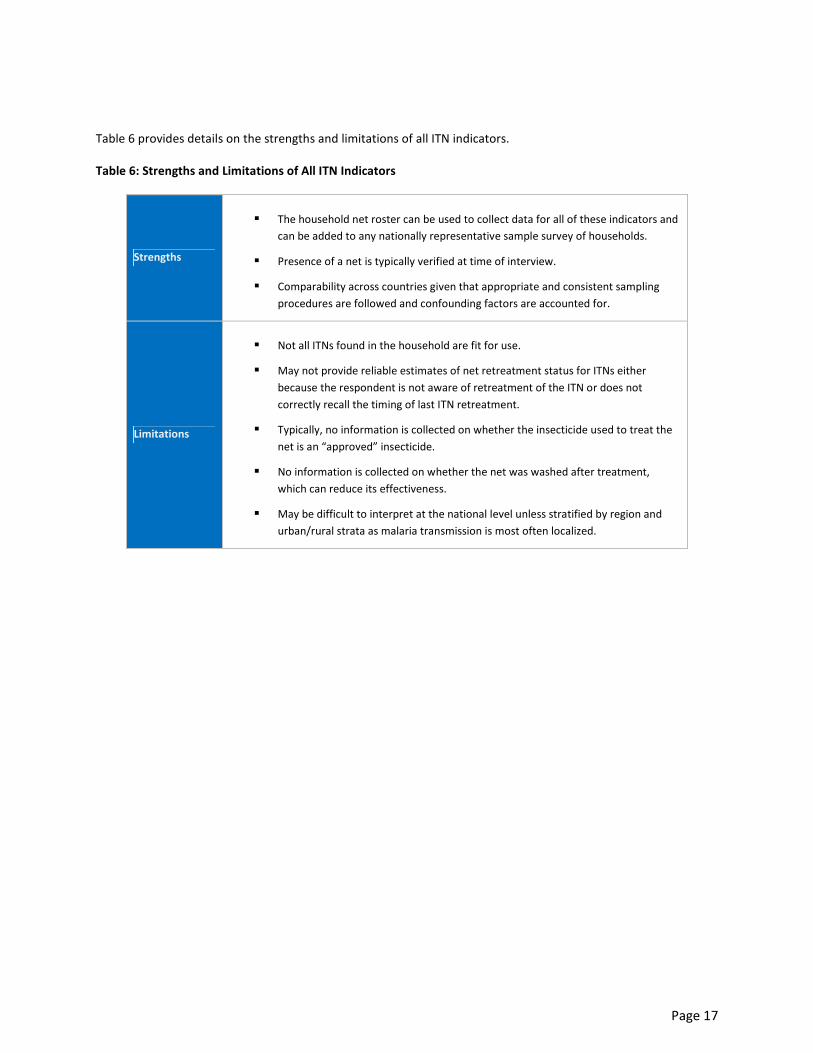
Table 6 provides details on the strengths and limitations of all ITN indicators.
Table 6: Strengths and Limitations of All ITN Indicators
Strengths
� The household net roster can be used to collect data for all of these indicators and
can be added to any nationally representative sample survey of households.
� Presence of a net is typically verified at time of interview.
� Comparability across countries given that appropriate and consistent sampling
procedures are followed and confounding factors are accounted for.
Limitations
� Not all ITNs found in the household are fit for use.
� May not provide reliable estimates of net retreatment status for ITNs either
because the respondent is not aware of retreatment of the ITN or does not
correctly recall the timing of last ITN retreatment.
� Typically, no information is collected on whether the insecticide used to treat the
net is an “approved” insecticide.
� No information is collected on whether the net was washed after treatment,
which can reduce its effectiveness.
� May be difficult to interpret at the national level unless stratified by region and
urban/rural strata as malaria transmission is most often localized.
Page 18
1. Proportion of Households with at Least One ITN3
� Numerator: Number of households surveyed with at least one ITN
� Denominator: Total number of households surveyed
Purpose/Rationale
This indicator measures household ITN ownership.
Method of Measurement
The numerator for this indicator is obtained from asking the household respondent if there is any mosquito net in
the house that can be used while sleeping and from determining whether each net found in a household is a
factory-treated net that does not require any treatment (an LLIN) or a net that has been soaked with insecticide
within the past 12 months. The denominator is the total number of surveyed households.
Interpretation
This indicator provides a measure for household ownership of an ITN. It reflects the extent to which ITN programs
have reached all households or, conversely, the proportion of households not yet reached.
3 An ITN is 1) a factory-treated net that does not require any treatment (an LLIN) or 2) a net that has been soaked with insecticide within the
past 12 months (see Reference Section 3.1 for explanation of the revised definition).
Page 19
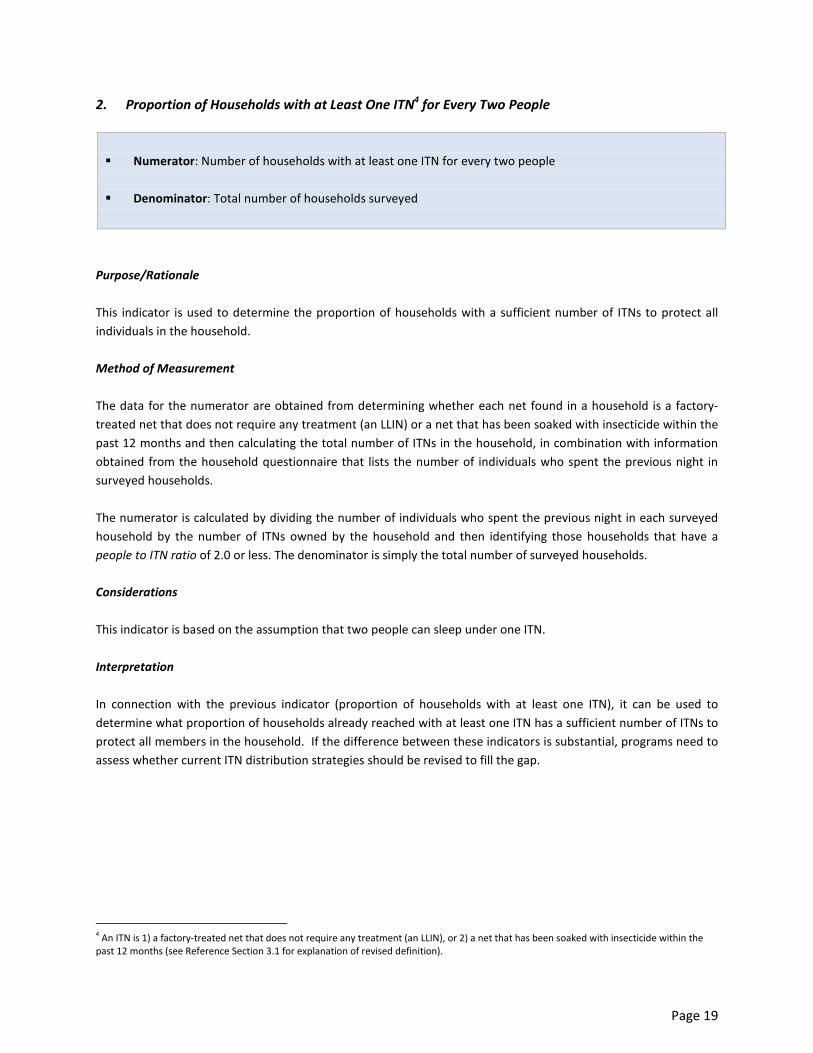
2. Proportion of Households with at Least One ITN4 for Every Two People
� Numerator: Number of households with at least one ITN for every two people
� Denominator: Total number of households surveyed
Purpose/Rationale
This indicator is used to determine the proportion of households with a sufficient number of ITNs to protect all
individuals in the household.
Method of Measurement
The data for the numerator are obtained from determining whether each net found in a household is a factory-
treated net that does not require any treatment (an LLIN) or a net that has been soaked with insecticide within the
past 12 months and then calculating the total number of ITNs in the household, in combination with information
obtained from the household questionnaire that lists the number of individuals who spent the previous night in
surveyed households.
The numerator is calculated by dividing the number of individuals who spent the previous night in each surveyed
household by the number of ITNs owned by the household and then identifying those households that have a
people to ITN ratio of 2.0 or less. The denominator is simply the total number of surveyed households.
Considerations
This indicator is based on the assumption that two people can sleep under one ITN.
Interpretation
In connection with the previous indicator (proportion of households with at least one ITN), it can be used to
determine what proportion of households already reached with at least one ITN has a sufficient number of ITNs to
protect all members in the household. If the difference between these indicators is substantial, programs need to
assess whether current ITN distribution strategies should be revised to fill the gap.
4 An ITN is 1) a factory-treated net that does not require any treatment (an LLIN), or 2) a net that has been soaked with insecticide within the
past 12 months (see Reference Section 3.1 for explanation of revised definition).
Page 20
3. Proportion of Population with Access to an ITN5 within their Household
� Numerator: Total number of individuals who could sleep under an ITN if each ITN in the household is used
by two people
� Denominator: Total number of individuals who spent the previous night in surveyed households
Purpose/Rationale
This indicator estimates the proportion of the population that could potentially be covered by existing ITNs,
assuming that each ITN in a household can be used by two people within that household. It can be compared with
Indicator 4, which measures the proportion of population who slept under an ITN the previous night, to assess the
extent to which available ITNs are used (i.e., the population with access to an ITN, but not using it). This analysis is
useful for informing ITN programs whether they need to focus on achieving higher ITN coverage, promoting ITN
use or both.
Method of Measurement
The data for the numerator are obtained from determining whether each net found in a household is a factory-
treated net that does not require any treatment (an LLIN) or a net that has been soaked with insecticide within the
past 12 months and then calculating the total number of ITNs in the household.
The data for the denominator are obtained from the household questionnaire that lists all individuals who spent
the previous night in surveyed households.
The calculation needs an intermediate variable which is “potential users.” It can be calculated by multiplying the
number of ITNs in each household by two. In households which have more than one ITN for every two people, the
product of this calculation will be greater than the number of individuals who spent the previous night. In this case,
the “potential users” variable in that household should be modified to reflect the number of individuals who spent
the previous night in the household because the number of potential users in a household cannot exceed the
number of individuals who spent the previous night in that household. For example, in a household with ten
people and four ITNs, there are eight potential users; however, in a household with five people and four ITNs,
there are five potential users even though the number of ITNs available could cover more than five people.
The indicator can then be calculated by dividing the sum of all potential ITN users in the sample by the total
number of individuals who spent the previous night in surveyed households. An example of the Stata® and code
used to calculate this indicator is provided in Annex 2.
5 An ITN is 1) a factory-treated net that does not require any treatment (an LLIN), or 2) a net that has been soaked with insecticide within the
past 12 months (see Reference Section 3.1 for explanation of revised definition).
Page 21
Considerations
This indicator is based on the assumption that two people can sleep under one ITN. For example, a household with
six residents will require three ITNs. It excludes surplus ITNs in households which have more than one ITN for every
two people.
Interpretation
This indicator provides an estimate of the proportion of the total population that could have slept under an ITN.
This indicator can be compared with the proportion of the population sleeping under an ITN the previous night
(Indicator 4). If the difference between these indicators is substantial, the program may need to focus on
identifying the main drivers or barriers to ITN use in order to design an appropriate intervention for behavior
change.
Page 22
4. Proportion of Population that Slept under an ITN6 the Previous Night
� Numerator: Number of individuals who slept under an ITN the previous night
� Denominator: Total number of individuals who spent the previous night in surveyed households
Purpose/Rationale
This indicator measures the level of ITN use of all age groups at the time of the survey. It is useful to track usage
among all ages since coverage of entire populations will be required to accomplish large reductions of malaria
burden.
Method of Measurement
The data for the denominator are obtained from the household questionnaire that lists all individuals who stayed
in the household the previous night. The data for the numerator are then obtained from a listing of the same
individuals in the house who slept under a mosquito net the previous night, in combination with information on
whether it is a factory-treated net that does not require any treatment (an LLIN) or a net that has been soaked
with insecticide within the past 12 months.
Considerations
This indicator may be biased by the seasonality of survey data collection, since survey fieldwork for DHS and MICS
is most often done during the dry season when net use is likely at its lowest.
Interpretation
This indicator provides a direct measure of ITN use by all age groups at the time of the survey. It includes all
individuals who spent the previous night in surveyed households, including visitors, regardless of whether those
individuals had access to an ITN within their own households.
In connection with Indicator 3 (proportion of individuals that have access to an ITN within the household), this
indicator can be used to define the behavioral gap in use of ITNs (i.e., the population with access to an ITN but not
using it) and distinguish it from the ownership gap (i.e., non-use because there are not enough nets in the
household).
6 An ITN is 1) a factory-treated net that does not require any treatment (an LLIN), or 2) a net that has been soaked with insecticide within the
past 12 months (see Reference Section 3.1 for explanation of revised definition).

Page 23
5. Proportion of Children under Five Years Old Who Slept under an ITN7 the Previous Night
� Numerator: Number of children under five years old who slept under an ITN the previous night
� Denominator: Total number of children under five years old who spent the previous night in surveyed
households
Purpose/Rationale
This indicator is used to measure the level of ITN coverage of children under five years old at the time of the
survey.
Method of Measurement
The data for the denominator are obtained from the household questionnaire that lists every child under five who
stayed in the house the previous night. The data for the numerator are then obtained from a listing of the same
children in the house who slept under a mosquito net the previous night, in combination with information on
whether it is a factory-treated net that does not require any treatment (an LLIN) or a net that has been soaked
with insecticide within the past 12 months.
Considerations
This indicator may be biased by the seasonality of survey data collection, since survey fieldwork for DHS and MICS
is most often done during the dry season when net use is likely at its lowest.
Interpretation
This indicator provides a direct measure of ITN use by children under five years of age at the time of the survey.
7 An ITN is 1) a factory-treated net that does not require any treatment (an LLIN), or 2) a net that has been soaked with insecticide within the
past 12 months (see Reference Section 3.1 for explanation of revised definition).

Page 24
6. Proportion of Pregnant Women Who Slept under an ITN8 the Previous Night
� Numerator: Number of pregnant women who slept under an ITN the previous night
� Denominator: Total number of pregnant women within surveyed households
Purpose
This indicator is used to measure the level of ITN use by pregnant women.
Method of Measurement
The data for the denominator are obtained from a question asked of all interviewed women of reproductive age in
the household about their current pregnancy status. The data for the numerator are then obtained from a listing
of these women who slept under a mosquito net the previous night, in combination with information on current
pregnancy status and whether the net is a factory-treated net that does not require any treatment (an LLIN) or a
net that has been soaked with insecticide within the past 12 months.
Note that the MICS survey program did not collect data for this indicator prior to the inclusion of the household
net roster in Round 4 (2009-2011).
Considerations
This indicator may be biased by the seasonality of survey data collection, since survey fieldwork for DHS and MICS
is most often done during the dry season when net use is likely at its lowest.
Additionally, it is difficult to capture data on all pregnant women in a household survey because many women
either don’t know they are pregnant or may not want to divulge this information during early pregnancy. There
may be some bias if any reluctance to discuss pregnancy is also associated with first births, adolescence and other
demographic factors.
Interpretation
This indicator provides a direct measure of ITN use by pregnant women at the national level.
8 An ITN is 1) a factory-treated net that does not require any treatment (an LLIN), or 2) a net that has been soaked with insecticide within the
past 12 months (see Reference Section 3.1 for explanation of revised definition).
Page 25
7. Proportion of Existing ITNs9 Used the Previous Night
� Numerator: Number of ITNs in surveyed households that were used by anyone the previous night
� Denominator: Total number of ITNs in surveyed households
Purpose/Rationale
This indicator measures the use of existing ITNs. In certain instances, calculating the proportion of existing ITNs
used the previous night is useful for assessing the utilization of existing ITNs and determining the magnitude of
non-use of ITNs at the time of the survey.
Method of Measurement
The data for the denominator are obtained from the household questionnaire that lists every ITN in each surveyed
household. The data for the numerator are then obtained from a listing of every ITN and information on whether
the ITN was used by anyone who stayed in the household the previous night.
Considerations
This indicator may be biased by the seasonality of survey data collection, since survey fieldwork for DHS and MICS
is most often done during the dry season when net use is likely at its lowest.
Interpretation
This indicator provides a direct measure of use of existing ITNs at the time of the survey. It complements
indicators referring to the potential and actual ITN use in the population, provides an assessment of the level of
non-use of ITNs, and identifies behavioral deficiencies of ITN use.
This indicator does not account for the possibility that some households may have an oversupply of ITNs or that
some individuals may have slept outside of the household the previous night. In households where there are more
ITNs than individuals sleeping in the household, not all ITNs will have been used the previous night.
9 An ITN is 1) a factory-treated net that does not require any treatment (an LLIN), or 2) a net that has been soaked with insecticide within the
past 12 months (see Reference Section 3.1 for explanation of revised definition).
Page 26
8. Households Covered by Vector Control
Proportion of Households with at Least One ITN10
and/or Sprayed by IRS in the Last 12 Months
� Numerator: Number of households that have at least one ITN and/or have been sprayed by IRS in the last 12
months
� Denominator: Total number of households surveyed
Purpose/Rationale
This indicator assesses the extent to which the two main vector control activities are available to populations. It
measures the proportion of households covered by either an ITN or IRS. In places where IRS is limited to small
target areas, this indicator provides a more appropriate assessment of the vector control activities being
conducted throughout the country than an indicator measuring national coverage of IRS activity alone.
Method of Measurement
The data for the numerator are obtained from information on which households possess an ITN and which
households have been protected by IRS in the last 12 months. The denominator is simply the total number of
households in the survey.
An IRS campaign may be conducted either as part of the national strategy for malaria control (operations
conducted by governmental spray teams) or undertaken by a non-governmental organization (NGO) or private
company. It is important to capture only those spraying activities that have occurred as part of an organized IRS
campaign and to exclude spraying that was conducted by a member of the household.
Considerations
Asking respondents to recall when the household was sprayed can result in considerable bias and ‘heaping’ of
dates. The estimate may be biased upwards if the respondent confuses spraying with residual insecticide with
spraying with household products; however, such confusion can be reduced by thoroughly training interviewers.
Additionally, bias can result because the actual respondent may not have been present at the time of spraying and
may therefore be reporting what was heard from others.
Interpretation
This indicator provides a measure of national vector control activities. It should not be confused with
programmatic surveys that capture whether IRS activities reached all their target households. This indicator
supports the interpretation of indicator 9, universal coverage of vector control.
10
An ITN is 1) a factory-treated net that does not require any treatment (an LLIN), or 2) a net that has been soaked with insecticide within the
past 12 months (see Reference Section 3.1 for explanation of revised definition).

Page 27
9. Universal Coverage of Vector Control
Proportion of Households with at Least One ITN11
for Every Two People and/or Sprayed by IRS within
the Last 12 Months
� Numerator: Number of households with at least one ITN for every two people and/or have been sprayed
by IRS in the last 12 months
� Denominator: Total number of households surveyed
Purpose/Rationale
This indicator allows universal coverage of vector control activities to be assessed. Universal coverage of vector
control means that each person in a specified geographic area at risk of malaria is protected from malaria infection
by either owning an ITN or by living in a house protected by IRS.
Method of Measurement
The data for the numerator are obtained from information on the total number of households with at least one
ITN for every two people, in combination with information on whether the households have been sprayed by IRS in
the last 12 months. The denominator is simply the total number of households in the survey.
An IRS campaign may be conducted either as part of the national strategy for malaria control (operations
conducted by governmental spray teams) or undertaken by an NGO or private company. It is important to capture
only those spraying activities that have occurred as part of an organized IRS campaign and to exclude spraying that
was conducted by a member of the household.
Considerations
This indicator seeks to avoid double counting the number of persons protected by both IRS and ITNs.
Asking respondents to recall when the household was sprayed can result in considerable bias and ‘heaping’ of
dates. The estimate may be biased upwards if the respondent confuses spraying with residual insecticide with
spraying with household products; however, such confusion can be reduced by thoroughly training interviewers.
Additionally, the bias can result because the actual respondent may not have been present at the time of spraying
and may therefore be reporting what was heard from others.
Interpretation
This indicator aims to assess progress towards achievement of universal coverage of malaria prevention through
the two main vector control activities.
11
An ITN is 1) a factory-treated net that does not require any treatment (an LLIN), or 2) a net that has been soaked with insecticide within the
past 12 months (see Reference Section 3.1 for explanation of revised definition).
Page 28
Additional Analysis: IRS National-level Indicator
Proportion of Households that Received Spraying through an IRS Campaign within the Last 12 Months
� Numerator: Number of households that were sprayed with a residual insecticide during an IRS campaign in
the last 12 months
� Denominator: Total number of households surveyed
Purpose/Rationale
The purpose of this indicator is to measure IRS coverage at the national level. The intent is to obtain information
on overall coverage with IRS, rather than information on the quality of spraying activities. In countries where
sizeable IRS operations are underway, it may be advantageous to report IRS coverage at the national level. In some
countries, relatively small areas or ‘target zones’ are specifically targeted for spraying, so presenting nationally
representative results may misrepresent the extent to which IRS targets have been achieved, as low nationwide
coverage is not necessarily an indication of a poorly-performing IRS program. However, these data are necessary to
collect in order to calculate the indicators, households covered with vector control and universal coverage of
vector control. Furthermore, it may be deemed necessary to report on this indicator in certain countries due to
reporting requirements, to ensure consistency between years and/or due to sampling considerations.
Method of Measurement
Household survey questions for measuring population-level IRS coverage from a DHS, MICS or MIS survey can be
used to obtain the necessary information. This indicator can therefore be constructed from any household survey
which includes such questions and covers areas where spraying is expected to have occurred.
An IRS campaign may be conducted either as part of the national strategy for malaria control (operations
conducted by government spray teams) or by an NGO or private company (operations conducted independent of
the national strategy). It is important to capture only those spraying activities that have occurred as part of an
organized IRS campaign, rather than spraying that was conducted by a member of the household.
The ideal household survey would be one which has coverage sufficient to include a large proportion of all areas
intended for spraying by the national program. If the household survey used for collecting data for this indicator
does not specifically use a survey population, defined as those at risk for malaria, care must be taken to ensure
that a sufficient sample size is obtained within malaria endemic areas of the country. It may also be necessary to
oversample within districts with known levels of malaria transmission and known levels of IRS activity for
comparison purposes and to aid with interpretation.
Considerations
Asking respondents to recall when the household was sprayed can result in considerable bias and ‘heaping’ of
dates. The estimate may be biased upwards if the respondent confuses spraying with residual insecticide with
spraying with household products; however, such confusion can be reduced by thoroughly training interviewers.
Furthermore, bias can result because the actual respondent may not have been present at the time of spraying
and may therefore be reporting what was heard from others.
Page 29
Program-level IRS Indicators
Reliable program data, obtained during routine spraying activities, are crucial for evaluating the performance of
IRS programs. Given that household survey data have limitations such as recall bias, and results at the national
level may be misleading, program data should be collected in order to more accurately assess the progress
achieved by spraying programs. To facilitate this process, program-level indicators may need to be reported as part
of the national-level monitoring and evaluation plan.
Interpretation
This indicator provides an estimate of IRS coverage at the national level over a 12-month time period. Since data
are obtained from household surveys, careful interpretation of the results in required, given that achieving high
levels of IRS coverage at the national level is not always the intent of programs.
Furthermore, since the denominator does not specifically exclude those areas not covered by a program, this
indicator cannot be used to evaluate the performance of a national IRS program. Likewise, this estimate is
nationally representative and may not adequately capture program efforts in targeted subnational areas.
Page 30
3.2 Intermittent Preventive Treatment during Pregnancy
Malaria infection during pregnancy is a major public health concern in malaria endemic areas with stable
transmission, such as tropical Africa. Malaria during pregnancy can result in poor outcomes for the woman and her
newborn, such as maternal anemia, low birth weight, and premature delivery [13]. Low birth weight is the single
greatest risk factor for neonatal mortality and a major contributor to infant mortality [14, 15]. This increased risk of
adverse outcomes for mothers and their newborns is typically greatest for the mother’s first two pregnancies.
However, in the presence of HIV infection, the risk associated with placental malaria appears to be independent of
the number of pregnancies [16].
Effective strategies for preventing and controlling malaria during pregnancy, such as the use of ITNs and IPTp, have
been shown to have a dramatic impact on the health of mothers and their newborns within areas of stable malaria
transmission. ITN use has been shown to significantly reduce the prevalence of low birth weight deliveries, as well
as malaria-related morbidity among pregnant women [13, 17] (see page 24 for an indicator on use of ITNs in
pregnancy).
IPT is the administration of a full course of an effective antimalarial treatment at specified time points to a defined
population at risk of malaria, regardless of whether they are parasitemic, with the objective of reducing the
malaria burden in the specific target population. WHO currently recommends IPTp with sulfadoxine-
pyrimethamine (SP) at each scheduled antenatal care visit for pregnant women living in areas of moderate to high
transmission in sub-Saharan Africa. The first IPTp-SP dose should be administered as early as possible during the
2nd trimester of pregnancy. Each SP dose should be given at least 1 month apart and the last dose can be
administered up to the time of delivery [6]. IPTp has been shown to significantly reduce the prevalence of anemia
and placental malaria infections at the time of delivery [18-20]. However, SP is contraindicated in HIV+ women
already receiving co-trimoxazole as chemoprophylaxis [5].
Studies are underway to determine the continued safety and efficacy of IPTp using SP, given the recent increase in
SP resistance [21]. To date, SP has been shown to provide substantial benefit to pregnant women even in settings
where resistance has been observed [22].
As the WHO recommendation regarding the frequency of IPTp was recently updated, the IPTp indicator in this
document has been changed to measure three or more doses rather than two or more doses to reflect the new
policy.
Page 31
10. Proportion of Women who Received Three or More Doses of Intermittent Preventive Treatment
during ANC Visits during Their Last Pregnancy
� Numerator: Number of women who received three or more doses of a recommended prophylactic
antimalarial drug treatment, at least one of which was received during an ANC visit, to prevent malaria
during their last pregnancy that led to a live birth within the last two years
� Denominator: Total number of women surveyed who delivered a live baby within the last two years
Purpose
WHO recommends that all pregnant women in areas of moderate to high malaria transmission in sub-Saharan
Africa receive SP at each scheduled ANC visit, with at least one month between each dose, beginning as early as
possible in the second trimester of pregnancy [6]. This indicator is used to measure the use of IPTp to prevent
malaria during pregnancy among women who gave birth in the last two years.
Method of Measurement
Data from the women’s questionnaires for all women in surveyed households who delivered a live baby within the
last two years are used to calculate the denominator. The numerator is derived from the number of women who
mention taking a recommended prophylactic antimalarial drug, at least one dose of which was received during an
ANC visit, for prevention (not treatment) during their most recent pregnancy (from among all listed births to
women in the last two years).
The currently recommended drug for IPTp is SP. In order to obtain accurate data for this indicator, it is important
to differentiate between a treatment dose for prevention (as prescribed for IPTp) and actual treatment of an
existing malaria infection. Although it is difficult to differentiate in the context of a survey interview, the latter is
curative care and does not count as a standard IPTp procedure. Therefore, women taking antimalarial drugs, such
as ACTs, which are not part of standard IPTp, should be not be considered as covered by IPTp. Similarly, women
taking weekly chloroquine prophylaxis are not considered to be covered by IPTp.
Considerations
IPTp with SP is currently only recommended by WHO for stable transmission areas in sub-Saharan Africa [6]. This
indicator does not provide information regarding at which stage during pregnancy IPTp was given. Household
surveys do not typically measure whether each dose of IPTp was given during antenatal care visits. They can only
be used to determine whether at least one of the doses received was given during an ANC visit.
Retrospective questions about IPTp given during a previous pregnancy may be subject to recall bias. For example, a
woman may not recall which type of antimalarial was given or how many doses she received.
Additionally, it is difficult to capture data on all pregnant women in a household survey because many women
either do not know they are pregnant or may not want to divulge this information during early pregnancy. There
Page 32
may be some bias if any reluctance to discuss pregnancy is also associated with first births, adolescence and other
factors.
Interpretation
This indicator provides a measure of the proportion of pregnant women who receive IPTp during pregnancy. As the
WHO recommendation regarding the frequency of IPTp was recently updated, the IPTp indicator in this document
has been changed to measure three or more doses rather than two or more doses during ANC visits to reflect the
new policy. Data on one, two and four or more doses of IPTp can aid in the interpretation of this indicator.
Additional Analysis: Proportion of women who received at least one, two, or four doses of a recommended
prophylactic antimalarial drug treatment, at least one of which was received during an ANC visit, to prevent
malaria during their last pregnancy that led to a live birth within the last two years
� Numerator: Number of women who received at least one, two, or four doses of a recommended
prophylactic antimalarial drug treatment, at least one of which was received during an ANC visit, to prevent
malaria during their last pregnancy that led to a live birth within the last two years
� Denominator: Total number of women surveyed who delivered a live baby within the last two years
Purpose/Rationale
WHO recommends that all pregnant women in areas of moderate to high malaria transmission in sub-Saharan
Africa receive SP at each scheduled ANC visit, with at least one month between each dose, beginning as early as
possible in the second trimester of pregnancy [6]. This indicator is used to disaggregate the measure of various
doses (one, two and four) of IPTP to prevent malaria during pregnancy among women who gave birth in the last
two years.
Method of Measurement
Data from the women’s questionnaires for all women in surveyed households who delivered a live baby within the
last two years are used to calculate the denominator. The numerator is derived from the number of women who
mention taking a recommended prophylactic antimalarial drug, at least one dose of which was received during an
ANC visit, for prevention (not treatment) during their most recent pregnancy (from among all listed births to
women in the last two years).
The currently recommended drug for IPTp is SP. In order to obtain accurate data for this indicator, it is important
to differentiate between a treatment dose for prevention (as prescribed for IPTp) and actual treatment of an
existing malaria infection. Although it is difficult to differentiate in the context of a survey interview, the latter is
curative care and does not count as a standard IPTp procedure. Therefore, women taking antimalarial drugs, such
as ACTs, which are not part of standard IPTp, should be not be considered as covered by IPTp. Similarly, women
taking weekly chloroquine prophylaxis are not considered to be covered by IPTp.

Page 33
Considerations
IPTp with SP is currently only recommended by WHO for stable transmission areas in sub-Saharan Africa [6]. This
indicator does not provide information regarding at which stage during pregnancy IPTp was given. Household
surveys do not typically measure whether each dose of IPTp was given during antenatal care visits. They can only
be used to determine whether at least one of the doses received was given during an ANC visit.
Retrospective questions about IPTp given during a previous pregnancy may be subject to recall bias. For example, a
woman may not recall which type of antimalarial was given or how many doses she received.
Additionally, it is difficult to capture data on all pregnant women in a household survey because many women
either do not know they are pregnant or may not want to divulge this information during early pregnancy. There
may be some bias if any reluctance to discuss pregnancy is also associated with first births, adolescence and other
factors.
Interpretation
This indicator provides a dissagregated measure of the proportion of pregnant women who receive at least one,
two and four doses of IPTp during pregnancy. Data on the various doses of IPTp can aid in the interpretation of
indicator 10.
Health Management Information Systems as an Alternative Data Source
The primary disadvantage of surveys is that their results refer to pregnancies that occurred up to two years prior to
the time of the survey (in order to base the estimates on a large enough number of cases). Measurement through
health management information systems (HMIS) captures IPTp at the current time, and analyses can be targeted
to facilities where IPTp is actually being implemented. Consequently, it is appropriate to collect data through both
sources.
An IPTp indicator to be obtained from ANC registers is provided in the Malaria in Pregnancy: Guidelines for
measuring key monitoring and evaluation indicators at:
http://whqlibdoc.who.int/publications/2007/9789241595636_eng.pdf. This indicator provides an alternative
measure of IPTp delivered through ANC. It is important to note that a different denominator is used in the
calculation of this indicator—pregnant women who access the health system; consequently, direct comparisons
cannot be made between this indicator and the indicator described above.
Page 34
3.3 Case Management (among Children under Five Years Old)
Access to Diagnostic Testing
Prompt parasitological confirmation by microscopy, or alternatively by rapid diagnostic tests (RDTs), is
recommended in all patients with suspected malaria before treatment is started [5]. Antimalarial treatment given
solely on the basis of clinical suspicion should only be considered when a parasitological diagnosis is not available.
Treatment based on diagnostic testing is good clinical practice and has the following advantages over presumptive
treatment of all fever episodes:
� Improved care of parasite-positive patients because of confirmation of infection;
� Identification of parasite-negative patients, in whom another diagnosis must be sought and treated
accordingly;
� Reduced side effects, drug interactions, selection pressure and potentially costs by reducing use of
antimalarial medicine in parasite-negative patients;
� Increased public trust in the efficacy of ACT when used only to treat confirmed malaria cases; and
� Enhanced public trust in diagnosis and treatment of non-malaria causes of febrile illness.
As malaria programs increase the coverage of interventions and the incidence of malaria decreases, the proportion
of fevers not due to malaria increases. Hence, it becomes increasingly important to undertake diagnostic testing
to identify and treat only confirmed cases.
Access to Effective Treatment
Prompt and effective treatment is a key element in successful malaria control because of the rapid onset of illness
and severe health outcomes related to Plasmodium falciparum malaria, especially among children and non-
immune populations [23, 24]. However, antimalarial drug resistance has become a major challenge in providing an
effective malaria treatment in many regions of the world. Resistance to traditional monotherapies such as
chloroquine, sulfadoxine-pyrimethamine and amodiaquine is widespread across most of Africa. As a result, WHO
recommends treating malaria due to P. falciparum using ACTs [5]. Understanding which antimalarial drugs are
provided to children and the promptness with which they seek treatment after the onset of symptoms is important
for monitoring prompt access to effective treatment.
Although the treatment guidelines have shifted from presumptive treatment, measuring confirmed malaria cases
among children under five through survey instruments presents a number of challenges. Caregivers may never
receive the results of diagnostic testing, and if they do, they may not provide reliable information regarding
malaria diagnoses. Due to these measurement challenges, the current version of this manual does not provide
recommendations regarding the measurement of confirmed malaria cases, which would be the ideal basis for
indicators related to prompt and effective treatment. Research is still needed to assess and improve
methodologies to measure malaria cases through survey instruments. As an interim measure, the recommended
indicator examines what proportion of antimalarial treatments are ACTs or other first-line treatments; first-line
treatment is expected to include ACTs in most countries with P.falciparum, but may be different in countries with
non-falciparum malaria. An indicator which measures the extent to which children with fever obtain a
parasitological diagnosis is also recommended.

Page 35
� Proportion receiving any ACT (or other appropriatetreatment), among children under five years old with
fever in the last two weeks who received any antimalarial drugs
� Proportion of children under five years old with fever in last two weeks who had a finger or heel stick
A further indicator is also recommended:
� Proportion of children under five years old with fever in the last two weeks for whom advice or treatment
was sought
These indicators replace those that were recommended in a previous version of this document, Guidelines for
Core Population-Based Indicators. The previously recommended treatment indicators were:
� Proportion of children under five years old with fever in last two weeks who received any antimalarial
treatment
� Proportion of children under five years old with fever in last 2 weeks who received antimalarial treatment
according to national policy within 24 hours from the onset of fever
These are presented in this document in Annex 1 as previously recommended indicators. The intention of the
indicators was to capture the accessibility of antimalarial treatment to children under five years old with fever.
The indicators have become problematic as diagnostic testing has scaled up; they do not take into account the fact
that some febrile children will be given a diagnostic test and those that test negative should not be given an
antimalarial medicine. As a result, countries or areas with more accessible health services and diagnostic testing
can produce lower values of the indicator than those with weaker health services. In addition, for those children
that are not tested, the indicators do not provide a good guide to the appropriateness of treatment, since, in most
epidemiological settings, the proportion of fever cases that have evidence of malaria parasite prevalence is low
(less than 30 percent) [25]. Accordingly, those indicators are no longer recommended.
Details on the strengths and limitations of all recommended case management indicators are listed in Table 7.
Table 7: Strengths and Limitations of All Diagnostic Testing and Treatment Indicators
Strengths
� The limited number of questions required to ascertain data for these indicators
can be easily added to any nationally representative sample survey of households.
� Comparability is across countries, given that appropriate and consistent sampling
procedures are followed and confounding factors are accounted for.
Limitations
� Data may not be based on reliable estimates of episodes of fever in previous two
weeks.
� Fever may not have been the result of malaria infection.
� Data based solely on the mother’s or caregiver’s information may miss fostered
children or others living in a household without a parent/caregiver.
� Data based solely on the mother’s or caregiver’s information may not be reliable if
she or he did not take the child for care.
Page 36
11. Proportion of Children under Five Years Old with Fever in Last Two Weeks Who Had a Finger or
Heel Stick
� Numerator: Number of children under five years old with fever in the previous two weeks who had a
finger/heel stick
� Denominator: Total number of children under five years old who had a fever in the previous two weeks
Purpose/Rationale
This indicator measures the extent to which children with fever obtain a parasitological diagnosis. Only a minority
of fever cases that present to a health facility have evidence of malaria parasitemia when tested [25] and should
be treated with antimalarial medicines. The majority of fever cases test negative and should not be treated with
antimalarial medicines because (i) the true cause of fever should be ascertained and treated appropriately, (ii)
treatment of patients with negative test results causes wastage of high-cost, artemisinin-based medicines, and (iii)
treatment patients with negative test results causes increased selective pressure for drug resistance, thereby
accelerating the onset of drug resistance.
Method of Measurement
The data for the denominator include children under five who had a fever in the previous two weeks. These data
are obtained in one of two ways, depending on the type of survey. Some surveys use the household listing
procedure, whereby every child under five who stayed in the house the previous night is identified (MICS). DHS
and MIS surveys ask questions in the women’s questionnaire about all of their biological children under the age of
five; thus, the denominator excludes non-biological children. The numerator is then obtained by asking all mothers
or caregivers in the household whether any of the children who had a fever in the past two weeks received a
finger/heel stick.
Considerations
A finger/heel stick may not have been conducted to diagnose malaria (for instance, these methods are also used to
diagnose anemia). However, the most likely purpose for this age group is malaria testing, especially when the child
has a fever, so this should not be of considerable concern. The mother is not specifically asked whether the
finger/heel stick was conducted for malaria testing due to concerns that an underestimate would result, as some
women may not know whether the sample drawn was used for malaria diagnosis.
Interpretation
This indicator provides a proxy measure of the level of access of children under five years old to diagnostic testing
for malaria infection. As countries scale up towards universal diagnostic testing, the indicator values reported are
expected to increase but are unlikely to reach 100 percent because some fever cases will not seek care at places
where tests are available, if at all. Most testing is done in public sector health facilities and the value of the
indicator will depend partly on the proportion of fever cases that attend such facilities.
Page 37
12. Proportion of Children under Five Years Old with Fever in the Last Two Weeks for Whom
Advice or Treatment Was Sought
� Numerator: Number of children under five years old who had a fever in the previous two weeks for whom
advice or treatment was sought
� Denominator: Total number of children under five years old who had a fever in the previous two weeks
Purpose/Rationale
This indicator captures national-level care seeking behavior for the treatment of malaria among children under five
years old.
Method of Measurement
The data for the denominator include children under five that had a fever in the previous two weeks. These data
are obtained in one of two ways, depending on the type of survey. Some surveys use the household listing
procedure, whereby every child under five who stayed in the house the previous night is identified (MICS). DHS
and MIS surveys ask questions in the women’s questionnaire about all of their biological children under the age of
five; thus, the denominator excludes non-biological children. The numerator is then obtained by asking all mothers
or caregivers in the household whether treatment was sought for any of the children under five years old with
fever in the last two weeks from any source.
Considerations
The mother of a child does not always know the exact qualifications of or the type of provider and, thus, may not
be able to tell the interviewer this information.
Interpretation
Although type of provider is not a component of the indicator definition, program managers may find it useful to
disaggregate this indicator by type of provider to determine whether treatment was sought by an appropriate
provider.
This indicator does not determine why advice or treatment was not sought for some children.
Page 38
13. Proportion Receiving an ACT (or Other Appropriate Treatment), among Children under Five Years
Old with Fever in the Last Two Weeks Who Received Any Antimalarial Drugs
� Numerator: Number of children under five years old who had a fever in the previous two weeks who received
an ACT (or other appropriate treatment according to national policy)
� Denominator: Total number of children under five years old who had a fever in the previous two weeks who
received any antimalarial drugs
Purpose/Rationale
This indicator assesses what proportion of antimalarial treatment received by children under five are in accordance
with national malaria treatment policy. Understanding which antimalarial drugs are provided is an important
component for monitoring access to effective treatment.
Method of Measurement
The data for the denominator include children under five who had a fever in the previous two weeks. These data
are obtained in one of two ways, depending on the type of survey. Some surveys use the household listing
procedure, whereby every child under five who stayed in the house the previous night is identified (MICS). DHS
and MIS surveys ask questions in the women’s questionnaire about all of their biological children under the age of
five; thus, the denominator excludes non-biological children. This is combined with information obtained by asking
all mothers or caregivers in the household whether any of the children who had a fever in the past two weeks
were given an antimalarial treatment. The numerator is then calculated by determining the number of these
children who were provided with any ACT or other first-line treatments according to national policy in countries
with non-falciparum malaria.
Considerations
This indicator is not limited to confirmed cases. Furthermore, it does not measure treatment in children under five
with fever in the past two weeks for whom advice or treatment was not sought and those for whom advice or
treatment was sought but who did not receive an antimalarial drug. Depending on the availability and use of
parasitological confirmation, many of the children in the latter group may not have received antimalarial drugs due
to the fact that their diagnostic test confirmed that their fever was not the result of malaria.
Additionally, there is no way of knowing if antimalarial treatments were administered correctly.
Interpretation
This indicator measures the extent to which ACT or other first-line treatments are used to treat malaria as a
proportion of all antimalarial treatments and, thus, is a measure of effective treatment. Ideally, ACTs or other first-
line treatments should represent almost all antimalarial treatments.

Page 39
3.4 Impact Indicators
Data on anemia and parasitemia can be useful for assessing malaria morbidity. Parasite prevalence is malaria-
specific and can provide a rough measure of transmission [26]. Additionally, anemia prevalence can reflect malaria
morbidity and responds to changes in the coverage of malaria interventions [27, 28]. The standard MIS includes
anemia and parasitemia biomarker measurements. The DHS also routinely collects anemia data from nationally
representative samples and sometimes includes parasitemia measurements.
Monitoring trends in all-cause under five mortality rates using data from nationally-representative household
surveys, such as DHS and MICS [29], is a useful exercise. However, this indicator can be influenced by several
factors and does not provide specific information on malaria mortality trends.
In assessing whether malaria control programs have had an impact on all-cause mortality rates, it is possible to
examine all-cause childhood mortality trends over a clearly defined time interval and, for the same time interval,
observe changes in malaria intervention coverage, the prevalence of other factors influencing malaria and non-
malaria childhood mortality (vaccination coverage, malnutrition, etc.) and morbidity indicators (anemia and
parasite prevalence). If statistically significant reductions in mortality and morbidity are found and malaria
intervention coverage has increased to high levels and other factors influencing all-cause childhood mortality have
not changed substantially, then it is a plausible conclusion that malaria control activities caused or contributed to
reductions in malaria-associated mortality. A more detailed description of this evaluation method has been
described elsewhere [30].
Details on the strengths and limitations of all impact indicators are listed in Table 8.
Table 8: Strengths and Limitations of Impact Indicators
Strengths
� Representative of large populations of interest.
� Comparable across countries given that appropriate and consistent sampling
procedures are followed.
Limitations
� Due to cost and other resource limitations, large nationally representative surveys
are usually conducted on three-year or five-year cycles, and therefore, data may
not be available at the optimal intervals for evaluation.
� The survey recall period may not coincide exactly with the scale-up period of
interventions, causing their impact to be underestimated.
� Prevalence estimates for anemia and malaria parasitemia may be biased by the
seasonality of survey data collection, since survey fieldwork for DHS and MICS is
most often done during the dry season when prevalence is likely at its lowest.
Page 40
14. Parasite Prevalence
Proportion of Children Aged 6-59 Months with Malaria Infection
(Obtained from household surveys rather than HMIS data)
� Numerator: Number of children aged 6-59 months with malaria infection detected by rapid diagnostic test or
microscopy
� Denominator: Total number of children aged 6-59 months tested for malaria parasites by rapid diagnostic
test or microscopy
Purpose/Rationale
The parasite prevalence among children aged 6-59 months is an indicator of malaria burden within populations
and provides a guide to the level of malaria transmission.
Method of Measurement
Parasitemia testing should be included in surveys that are conducted during the high transmission season for
malaria. In some cases where transmission is perennial (occurs all year), seasonal peaks may still influence the
parasite prevalence and seasonality should be taken into account when planning a survey. The MIS should ideally
be conducted when rains become intermittent and in the four to six weeks after the rains end. This timeframe is
associated with peak transmission and is therefore suitable for measuring parasite prevalence. Large-scale
household surveys are typically not suitable for inclusion of parasitemia measurement because these surveys are
not usually conducted during the high transmission season and because of the length of fieldwork, which would
cover different periods of seasonal transmission.
Parasitemia testing should target children aged 6- 59 months. This is the same age range that is targeted for
anemia testing in both DHS and MIS surveys. Depending on a number of conditions in the survey setting, parasite
prevalence should be based on either a high quality rapid diagnostic test (RDT) or microscopy. More detail on the
appropriate use of each of these tests is given below.
Rapid Diagnostic Tests
Parasite prevalence should be based on the results of a high quality RDT in settings where there is reasonable
evidence (from household surveys, routine data or special studies) that both of the following conditions prevail:
� P. falciparum accounts for nearly all infections ( ≥ 90 percent)
� Low level infections (<200 parasites/μl) are uncommon
The results of the WHO RDT Evaluation Program should be consulted when selecting an RDT {31]. At the time of
publication of this manual, the latest results were available at:
http://www.who.int/malaria/publications/atoz/9789241502566/en/index.html
Page 41
Microscopy
Prevalence should be based on microscopically examined blood films prepared in the field and read in a quality-
controlled laboratory by well-trained microscopists in settings where there is reasonable evidence (from
household surveys, routine data or special studies) that either of the following conditions prevail:
� Non-falciparum malaria or mixed infections account for more than 10 percent of infections
� Parasite density is expected to be below 200 parasites/μl in a substantial proportion of cases
In settings where the determination of species is necessary, thick blood films should be used to determine parasite
prevalence and thin films should be examined to estimate levels of infection with P. falciparum, P. vivax or other
species. Rapid diagnostic testing with tests that can detect all species present should also be included for field
surveys so that all respondents with malaria can be treated or referred, according to national policy. Where both
RDTs and microscopy are used for parasitemia testing, results of both should be reported.
It is important to recognize the distinction between diagnosis in clinical settings and identification of infected
individuals for prevalence studies. Microscopy presents special issues for survey efforts. Field teams must be
adequately trained to collect specimens on slides. The storage and transportation of slides is also difficult in the
field and requires logistical planning. Supervision of these efforts is also important.
Considerations
Some studies of malaria interventions showing mortality reductions have found large decreases in parasite
prevalence [32, 33]; however, other studies of control interventions have found that despite reductions in
mortality, parasite prevalence changes little [8].
As measurement of parasite prevalence requires finger stick blood, some caretakers may not consent to
parasitemia testing of their child. Additionally, survey personnel will require extra training to use RDTs or to collect
blood on slides for microscopy.
Parasite prevalence can fluctuate dramatically throughout the course of a year with the seasonality of malaria, and
thus values of the indicator may be influenced by the timing of a survey in relation to peak transmission.
Accordingly, parasite prevalence should not be used for tracking the short-term impact of scaling up prevention
efforts, as the prevalence rates may merely reflect differences in the timing of surveys in relation to within year
variation in parasite prevalence. Parasite prevalence is better suited to measuring changes in malaria burden of
over a longer term during which changes in parasite prevalence are expected to be much greater and outweigh
within-year variation. To demonstrate a reliable trend, no more than four data points within a ten-year span are
generally needed.

Page 42
Interpretation
This indicator provides a direct measure of parasite prevalence among children aged 6-59 months at the national
level.
Parasite prevalence is difficult to interpret and can fluctuate dramatically throughout the course of a year and is
therefore not suitable for the detection of program impact over short periods of time.
When interpreting this indicator, the method of measuring parasite prevalence should be considered (microscopy
vs. RDT). Microscopy detects parasites present in the blood at the time of the survey and therefore provides point
parasite prevalence. By contrast, HRP2-based RDTs detect antigens to malaria parasites, which may endure for
some weeks after treatment. This is especially important when interpreting trends over time, as parasite
prevalence before the advent of RDTs was measured primarily using microscopy.

Page 43
Table 9: Strengths and Limitations of Using RDTs and Microscopy for Population-based Surveys
Strengths Limitations
Rapid
Diagnostic
Tests
� Use requires less training than microscopy
as it does not require staining, mounting
and reading of slides.
� Results are rapid (within 15 minutes), thus
facilitating timely treatment of infected
individuals.
� In survey settings, costs are lower than
those of microscopy (materials, transport
and labor).
� Currently available RDTs have sensitivity
and specificity comparable to routine
microscopy.
� Some children previously treated for
malaria may test positive by RDT within
14 days after treatment, as antigens often
persist after treatment.
� Variation may exist between brands and
types of RDTs (which antigens are
detected). Across time and countries, this
could affect the comparability of survey
results.
� Limited determination of species (some
tests detect only one Plasmodium species,
usually P. falciparum, others detect any
species but do not identify which is
present).
� Quantification of parasites is not possible.
� Sensitivity is low for low parasite
densities.
Microscopy
� Historically, considered the gold standard
for malaria diagnosis.
� Permits determination of species and
quantification of parasites.
� Can detect low density parasite
infections.
� Historical comparisons possible assuming
comparable skill of microscopists due to
consistency of diagnostic methods over
time.
� Slides can be stored and reexamined.
� There are practical difficulties preparing
blood films in the field.
� Slides must be transported and stored.
� Sufficiently trained microscopists
(especially in settings where
determination of species is required) are
not always available and there are often
inconsistencies in reading slides.
� Variation is likely to occur between
microscopists.
� Increases costs of survey.
� Sensitivity is low for low parasite
densities.
� Increases time necessary before data
become available.
Page 44
Parasite Prevalence among All Ages
It is not recommended that parasite prevalence be estimated for all ages on a regular basis. However, in some
cases the inclusion of all ages for testing may be warranted. These include special studies in settings where there is
not a clear age pattern of malaria infection, surveys that will provide for modeling of incidence of malaria or
surveys carried out where prevalence is very low or unstable.
Recruitment and testing of an older, less accessible population through large-scale household surveys face a
number of challenges to gather estimates of parasite prevalence among all ages. These include:
Practical Challenges
� The time and cost associated with conducting a survey will increase significantly if parasite testing is
extended to all age groups. When testing is conducted for children under five only, approximately 15
percent of the total sample population is tested. In contrast, up to 100 percent of that population will be
tested to get an estimate for all age groups.
� School children and adults who work outside of the home are generally not present at home during the
time of day that survey fieldwork is often conducted, and those who are home are more likely to be sick.
In order to reduce the bias caused by this absentia, survey teams can carry out fieldwork during school
holidays or late in the afternoon or they can conduct repeat visits to households during times when
school children and working adults are more likely to be at home.
� Evidence from surveys that tested all age groups in Djibouti and Sudan showed that a substantial
proportion of adults will refuse testing [34, 35].
Epidemiological Challenges
� During pregnancy, malaria parasites can sequester themselves in the placenta. Routine light microscopy
and RDTs cannot detect all infections in peripheral blood, which serves as the sample for parasite testing
in MIS [36-38].
� In most low risk countries where national prevalence is two percent or less, it is probable that all age
parasite prevalence estimates will be imprecise, especially sub-nationally.

Page 45
Case Management Challenges
There are difficulties related to testing and treating pregnant women, especially early pregnancies which are more
difficult to detect, since treatment protocols are different for pregnant and non-pregnant women.
� First, survey implementers must establish whether a woman is pregnant to be able to provide the correct
treatment. Since household surveys do not conduct pregnancy tests, pregnancy status would have to be
based on women’s reports on whether or not they are pregnant. Self-reported pregnancy status is
considered unreliable because many women either do not know they are pregnant or do not want to
divulge this information during early pregnancy. There also may be some bias if any reluctance to discuss
pregnancy is associated with first births, adolescence and other demographic factors.
� If it is established that a woman who tests positive for malaria is pregnant, the trimester of her pregnancy
must be determined in order to follow appropriate treatment protocol. In past surveys in some countries,
it was required that a qualified nurse or equivalent be present in the survey team to conduct a pregnancy
history and determine the trimester so that appropriate treatment could be provided [34, 35].
� In some settings, the first-line treatment for malaria is also used for malaria during pregnancy. However,
in many settings national treatment guidelines depend on the trimester of pregnancy. This may require
that the survey implementers procure more than one type of antimalarial drug in order to treat pregnant
women.
� Some recommended treatments are given over a period of days and thus cannot be administered by
survey personnel. Individuals can be referred to nearby health centers for treatment; however, some
health centers may be very distant from survey households and/or may not have the appropriate
antimalarial drugs.
In sum, one should proceed cautiously when considering extending this indicator to respondents of all ages, but
under some circumstances special studies may be deemed appropriate and an additional indicator should then be
calculated.

Page 46
15. Anemia Prevalence
Proportion of Children Aged 6-59 Months with a Hemoglobin Measurement of <8 g/dL
� Numerator: Number of children aged 6-59 months with a hemoglobin measurement of <8 g/dL
� Denominator: Total number of children aged 6-59 months who had hemoglobin measurements obtained
during household survey
Purpose/Rationale
Anemia, defined by a hemoglobin (Hb) concentration below established cut-off levels, is a widespread public
health problem. Although anemia is not specific to malaria, it can be useful to follow trends in anemia prevalence,
as they can reflect the impact of malaria interventions [27, 28]. Malaria interventions have been associated with a
60 percent reduction in the risk of moderate-to-severe anemia (Hb<8.0 g/dL) [27].
Method of Measurement
Monitoring anemia through household surveys has become a more viable option due to the development of the
HemoCue® test of finger stick blood, which is used to measure Hb distributions in large-scale household surveys.
Anemia should be measured in children 6-59 months old. Surveys should record Hb measurements to the 0.1 g/dL
precision level using a HemoCue® instrument on capillary blood sampled while the child is sitting [28].
An Hb concentration cut-off of less than 7.0 g/dL has been widely used to classify severe nutritional anemia [40,
41] but a different cut-off, 8.0 g/dL, is used to classify malaria-related anemia, as intervention trials have shown
that malaria control reduces the prevalence of moderate-to-severe anemia (below 8.0 g/dL) more so than it
reduces the prevalence of any anemia (below 11.0 g/dL) [27].
Data on altitude should be used to adjust anemia prevalence estimates in countries that have any enumeration
areas above 1,000 meters, as normal hemoglobin distributions vary with altitude. In order to supply a sufficient
amount of oxygen to the tissues, individuals living at higher altitudes must produce more red blood cells to
compensate for lower oxygen partial pressure and decreased oxygen saturation of blood. The recommended
adjustment factors, described by the Centers for Disease Control and Prevention, are available at:
http://www.cdc.gov/mmwr/pdf/rr/rr4703.pdf [42]. When altitude data are not used to adjust results in areas of
high altitude, underestimates of anemia are likely to occur.
Considerations
A potential drawback to this indicator is the seasonal variation in malaria-related anemia, which makes survey
outcomes sensitive to the season of measurement.
As measurement of anemia requires finger stick blood, some caretakers may not consent to anemia testing of their
child. Additionally, survey personnel will require extra training to carry out HemoCue® testing.
Page 47
Interpretation
This indicator provides a proxy measure of the prevalence of malaria-related anemia among children aged 6-59
months at the national level.
Anemia measurement has become a standard component of DHS and some other household surveys. However, it
should be noted that DHS surveys include anemia measurements in the nutrition chapter, using the cut-off value
of less than 7.0 g/dL rather than 8.0 g/dL, necessitating that caution be taken when interpreting and comparing
results.
Use of anemia as a malaria indicator will be compromised by a lack of specificity, particularly in areas with low
malaria transmission, given other anemia determinants such as pediatric HIV/AIDS, malnutrition and helminth
infections. Even in areas of intense malaria transmission, moderate to severe anemia in young children may
depend more on undernutrition than on malaria, and separating malnutrition from malaria as the cause of anemia
is not possible, as the proportions will vary from population to population and cannot be known. Consequently,
data must be interpreted cautiously, with consideration of the many other causes of anemia present in the survey
area.
Additional analysis
Survey reports should tabulate both the prevalence of Hb <8.0 g/dL and the mean hemoglobin level, preferably
with its standard deviation so that the user can derive anemia prevalences with alternative cut-offs by applying a
normal approximation [28]. In survey reports which include sections on both nutrition and malaria, the prevalence
of Hb <7.0 g/dL and the prevalence of Hb <8.0 g/dL should be reported in the appropriate chapters. Consequently,
analyses using both Hb cut-offs will need to be conducted. Furthermore, it should be clearly stated in the text that
the first is measuring severe anemia in order to assess nutritional deficiencies, while the second is measuring
moderate-to-severe anemia in order to assess the impact of interventions on malaria-related anemia.
Page 48
16. All-Cause Under-Five Mortality Rate
Purpose/Rationale
In areas of stable endemicity, the major burden of malaria occurs in very young children who, because they have
not yet developed adequate clinical immunity, are at the highest risk of severe illness and death; globally, malaria
accounts for approximately seven percent of all child deaths [2]. Thus, in areas of stable transmission, malaria
control interventions should have an impact on all-cause under five mortality trends.
Method of Measurement
The under-five mortality rate (U5MR) can be derived from household survey data using direct or indirect methods.
The direct method is used in DHS surveys and requires a birth history that includes information on all children ever
born, their survival status and (for non-surviving children) their age at death, in order to calculate the probability of
dying before age five from children exposed to mortality during the five-year period before the survey. More
specifically, the DHS employs the synthetic cohort life table approach, in which mortality probabilities for small age
segments based on real cohort mortality experience are combined into larger age segments that correspond to the
age group of interest.
In the majority of MICS surveys, U5MR are calculated based on an indirect estimation technique known as the
Brass method. This technique converts the proportion of children who have died among women in a certain age
group into the probability of dying by an exact childhood age. By using model life tables and strong assumptions as
to age patterns and time trends, the mortality rate estimates are indirectly derived, as well as the date to which
they apply. However, some MICS surveys use birth histories to calculate direct estimates of U5MR.
The MIS was conceptualized to provide national-level estimates of malaria infection. As MIS surveys are topic
specific and as most of the malaria indicators of interest do not require a large sample size to measure reliably,
these surveys are typically much smaller in scale than DHS or MICS. MIS surveys are not designed to collect
estimates of child mortality. Standard MIS questionnaires do not include the questions necessary for calculating
mortality rates. Birth history information is collected for children born in the six years immediately preceding the
survey for the main purpose of defining denominators for other indicators. In countries which lack reliable vital
registration systems, accurate estimates of child mortality rates are best obtained through DHS or MICS surveys.
Considerations
U5MR has the benefit of capturing both direct and indirect effects of malaria interventions on under-five mortality,
i.e., the effects on malaria mortality and on mortality from other causes that are influenced by malaria. Changes in
U5MR may, however, be influenced by a variety of factors other than malaria control.
The indicator can be measured reliably and does not suffer from limitations of methods to identify malaria-specific
deaths. However, underenumeration of deaths is always a possibility in household surveys.
Household surveys calculate mortality rates over a five-year period to make sure there are enough cases to
produce reliable results. Therefore, on average, surveys measure under-five mortality with a 2.5 year lag.
Additionally, point estimates of U5MR will be centered at a different time to indicators of intervention coverage
estimated from the same survey.

Page 49
In areas of moderate to high malaria transmission, malaria may account for as much as 30% of under 5 mortality
due to all causes. In these settings, if malaria-specific mortality decreases by 50 percent, a 15-19 percent
reduction in all-cause under-five mortality is generally expected. At the usual sample size, DHS surveys have the
statistical power to confirm under-five mortality reductions between two successive surveys if the true mortality
reduction is 15 percent or larger. Consequently, the ability to detect a reduction in all-cause mortality resulting
from fairly small reductions in malaria deaths may be difficult when relying on this data source.
Estimation methods currently do not account for selection bias that may arise due to high HIV prevalence.
Interpretation
This indicator provides a measure of all-cause under-five mortality at the national level.
Malaria-Specific Mortality
In some cases, verbal autopsies (VA) nested within household surveys may provide information on malaria-specific
mortality at the national level. VA is the process of interviewing the primary caregivers of recently deceased
persons to gather information on the circumstances surrounding death. It requires that the primary caregiver of
the deceased – usually a family member – can recall and recognize symptoms/signs experienced by the deceased
in the period leading up to death. This information is then interpreted by physicians to derive a probable cause of
death. VA can be performed either as part of a mortality survey or by sending interviewers after the survey to
those households in which eligible deaths were identified. This survey-nested approach could provide estimates of
malaria-attributable mortality at the national level. However, due to the low sensitivity and specificity of the tool in
detecting malaria-specific mortality, further research is needed to assess and improve these methodologies.
Other potential sources, such as vital registration systems and HMIS, should also be explored.


Page 51
References
1. World Health Organization. World malaria report. Geneva: WHO (Switzerland); 2012.
2. Liu L, Johnson H, Counsens S, Perin J, Scott S, Lawn J, Rudan I, Campbell H, Cibulskis R, Li M, Mathers C, Black
R. Global, regional, and national causes of child mortality: an updated systematic analysis for 2010 with time
trends since 2000. The Lancet. 2012; 379 (9832), 2151-2161.
3. World Health Organization and Roll Back Malaria Partnership. Global malaria action plan. Geneva: WHO
(Switzerland); 2008.
4. World Health Organization and Roll Back Malaria Partnership. Refined/updated GMAP objectives, targets,
milestones and priorities beyond 2011 [Internet]. Geneva: WHO; [updated 2011 June 12; cited 2012 August
28]. Available at: http://www.rbm.who.int/gmap/gmap2011update.pdf.
5. World Health Organization. Guidelines for the treatment of malaria, second edition. Geneva: WHO
(Switzerland); 2010. 194 p.
6. World Health Organization. Updated WHO policy recommendation: intermittent preventive treatment of
malaria in pregnancy using sulfadoxine pyrimethamine (IPTp-SP). [Internet]. WHO; 2003 [updated 2012 Oct;
cited 2012 Oct 19]. Available from:
<http://www.who.int/mediacentre/factsheets/fs094/en>.
7. UNICEF and Roll Back Malaria Partnership. Malaria & children: progress in intervention coverage. New York
(NY) : UNICEF (US); 2007. 69 p.
8. Lengeler C. Insecticide-treated bed nets and curtains for preventing malaria. Cochrane Database of
Systematic Reviews. 2004 Jan; (2).
9. Lim SS, Fullman N, Stokes A, Ravishankar N, Masiye F, Murray C, Gakidou E. Net benefits: a multicountry
analysis of observational data examining associations between insecticide-treated mosquito nets and health
outcomes. PLoS Med. 2011; 8(9).
10. World Health Organization. Insecticide-treated mosquito nets: a WHO position statement. Geneva: WHO
(Switzerland); 2010. 10 p.
11. United States Government. President’s Malaria Initiative. Technical areas – indoor residual spraying
[Internet]. Washington, DC: USAID, CDC, HHS; 2009 [cited 2012 Aug 28]. Available from:
http://www.fightingmalaria.gov/technical/irs/index.html
12. Macdonald G. The epidemiology and control of malaria. London: Oxford University Press (UK); 1957.
13. Shulman CE, Dorman EK. Importance and prevention of malaria in pregnancy. Trans R Soc Trop Med Hyg.
2003; 97(1), 30–55.
Page 52
14. Steketee RW. Malaria prevention in pregnancy: when will the prevention programme respond to the
science. J Health Popul Nutr. 2002; 20(1), 1–3.
15. Steketee RW, Nahlen B, Parise M, Menendez C. The burden of malaria in pregnancy in malaria-endemic
areas. Am J Trop Med Hyg. 2001; 64 (Suppl. 1–2), 28–35.
16. Ter Kuile FO, Terlouw D, Phillips-Howard P, Hawley W, Friedman J, Kolczak MS, Kariuki SK,Shi YP, Vulule JM,
Nahlen B,. Impact of permethrin-treated bed nets on malaria and all-cause morbidity in young children in an
area of intense perennial malaria transmission in western Kenya: cross-sectional survey. Am J Trop Med Hyg.
2003; 68(Suppl. 4), 100–107.
17. Ter Kuile, FO, Terlouw DJ, Phillips-Howard PA, Hawley WA, Friedman JF, Kariuki SK, Shi YP, Kolczak MS, Lal AA,
Vulule JM, Nahlen BL. Reduction of malaria during pregnancy by permethrin-treated bed nets in an area of
intense perennial malaria transmission in western Kenya. Am J Trop Med Hyg. 2003; 68(Suppl. 4), 50–60.
18. Van Eijk, AM, Ayisi JG, ter Kuilee FO, Misore AO, Otieno JA, Rosen DH, Kager PA, Steketee Rw, Nahlen BL. HIV
increases the risk of malaria in women of all gravidities in Kisumu, Kenya. AIDS. 2003; 17(4), 595–603.
19. Wolfe, EB, Parise ME, Haddix AC, Nahlen BL, Ayisi JG, Misore A, Steketee RW. Cost-effectiveness of
sulfadoxine-pyrimethamine for the prevention of malaria-associated low birth weight. Am J Trop Med Hyg.
2001; 64(3–4), 178–186.
20. World Health Organization. Malaria: Fact sheet no. 94 [Internet]. WHO; 2003 [updated 2012 Apr; cited 2012
Aug 28]. Available from: <http://www.who.int/mediacentre/factsheets/fs094/en>.
21. World Health Organization. Technical expert group meeting on IPTp. Presented at WHO Headquarters.
Geneva, 2007.
22. Ter Kuile F, van Eijk AM, Filler S. Effect of sulfadoxine-pyramethamine resistance on the efficacy of
intermittent preventive therapy for malaria control during pregnancy: a systematic review. JAMA. 2007;
297(23): 2603-2616.
23. D’Alessandro U, Olaleye B, Langerock P, Aikins MK, Thomson MC, Cham MK, Greenwood BM, McGuire W,
Bennett S, Cham, BA. Mortality and morbidity from malaria in Gambian children after introduction of an
impregnated bednet programme. Lancet. 1995; 345(8948), 479–483.
24. Shulman, CE, Staalsoe T, Dorman EK, Kawuondo K, Marsh K, Hviid L. Intermittent sulfadoxine-pyrimethamine
to prevent severe anaemia secondary to malaria in pregnancy: a randomized placebo-controlled trial. Lancet.
1999; 353(9153), 632–636.
25. D'Acremont V, Lengeler C, Genton B. Reduction in the proportion of fevers associated with Plasmodium
falciparum parasitaemia in Africa: a systematic review. Malar J. 2010; 9(240).
26. Beier JC, Killeen GF, Githure JI. Short report: entomological inoculation rates and Plasmodium falciparum
malaria prevalence in Africa. Am J Trop Med Hyg. 1999; 61:109-113.

Page 53
27. Korenromp EL, Armstrong-Schellenberg J, Williams B, Nahlen B, Snow RW. Impact of malaria control on
childhood anemia in Africa – a quantitative review. Trop Med Int Health. 2004; 9(10): 1050-1065.
28. Roll Back Malaria Partnership. Monitoring and Evaluation Reference Group Anemia Task Force Meeting
Minutes. Presented at WHO Headquarters. Geneva:2003 Oct 27-28.
29. Roll Back Malaria Partnership. Monitoring and Evaluation Reference Group. Assessing the impact of malaria
control activities on mortality among African children under 5 years of age. [Internet] 2007 [cited 2012 Aug
28] Available from:
http://www.rbmwho.int/partnership/wg/wg_monitoring/docs/MERGGuidanceNote_MalariaImpactAssessm
ent.pdf
30. Rowe AK, Steketee RW, Arnold F, Wardlaw T, Basu S, Bakyaita N, Lama M, Winston CA, Lynch M, Cibulskis R,
Shibuya K, Ratcliffe A, Nahlen B. for the Roll Back Malaria Monitoring and Evaluation Reference Group
(MERG). Evaluating the impact of malaria control efforts on mortality in sub-Saharan Africa. Trop Med Int
Health. 2007; 12 (12): 1524-1539.
31. World Health Organization. Malaria rapid diagnostic test performance results of WHO product testing of
malaria RDTs: round 3 (2010-2011). Geneva: WHO (Switzerland); 2011. 109 p.
32. Bhattarai A, Ali AS, Kachur SP, Mårtensson A, Abbas AK, Khatib R, Al-Mafazy AW, Ramsan M, Rotllant G,
Gerstenmaier JF, Molteni F, Abdulla S, Montgomery SM, Kaneko A, Björkman A. Impact of artemisinin-based
combination therapy and insecticide-treated nets on malaria burden in Zanzibar. PLoS Med. 2007 Nov; 4(11):
e309.
33. Kleinschmidt I, Schwabe C, Benavente L, Torrez M, Ridl FC, Segura JL, Ehmer P, Nchama GN. Marked increase
in child survival after four years of intensive malaria control. Am J Trop Med Hyg. 2009; 80:882–888.
34. Government of Southern Sudan. Ministry of Health. Southern Sudan Centre for Census Statistics and
Evaluation, PSI, Malaria Consortium, MSH, UNDP, UNICEF and WHO. Southern Sudan malaria indicator
survey. Sudan, 2010.
35. Noor AM. Djibouti national malaria indicator survey 2008-2009. Submitted to the World Health Organization,
Eastern Mediterranean Regional Office. Cairo: WHO (Egypt); 2009 Mar.
36. Adam I, IE AE, Salih I, Elbashir MI. Submicroscopic Plasmodium falciparum infections during pregnancy, in an
area of Sudan with a low intensity of malaria transmission. Ann Trop Med Parasitol. 2005; 99:339-344.
37. Anchang-Kimbi JK, Achidi EA, Nkegoum B, Sverremark-Ekstrom E, Troye-Blomberg M. Diagnostic comparison
of malaria infection in peripheral blood, placental blood and placental biopsies in Cameroonian parturient
women. Malar J. 2009; 8:126.
38. Leke RF, Djokam RR, Mbu R, Leke RJ, Fogako J, Megnekou R, Metenou S, Sama G, Zhou Y, Cadigan T, Parra M,
Taylor DW. Detection of the Plasmodium falciparum antigen histidine-rich protein 2 in blood of pregnant
women: implications for diagnosing placental malaria. J Clin Microbiol. 1999 Sep;37(9):2992-6.
Page 54
39. Kyabayinze DJ, Tibenderana JK, Nassali M, Tumwine LK, Riches C, Montague M, Counihan H, Hamade P, Van
Geertruyden J, Meek S. Placental Plasmodium falciparum malaria infection: operational accuracy of HRP2
rapid diagnostic tests in a malaria endemic setting. Malar J. 2011; 10:306.
40. World Health Organization. Nutritional anaemias. Report of a WHO scientific group. Geneva: WHO
(Switzerland); 1968. 37 p.
41. DeMaeyer EM, Joint WHO/UNICEF Nutrition Support Programme. Preventing and controlling iron deficiency
anaemia through primary health care: a guide for health administrators and programme managers. Geneva:
WHO (Switzerland); 1989. 58 p.
42. Centers for Disease Control and Prevention. Recommendations to control and prevent iron deficiency in the
United States. Morbidity and Mortality Weekly Report. Atlanta (GA): CDC (US); 1998. 47(RR-3): 1.29.
Page 55
Annex 1: Previously Recommended Indicators
The following indicators were previously recommended by the RBM MERG but are no longer recommended.
H1. Proportion of Children under Five Years Old with Fever in the Last Two Weeks Who Received Any
Antimalarial Treatment
� Numerator: Number of children under five years old who had a fever in the previous two weeks who
received any antimalarial treatment
� Denominator: Total number of children under five years old who had a fever in the previous two weeks
H2. Proportion of Children under 5 Years Old with Fever in Last 2 Weeks Who Received Antimalarial Treatment
according to National Policy within 24 Hrs from Onset of Fever
� Numerator: Number of children under five years old who had a fever in the previous two weeks who
received recommended antimalarial treatment according to national policy within 24 hours from onset of
fever
� Denominator: Total number of children under five years old who had a fever in the previous two weeks
Purpose/Rationale
The intention of the indicators was to capture the utilization of antimalarial treatment to children under five years
old with fever. The indicators have become problematic as diagnostic testing has scaled up; they do not take into
account the fact that some febrile children will be given a diagnostic test and those that test negative should not
be given an antimalarial medicine. As a result, countries or areas with more accessible health services and
diagnostic testing can produce lower values of the indicator than those with weaker health services. In addition,
for those children that are not tested, the indicators do not provide a good guide to the appropriateness of
treatment since in most epidemiological settings the proportion of fever cases that have evidence of malaria
parasitemia is low (less than 30 percent) [26].
Page 56
Annex 2: Sample Stata® Code for Calculating Intermediate Variable for Indicator 3 –
Proportion of Population with Access to an ITN within Their Household
The calculation of Indicator 3 – Proportion of Population with Access to an ITN within Their Household (page 20)
needs an intermediate variable which is “potential users.” It can be calculated by multiplying the number of ITNs in
each household by two. The product of this calculation may be greater than the number of individuals who spent
the previous night in a household if a household has more than one ITN for every two people. In this case, the
“potential users” variable in that household should be modified to reflect the number of individuals who spent the
previous night in the household, because the number of potential users in a household cannot exceed the
individuals who spent the previous night in that household.
The indicator can then be calculated by dividing the sum of all potential ITN users in the sample by the total
number of individuals who spent the previous night in surveyed households. An example of the Stata® code used
to calculate this indicator is provided below.
Sample Stata®, Version 12 Code
* create access variable in individuals file (household roster)
* variable " numitnhh " is the number of ITN per household from the household file
* variable "sleep" is the de-facto residency (slept in the household the night before) yes=1, no=0
* variable "hhid" is the unique identifyier for the household
gen potuse= numitnhh *2
label var potuse "potential ITN users in hh"
bysort hhid: gen access=potuse/sleep>1
svy: mean access if sleep==1