center&for&financial&security&family&financial
TRANSCRIPT
Center for Financial Security Family Financial Security Webinar Series
October 9, 2012
Financial Inclusion
Sponsored by a grant from the UW-Madison School of Human Ecology Beckner Endowment

Moving to Electronic Social Security Payments: Impact on the Unbanked Drew M. Anderson, UW – Madison Alexander Strand, SSA J. Michael Collins, UW – Madison
October 2012
The research reported herein was performed pursuant to a grant from the U.S. Social Security Administration (SSA) funded as part of the Financial Literacy Research Consortium. The opinions and conclusions expressed are solely those of the author(s) and do not represent the opinions or policy of SSA, any agency of the Federal Government, or the Center for Financial Security at the University of Wisconsin – Madison.
Two populations • Unbanked: do not use checking or
savings accounts
• Social Security • Old Age and Survivors Insurance (OASI) • Disability Insurance (DI) • Supplemental Security Income (SSI)

The US population in percentiles • 7% unbanked • 18% SSA
• 14% non-disability payments
• 4% disability • 1% overlap
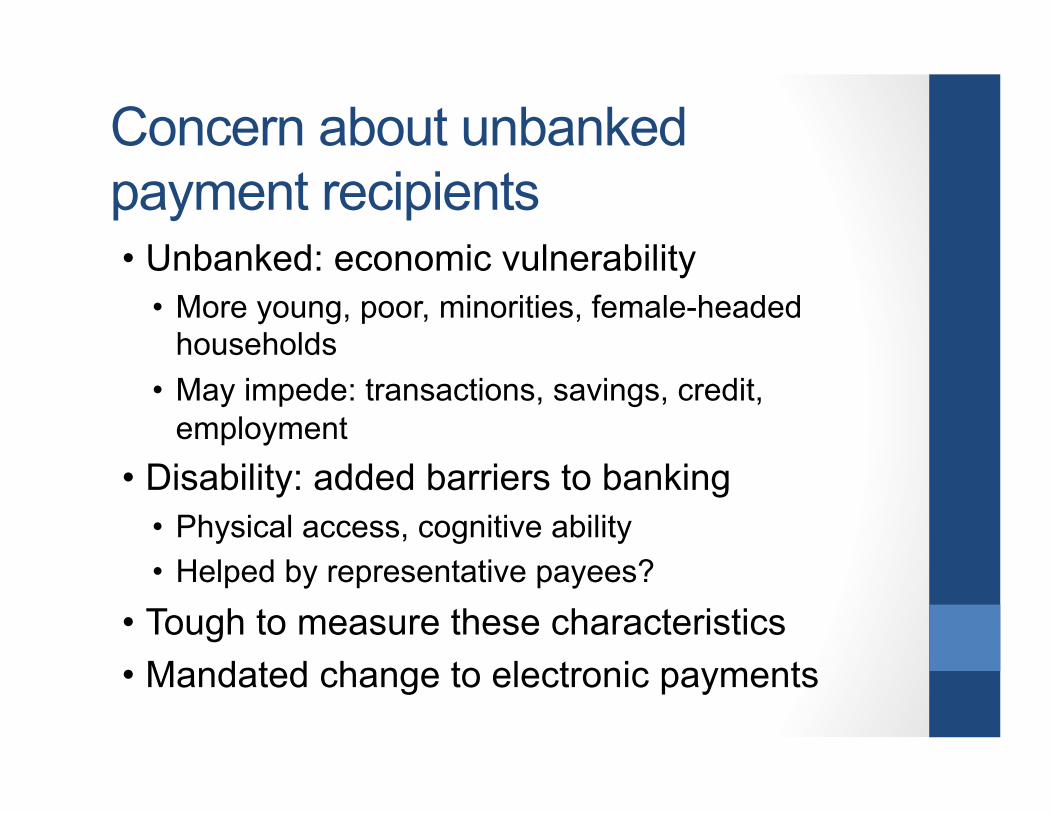
Concern about unbanked payment recipients • Unbanked: economic vulnerability
• More young, poor, minorities, female-headed households
• May impede: transactions, savings, credit, employment
• Disability: added barriers to banking • Physical access, cognitive ability • Helped by representative payees?
• Tough to measure these characteristics • Mandated change to electronic payments

Moving to electronic payments
• New US Treasury policy: all nontax payments electronic by March 2013 • Projected govt. savings > $100M per year • Paperless = green
• Can we predict the effects on recipients? • 80% of nontax payments are for SSA • Banked: switch to direct deposit • Unbanked: Direct Express ® prepaid card


Research goals Characterize: 1. Bank use among payment recipients 2. Soc. Sec. payment methods chosen,
especially by unbanked • Do survey reports accurately capture access to
electronic payments? 3. Groups likely to be (adversely) affected by
mandated electronic payments

Strategy: link data sets • FDIC unbanked survey (Jan. 2009 CPS)
• Whether unbanked and reasons • Demographics
• SSA payment records (Mar. 2009 CPS) • Which SSA program • Method of payment: paper/electronic, self/
representative • N=47,781 after match using CPS structure • Study actual Jan. 2009 payments

Unbanked among SSA recipients Our estimates Other estimates
US population 6.6% FDIC 2009: 8.4%
All SSA 6.3% -- OASDI 3.4% US GAO / SIPP: 23% SSI 26.3% US GAO / SIPP: 67% SSA paper check recipients OASDI 12.0% Directed surveys: 20-30%
SSI 34.9% Directed surveys: 55-70%
Sources: Booz Allen Hamilton (1997), Dove Associates (1999), US General Accounting Office (2002), Federal Reserve Bank of St. Louis (2004), KRC Research (2007).

Why our estimates are lower • CPS matching process loses changing
households • FDIC sample
• Representative CPS vs. small surveys • Administrative identification of recipients
• SIPP self-reports may understate • FDIC year 2009
• Unbanked trended down over 2000s
• Qualitative relationship holds: SSI more unbanked

Payment methods chosen by unbanked • Many unbanked recipients (by self-report) get
electronic payments (admin. records)
0% 10% 20% 30% 40% 50% 60% 70% 80% 90% 100%
Banked
Unbanked
Electronic payment Paper check

Why “unbanked” have electronic access • Representative payees out of
household • Direct Express ® enrollment • Other nonbank accounts • Changes within Jan. 2009
• Misreporting
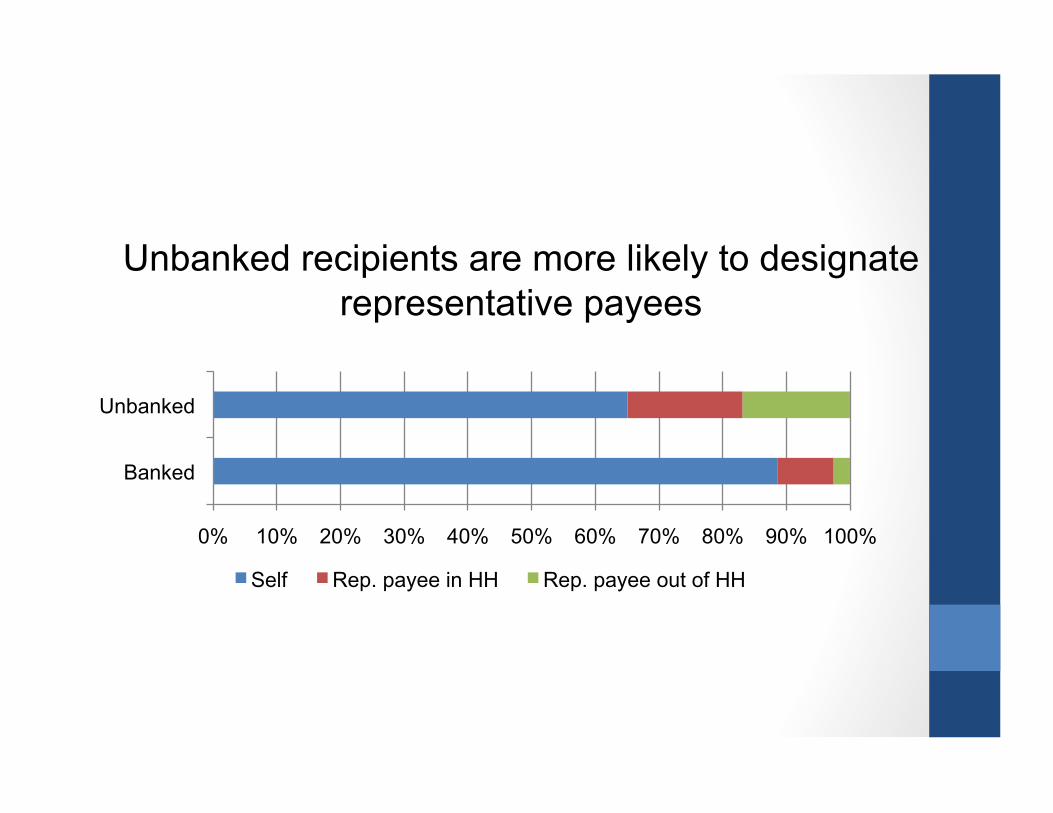
0% 10% 20% 30% 40% 50% 60% 70% 80% 90% 100%
Banked
Unbanked
Self Rep. payee in HH Rep. payee out of HH
Unbanked recipients are more likely to designate representative payees


Misreporting • Different definitions
• “Bank” • “Household” • SSA payments part of regular finances?
• Lack of knowledge • Generational • Disability


Measurement error • Survey reports are prone to error
• Bound et al. (2001) chapter reviews errors in reporting earnings, assets, transfer income, health status, employment, etc.
• We add transaction accounts to the list • Misreporting positively correlated with disability
• Next step: add up rough measures of sources of misreporting
• Even if banking is measured perfectly, it is not a perfect indicator of financial inclusion

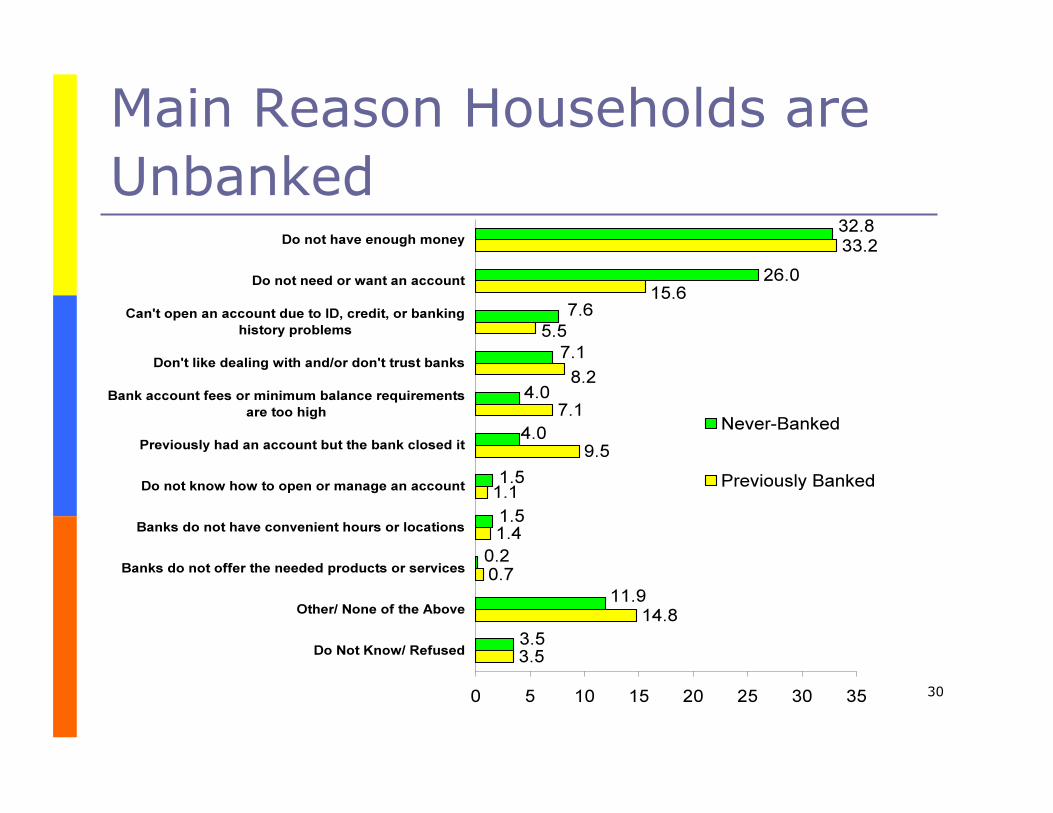
Reasons for being unbanked among payment recipients
11% 65% 23%
Possibly hurt by electronic payments.
Possibly helped by expanded set of financial services (prepaid debit card).
Express preferences against banking “Not enough money” and others Helped by low-cost, no-min-balance card
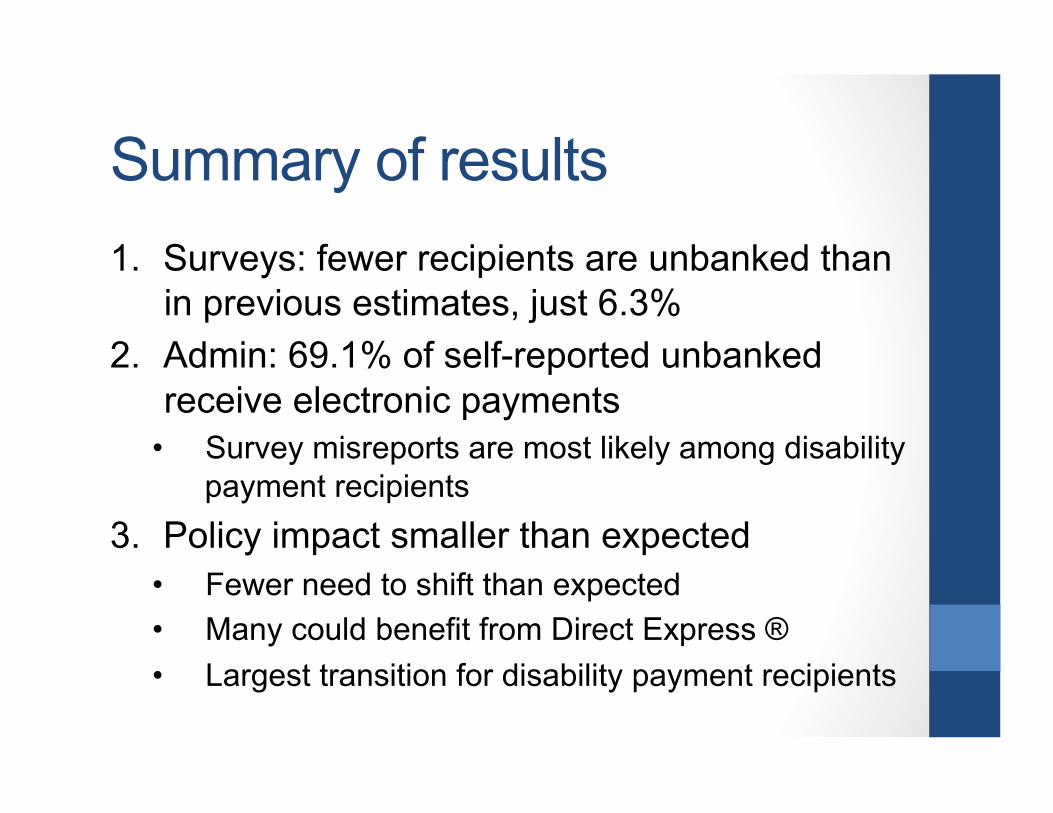
Summary of results 1. Surveys: fewer recipients are unbanked than
in previous estimates, just 6.3% 2. Admin: 69.1% of self-reported unbanked
receive electronic payments • Survey misreports are most likely among disability
payment recipients 3. Policy impact smaller than expected
• Fewer need to shift than expected • Many could benefit from Direct Express ® • Largest transition for disability payment recipients
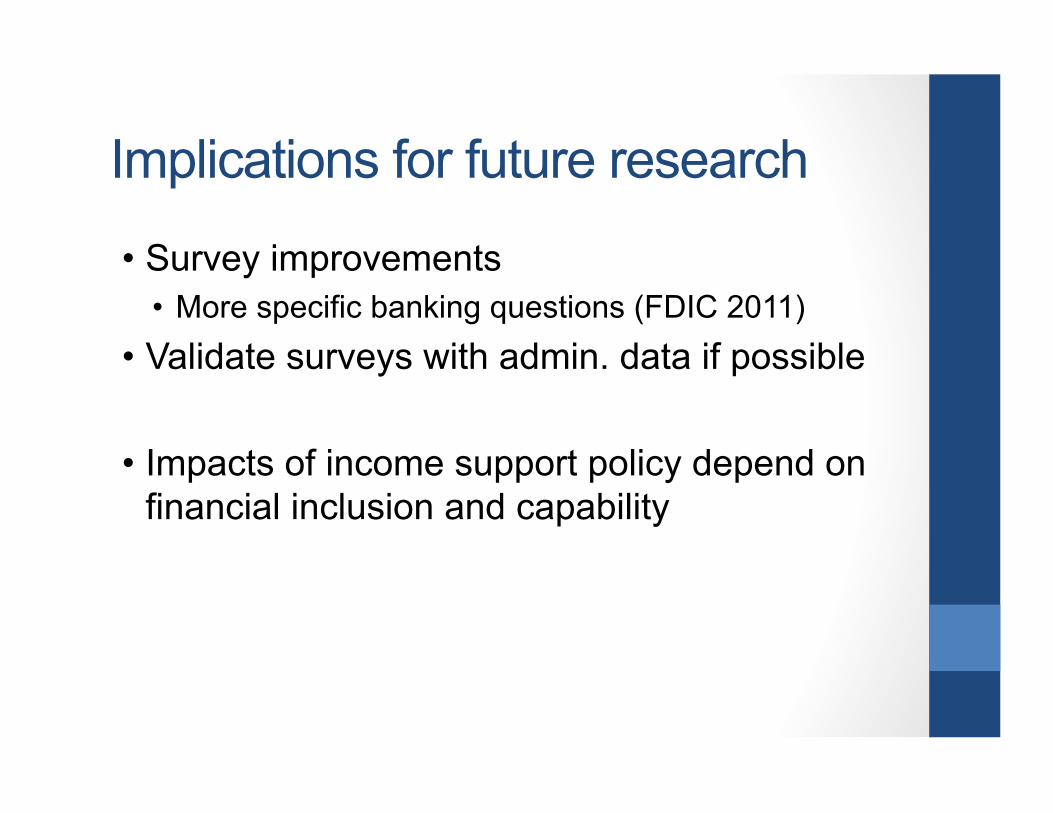
Implications for future research
• Survey improvements • More specific banking questions (FDIC 2011)
• Validate surveys with admin. data if possible
• Impacts of income support policy depend on financial inclusion and capability

Discussant Susan Burhouse
Senior Consumer Researcher
FCIC Division of Depositor and Consumer ProtecAon

24
Overview of the 2011 FDIC National Survey of Unbanked and Underbanked Households
Center for Financial Security October 9, 2012
Susan Burhouse FDIC Division of Depositor and Consumer Protection

25
Background Objectives and statutory mandate
FDIC household survey Administered in June 2011 as a supplement to the
Census CPS to nearly 45,000 households (84% of CPS respondents)
Designed to yield estimates of the number of unbanked and underbanked households; their demographic characteristics, and the reasons why they are unbanked and underbanked
First survey administered in January 2009 and released in December 2009
FDIC bank survey Results scheduled to be released in 2012

26
Distribution of Household Banking Status

27
Unbanked and Underbanked Rates for Select Groups
Percent Percent Percent Select Demographic Groups Unbanked Underbanked Fully Banked
All households 8.2 20.1 68.3 Blacks 21.4 33.9 41.6 Hispanics 20.1 28.6 48.7 Foreign-born noncitizens 22.2 28.9 45.8 Unemployed householder 22.5 28.0 47.5 Income below $15,000 28.2 21.6 47.6 Unmarried female family
households 19.1 29.5 48.4 Under age 24 householder 17.4 31.0 49.7

28
Unbanked Households by Region and State

29
Previous Banking Status of Unbanked Households
30
Main Reason Households are Unbanked
31
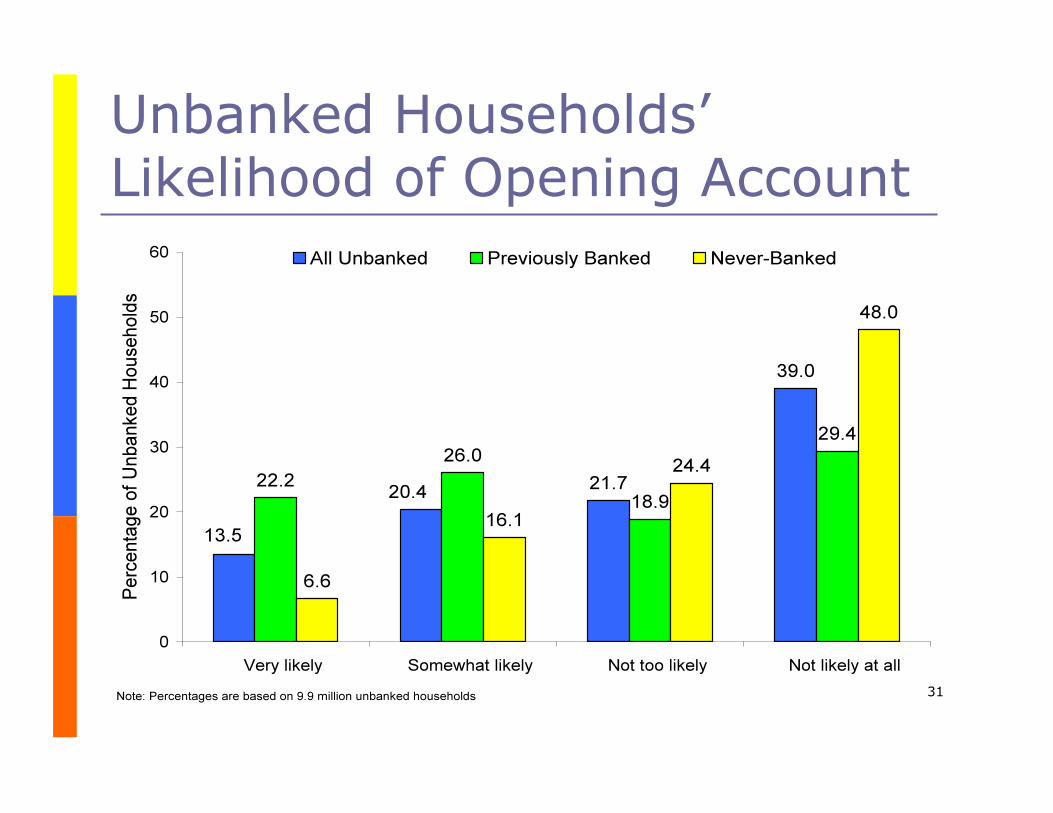
Unbanked Households’ Likelihood of Opening Account

32
Unbanked Households’ Reasons for Wanting to Open an Account

33
Account Ownership

34
Account Ownership by Income

35
Households’ Use of Transaction and Credit AFS in the Last Year

36
Timing of AFS Use
* *

37
Prepaid Debit Use by Banking Status
38
Implication 1
Understanding segments better might increase the efficacy of economic inclusion strategies
E.g., unbanked Hispanic households use AFS more actively than any other racial ethnic group (52% used AFS in the last 30 days), but 30% use no AFS

39
Implication 2
Having a bank account does not guarantee long term participation in the banking system
Half of all unbanked households had an account previously
Nearly half (48.2 percent) of these report they are likely to open another
Almost one-quarter of fully banked households used AFS in the past

40
Implication 3
Experience with banks appears to have more positive perceptions of having an account and rely less on AFS
E.g., unbanked households that previously had an account are more likely to see value in being in the banking system:
More likely to open an account Less likely to say “I don’t want or need an account”

41
Implication 4 Banks might need to more clearly
demonstrate the value of an account to AFS users
AFS users perceived non-bank services to be more convenient, faster, less expensive, or to present lower barriers to qualification
E.g., mobile technologies that allow remote deposit capture might alter check cashing equation

42
www.economicinclusion.gov


Discussant
Michael Morris
ExecuAve Director NaAonal Disability InsAtute
NATIONAL DISABILITY INSTITUTE
Build a Better Economic Future for Individuals with Disabilities and Their Families
www.realeconomicimpact.org Presenter:
Michael Morris, JD Executive Director
National Disability Institute [email protected]
45

National Disability Institute
Build a better economic future for Americans with disabilities Founded 2002 Non-Profit Status 2006
Increase economic and employment opportunities for people with disabilities through education and training as national technical assistance lead with Department of Labor nationwide. Expand access to economic mainstream (tax and financial education) for low- to moderate-income people with disabilities through the Real Economic Impact Tour in 100 cities touching over 500,000 annually. Modernize disability public policy through congressional education, briefings and national advocacy. Build strategic partnerships that leverage opportunities that empower community inclusion, employment and promote disability inclusive practices and services. Partner with over 800 community-based partners and 40 national organizations in the private and public sectors and corporate affinity groups. Contribute to growing awareness of the economic and employment needs of people with disabilities through participatory and controlled research.
MISSION OBJECTIVES
Strategies
Public Policy Reform Public Education Public-Private Partnerships Research
47
MANDATED DEBIT CARDS: A BAD DEAL FOR PEOPLE WITH DISABILITIES AND OTHER LOW INCOME
AMERICANS
Loss of benefits due to surcharge fees at ATMs
Challenges with Customer Service Challenges with Identity Theft
What We Learned

Who We Met With
Senate HELP Committee CFPB Administration on Community Living, HHS SSA

Questions
1. By outsourcing to Comerica, how much revenue is being generated by SS beneficiaries with ATM transactions?
2. What efforts are being made to help explain to unbanked SS beneficiaries the upcoming March 2013 deadline and improve their understanding in how to use the prepaid debit card?
51

3. Should there be any cost to beneficiaries for the use of the card to access their benefits?
4. Will SSA and Treasury publically disclose the terms of the Comerica contract and how much in addition is being collected monthly in transaction fees?
Questions

Questions
5. What better consumer protections can be put in place that prevent the growing ID theft problems?
6. Why can’t Treasury negotiate an elimination of ATM surcharge fees?
53

For More Information
CONTACT:
Michael Morris, Executive Director
1667 K Street, NW, Suite 640
Washington, DC 20006
202-296-2046

Q&A

Save the Date:
November Webinar Tuesday, November 13, 2012
1pm-2pm Central
Katherine Dahlem, Abt Associates Findings from Focus Groups: Financial and Future Planning for
Siblings with Special Needs
cfs.wisc.edu/webinars