center for injury research & policy. pediatric injury prevention research: where have we been?...
TRANSCRIPT

Center for Injury Research & Policy

Pediatric Injury Prevention Research:
Where have we been?
Where should we be going?
Andrea C. Gielen, ScD, ScM
Professor and Director
Johns Hopkins Center for Injury Research and Policy
December 2, 2009
Outline
• Pediatric injury as a public health problem
• Successes in pediatric injury prevention
• Collaborative research examples
• Future needs and opportunities

INJURY

Global Burden
• 875,000 Children and adolescents die annually
• 95% are from low and middle income countries
• Motor vehicle crashes and drowning are among the top 10 causes of death
• WHO launches the first “world report on child injury prevention”, December 10, 2008
http://whqlibdoc.who.int/publications/2006/9241593385_eng.pdf

20%
45
Productivitylosses due todeath
Productivitylosses due todeath
Productivitylosses due todisability
Productivitylosses due todisability
Medical and Medical and related costsrelated costsMedical and Medical and related costsrelated costs
45%
20%
35%
CDC, 2006
Lifetime Cost of Injury in the US: $406 Billion
For Children (0-14)
$50.5 Billion Total
$11.9 Billion Medical


Deaths are only the tip of the injury iceberg . . .
7,273 Deaths
136,635 Hospitalizations
11.2 Million Medical Visits
1
19
1,544
Finkelstein EA, Corso PS, Miller TR. The Incidence and Economic Burden of Injuries in the United States, New York, NY: Oxford University Press, 2006
U.S. Children Ages 0-14
SUCCESS

1987 – 2004 Unintentional Injury Deaths, Ages 0-14, United States
Source: National Center for Health Statistics. Centers for Disease Control and Prevention. National Vital Statistics System. WISQARS Injury Mortality Reports, 1987 to 2004. Hyattsville (MD): National Center for Health Statistics, 2007. Published in Safe Kids Worldwide (SKW). Childhood Injury Trends Fact Sheet. Washington (DC): SKW, 2007.
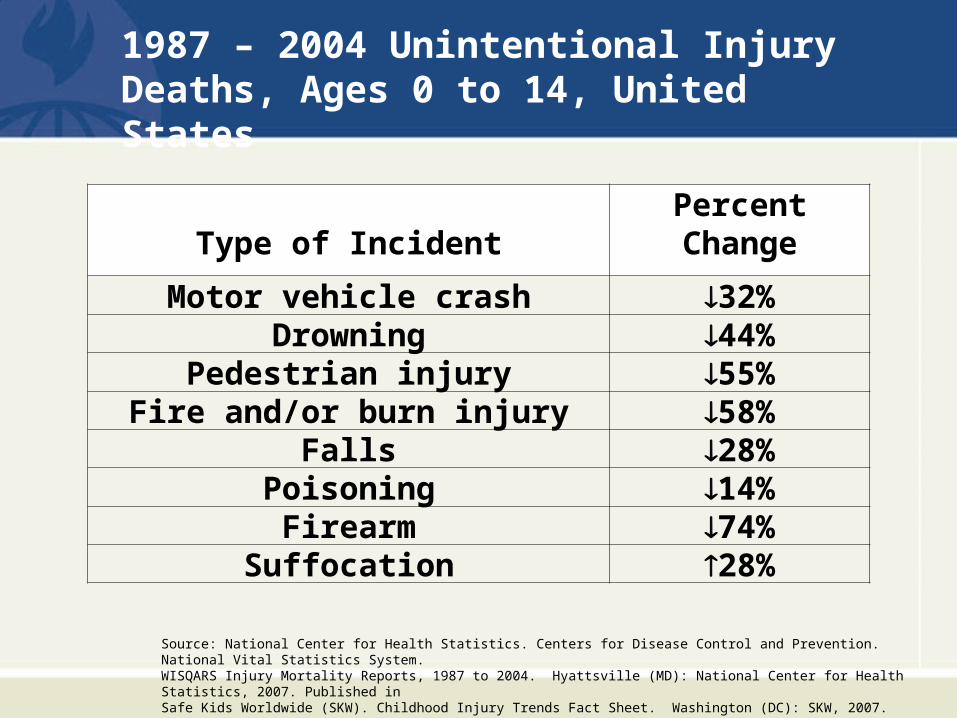
Type of IncidentPercentChange
Motor vehicle crash 32%Drowning 44%
Pedestrian injury 55%Fire and/or burn injury 58%
Falls 28%Poisoning 14%Firearm 74%
Suffocation 28%
1987 – 2004 Unintentional Injury Deaths, Ages 0 to 14, United States
Source: National Center for Health Statistics. Centers for Disease Control and Prevention. National Vital Statistics System. WISQARS Injury Mortality Reports, 1987 to 2004. Hyattsville (MD): National Center for Health Statistics, 2007. Published in Safe Kids Worldwide (SKW). Childhood Injury Trends Fact Sheet. Washington (DC): SKW, 2007.

Science of Injury Control
19911984, 1991
Haddon, W Jr: "On the escape of tigers: an ecologic note." American Journal of Public Health (1970), 60(12):2229-2234.
HADDON MATRIX Host Vehicle Environment
Pre-event
Event
Post-event

Effective Interventions Discovered

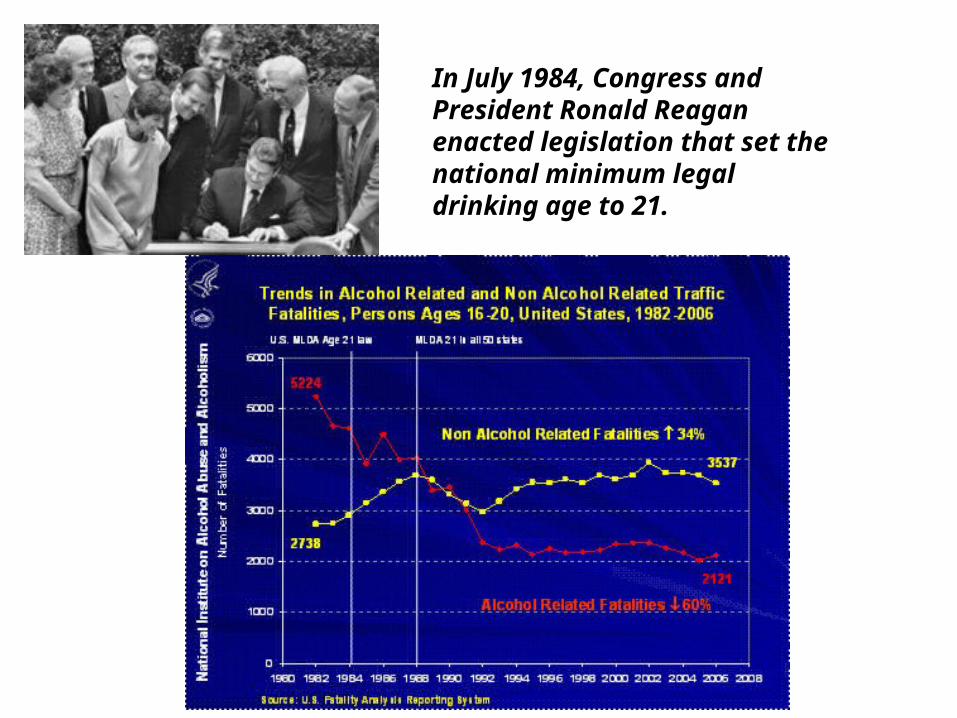
In July 1984, Congress and President Ronald Reagan enacted legislation that set the national minimum legal drinking age to 21.
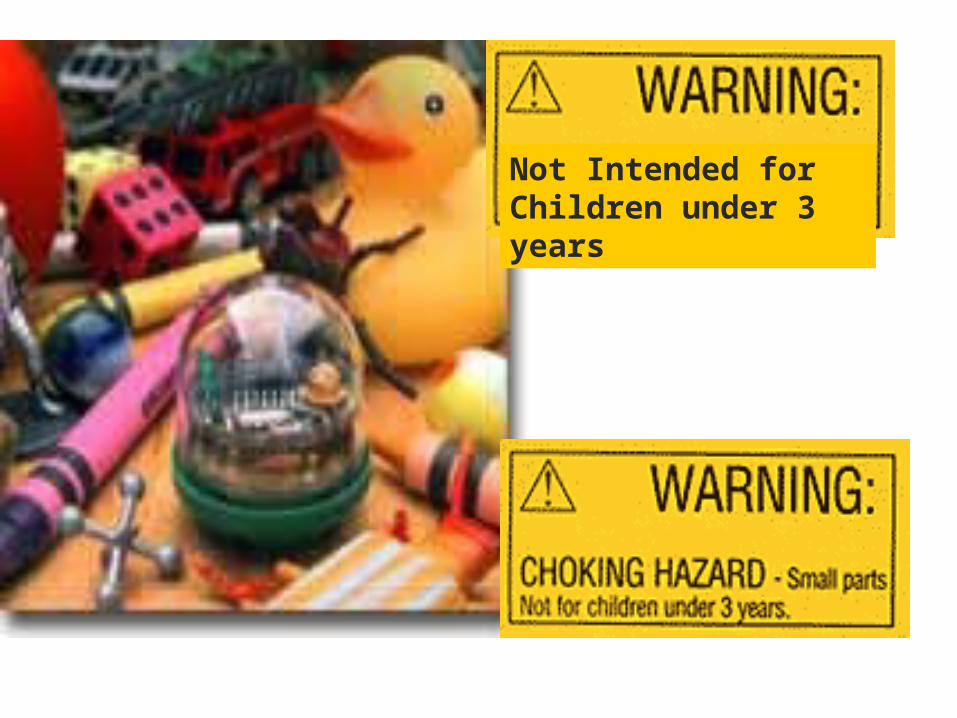
Not Intended for Children under 3 years
COLLABORATION
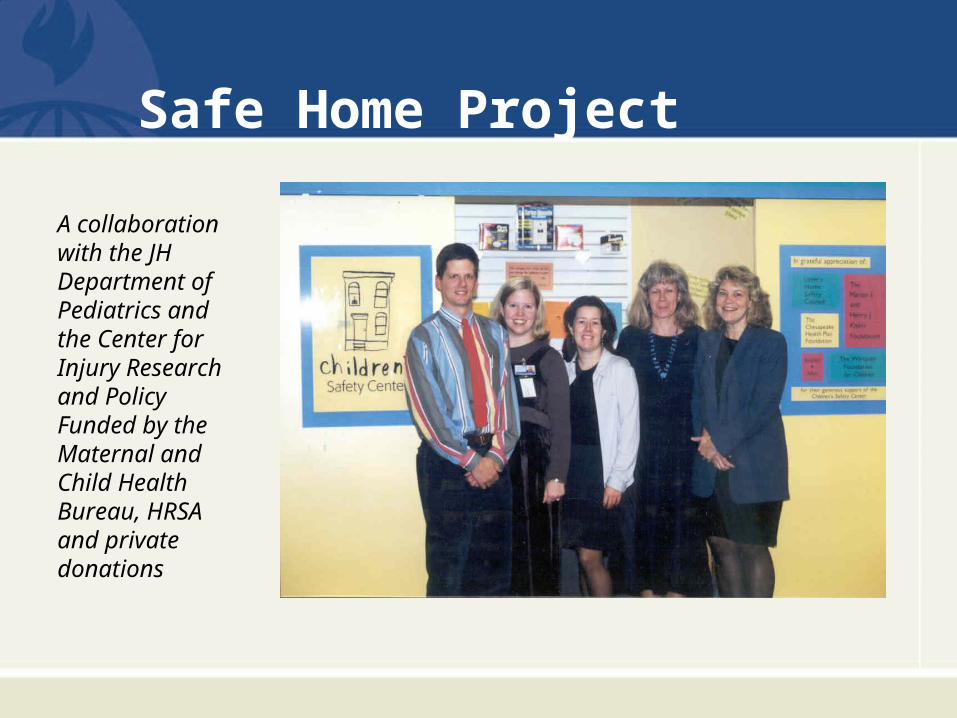
Safe Home Project
A collaboration with the JH Department of Pediatrics and the Center for Injury Research and Policy Funded by the Maternal and Child Health Bureau, HRSA and private donations

SAFE Home Project
Program Components:
Pediatric Counseling
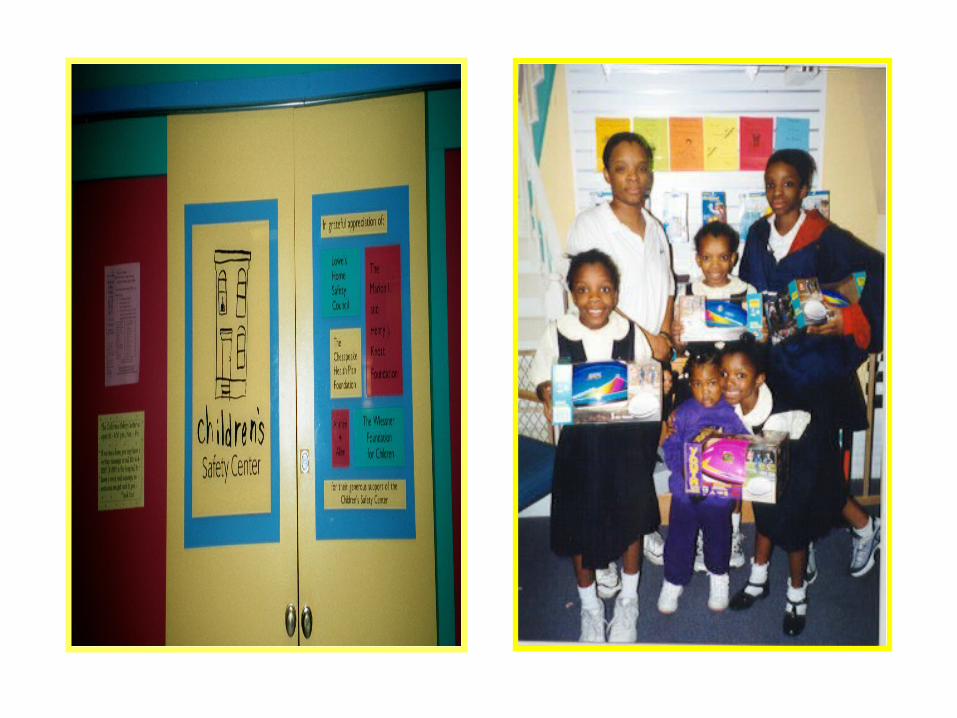
Children’s Safety Center
Home Visit
Caregiver:
KnowledgeBeliefsSkills
Social support
Access to resources
Safety Behaviors:
Smoke alarmsCabinet locks[Syrup of Ipecac]
Safety gatesSafe hot water
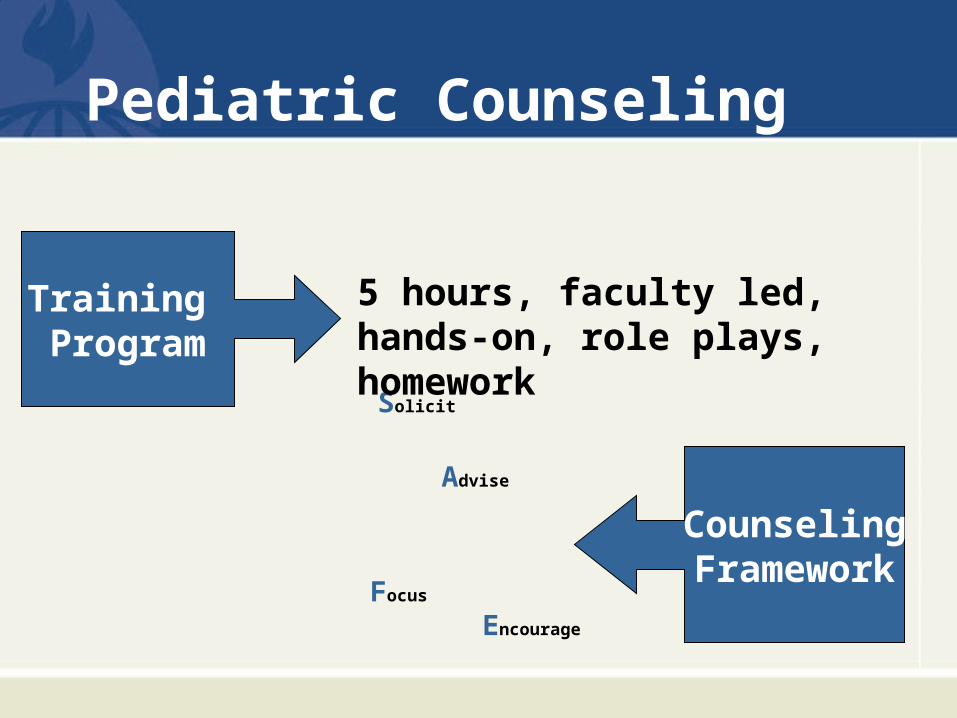
Pediatric Counseling
Solicit
Advise
Focus
Encourage
CounselingFramework
5 hours, faculty led, hands-on, role plays, homework
Training Program

SAFER Counseling Framework• Solicit Information
– Ask about current practices– Use open-ended questions first
• Advise Parent– Recommend parent correct hazard or behavior– Provide information about countermeasures
• Focus on Perceptions of Risk and Barriers– Educate parent about risk– Acknowledge difficulties and barriers
• Encourage Compliance– Acknowledge any progress parent has made toward an injury
prevention goal– Reinforce parents’ intentions to adopt behaviors
• Review Resources and Refer– Describe retail and community options for obtaining safety products– Refer to services / agencies when available

Free personalizededucation
Reduced cost safety supplies
Children’s Safety Center

Home Visits
• Community health workers
– Identify hazards in client’s home
– Personalize education/coach on installation
– Refer to the Children’s Safety Center
HOME VISITSCommunity health workers:
• Identify hazards in client’s home
• Personalize education/coach on
installation
• Refer to the Children’s Safety
Center
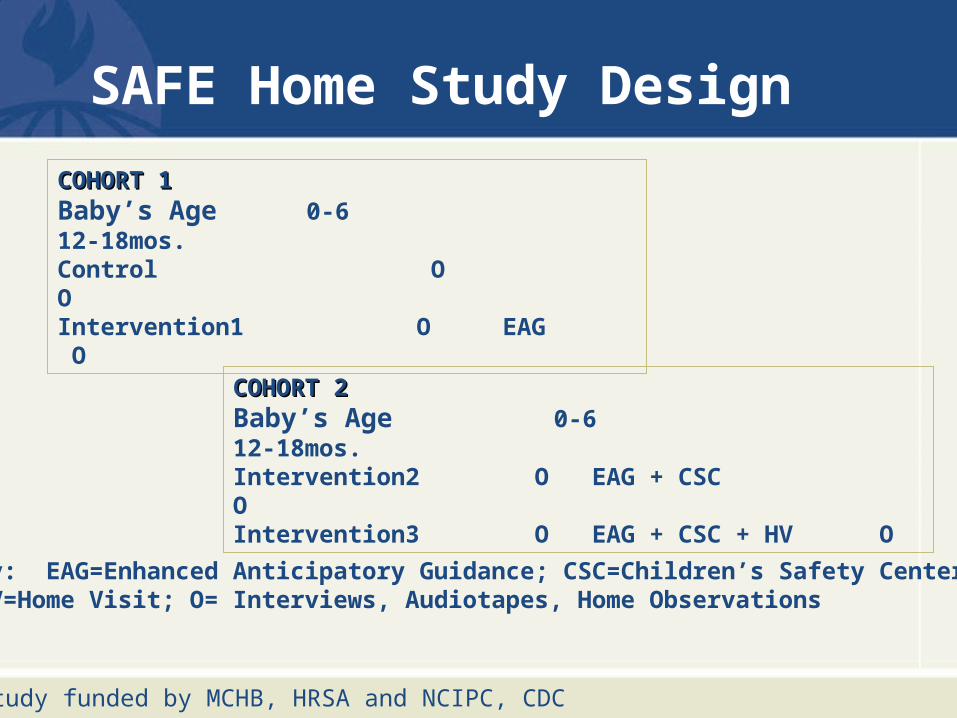
SAFE Home Study Design
COHORT 1COHORT 1Baby’s Age 0-6 12-18mos.Control O OIntervention1 O EAG O
COHORT 2COHORT 2Baby’s Age 0-6 12-18mos.Intervention2 O EAG + CSC OIntervention3 O EAG + CSC + HV O
Key: EAG=Enhanced Anticipatory Guidance; CSC=Children’s Safety Center; HV=Home Visit; O= Interviews, Audiotapes, Home Observations
Study funded by MCHB, HRSA and NCIPC, CDC
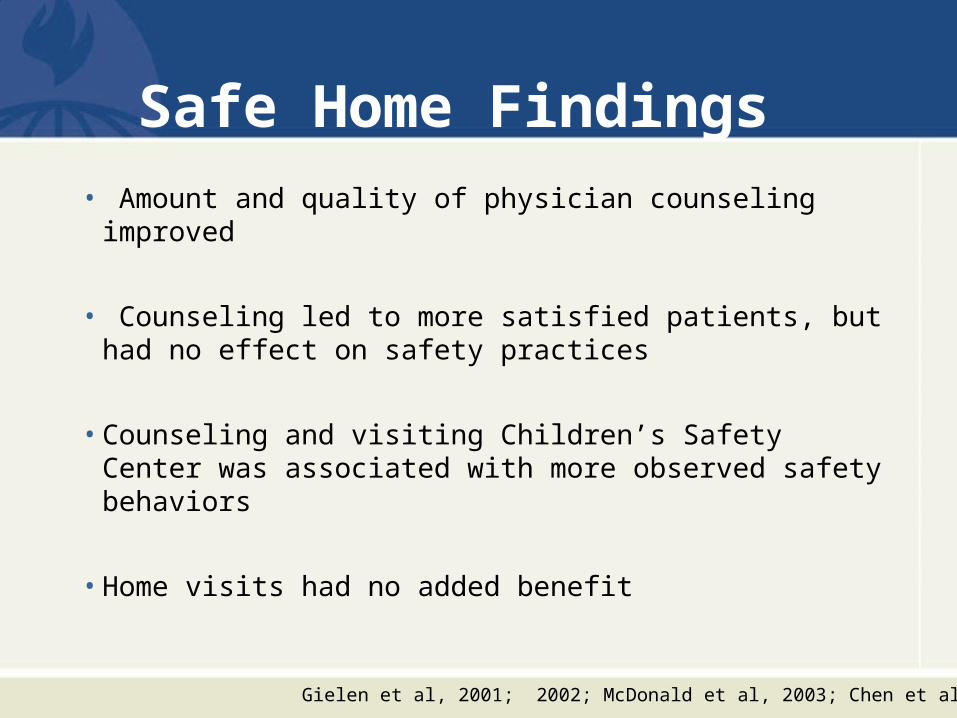
Safe Home Findings
• Amount and quality of physician counseling improved
• Counseling led to more satisfied patients, but had no effect on safety practices
• Counseling and visiting Children’s Safety Center was associated with more observed safety behaviors
• Home visits had no added benefit
Gielen et al, 2001; 2002; McDonald et al, 2003; Chen et al, 2003

CSC Evaluation (1997-2008)
Hours..................................................M-F 11a-4p
Visitors...............................................15,000 (100% adults)
Average/month
Sales.......................................................$350
Outreach.......................................................7
Average/year
CS Loans/Sales........................................160
CS Installs/Checks……………………......198
Adapted from: Gielen, A.C., McDonald, E.M., Wilson, M.E.H., Hwang, W.T., Serwint, J.R., Andrews, J.S. & Wang, M.C. (2002). Effects of improved access to safety counseling, products, and home visits on Parents’ safety practices. Arch Pediatr Adolesc Med, 156: 33-40.

Impact of the collaboration….
• Sustained program of services through the Children’s Safety Center
• Model for other Children’s Hospitals• New research
– East Baltimore Community
– Harriet Lane Primary Care
– Johns Hopkins Health Care
– Johns Hopkins Pediatric Emergency Department

East Baltimore Community CARES Safety Center
Partners: Baltimore City Fire Department ; Johns Hopkins Center for Injury Research and Policy; Johns Hopkins Children’s Safety Center ; Johns Hopkins Pediatric Trauma Service; East Baltimore Medical Center, Johns Hopkins Health Care; Maryland Science Center; Maryland Institute College of Art (MICA)
Research Grants: Centers for Disease Control, NCIPC; National Institutes of Health, NICHD
Funders
FEMA
BP
Annie E Casey Foundation
Weinberg Foundation
CareFirst BlueCross BlueShield
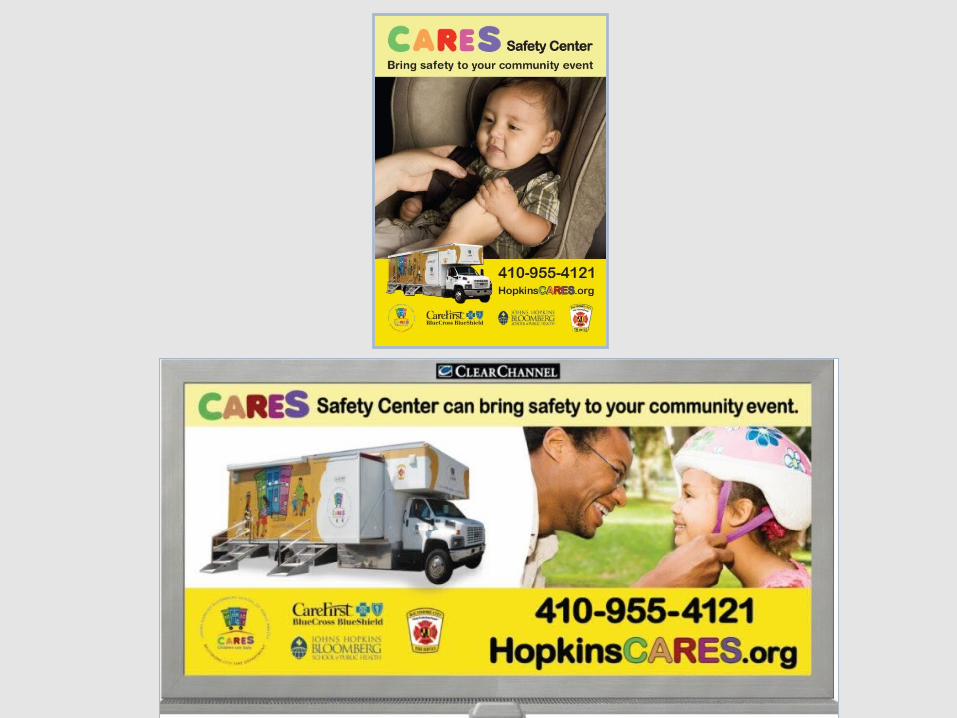

Where We Go
• Community Events• Health Fairs• Religious Organizations• Schools• Medical Clinics • Conferences• Shopping Centers

What We Do
• Personalized and engaging injury prevention education• Low-cost safety products• Free educational materials• Smoke alarm referrals to BCFD program• Child safety seat installation/checks


CARES Evaluation (1/06-10/09)
APPEARANCES.......400
VISITORS............ 16,403
(67% children)
DISTRIBUTED
....Educ’l Materials = 4407
......BCFD Referrals = 856
......Safety Products = 713
• 81/83 (98%) visitors recommend the safety center
• 80/83 (96%) of visitors reported learning something new
• CARES offers a new approach to disseminating information & products
Adapted from: Gielen AC, McDonald, EM, Frattaroli S, et al. If you build it, will they come? Using a mobile safety center to disseminate safety information and products to low income urban families. Injury Prevention, 2009; 15(2):95-9. and
Bulzacchelli M.T., Gielen, A.C., Shields W.C., McDonald, E.M., Frattaroli S. Parental safety-related knowledge and practices associated with visiting a mobile safety center in a low-income urban . J Comm Family Practice, 2009; 32(3):147-58.
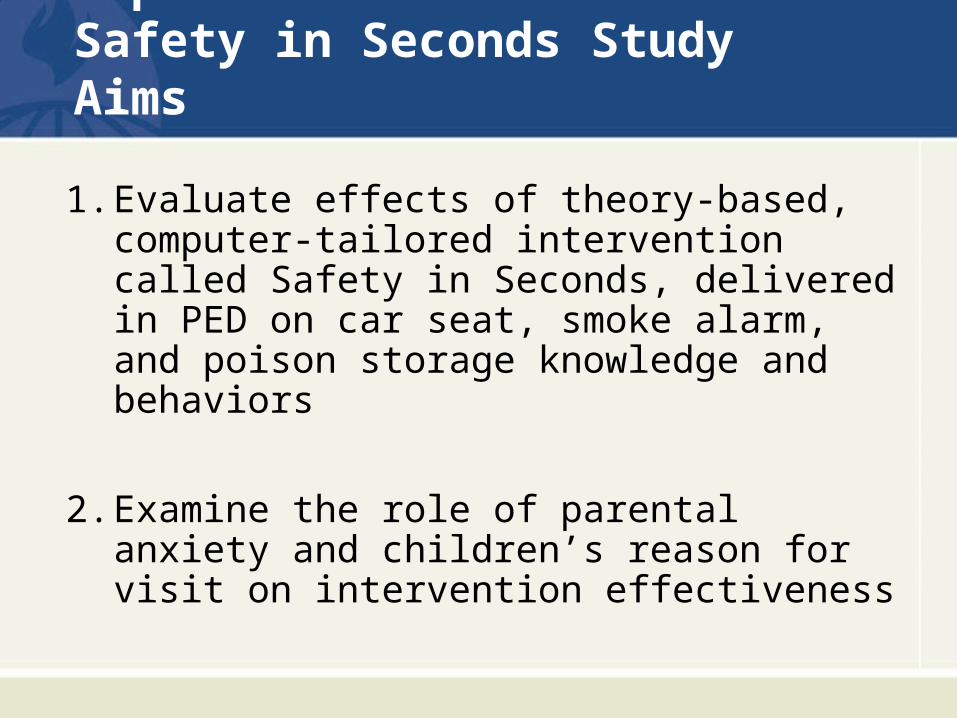
Pediatric Emergency Department Safety in Seconds Study Aims
1. Evaluate effects of theory-based, computer-tailored intervention called Safety in Seconds, delivered in PED on car seat, smoke alarm, and poison storage knowledge and behaviors
2. Examine the role of parental anxiety and children’s reason for visit on intervention effectiveness
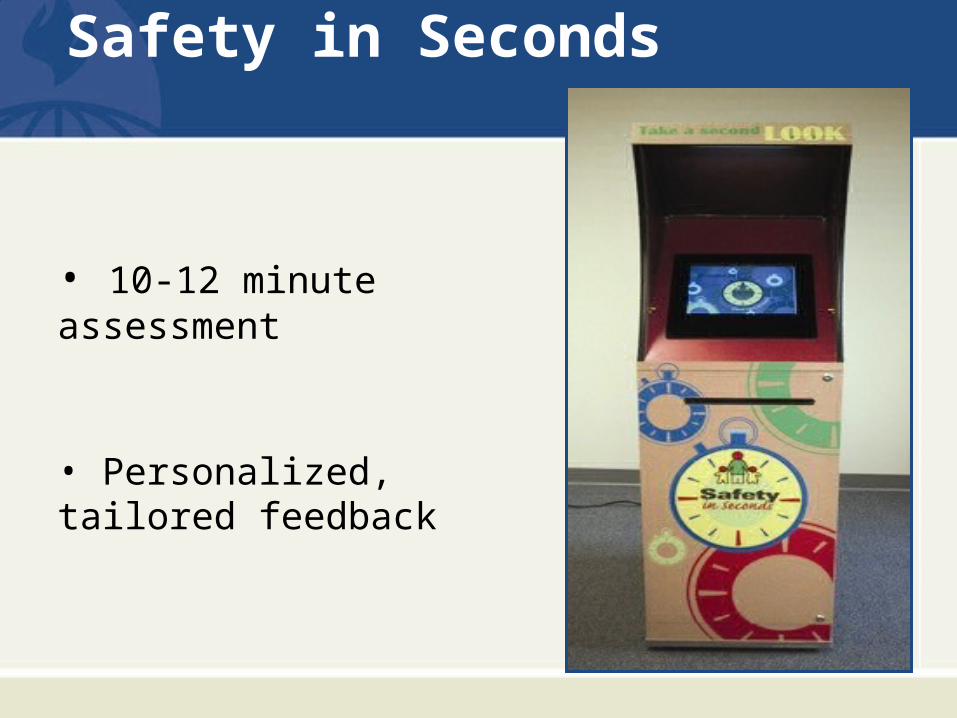
Safety in Seconds
• 10-12 minute assessment
• Personalized, tailored feedback

©Johns Hopkins Center for Injury Research and Policy
Safety in Seconds
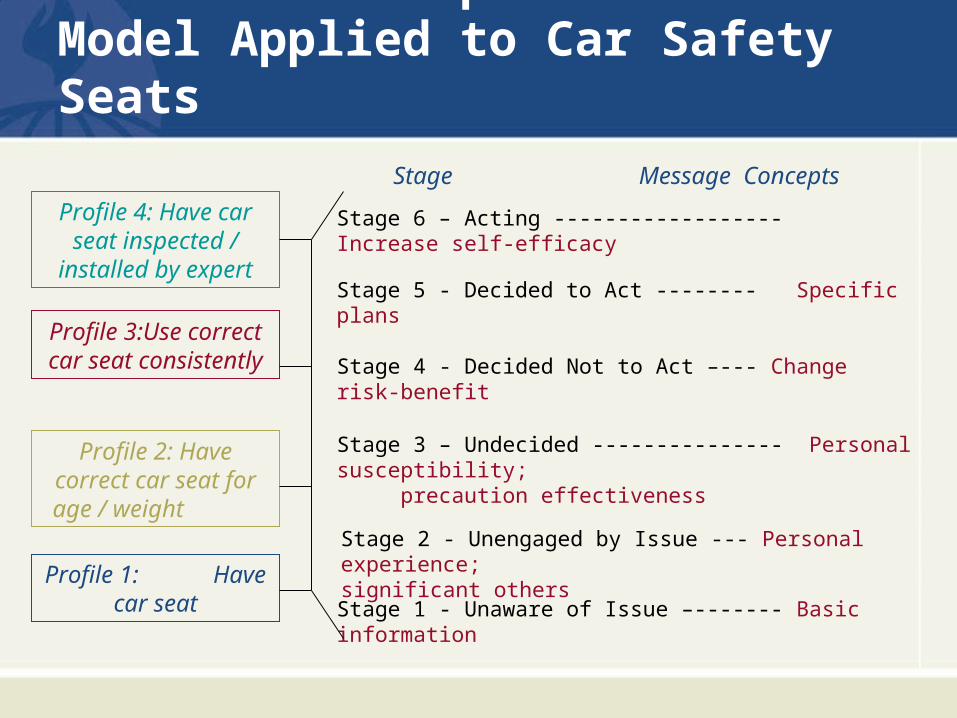
Precaution Adoption Process Model Applied to Car Safety Seats
Profile 3:Use correct car seat consistently
Stage 5 - Decided to Act -------- Specific plans
Stage 4 - Decided Not to Act –--- Change risk-benefit
Stage 3 – Undecided --------------- Personal susceptibility; precaution effectiveness
Stage 2 - Unengaged by Issue --- Personal experience; significant others
Stage 1 - Unaware of Issue –------- Basic information
Profile 2: Have correct car seat for age / weight
Profile 1: Have car seat
Stage 6 – Acting ------------------ Increase self-efficacy
Stage Message Concepts
Profile 4: Have car seat inspected /
installed by expert
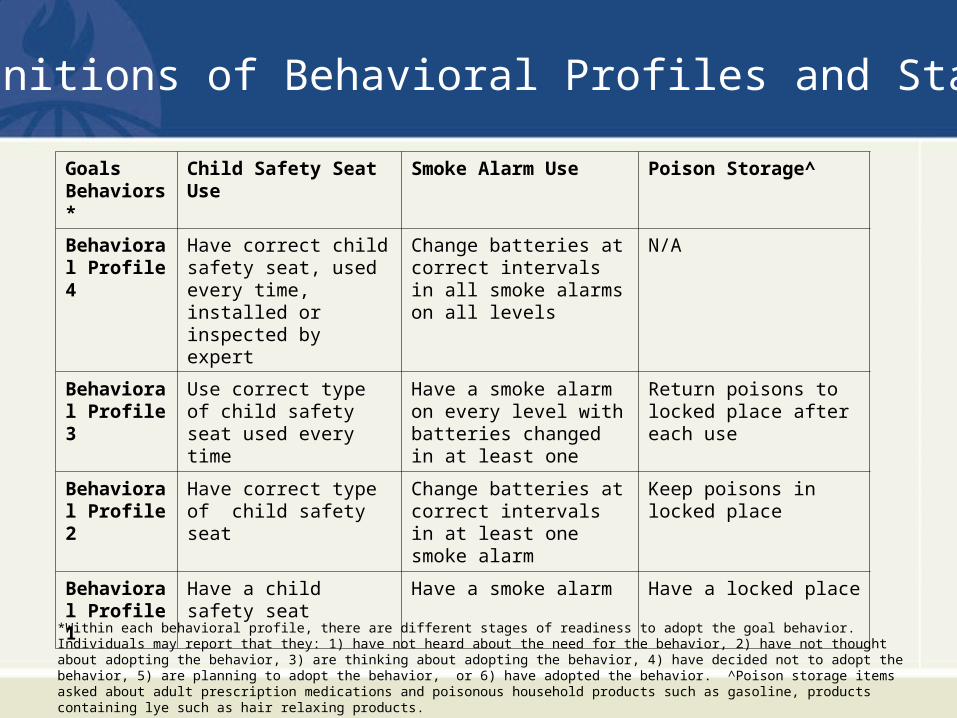
Definitions of Behavioral Profiles and Stages
Goals Behaviors*
Child Safety Seat Use Smoke Alarm Use Poison Storage^
Behavioral Profile 4
Have correct child safety seat, used every time, installed or inspected by expert
Change batteries at correct intervals in all smoke alarms on all levels
N/A
Behavioral Profile 3
Use correct type of child safety seat used every time
Have a smoke alarm on every level with batteries changed in at least one
Return poisons to locked place after each use
Behavioral Profile 2
Have correct type of child safety seat
Change batteries at correct intervals in at least one smoke alarm
Keep poisons in locked place
Behavioral Profile 1
Have a child safety seat Have a smoke alarm Have a locked place
*Within each behavioral profile, there are different stages of readiness to adopt the goal behavior. Individuals may report that they: 1) have not heard about the need for the behavior, 2) have not thought about adopting the behavior, 3) are thinking about adopting the behavior, 4) have decided not to adopt the behavior, 5) are planning to adopt the behavior, or 6) have adopted the behavior. ^Poison storage items asked about adult prescription medications and poisonous household products such as gasoline, products containing lye such as hair relaxing products.

Knowledge Outcomes
Child Safety SeatsBest way to keep child safeState law requires Percent used incorrectlySmoke AlarmsNumber needed House fires leading cause How to use properlyPoison StorageBest way to storeAdult prescription medsHair relaxers with lye Unsafe on high shelf

Evaluation Methods
• Randomized controlled trial
• Personalized tailored injury prevention report vs. Personalized child health report
• 901 caretakers of children ages 4-66 mos
• Telephone follow-up interview at 2-4 weeks

Figure 1. Study Design
Assessed foreligibility
N=1412
Excluded N=509 Not meeting inclusion criteria n=239 Refused to participate n=201 Other reasons (e.g., missed in PED) n=69
Randomized
N=901
Control
N=453 Intervention
N=448
2-week follow-upN=375
2-week follow-upN=385

SampleChild Characteristics
Age<1 year 25%1-2 years 42%3-4 years 27%5 years 6%
% Male 50%
% Injury visit 28%
Respondent CharacteristicsRelationship to childMother 90%Father 6%
% Married/Coupled 30%
Education< High School 10%High School 74%> High School 15%
Per Capita Income< $5,000/year 64%
AnxietyMean score 34.95

KNOWLEDGE CONCEPTS TESTED
INTERVENTION GROUP, N=384
CONTROL GROUP, N=375 t-test, p-value
Child Safety SeatsBest way to keep child safeState law requires Percent used incorrectly Mean Percent Correct (SD) 51.2 (22.0) 49.7 (22.8) t = 0.937, p =
0.35
Smoke AlarmsNumber needed House fires leading cause How to use properly Mean Percent Correct (SD) 82.5 (23.6) 77.6 (23.9) t = 2.82, p = 0.005
Poison StorageBest way to storeAdult prescription medsHair relaxers with lye Unsafe on high shelf Mean Percent Correct (SD) 81.2 (21.6) 70.7 (23.4) t = 6.44, p = 0.000
TOTAL MEAN PERCENT CORRECT (SD) 72.6 (13.9) 66.4 (14.8) t= 5.87, p = 0.000
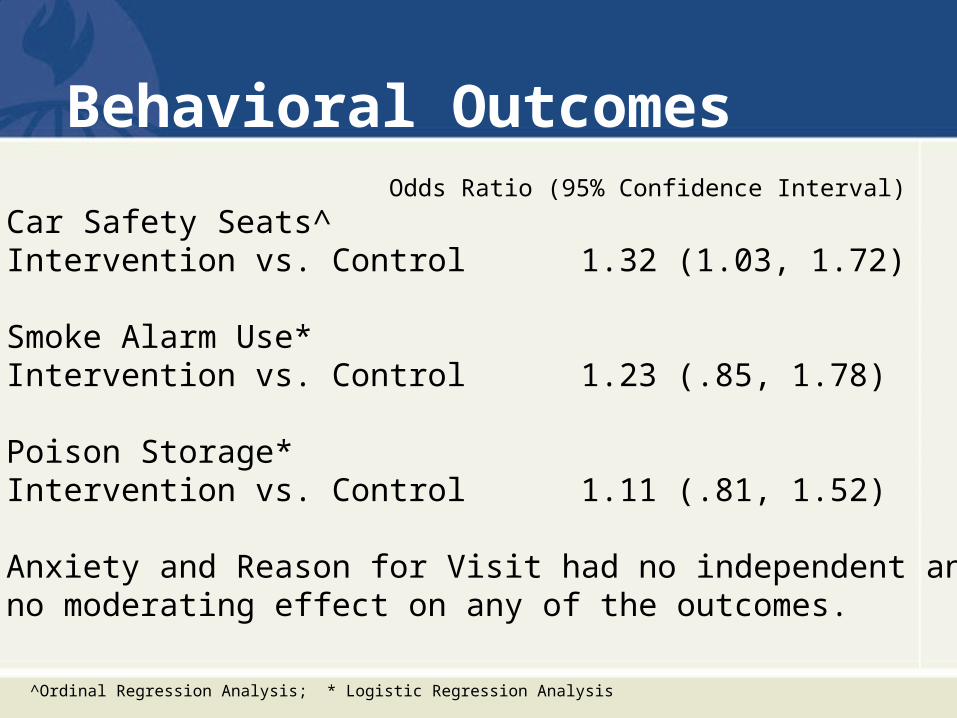
Behavioral OutcomesOdds Ratio (95% Confidence Interval)
Car Safety Seats^Intervention vs. Control 1.32 (1.03, 1.72)
Smoke Alarm Use*Intervention vs. Control 1.23 (.85, 1.78)
Poison Storage*Intervention vs. Control 1.11 (.81, 1.52)
Anxiety and Reason for Visit had no independent andno moderating effect on any of the outcomes.
^Ordinal Regression Analysis; * Logistic Regression Analysis

Exposure to Intervention
• 98% remembered report• 93% read at least some of report• 57% read entire report• 68% discussed it with family or friends
• Summary Exposure Variable
39% who read the entire report AND discussed
it with others were considered “high exposure”

Exposure Analysis
High exposure compared to control group were significantly more likely to use:
– Car seats 1.70 (1.20-2.41)
– Smoke alarms 2.07 (1.16-3.69)
– Safe poison storage 2.01 (1.27-3.16)

0
10
20
30
40
50
60
70
80
90
100
Child Safety Seat Smoke Alarm Poison Storage
Control, N=375
Low Exposure, N=233
High Exposure N=151
Figure 2. Percent Distributions of Child Safety Seat, Smoke Alarm, and Poison Storage Outcomes by Study Group and Exposure to the Intervention
%
Child Safety Seat: Always using correct car seat, inspected or installed by expertSmoke Alarm: moke alarm on every level and changing batteries at correct intervals Poison Storage: Locking poisons after each use
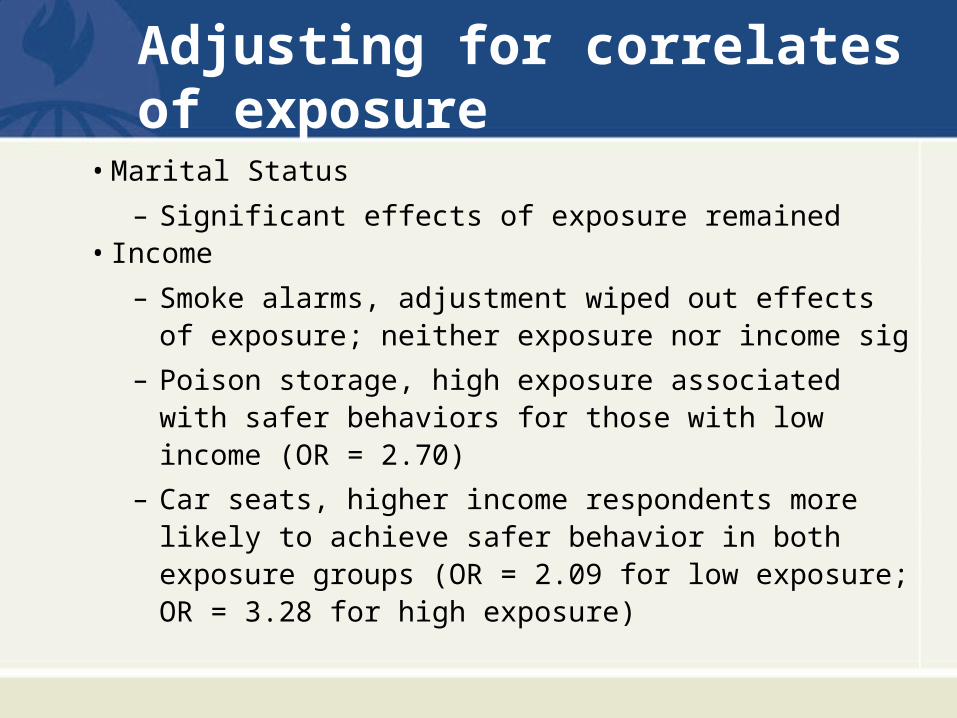
Adjusting for correlates of exposure
• Marital Status
– Significant effects of exposure remained• Income
– Smoke alarms, adjustment wiped out effects of exposure; neither exposure nor income sig
– Poison storage, high exposure associated with safer behaviors for those with low income (OR = 2.70)
– Car seats, higher income respondents more likely to achieve safer behavior in both exposure groups (OR = 2.09 for low exposure; OR = 3.28 for high exposure)

0
10
20
30
40
50
60
Control Group Low ExposureGroup
High ExposureGroup
Lower Income
Higher Income
%
Figure 3. Percent Distribution of Child Safety Seat Outcome by StudyGroup and Per Capita Income*
*p=0.02Child Safety Seat: percent always using correct car seat, inspected and installed by expert

Conclusions
• The needs of low income families continue to need special attention to reduce financial barriers to safety behavior
• Short term changes in behavior need to be examined over longer period of follow up and with observations
• Computer technology and tailored messages can be effectively used for injury prevention in pediatric emergency departments

FUTURE

Two of the greatest virtues in life are patience and wisdom

PassionPassion
“If a disease were killing our children in the proportions that injuries are, there would be a huge public outcry and we would be told to spare no expense to find the cure -- and to be quick about it. The public would be outraged and demand that this killer be stopped.”
Former Surgeon General C. Everett Koop, M.D.

Conclusions
• Despite great progress, injury remains the number one health threat to children
• Effective interventions exist but challenges remain to wide dissemination, especially for low income families
• Multi-disciplinary expertise and partnerships are needed for future success
Thank you!
References• Gielen AC, Wilson MEH, McDonald EM, Serwint JR, Andrews JS, Hwang WT, Wang MC, A Randomized Trial
of Enhanced Anticipatory Guidance for Injury Prevention, Archives of Pediatric and Adolescent Medicine, 155:42-49, 2001.
• Gielen AC, McDonald EM, Wilson MEH, Hwang WT, Serwint JR, Andrews JS, Wang MC, The Effects of Improved Access to Safety Counseling, Products and Home Visits on Parents’ Safety Practices, Archives of Pediatric and Adolescent Medicine, 156:33-40, 2002.
• Bishai D, McCauley J, Trifiletti LB, McDonald EM, Reeb B, Gielen AC, The Burden of Pediatric Injury in an Urban Medicaid Managed Care Organization, Ambulatory Pediatrics, 2(4):279-283, 2002.
• McDonald EM, Gielen AC, Trifiletti LB, Andrews JS, Serwint JR, Wilson M, Evaluation Activities to Strengthen an Injury Prevention Resource Center for Urban Families, Health Promotion Practice, 4(2):129-137, 2003.
• Chen L, Gielen AC, and McDonald EM, Validity of Self-Reported Home Safety Practices, Injury Prevention, 9:73-75, 2003.
• McDonald EM, Solomon BS, Shields W, Serwint JR, Jacobsen H, Weaver NL, Kreuter M, Gielen AC. Evaluation of kiosk-based tailoring to promote household safety behaviors in an urban pediatric primary care practice. Patient Education and Counseling, 58(2):168-181, 2004.
• McDonald EM, Solomon BS, Shields WC, Serwint JR, Wang M-C, Gielen AC. Do Urban Parents’ Interests in Safety Topics Match Their Children’s Injury Risks? Health Promotion Practice, 7(4):1-8, October, 2006.
• Trifiletti LB, Shields WC, McDonald EM, Walker AR, Gielen AC. Development of Injury Prevention Materials for People with Low Literacy Skills, Patient Education and Counseling, 64(1-3): 119-27, May, 2006.
• Gielen AC, Triflietti LB, McDonald EM, Shields WC, Wang MC, Cheng JU, Weaver N, Walker A, Using a computer kiosk to promote child safety: Results of a randomized controlled trial in an urban pediatric emergency department, Pediatrics, 120(2): 330-339, 2007.