census 2016 summary results – part 1 - home - · pdf fileand galway city by 4.2% ... ...
TRANSCRIPT

Census 2016 Summary Results – Part 1
Press conference, Government Buildings 6th April 2017
Reminder……… • Census Day : Sunday April 24th 2016 • Just over 2 million dwellings visited by 5,000 staff • Preliminary results July 2016 • Data captured and processed July 2016 – February
2017 • First results today, dissemination phase throughout
2017
www.cso.ie 2

Population change • Population of 4,761,865 in April
2016 • Population increased by 173,613
or 3.8% since April 2011 • Annual average increase of 0.8% • Slowest increase since 1991-1996 • 2006-2011 had an annual average
increase of 1.6%
www.cso.ie 3
Drivers of population change between Census 2011 and 2016
Driven by 3 elements • Births 344,400 • Deaths 148,300 Natural increase 196,100 • Net migration -22,500
www.cso.ie 4

Population change by county
• Dublin grew by 5.8% • Cork grew by 4.6%
and Galway City by 4.2%
• Mayo fell by -0.1% and Donegal -1.2%
www.cso.ie 5
Dublin’s falling share of urban areas
www.cso.ie 6

Age and sex composition • Fall in births, peak in 2010
was 77,200, 2015 was 67,000
• Outward migration also had an effect on the 20-34 age groups
• Population 65+ up 19% – Males 65+ up 22% – Females 65+ up 17%
www.cso.ie 7
Average age
• Average age 37.4 in 2016 Up from 36.1 in 2011 • Youngest counties • Oldest counties
www.cso.ie 8

Women as a percentage of total population by age group
45 50 55 60 65
0-45-9
10-1415-1920-2425-2930-3435-3940-4445-4950-5455-5960-6465-6970-7475-7980-84
85+
%
Age and sex ratio • 53,009 more females than males
in 2016 (compared with 42,854 more females than males in 2011)
• Sex ratio 97.8 in 2016, was 98.1 in 2011 • More males born • Nearly equal number of males and
females in age group 45-49 • Females live longer
www.cso.ie 9
Elderly living alone
10
…..by county • Highest numbers as % of
private households in cities, west and border
• Lowest numbers in Dublin commuter counties
www.cso.ie

Population aged 15 and over by marital status 2006-2016
Years Total Single TotalFirst
marriage Remarried
Registered same-sex civil
partnership
Separated (incl.
deserted) Divorced Widowed
2006 3,375.4 1,453.2 1,565.0 1,523.5 41.5 0.0 107.3 59.5 190.4
2011 3,608.7 1,505.0 1,708.6 1,655.9 52.7 0.0 116.2 87.8 191.1
2016 3,755.3 1,544.9 1,792.2 1,726.2 61.7 4.2 118.2 103.9 196.2
2006/2011 233.3 51.8 143.6 132.4 11.2 0.0 8.9 28.2 0.7
2011/2016 146.7 39.8 83.5 70.3 9.0 4.2 2.0 16.1 5.2
2006/2011 6.9 3.6 9.2 8.7 27.0 - 8.3 47.4 0.4
2011/2016 4.1 2.6 4.9 4.2 17.1 - 1.7 18.4 2.7
Married
Thousands
Actual change (Thousands)
Percentage change
Marital Status
11
Separated and Divorced • Divorced people increased by
16,125 while separated people increased by 1,984 between 2011 and 2016
• This corresponds with 28,236 and 8,931 respectively between 2006 and 2011
• Rate of increase slowing down • 94,924 men separated or
divorced compared to 127,149 women
• 34,583 men re-married compared to 27,146 women
12 www.cso.ie

Composition of households, 2011-2016Composition of households
2011 2016 Actual %
One person 392.0 399.8 7.8 2.0
Couple w ithout children 313.3 323.1 9.9 3.2
Couple w ith children 577.9 598.7 20.8 3.6
Couple w ithout children but w ith other persons 21.7 20.3 -1.4 -6.5
Couple w ith children and other persons 30.5 32.4 2.0 6.5
One parent w ith children 179.8 177.9 -1.8 -1.0
One parent w ith children and other persons 18.2 20.6 2.4 13.4
Tw o or more family units 18.8 22.4 3.6 19.2
Non-family households 102.2 107.0 4.8 4.7
Total 1,654.2 1,702.3 48.1 2.9
Number of households
Change 2011 - 2016
Thousands
Private Households • Number of private
households rose by 2.9%since 2011 to 1,702,289in 2016
• Number of people livingin private householdsrose by 3.7%
• Population increased by3.8%
13
Average household size by census year
2.5
2.6
2.7
2.8
2.9
3
3.1
3.2
1996 2002 2006 2011 2016
Average household
size
Private Households • Increase in the average
household size from 2.73 to 2.75 persons – reversal of long-term decline in average household size
• Households with couples and children increased the most, by 20,796
14

Family units
15
Families by number of children 1991-2016Number of children 1991 1996 2002 2006 2011 2016
None 145.4 173.5 232.9 303.6 344.9 355.6
One 174.2 195.7 243.1 300.1 339.6 341.2
Tw o 182.5 203.5 234.8 253.1 286.0 307.3
Three 130.4 131.9 134.7 131.7 144.5 152.1
Four or more 125.3 102.3 78.9 64.7 64.2 62.2
Total family units 757.9 806.8 924.5 1,053.2 1,179.2 1,218.4
Total children in family units 1,523.9 1,470.2 1,470.8 1,486.4 1,626.0 1,682.6
Average number of children per family 2.00 1.80 1.60 1.41 1.38 1.38
Thousands• Decline in the number of
children per family levelled off. • Average number of children
per family in 2016 was 1.38, the same as in 2011
• This is down marginally from 1.41 in 2006
Children in family units
16
…..by county • Highest numbers in North
East and Western regions • Lowest numbers in cities:
Dublin City, Cork and Galway City and Dún Laoghaire - Rathdown
www.cso.ie

Fertility
17
• 2.69 children born to every woman aged 45 and over
• 2011 figure was 2.86 By County: • Donegal highest at 3.08,
followed by Monaghan (3.07) and Offaly (3.06)
• Dublin City lowest at 2.38, Dún Laoghaire-Rathdown (2.41) and Galway City (2.45)
Country 2011 2016 Actual change
Romania 17,995 28,702 10,707
Brazil 9,298 15,796 6,498
Spain 7,003 11,809 4,806
Pakistan 8,329 12,891 4,562
Croatia 980 5,202 4,222
Italy 7,146 10,913 3,767
India 17,856 20,969 3,113
Moldova 3,421 6,472 3,051
France 10,070 11,906 1,836
Portugal 2,246 3,866 1,620
Other 682,426 681,880 -546
Total 766,770 810,406 43,636
Place of birth of Irish Residents from countries with largest increases, 2011 and 2016
Place of birth • 810,406 the number of foreign
born persons in April 2016 • Increase of 43,636 (or 6%
increase) compared to 154,141 in 2006-2011
• Foreign born residents represented 17.3% of the population
18

Immigration • 82,346 people moved to
Ireland in the year leading up to Census 2016
• Increase on 2011 when 53,267 recorded
• Just over 28,100 were Irish • 54,203 were non-Irish
19
Top 10 countries Irish Non-Irish Total
UK 9,788 7,506 17,294
Australia 5,327 811 6,138
Brazil 116 4,848 4,964
USA 2,566 2,313 4,879
Spain 682 3,159 3,841
Poland 95 3,689 3,784
France 669 2,500 3,169
Canada 2,036 767 2,803
Croatia 12 2,340 2,352
India 107 2,233 2,340
Rest of World 6,745 24,037 30,782
Total 28,143 54,203 82,346
Usual residence one year ago by top 10 countries of origin
www.cso.ie
Country of origin: Irish nationals
20
Usual residence one year ago of Irish nationals who lived abroad
UK9,788
Australia 5,327
USA2,566
Canada 2,036
Other EU 3,420
Other countries
5,006
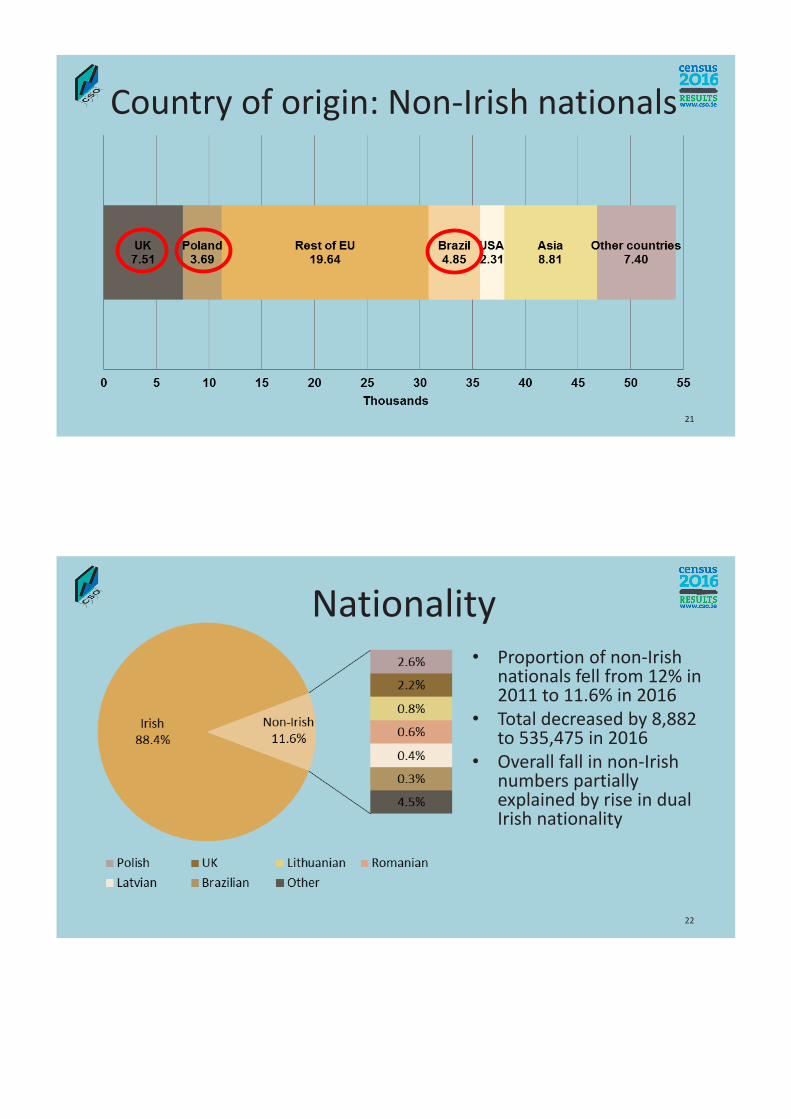
Country of origin: Non-Irish nationals
21
Nationality • Proportion of non-Irish
nationals fell from 12% in 2011 to 11.6% in 2016
• Total decreased by 8,882 to 535,475 in 2016
• Overall fall in non-Irish numbers partially explained by rise in dual Irish nationality
22

Dual Irish Nationality
23
• Dual Irish nationals almost doubled from 55,905 in 2011 to 104,784 in 2016
• Of these 66,440 (63%) born outside Ireland
• Among Irish-UK nationals 13,258 (86%) born outside Ireland
• For Irish-Polish 2,743 (30%) born outside Ireland
Non-Irish Nationals • Polish virtually unchanged
(122,515) • Number of UK nationals fell by
9,146 to 103,113 • Romanians showed largest
absolute increase, increasing by 11,882 to 29,186
• Large increases in Spanish, Brazilian and Italian nationals
• Indian nationals fell by 33 per cent to 11,465
24

Foreign Languages
25
• Over 600,000 speak a foreign language at home • Just over 22% of these speak Polish
Language Total Born in IrelandBorn
elsewhere
Polish 135,895 27,197 108,698
French 54,948 36,810 18,138
Romanian 36,683 7,396 29,287
Lithunain 35,362 6,481 28,881
Spanish 32,405 14,680 17,725
German 28,331 16,077 12,254
Russian 21,707 5,494 16,213
Portuguese 20,833 2,829 18,004
Chinese 17,584 4,691 12,893
Arabic 16,072 4,071 12,001
Other 212,198 58,197 154,001
Total 612,018 183,923 428,095
Foreign languages spoken at home Irish born speaking a foreign language
0 10 20 30 40
French
Polish
German
Spanish
Romanian
Lithuanian
Russian
Chinese
Italian
Arabic
Thousands
Ability to speak English
26
Ability to speak English of those who spoke a foreign language at home
Very well54%
Well29%
Not well12%
Not at all2%Not
Stated3%
Age group Total Very well Well Not well Not at all
Pre-school 3-4 years 22,221 7,254 7,268 5,989 1,710
Primary 5-12 years 76,301 55,694 15,991 4,230 386
Secondary 13 - 18 years 56,296 44,578 8,605 2,916 197
Young adult 19 - 24 years 45,839 28,153 12,904 4,413 369
Working age 25-64 years 365,887 182,806 129,150 48,829 5,102
Older people 65 years and over 12,303 7,729 2,105 1,564 905
Total 578,847 326,214 176,023 67,941 8,669
Ability to speak English by age group
• Pre-school children – 35% or 7,699 could not speak English well or at all
• Secondary school children were the cohort with best English speaking ability – 6% or 3,113 could not speak English well or at all
• Those aged 65 and over it was 20% or 2,469 www.cso.ie

Ethnic or cultural background
27 www.cso.ie
Category 2011 2016 % Change
White Irish 3,821,995 3,854,226 0.8
Irish Travellers 29,495 30,987 5.1
Other White 412,975 446,727 8.2Black Irish or Black African 58,697 57,850 -1.4
Other Black 6,381 6,789 6.4
Chinese 17,832 19,447 9.1
Other Asian 66,858 79,273 18.6
Other 40,724 70,603 73.4
Not stated 70,324 124,019 76.4
Total 4,525,281 4,689,921 3.6
Usual residents by ethnic or cultural background
Irish Travellers
28 www.cso.ie
• Increase 5% on 2011 • Total 30,987 • Longford largest increase at 41%
Number of Irish Travellers 2011-2016
2011 2016
0
5
10
15
20
25
30
35'000s
Males Females
• 12% in temporary accommodation • A rise of 158 people of which 130 in Dublin
City • Longford highest increase in permanent
housing at 43% Top 5 counties where there has been an increase in thenumber of Travellers living in permanent accommodation
0
100
200
300
LongfordLimerickCity andCounty
WaterfordCity andCounty
WexfordKerry

Irish Speakers
29 www.cso.ie
Can you speak Irish? • Total ‘yes’ decreased to 1,761,420 in
2016 from 1,774,437 in 2011 • Fall of 0.7 per cent • 39.8% can speak Irish Frequency? • 73,803 daily outside the education
system in 2016 (fall of 3,382 since 2011) • 111,473 weekly • 586,535 less often • 421,274 never
Population aged 3 years and over by frequency of speaking Irish
69.7% 30.3%
Can't speak or don'tspeak Irish
Speak Irish
0.3%
13.2%
2.5%
1.7%
12.6%
Daily
Daily, within education system only
Weekly
Less often
Not stated
Religion
30
Religion 2011 2016
Percentage change
2011-2016
%
Roman Catholic 3,861.3 3,729.1 -3.4
Church of Ireland 129.0 126.4 -2.0
Muslim (Islamic) 49.2 63.4 28.9
Orthodox 45.2 62.2 37.5
Christian 41.2 37.4 -9.1
Presbyterian 24.6 24.2 -1.6
Hindu 10.7 14.3 34.1
Apostolic or Pentecostal 14.0 13.4 -4.9
Other 70.2 97.7 39.1
No religion 269.8 468.4 73.6
Not stated 72.9 125.3 71.8
Total 4,588.3 4,761.9 3.8
000s
Population by religious grouping 2011 and 2016
• 78% of the population declared themselves as Roman Catholics or 3.7 million
• Reduction of 132,220 persons compared to 2011, when Catholics represented 84%
• 10% declared no religion – second largest group at 468,421
• In 2011 this category represented 6% - increase of 198,610 in five years

Changing trends in religion • 92% of the population were
Catholics in 1991, down to 84% in 2011 and 78% in 2016
• Church of Ireland remained at 3%
• ‘No religion’ represented 2% in 1991, grew to 6% in 2011 and 10% in 2016
• County differences
Changing home types 2011-2016
-10 0 10 20 30
Bedsits
Terraced house
Detached house
Semi- Detached house
All Flats/Apartments
'000s
Housing type
32 www.cso.ie
• 1.698 million permanent occupied homes
• 2.9% increase on 2011 • Detached most common
type • Biggest growth in
flats/apartments • Bedsits continue to
decline

Year built
33 www.cso.ie
Nature of occupancy, 2016
0
10
20
30
40
Own withmortgage or loan
Ownoutright
Rent Liverent free
Not Stated
%
Renting • Total of 497,111 rented
dwellings • Increase on 2011 by
22,323 or 4.7% • Data by county….

2006 2011 2016
Dublin city and suburbs 32.3 72.2 79.6
Cork city and suburbs 24.3 66.5 74.3
Limerick city & suburbs 24.2 64.8 71.3
Galw ay city & suburbs 31.5 72.8 77.5
Waterford city & suburbs 27.1 67.0 73.0
Tow ns 10,000 or over 23.0 66.5 75.7
Tow ns 5,000 - 9,999 14.0 60.9 74.0
Tow ns 3,000 - 4,999 9.7 59.9 71.5
Tow ns 1,500 - 2,999 9.0 57.8 67.9
Rural Total 7.9 54.6 61.1
State 20.0 63.8 70.7
Percentage of households with broadband by area
Internet and Broadband
35
Internet connection type – urban areas
76.2%
4.9%
15.4%
3.5%
Broadband Other None Not stated
Internet connection type – rural areas
61.1%12.7%
23.8%
2.4%
Broadband Other None Not stated
Further details…..
36
• ‘Census 2016 Summary Results, Part 1’ – full publication and analysis www.cso.ie/en/census
• Another 12 publications/releases in 2017 • Up next…. ‘Profile 1 – Housing in Ireland’ on 20th April • SAPS (Electoral Divisions level and around 18,500 Small Areas)
available on the 20th July • POWSCAR (Place of work, school and college) – transport and
commuting analysis – available 20th July • Continued partnership with the All Island Research
Observatory http://airo.maynoothuniversity.ie/mapping-resources/airo-
census-mapping or link from www.cso.ie/en/census

Census 2016 Publication Schedule
37
Description Publication Date Preliminary Results 14 July 2016 Census 2016 Summary Results – Part 1 06 April 2017 Profile 1 – Housing in Ireland 20 April 2017 Profile 2 – Population Distribution and Movements 11 May 2017 Census 2016 Summary Results – Part 2 15 June 2017 Profile 3 – An Age Profile of Ireland 06 July 2017 Small Area Population Statistics (SAPS) – All variables 20 July 2017 POWSCAR – Research microdata file 20 July 2017 Profile 4 – Households and Families 27 July 2017 Profile 5 – Homeless Persons in Ireland 10 August 2017 Profile 6 – Commuting in Ireland 31 August 2017 Profile 7 – Migration and Diversity 21 September 2017 Profile 8 – Irish Travellers, Ethnicity and Religion 12 October 2017 Profile 9 – Health, Disability and Carers 2 November 2017 Profile 10 – Education and Skills 23 November 2017 Profile 11 – Employment, Occupations and Industry 14 December 2017
