cellular/molecular ... · cellular/molecular desensitizationpropertiesofampareceptorsatthe...
TRANSCRIPT

Cellular/Molecular
Desensitization Properties of AMPA Receptors at theCerebellar Mossy Fiber–Granule Cell Synapse
David A. DiGregorio,1,2 Jason S. Rothman,1 Thomas A. Nielsen,1 and R. Angus Silver1
1Department of Physiology, University College London, London WC1E 6BT, United Kingdom, and 2Centre National de la Recherche Scientifique, UniteMixte de Recherche 8118, Laboratoire de Physiologie Cerebrale, Universite Paris 5, 75270 Paris Cedex 06, France
Native AMPA receptors (AMPARs) exhibit rapid and profound desensitization in the sustained presence of glutamate. Desensitizationtherefore contributes to short-term depression at synapses in which glutamate accumulates. At synapses that do not exhibitdesensitization-dependent depression, AMPARs are thought to be protected against prolonged or repetitive exposure to synapticallyreleased glutamate. At the cerebellar mossy fiber to granule cell (GC) synapse, in which high release probability and glutamate spilloverproduce a substantial buildup of glutamate concentration in the cleft ([Glut]cleft ) during high-frequency transmission, only moderatedesensitization of the phasic AMPAR EPSC occurs. To investigate how such currents are produced, we examined the kinetic properties ofsynaptic AMPARs in GCs using glutamate uncaging. Photolysis of 4-methoxy-7-nitroindolinyl-caged L-glutamate with large illuminationspots produced step-like increases in [Glut]cleft that could be used to systematically probe AMPAR kinetics. At low levels of activation,synaptic AMPARs exhibited little desensitization. With larger activations, the desensitization time course became faster, but the level ofdesensitization was only weakly dependent on receptor occupancy. Indeed, a substantial desensitization-resistant current componentremained (17%) in saturating glutamate. Photolysis with small illumination spots produced brief [Glut]cleft waveforms and transientAMPAR activations, similar to the EPSC current components. Paired-pulse uncaging with such spots revealed little desensitization afterspillover-like activations and modest depression after activations that mimicked quantal and spillover components together. Our resultsshow that GC AMPARs exhibit a resistance to desensitization at low occupancies and that this property is crucial for sustaining high-frequency transmission at a synapse in which glutamate accumulates.
Key words: synapse; spillover; AMPA receptor; cerebellum; desensitization; glutamate receptor
IntroductionAMPA receptor (AMPAR) desensitization contributes to short-term depression (STD) of the EPSC at various synaptic connec-tions in auditory brainstem, striatum, cerebellum, thalamus, andcortex (Hestrin, 1993; Trussell et al., 1993; Isaacson and Walms-ley, 1996; Carter and Regehr, 2000; Rozov et al., 2001; Chen et al.,2002; Wong et al., 2003; Xu-Friedman and Regehr, 2004; Wall,2005; Akopian and Walsh, 2007; Crowley et al., 2007). However,at many other synapses, desensitization does not influence STD(Dobrunz et al., 1997; Dittman and Regehr, 1998; Silver et al.,1998; Hjelmstad et al., 1999; Renden et al., 2005). Although it isunclear what determines the level of desensitization at a particu-lar synapse, it is thought to be influenced by two factors: (1) theamplitude and time course of glutamate concentration in the
cleft ([Glut]cleft), and (2) the kinetic properties of AMPARs(Jones and Westbrook, 1996; Jonas, 2000).
AMPAR deactivation and desensitization rates vary over a10-fold range across preparations (Hestrin, 1993; Raman et al.,1994; Geiger et al., 1995), contributing to the wide range of ob-served EPSC time courses (Jonas, 2000). However, all native AM-PARs characterized to date desensitize profoundly in saturatingglutamate (�95%: Colquhoun et al., 1992; Geiger et al., 1995;Hausser and Roth, 1997; Jahn et al., 1998; except Hilar mossycells, 90%: Geiger et al., 1995). Desensitization also occurs at lowconcentrations because of an apparent affinity in the micromolarrange (Trussell and Fischbach, 1989; Colquhoun et al., 1992; Ra-man and Trussell, 1992; Hausser and Roth, 1997). At glomerularand calyceal structures, modeling and experimental studies haveproposed that slow [Glut]cleft waveforms arising from spilloverpreferentially desensitize AMPARs (Otis et al., 1996a; Xu-Friedman and Regehr, 2003; Taschenberger et al., 2005). At thecerebellar mossy fiber (MF)– granule cell (GC) synapse, the fac-tors determining [Glut]cleft have been well characterized and fa-vor prolonged activation of AMPARs: high release probability(Sargent et al., 2005), rapid replenishment of releasable vesicles(Saviane and Silver, 2006), and pronounced glutamate spillover(DiGregorio et al., 2002; Nielsen et al., 2004). However, high-frequency stimuli produce only a modest desensitization of theEPSC (Saviane and Silver, 2006). This is surprising given the
Received Dec. 9, 2006; revised June 21, 2007; accepted June 22, 2007.This work was supported by the Wellcome Trust, Medical Research Council Grant G0400598, and European Union
Grant EUSynapse LSHM-CT-2005-019055. D.A.D. was partially supported by Centre National de la Recherche Scien-tifique. R.A.S. is in receipt of a Wellcome Senior Research Fellowship. We thank David Ogden, John Corrie, ColinSheppard, and Peter Torok for helpful discussions during the project and Philippe Ascher, David Attwell, JonathanBradley, Stuart Cull-Candy, Laurence Cathala, Jeremy Dittman, Paul Kirkby, Zoltan Nusser, Tom Otis, Arnd Roth,Chiara Saviane, and Tomoyuki Takahashi for their comments on this manuscript.
Correspondence should be addresssed to R. Angus Silver at the above address. E-mail: [email protected]. A. Nielsen’s present address: Department of Neurobiology, Harvard Medical School, 220 Longwood Avenue,
Boston, MA 02115.DOI:10.1523/JNEUROSCI.2399-07.2007
Copyright © 2007 Society for Neuroscience 0270-6474/07/278344-14$15.00/0
8344 • The Journal of Neuroscience, August 1, 2007 • 27(31):8344 – 8357

rapid and profound desensitization observed in immature cul-tured GCs (Silver et al., 1996a; Wall et al., 2002), raising thequestion of how the properties of synaptic AMPARs enable thishigh-frequency signaling.
Because the AMPARs that give rise to the EPSC (Cathala et al.,2005) are not present on the GC soma (Silver et al., 1996a; Smithet al., 2000) and are therefore inaccessible to conventionaloutside-out patch methods, we used glutamate uncaging to ex-amine their properties. This has the advantage that the AMPARsare in the same state as for synaptic activation, e.g., phosphoryla-tion state (Greengard et al., 1991), subunit and splice variantcomposition (Cull-Candy et al., 2006), and binding to AMPAR-associated proteins (Priel et al., 2005; Tomita et al., 2005). Ourresults demonstrate that synaptic AMPARs on GCs exhibit a rel-atively low level of desensitization at occupancies that occur dur-ing synaptic transmission and do not fully desensitize even insaturating glutamate. We show that these distinct desensitizationproperties of GC AMPARs underlie their ability to transformquantal release into fast EPSCs with modest STD and convert thesustained spillover [Glut]cleft into tonic currents during high-frequency stimulus trains.
Materials and MethodsRecording conditions. Parasagittal slices of cerebellum were preparedfrom 25- to 35-d-old Sprague Dawley rats (mean, 27.2 � 0.3 postnataldays; n � 86) as described previously (Silver et al., 1996b; Nielsen et al.,2004). The external solution contained the following (in mM): 125 NaCl,2.5 KCl, 2 CaCl2, 1 MgCl2, 1.25 NaH2PO4, 26 NaHCO3, and 25 glucose,pH 7.3. Fire-polished patch electrodes were backfilled with the followinginternal solution (in mM): 100 K-MeSO4, 40 HEPES, 6 NaOH, 5 EGTA,1.78 CaCl2, 4 MgCl2, 0.3 NaGTP, 4 NaATP, and 10 �M Alexa 594. Tipresistances were 5–10 M�. Whole-cell voltage-clamp recordings weremade from GCs at �70 to �80 mV at near physiological temperature35.9 � 0.1°C (n � 86) in the presence of 10 �M APV and 20 �M
7-chlorokynurenic acid (Tocris Bioscience, Bristol, UK) to isolate non-NMDA receptor currents. SR 95531 [2-(3-carboxypropyl)-3-amino-6-(4-me-thoxyphenyl)pyridazinium bromide] at 10 �M was added to block GABAA
receptors in some experiments, and 50 �M GYKI 53655 [1-(4-aminophenyl)-3-methylcarbamyl-4-methyl7,8-methylenedioxy-3,4-dihydro-5H-2,3-benzo-diazepine] (Sigma, St. Louis, MO) was used to confirm that the photolysisevoked EPSC (pEPSC) was mediated by AMPARs (supplemental Fig. 1, avail-able at www.jneurosci.org as supplemental material) as shown previously forsynaptic currents (DiGregorio et al., 2002). GCs were identified on the basis oftheir capacitance (�5 pF; mean, 2.35 � 0.26; n � 83). Series resistance was21 � 1 M� (n � 86), giving an electrode-cell filter frequency of 4.1 kHz. Thejunction potential of �6.3 mV was corrected when stated. The caged com-pound 4-methoxy-7-nitroindolinyl-caged L-glutamate (MNI-glutamate) [giftfrom Dr. John Corrie (Mill Hill, London, UK National Institute for MedicalResearch) or purchased from Tocris Biosciences] at 10 mM was locally perfusedvia patch pipettes with 2–3 �m tip diameters. The perfusion solution con-tained (in mM): 110 NaCl, 2.5 KCl, 40 HEPES, 2 CaCl2, 1 MgCl2, 1.25NaH2PO4, 2 NaHCO3, 25 glucose, and 50 �M APV (titrated to a pH of 7.3 af-ter adding MNI-glutamate). Alexa 488 at 50 �M was added to the solution tovisualize the perfusion plume. Bath perfusion of 10 mM MNI-glutamate hadno significant effect on the amplitude, time course, and frequency of mEPSCs,or holding current ( p � 0.1; n � 4). pEPSCs were recorded with an Axopatch200B amplifier (Molecular Devices, Palo Alto, CA), filtered at 10 kHz, and digi-tized at 150 kHz using an analog-to-digital converter (ADC) board (model6052E; National Instruments, Austin, TX) and Nclamp software (availablefrom www.neuromatic.thinkrandom.com/).
Optical imaging and uncaging. The custom photolysis system was builtin collaboration with Prairie Technologies (Middleton, WI) on an up-right microscope (Olympus Optical, Tokyo, Japan). The beam from acontinuous mode argon laser (model I328; Coherent, Santa Clara, CA)was modulated with an acousto-optic tunable filter (AOTF); (NeosTechnologies, Melbourne, FL), gated by a hard shutter (to completelyblock residual UV excitation; Uniblitz, Rochester, NY), and passed
through a 364 nm bandpass filter. The UV beam was focused onto asingle-mode optical fiber (Oz Optics, Ottawa, Ontario, Canada), whichdelivered the light to the microscope. An aspheric lens was used to eitherfill the back aperture of a 100�, 1.0 numerical aperture (NA) dippingobjective (Olympus Optical) to form a diffraction-limited small spot orfocused onto a small area of the back aperture of a 60�, 0.9 NA objective(Olympus Optical) to form a large spot in the focal plane of the objective.The UV laser light was coupled into the image path using a 400 nmlong-pass dichroic mirror between the objective and the visible epifluo-rescence dichroics. The whole lens/fiber system was adjusted with respectto a second tube lens to align the UV spot to the focal plane of the visiblewavelengths. The UV spot was positioned in the specimen plane in a“point and shoot” manner using the fluorescence CCD image as a refer-ence and computer-controlled stepper motors to move the output of thefiber in the x and y directions (Prairie Technologies). The AOTF and hardshutter were controlled via a 1 MHz digital-to-analog converter (model6713; National Instruments), whose output clock was linked to the clockof the ADC, to synchronize the illumination pulse and voltage-clampacquisition.
Estimation of the UV spot size and intensity. Fluorescent beads (Invitro-gen, Carlsbad, CA), 110 nm, were suspended in agar (diluted 1:500 into a5% agar solution at �50°C and left to cool). The lateral dimensions of thesmall-spot illumination volume were estimated by measuring the fluo-rescence from a 110 nm bead as the focused UV spot was stepped acrossin 50 nm increments. At each location, 10 ms exposures of UV lightproduced step changes in fluorescence that were detected with a cooledavalanche photodiode and patch-clamp amplifier (Photomax; Dagan,Minneapolis, MN). The axial resolution was estimated similarly but byadjusting the focus in 200 nm increments. The three-dimensional (3D)illumination point spread function (iPSF) was estimated by fitting theaveraged axial intensity profile with the diffraction integral representa-tion of a high NA objective using a sin 2x series function to account forspherical aberrations (Sheppard and Torok, 1997; C. Sheppard, personalcommunication). To measure the size of the large spot, fluorescent bead“monolayers” were prepared by diluting 110 nm fluorescent beads 1:500in 95% ethanol, followed by vortexing, and then sonication for 5–10 min.One to 2 �l were then smeared onto a coverslip and left to dry at roomtemperature for 10 –30 min. A homogenous region of the slide was cho-sen with a covering of beads a few layers thick, and the fluorescencearising from the large-spot illumination was imaged using the cooledCCD camera. The laser power at the preparation was estimated routinelyusing a fluorescent solution (10 �M fluorescein and 20 mM HEPES, pH8.0), which was calibrated to the measured laser output from the objec-tive using a power meter. For experiments not associated with a measure-ment, light levels were estimated by linear interpolation.
Data analysis. Data analysis was performed using the Neuromaticanalysis package (www.neuromatic.thinkrandom.com/) and customroutines within the Igor Pro environment (WaveMetrics, Lake Oswego,OR). Peak amplitudes and rise times were measured from traces afterdigital filtering with a binomial smoothing routine (3– 6 kHz Gaussianfilter). Traces were baselined using a 1 ms window before the uncagingpulse. pEPSC amplitudes were averaged over a 100 �s window at the peakof the largest current in a particular scan. For paired-pulse experiments,the amplitude of the second pulse was measured from the baseline (i.e.,without subtraction of the current from the first trace). In some cases, thepeak amplitude and rise time of the pEPSC were determined by fitting anempirical function that describes well the rising phase and dual-exponential decay of the currents as described previously (Nielsen et al.,2004):
EPSC�t � A1�1 � exp� �t � t0
�rise��n
�
�A2 exp� �t � t0
�decay1� � �1 � A2exp� �
t � t0
�decay2�� (1)
Normalized integrals were calculated by scaling the current peak ampli-tudes to one and then calculating the integral over a 9 ms window afterthe peak, unless otherwise stated. Steady-state current (Iss) values were
DiGregorio et al. • Synaptic AMPA Receptor Properties J. Neurosci., August 1, 2007 • 27(31):8344 – 8357 • 8345

calculated from the fit of pEPSCs with Equation 1. Those cells in whichthe current slowly increased over a 100 ms window were excluded fromthe analysis of Iss (4 of 20 cells), to ensure that distant receptors did notdistort our measurements. Only the saturated pEPSCs evoked with thelarge illumination spot were corrected for the voltage drop across thepipette. Nonstationary fluctuation analysis (NSFA) of the pEPSCs wasperformed using a pairwise overlapping method (Heinemann and Conti,1992). Currents were baselined 15–30 ms before the UV pulse, and thebaseline variance was measured over the same window. Consecutiveevoked currents were determined to be stable if the amplitude over a100 –200 �s window passed a Spearman’s rank correlation test (Silver etal., 1996b). A similar test of the 10 –90% rise times was used. Followingthis strict stability criterion, 9 – 40 pEPSCs per spot location were ana-lyzed without additional off-line filtering. The mean and variance werecalculated for 10 equal current bins. The binned mean versus varianceplots were fit with a binomial equation. The fit was weighted by thetheoretical estimate of the error in the variance (Heinemann and Conti,1992) and only accepted if the fit was significant (� 2 statistic smaller thanthe threshold for rejection, p � 0.05). The single-channel conductancewas calculated, accounting for the junction potential, assuming an AM-PAR reversal potential of 0 mV.
The time course of desensitization was quantified by fitting the decayof the large-spot pEPSC with a single-exponential function with a y offset(see Fig. 3C, inset). Although these fits were good, we also fit the pEPSCwith dual-exponential functions to compare fast components of desen-sitization with the decay of the miniature EPSC (mEPSC) (Wall et al.,2002). At half-maximal activation, pEPSCs from 12 of 20 cells were betterfit with a double-exponential function. On average, the fast time constantwas 1.9 ms with relative amplitude 0.80 (n � 20), whereas the slow timeconstant was 6.1 ms (n � 12); values of single-exponential fits werelumped with the fast time constants. For saturated pEPSCs, the fast timeconstant was 0.9 ms with relative amplitude 0.80 (n � 18) and slow timeconstant 4.7 ms (n � 16); only 2 of 18 cells converged to a single expo-nential. Although the fast component of the saturated large-spot pEPSCsapproached the time course of the saturated small-spot pEPSC, raisingthe possibility that desensitization could be limiting in some recordings,it was still more than twofold too slow to account for the mEPSC decay.
CCD images were analyzed using ImageTool (University of TexasHealth Science, San Antonio, TX). Small-spot line profiles were set to 3pixels thick (95 nm/pixel) and lengths corresponding to the uncaging linescans. The spatial profile of the large-spot pEPSC was determined bymaking seven equidistant spot measurements along the dendritic axis ororthogonal to it. Data were pooled by fitting individual profiles with aGaussian function and aligning on the peak of the fit. Once aligned andnormalized, the pooled data from each axis were refit with a Gaussianfunction to determine the spatial profile. All values are expressed � SEMunless otherwise stated.
Numerical simulations of glutamate uncaging and quantal release. Nu-merical simulations were performed with D3D, an in-house diffusionsimulator based on an explicit finite difference method (Nielsen et al.,2004). The MF–GC contact area comprised 11 � 11 dendritic digits, each600 nm in width (Xu-Friedman and Regehr, 2003) spaced 20 nm apartand 1.24 �m long (Nielsen et al., 2004). The dendritic digits were bor-dered by GC bodies represented by 7 �m cubes. For the small-spot sim-ulations, the GC layer only extended above the synaptic area, giving asimulation volume of 6.48 � 6.48 � 4.28 �m (x � y � z dimensions). Forthe large-spot simulations, GCs were added laterally around the synapticarea, expanding the simulation volume to 28.08 � 28.08 � 2.28 �m. Toreduce simulation time, we reduced the depth of the diffusional spaceand simulated one-quarter of the entire space to take advantage of sym-metry. The diffusion coefficient of glutamate was set to 0.33 �m 2 ms �1
(Nielsen et al., 2004), and MNI-glutamate was set to 0.25 �m 2 ms �1
[estimated from (MWglut)1/3/(MWMNI)
1/3 � Dglut].To simulate photolysis-evoked glutamate transients, we collapsed the
uncaging reaction to a simple first-order reaction scheme, because thedark reaction is fast (�1 �s) (Morrison et al., 2002). MNI-glutamate wasconverted to free glutamate using a light-dependent rate constant. We setthe caged concentration to 8 mM, based on a 20% dilution effect of localperfusion (Dittman and Regehr, 1997). The reaction rates were imple-
mented in the 3D diffusional space according to a spatial weighting set bythe illumination function. For the small-spot simulations, the measuredlight intensity was distributed according to the relative intensity values ofthe measured iPSF. For the large-spot simulations, the light distributionintensity was simulated as a cylinder with 2D Gaussian profile [full-widthat half-maximum (FWHM) of 9.2 �m] centered on the MF–GC contactarea. The duration of the uncaging reaction was set to the values used inthe experiments (20 �s to 1 ms). To estimate the glutamate and MNI-glutamate experienced by the receptors in a postsynaptic density (PSD),concentrations were averaged over a 200 � 200 � 20 nm volume atvarious locations in which dendritic digits contacted the MF. The meanglutamate concentration across the glomerulus was estimated by weight-ing the simulated concentration waveforms, detected at various distances(center of each digit) from the center, by their relative area over 200-nm-wide rings.
Simulations of AMPAR responses to trains of synaptic activation. Trainsof synaptic glutamate release and spillover were simulated in a geometryidentical to previous simulations (Nielsen et al., 2004). Stochastic quan-tal release variables were generated using the uniform random numberroutine (“enoise”) of Igor Pro. To mimic the presynaptic component ofSTD, we used the following release probabilities: 0.61, 0.52, 0.48, 0.47,and 0.47 for the initial five pulses and then 0.46 for the remaining pulses(Saviane and Silver, 2006). The number of glutamate molecules per ves-icle (4000) was chosen to produce a receptor activation 50%, becausethis corresponds to our estimate of AMPAR activation (see below). Thecontribution of uptake and long-range diffusion was implemented at theouter edges of the diffusional space using a removal rate of 0.2 ms �1 persimulation voxel. This value produced a 21 ms slow decay of glutamatesimilar to the slow decay in the EPSC (DiGregorio et al., 2002). Thismethod also predicted well the current ratio in the presence and absenceof DL-threo-�-benzyloxyaspartic acid (DiGregorio et al., 2002). AMPARkinetic schemes were implemented as described previously (Nielsen etal., 2004), except they were not adjusted to 37°C. This preserved theiroriginal behavior, because adjusting the rate constants for elevated tem-perature generally increased the amount of the depression within thetrain.
Estimation of photolysis-evoked glutamate concentration and timecourse. The probability of uncaging was estimated from the followingequation based on that used by Lowe (Lowe, 2003): Pu � � �MNI �Es/�, where the absorption cross section is � 2.303 � �MNI/Nav, andthe cross-sectional energy at the focal point is Es� � Tp/A. �MNI and�MNI are the extinction coefficients (4300 cm/M) and the quantum yield(0.085) of MNI-glutamate, respectively (Papageorgiou, 2000). � is thephoton energy of 364 nm light. Nav is Avogadro’s number. is the powerexiting the microscope objective, Tp is the duration of the light pulse, andA is the area of the illumination at the focal plane (assuming circularradius of 1/e 2 of a Gaussian fit to the PSF of 195 nm). For a 20 �s pulse oflow laser power (15 �W), we predict an uncaging probability of 0.75 inthe small spot, which, when multiplied by the MNI-glutamate concen-tration, is 6 mM peak concentration (compare with Fig. 6 D, blue trace,k � 100 ms �1). This calculation assumes linearity of the uncaging reac-tion and does not account for diffusion. It is likely that, with higherlight levels (200 – 400 �W), the uncaging reaction is saturated and[Glut] reaches levels close to the concentration of MNI-glutamate inthe slice (8 mM).
ResultsGenerating step-like glutamate concentration waveformsusing UV photolysis of caged glutamateDesensitization is defined as the decay in the receptor response inthe continued presence of agonist. AMPAR desensitization hasbeen measured previously in outside-out patches by rapidly ap-plying glutamate in a step-like manner. However, AMPARs inmature GCs are located within the PSDs (DiGregorio et al., 2002;Cathala et al., 2005), with little or no expression on the soma(Silver et al., 1996a; Smith et al., 2000), making them inaccessibleto this technique. Previous studies circumvented this problem byusing immature cultured GCs that do express non-NMDA recep-
8346 • J. Neurosci., August 1, 2007 • 27(31):8344 – 8357 DiGregorio et al. • Synaptic AMPA Receptor Properties
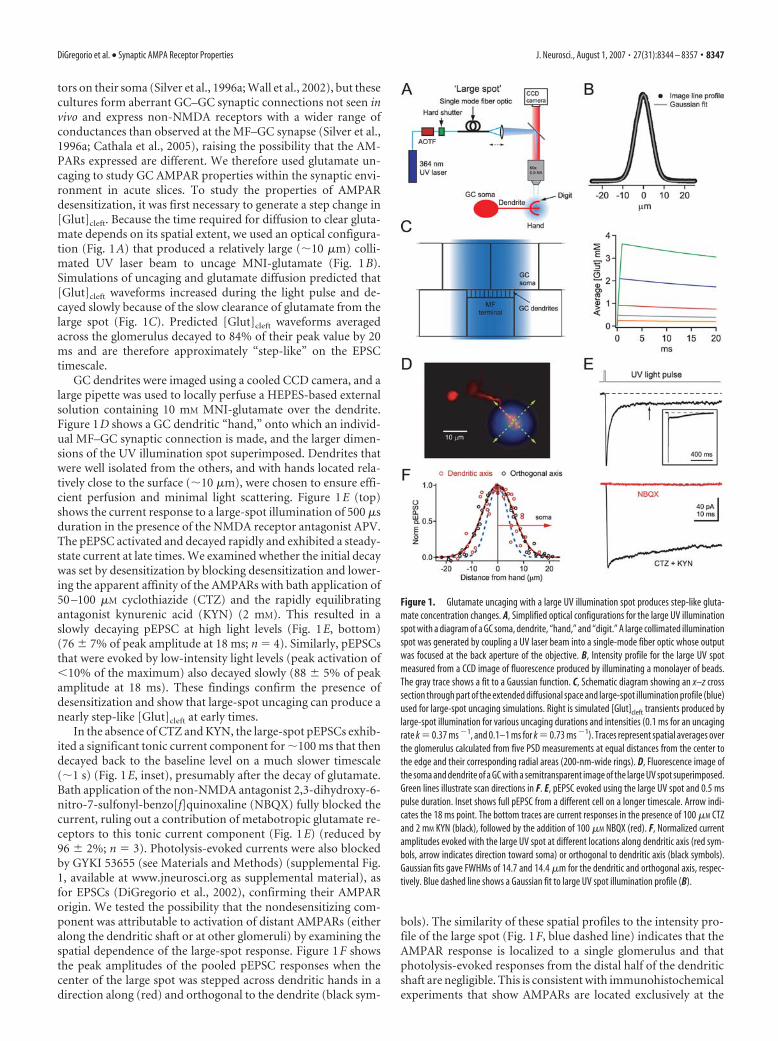
tors on their soma (Silver et al., 1996a; Wall et al., 2002), but thesecultures form aberrant GC–GC synaptic connections not seen invivo and express non-NMDA receptors with a wider range ofconductances than observed at the MF–GC synapse (Silver et al.,1996a; Cathala et al., 2005), raising the possibility that the AM-PARs expressed are different. We therefore used glutamate un-caging to study GC AMPAR properties within the synaptic envi-ronment in acute slices. To study the properties of AMPARdesensitization, it was first necessary to generate a step change in[Glut]cleft. Because the time required for diffusion to clear gluta-mate depends on its spatial extent, we used an optical configura-tion (Fig. 1A) that produced a relatively large (10 �m) colli-mated UV laser beam to uncage MNI-glutamate (Fig. 1B).Simulations of uncaging and glutamate diffusion predicted that[Glut]cleft waveforms increased during the light pulse and de-cayed slowly because of the slow clearance of glutamate from thelarge spot (Fig. 1C). Predicted [Glut]cleft waveforms averagedacross the glomerulus decayed to 84% of their peak value by 20ms and are therefore approximately “step-like” on the EPSCtimescale.
GC dendrites were imaged using a cooled CCD camera, and alarge pipette was used to locally perfuse a HEPES-based externalsolution containing 10 mM MNI-glutamate over the dendrite.Figure 1D shows a GC dendritic “hand,” onto which an individ-ual MF–GC synaptic connection is made, and the larger dimen-sions of the UV illumination spot superimposed. Dendrites thatwere well isolated from the others, and with hands located rela-tively close to the surface (10 �m), were chosen to ensure effi-cient perfusion and minimal light scattering. Figure 1E (top)shows the current response to a large-spot illumination of 500 �sduration in the presence of the NMDA receptor antagonist APV.The pEPSC activated and decayed rapidly and exhibited a steady-state current at late times. We examined whether the initial decaywas set by desensitization by blocking desensitization and lower-ing the apparent affinity of the AMPARs with bath application of50 –100 �M cyclothiazide (CTZ) and the rapidly equilibratingantagonist kynurenic acid (KYN) (2 mM). This resulted in aslowly decaying pEPSC at high light levels (Fig. 1E, bottom)(76 � 7% of peak amplitude at 18 ms; n � 4). Similarly, pEPSCsthat were evoked by low-intensity light levels (peak activation of�10% of the maximum) also decayed slowly (88 � 5% of peakamplitude at 18 ms). These findings confirm the presence ofdesensitization and show that large-spot uncaging can produce anearly step-like [Glut]cleft at early times.
In the absence of CTZ and KYN, the large-spot pEPSCs exhib-ited a significant tonic current component for 100 ms that thendecayed back to the baseline level on a much slower timescale(1 s) (Fig. 1E, inset), presumably after the decay of glutamate.Bath application of the non-NMDA antagonist 2,3-dihydroxy-6-nitro-7-sulfonyl-benzo[f]quinoxaline (NBQX) fully blocked thecurrent, ruling out a contribution of metabotropic glutamate re-ceptors to this tonic current component (Fig. 1E) (reduced by96 � 2%; n � 3). Photolysis-evoked currents were also blockedby GYKI 53655 (see Materials and Methods) (supplemental Fig.1, available at www.jneurosci.org as supplemental material), asfor EPSCs (DiGregorio et al., 2002), confirming their AMPARorigin. We tested the possibility that the nondesensitizing com-ponent was attributable to activation of distant AMPARs (eitheralong the dendritic shaft or at other glomeruli) by examining thespatial dependence of the large-spot response. Figure 1F showsthe peak amplitudes of the pooled pEPSC responses when thecenter of the large spot was stepped across dendritic hands in adirection along (red) and orthogonal to the dendrite (black sym-
bols). The similarity of these spatial profiles to the intensity pro-file of the large spot (Fig. 1F, blue dashed line) indicates that theAMPAR response is localized to a single glomerulus and thatphotolysis-evoked responses from the distal half of the dendriticshaft are negligible. This is consistent with immunohistochemicalexperiments that show AMPARs are located exclusively at the
Figure 1. Glutamate uncaging with a large UV illumination spot produces step-like gluta-mate concentration changes. A, Simplified optical configurations for the large UV illuminationspot with a diagram of a GC soma, dendrite, “hand,” and “digit.” A large collimated illuminationspot was generated by coupling a UV laser beam into a single-mode fiber optic whose outputwas focused at the back aperture of the objective. B, Intensity profile for the large UV spotmeasured from a CCD image of fluorescence produced by illuminating a monolayer of beads.The gray trace shows a fit to a Gaussian function. C, Schematic diagram showing an x–z crosssection through part of the extended diffusional space and large-spot illumination profile (blue)used for large-spot uncaging simulations. Right is simulated [Glut]cleft transients produced bylarge-spot illumination for various uncaging durations and intensities (0.1 ms for an uncagingrate k � 0.37 ms �1, and 0.1–1 ms for k � 0.73 ms �1). Traces represent spatial averages overthe glomerulus calculated from five PSD measurements at equal distances from the center tothe edge and their corresponding radial areas (200-nm-wide rings). D, Fluorescence image ofthe soma and dendrite of a GC with a semitransparent image of the large UV spot superimposed.Green lines illustrate scan directions in F. E, pEPSC evoked using the large UV spot and 0.5 mspulse duration. Inset shows full pEPSC from a different cell on a longer timescale. Arrow indi-cates the 18 ms point. The bottom traces are current responses in the presence of 100 �M CTZand 2 mM KYN (black), followed by the addition of 100 �M NBQX (red). F, Normalized currentamplitudes evoked with the large UV spot at different locations along dendritic axis (red sym-bols, arrow indicates direction toward soma) or orthogonal to dendritic axis (black symbols).Gaussian fits gave FWHMs of 14.7 and 14.4 �m for the dendritic and orthogonal axis, respec-tively. Blue dashed line shows a Gaussian fit to large UV spot illumination profile (B).
DiGregorio et al. • Synaptic AMPA Receptor Properties J. Neurosci., August 1, 2007 • 27(31):8344 – 8357 • 8347

synapse in GCs (DiGregorio et al., 2002).These results indicate that the current de-cay after large-spot illumination is attrib-utable to AMPAR desensitization and thatthere is a significant nondesensitizingsteady-state component to the current.
Estimation of AMPAR occupancyduring synaptic transmissionThe time course and the extent of AMPARdesensitization depends on the [Glut](Trussell and Fischbach, 1989; Colquhounet al., 1992; Raman and Trussell, 1992;Hausser and Roth, 1997). To understandhow synaptic AMPARs respond to the dif-ferent [Glut]cleft produced by quantal re-lease and spillover, we used glutamate un-caging to determine the EPSC receptoroccupancy. Figure 2A shows AMPAR cur-rent responses evoked with different light intensities. As the totalamount of light increased, the amplitude of the pEPSC increaseduntil it saturated (100 �s to 1 ms duration) (Fig. 2B). Applicationof pairwise NSFA (Heinemann and Conti, 1992) to maximal re-sponses revealed a high channel open probability (Popen � 0.83 �0.08; n � 5). Because channel open probability is directly relatedto receptor occupancy (Silver et al., 1996b), these data confirmthat the AMPARs are very close to saturation. The peak ampli-tudes of these saturated large-spot pEPSCs had a broad distribu-tion across cells, with a coefficient of variation of 0.53 and meanof 200 � 24 pA at �86.3 mV (corrected for junction potentialand electrode resistance) (Fig. 2C). This corresponded to a con-ductance of 2.32 nS and represents the maximal output of allAMPARs at an individual MF–GC synapse, because the UV illu-mination spot covered the whole GC dendritic hand. We haveshown previously that there are an average of 4.7 functional re-lease sites associated with an individual MF–GC synapse and thatthe quantal conductance is 0.24 nS (Sargent et al., 2005), giving amaximal synaptic output of 1.11 nS when the release probabilityis 1. The ratio of the average maximal synaptic conductance andthe average maximal photolysis evoked conductance indicates anAMPAR occupancy at the peak of the EPSC of 49%. This value,which assumes that the activation time course is much faster thandesensitization and the mean single-channel currents are similar,is within the upper and lower occupancy limits estimated forEPSCs in immature GCs using less direct methods (Silver et al.,1996b).
Occupancy dependence of synaptic AMPAR desensitizationWe next examined the activation and desensitization propertiesof synaptic AMPARs at various levels of receptor activation. Ascan be seen from the peak normalized pEPSC in Figure 3A, thepEPSC waveform accelerated markedly with the increasing levelsof activation. We quantified the kinetics of receptor activation byrestricting our analysis to illumination durations of �200 �s andby fitting the mean pEPSC at each light level with an empiricalfunction to minimize the effects of noise for small-amplitudecurrents (Fig. 3A, black lines). The 10 –90% rise time of the large-spot pEPSC decreased approximately exponentially with increas-ing fractional activation from 1.65 � 0.16 ms (n � 37) at lowoccupancies to 280 � 30 �s (n � 6) when the current amplitudewas saturated (Fig. 3B). It is possible that this limiting rise time isstill an overestimate because of the finite uncaging duration. Thedecay of the pEPSC, which is caused by desensitization, was fit
with a single-exponential function (Fig. 3C, inset) (see Materialsand Methods). The decay time constant decreased from 11 � 1ms (n � 13) at low levels of activation to 1.82 � 0.13 ms (n � 6)when the current amplitude was saturated (Fig. 3C). The sixfoldactivation-dependent acceleration in the time course of desensi-tization is greater than observed previously for all native andrecombinant AMPARs that have been examined over at least a100-fold change in [Glut] values. Moreover, the range of occu-pancies over which the time course changed was larger than forother AMPARs. Indeed, some AMPARs exhibit no apparent con-centration dependence in their time course of desensitizationover a wide range of concentrations (Robert and Howe, 2003;Zhang et al., 2006), whereas others have a mild dependence at lowconcentrations, giving a twofold to fourfold acceleration (Ramanand Trussell, 1995; Hausser and Roth, 1997; Koike et al., 2000;Krampfl et al., 2002).
We next determined how the steady-state level of desensitiza-tion depended on the fraction of channels activated. This wasquantified by measuring the ratio of the steady-state current at 18ms after the peak (10 times the time constant of desensitizationfor saturating pEPSCs) and the peak current (Iss/Ipeak). The frac-tional steady-state current decreased from 0.50 � 0.03 (n � 16) atlow levels of channel activation to 0.17 � 0.02 (n � 14) at maxi-mal activation when the AMPARs are saturated by glutamate(Fig. 3D). However, the amount of desensitization estimated withthese ratios is likely to represent an upper estimate because of theprediction of a slight sag in the [Glut]cleft waveform (Fig. 1C,right).
To compare the occupancy dependence of GC AMPAR desen-sitization with other native AMPARs, we simulated the step ap-plication of a range of glutamate concentrations for three wellconstrained AMPAR models that were based on experimentaldose–response curves and that exhibited a wide range of deacti-vating and desensitizing behaviors (Jonas et al., 1993; Raman andTrussell, 1995; Wadiche and Jahr, 2001). The Wadiche and Jahr(WJ) (2001) model is a close relative to the Hausser and Rothmodel (1997), but with rate constants adjusted to match patch-clamp data acquired at 32–35°C, similar to the temperature atwhich our MF–GC EPSCs were recorded (36°C). The shapes ofthe Iss/Ipeak relationships varied across models, indicating thatsome AMPARs are more sensitive to tonic levels of glutamatethan others (Fig. 3D). However, the level of desensitization ob-served for GC AMPARs was consistently lower than the modelsover a wide range of occupancies. These data show that synaptic
Figure 2. Response of synaptic AMPARs to large-spot illumination at various light intensities. A, Averaged (4 traces) large-spotpEPSCs in response to increasing UV illumination. The intensity of a 0.1 ms pulse was increased to its maximum, after which theduration was increased to 0.2, 0.5, and 1.0 ms. B, Relationship between the relative peak amplitude of pEPSCs and normalizedintegral of light (n � 20). Dashed line denotes 90% criteria for achieving a saturating response. C, Histogram of maximum peakcurrents of saturated responses for 20 cells. Thick black line denotes the mean maximal amplitude of the pEPSC of all cells, and thedashed black line indicates the population average maximal synaptic output [mean number of release sites multiplied by averagequantal current, N � Q (taken from Sargent et al., 2005)]. Data have been corrected for series resistance voltage errors.
8348 • J. Neurosci., August 1, 2007 • 27(31):8344 – 8357 DiGregorio et al. • Synaptic AMPA Receptor Properties

AMPARs in GCs exhibit a resistance to desensitization at lowoccupancies, a behavior that is likely to contribute to the gener-ation of large tonic currents (�20% of the peak EPSC) observedduring high-frequency trains (Saviane and Silver, 2006).
Mimicking synaptic activation of receptors using a smallphotolysis spotExperiments using step changes in glutamate have so far shownthat the level of AMPAR desensitization is a function of both theconcentration and duration of glutamate exposure. To gain in-sight into AMPAR desensitization under more physiological glu-tamate activation, we changed the optical configuration of theuncaging system to produce brief pulses of [Glut]cleft to mimicsynaptic release. This was achieved by focusing the UV laser beamto a small spot at the focal plane (Fig. 4A), because the diffusion-mediated decay of [Glut] from a small volume is expected to berapid. Indeed, previous work using both one-photon and two-photon photolysis methods have shown that pEPSC waveformscan approach the miniature quantal EPSC waveform (Matsuzakiet al., 2001; Smith et al., 2003; Carter and Sabatini, 2004; Bagal etal., 2005). However, because single-photon methods can suffer
from out-of-focus photolysis, we mini-mized the energy density outside the focalplane by forming a diffraction-limitedspot with a high numerical aperture objec-tive. The measured iPSF had lateral andaxial dimensions of 234 � 7 nm (FWHM;n � 5) and 1160 � 50 nm (n � 5), respec-tively, for the central lobe (Fig. 4B–D). Thesmall size of this excitation volume com-pares favorably with that achieved previ-ously with single-photon [0.6 –1 �m lat-eral dimension (Eder et al., 2003; Bagal etal., 2005)] and two-photon methods[0.29 – 0.39 �m (Matsuzaki et al., 2001;Smith et al., 2003; Tanaka et al., 2005)].The z-dimension was only slightly largerthan the two-photon excitation volume,with little excitation beyond the principlelobe.
Uncaging with brief (20 �s) small-spotdiffraction-limited illumination at 250 nmintervals across a dendritic “digit” (Fig.4E, green arrow) produced a family ofpEPSCs with rise times that became fasterat locations in which the peak amplitudewas largest (Fig. 4F), suggesting that ouruncaging volume was centered on a clusterof receptors. At low laser intensities, thespatial dependence of the current ampli-tude at the time of the peak of the largestand most rapidly rising current (10 –90%rise time of 0.22 ms), was sharp and, whenfit with a Gaussian function, gave aFWHM of 320 nm (Fig. 4G). The dendriticstructure in the scanned axis was signifi-cantly larger than the spatial dependenceof pEPSCs (Fig. 4G) (on average, 2.6-foldlarger; p � 0.02; n � 8,) consistent withchannels being clustered in PSDs on thedendritic hand (DiGregorio et al., 2002).On average, the profile of spatially isolatedresponses was larger than the average di-
ameter of PSDs at this age (FWHM of 0.77 � 0.22 �m; n � 8 vs aPSD diameter of 180 nm) (Cathala et al., 2005). This large sizecould be attributable to either diffusion spread of glutamate dur-ing the rise time of the current (see Fig. 6F) or multiple juxta-posed PSDs.
As the illumination intensity of the small UV spot was in-creased, the amplitude of pEPSCs increased but with no signifi-cant change in time course of pEPSCs recorded at the centrallocation (Fig. 4F, inset) [normalized integral at low light, 2.9 �0.3 ms (n � 8) vs high light level 2.2 � 0.2 ms (n � 10); paired ttest, p � 0.08]. However, the spatial dependence broadened evenfor well isolated cases (Fig. 4H). On average, the FWHM of thespatial profile of the current increased by a factor of 2.9 � 0.4(n � 8) for a sevenfold increase in light. This could result from theincreased [Glut]cleft activating AMPAR over a larger region at-tributable to their nonlinear activation properties (Fig. 2B), dif-fusion of transmitter, and saturation of the uncaging reaction(see Fig. 6F), all of which are likely to contribute to the effectivevolume over which glutamate is uncaged. By selecting cells inwhich the spatial dependence of the pEPSC had a single peak overa range of light intensities (Matsuzaki et al., 2001; Smith et al.,
Figure 3. Kinetic properties of synaptic AMPARs at various receptor occupancies. A, Normalized traces from Figure 2 A and theirfit to an empirical rising and decaying function (Eq. 1). B, Relationship between 10 –90% rise time (R.T.) of the pEPSCs and fractionof saturated current for each cell (Norm pEPSC; n � 20). Only pEPSCs activated with brief illumination durations were used (�200�s; x and y error bars indicate SEM). The solid line is an exponential fit using a floating offset. Dashed line indicates the limitingvalue (i.e., the last value corresponding to the last data point). C, Relationship between the decay time constant of pEPSC andnormalized pEPSC activated with brief illumination pulses (�200 �s; n � 20). Solid line is a single-exponential fit to the datapoints, and the dashed line shows the limiting decay time constant. Inset shows an example of a single-exponential fit (black) tothe decay of a large-spot pEPSC. D, Relationship between the fractional steady-state current (Iss/Ipeak) at 18 ms after the light pulse(filled circles) and the peak amplitude of the normalized pEPSCs (n � 16). The solid line is an exponential fit to the data. The longdashed line shows the limiting value of Iss/Ipeak calculated from the last two 18 ms points. Color symbols represent the Iss/Ipeak
measured at 10 times decay time constant for the three native AMPAR model simulations in response to step changes in [Glut]. WJis Wadiche and Jahr (Wadiche and Jahr, 2001), RT is Raman and Trussel (Raman and Trussell, 1995), and JMS2 is Jonas, Major, andSakmann scheme 2 (Jonas et al., 1993). For these simulations [Glut] values were adjusted to reproduce the range of fractionalactivation of the GC experimental data.
DiGregorio et al. • Synaptic AMPA Receptor Properties J. Neurosci., August 1, 2007 • 27(31):8344 – 8357 • 8349

2003; Bagal et al., 2005), we were able toidentify discrete populations of synapticAMPARs (for a counter example, seesupplemental Fig. 2, available at www.jneurosci.org as supplemental material).
Small-spot uncaging of glutamate ontoisolated clusters of AMPAR producedrapid pEPSCs. Figure 5A shows individualand mean pEPSCs superimposed for ahigh-intensity 20 �s illumination pulse.Unlike nerve-evoked EPSCs, the pEPSCresponse was reproducible and stable fromtrial to trial, permitting the application ofNSFA. Analysis of current fluctuations inthe decay of the pEPSCs gave a meansingle-channel current that correspondedto a conductance of 6.9 � 0.7 pS (n � 24).This value is comparable with that esti-mated from miniature EPSCs in GCs (Sil-ver et al., 1996b; Cathala et al., 2005). TheAMPA channel Popen, which was calcu-lated from the mean peak current and thepredicted maximal response, was high(0.81 � 0.04; n � 12), similar to that ob-tained from our saturated large-spot re-sponses (Popen � 0.83). Such a high chan-nel Popen has only been attained previouslywith focal uncaging in the presence of CTZ(Matsuzaki et al., 2001; Smith et al., 2003;Tanaka et al., 2005), which can increasethe apparent affinity of AMPARs. The highAMPAR Popen of pEPSCs suggests that the[Glut]cleft generated by a brief, high-intensity small diffraction-limited UVspot (20 �s, 140 – 660 �W; mean of 314 �45 �W) is sufficient to saturate synapticAMPARs, whereas lower light levels canapproximate the peak occupancy of syn-aptic currents.
Figure 5C shows mean pEPSCs acti-vated with a high illumination intensity atthe locations that gave the fastest rise andlargest amplitude for the 10 cells in whichresponses were fast (10 –90% rise time,�300 �s) and spatially isolated fromneighboring clusters (�1.5 �m). Themean amplitude varied widely from cell tocell (21–103 pA) and had an overall meanof 69 � 11 pA (n � 11). This variability islikely to reflect variability in the number ofAMPARs per PSD and the activation ofmore than one PSD in some recordings.Figure 5D shows the peak normalizedpEPSC. The rise time of the mean pEPSCwas substantially faster than our selectioncriterion and intermediate between therise time of the evoked EPSC (eEPSC) anduniquantal or mEPSC (Fig. 5D) [10 –90%rise time, 160 � 10 �s, n � 11; eEPSC, 180�s (DiGregorio et al., 2002); mEPSC: 120�s (Nielsen et al., 2004)]. In a number ofcells, the decay of the pEPSC was interme-diate in time course between that of the
Figure 4. Spatial dependence of small-spot pEPSCs on granule cell dendritic hands. A, Optical configuration used to form a smalldiffraction-limited UV illumination spot. The small spot was generated by collimating the light emitted from the optical fiber so that itformed a parallel beam with a Gaussian profile that filled the back aperture of the microscope objective. B, Averaged fluorescence emittedby110nmfluorescentbeadsasafunctionofaxialdistance(200nmsteps)whenilluminatedwithasmallUVspot(n�5;filledcircles).Grayline shows the fit of the theoretical iPSF including spherical aberrations. C, x–z (top) and x–y (bottom) intensity profile of the theoretical 3DiPSF determined from fit of the data in B. D, Averaged fluorescence intensity distribution of a laterally scanned 110 nm bead (50 nm steps;n�5; filled circles). Dashed line shows the predicted x-line profile of the fitted iPSF from B. E, Image of a GC dendritic hand visualized withAlexa 594. The green arrow indicates the length (4 �m) and location over which uncaging responses were elicited. F, pEPSCsevoked with a brief (20 �s) diffraction-limited UV illumination spot during local perfusion of 10 mM MNI-glutamate at threedifferent light intensities elicited at different locations (250 nm apart) across the dendritic hand shown in E (photolysis scan). Thickblack traces show fastest-rising responses. Inset shows normalized pEPSCs, for each of the three laser intensities, recorded fromthe location in which the fast-rising current was measured. Inset calibration bar is 2 ms. G, Current amplitudes for the lowestintensity (18 �W) measured at the time the largest current peaked (filled red circles) plotted as a function of distance. Dashed lineindicates a Gaussian fit. Green line shows the intensity line profile from the CCD image indicating the location of the dendriticstructure (E) from which the pEPSCs were recorded. H, Plot of amplitude at the time that the largest current peaked as a functionof distance with Gaussian fits for the two highest intensities together with scaled data from G (red).
8350 • J. Neurosci., August 1, 2007 • 27(31):8344 – 8357 DiGregorio et al. • Synaptic AMPA Receptor Properties

eEPSC and the mEPSC but, on average, was close to the evokedsynaptic waveforms (Fig. 5D). The fast decaying component ofthe pEPSC, eEPSC, and mEPSC was 0.82 � 0.10 ms (n � 10), 0.54ms (DiGregorio et al., 2002), and 0.36 ms (Nielsen et al., 2004),respectively. However, the slow component of the pEPSC wasmore pronounced than for the mEPSC, giving a slower overalldecay that was comparable with the eEPSC (normalized integralsof 2.2, 0.8, and 1.7 ms, respectively). These results show that,although the pEPSCs measured here are substantially faster thanreported previously using either single-photon (Bagal et al.,2005) or two-photon (Matsuzaki et al., 2001; Smith et al., 2003;Carter and Sabatini, 2004) uncaging methods, the pEPSC decay issignificantly slower than the rapid decay of the quantal current inGCs at near physiological temperature. Nevertheless, the initialdecay of mEPSCs was still much faster than the saturating valuefor the time course of desensitization even when it was fit with adouble-exponential function (�fast of 0.9 ms; n � 18; see Materialsand Methods), indicating that channel deactivation and the de-cay of [Glut]cleft determines the mEPSC decay. The fact that thetime course of the pEPSC is similar to the evoked EPSC, whichincludes slower spillover-mediated components, suggests thatdiffraction-limited small-spot UV uncaging can be used to mimicaction potential-evoked synaptic transmission at the MF–GCsynapse.
To investigate the determinants of the[Glut]cleft time course generated by small-spot UV uncaging and to examine whetherpairs of illumination pulses could be usedto probe receptor desensitization, we sim-ulated photolysis at the MF–GC synapsewith a 3D diffusion-reaction model (Fig.6A,B) (Nielsen et al., 2004) (see Materialsand Methods). Numerical simulations us-ing the measured diffusion coefficient ofglutamate, the measured iPSF, and calcu-lated uncaging efficiency (see Materialsand Methods) suggest that the fast decay ofthe photolysis-evoked glutamate (e-folddecay, 46 �s for low intensities) was at leasttwofold slower than that predicted forquantal release (Fig. 6C). This decay didnot accelerate when using a 3D Gaussianfunction to mimic a two-photon excita-tion volume (Fig. 6C), indicating that theminimal uncaging volume that can beachieved with conventional optics is toolarge to mimic quantal release at theMF–GC synapse, regardless of whethersingle- or two-photon excitation is used.The similarity of the pEPSC and mEPSCtime courses reported for other prepara-tions using one-photon (Bagal et al., 2005)and two-photon (Matsuzaki et al., 2001;Carter and Sabatini, 2004; Losonczy andMagee, 2006) (but see Tanaka et al., 2005)methods may be attributable to slowerAMPAR kinetics, different synaptic geome-tries, or dendritic filtering of the mEPSC.When the uncaging rate (i.e., light intensity)was increased to large values (k � 1000ms�1), the decay of the [Glut]cleft waveformslowed (Fig. 6D,E) as a result of saturation ofthe photolysis of MNI-glutamate in the cen-
ter of the illumination spot, which caused a larger effective uncagingvolume (Fig. 6F). By 0.2 ms, the spatial spread of the glutamate islarger but still restricted to 1 �m, albeit at much smaller [Glut]cleft
(Fig. 6F). At these high intensities and unfavorable synaptic orienta-tions (Fig. 6B) the e-fold decay could be as slow as 0.6 ms. Becausethe light intensities in our experiments are likely to result in ratesbetween 100 and 1000 ms�1 (see Materials and Methods), the decayof the glutamate will be slower than predicted for release of a singlequantum but still brief enough to approximate the slower [Glut]cleft
waveform that is produced by evoked quantal release and spillovertogether. Our simulations also show that the rate of recovery ofMNI-glutamate is fast after uncaging with a brief small-spot illumi-nation pulse (Fig. 6D). The similarity in the recovery of MNI-glutamate and the decay of glutamate after photolysis is attributableto their similar diffusion coefficients (see Materials and Methods).These simulations indicate that pairs of small-spot illumination un-caging pulses can be used to activate synaptic AMPARs in a mannersimilar to the evoked EPSC and to probe the level of desensitizationa few milliseconds later.
Probing AMPAR desensitization after transient synaptic-likephotolysis activationTo examine the desensitization properties of synaptic AMPARsin GCs using synaptic-like glutamate exposures, we used two
Figure 5. Peak open probability and time course of AMPAR-mediated pEPSCs evoked with small-spot illumination. A, Twenty-five consecutive pEPSCs (gray traces) and their mean (black trace) evoked with a brief high-intensity diffraction-limited spot at thelocation that gave the largest amplitude and fastest rise time. Inset, The peak amplitude of the pEPSCs plotted in order ofacquisition from left to right. B, Relationship between variance and mean current for pEPSC decay calculated from traces in A usingpairwise nonstationary fluctuation analysis (see Materials and Methods). Gray trace is a binomial fit, and dashed line indicatesbackground variance. The mean number of channels across cells was 215 � 36 (n � 24). C, Maximal pEPSCs evoked with brief,high-intensity small-spot illumination from 10 cells, which had fast rise times and unimodal spatial dependence. The lightintensities ranged from 160 to 480 �W. D, Normalized traces from C (gray traces) with their population mean (black trace), thepopulation mean of action potential-evoked EPSCs [eEPSC, green trace (taken from DiGregorio et al., 2002)], and the populationmean quantal current [mEPSC, blue trace (taken from Nielsen et al., 2004)].
DiGregorio et al. • Synaptic AMPA Receptor Properties J. Neurosci., August 1, 2007 • 27(31):8344 – 8357 • 8351

brief (20 �s) small-spot illuminationpulses. The AMPA receptor occupancywas varied by changing the light intensityon the first pulse, and the level of desensi-tization was assayed with a second “test”pulse that fully activated the receptors 10ms later (Fig. 7A). We selected recordingsthat had spatially isolated responses to en-sure that the same receptor population wasactivated regardless of intensity (Fig. 7B).At the lowest light level, when 23% of thereceptors were activated on the first pulse,the second pulse gave a near maximal re-sponse (95%), indicating that the majorityof receptors were available and that theywere not in a desensitized state. This resultcontrasts with previous paired-pulse datafrom patches from chick nucleus magno-cellularis neurons in which a 10% frac-tional activation produced 50% desensiti-zation (Raman and Trussell, 1995).However, because the fraction of AMPARsactivated on the first pulse was increased,the response to the second pulse de-creased, indicating that the fraction of de-sensitized AMPARs had increased (Fig.7C). We further quantified the relation-ship between the level of activation anddesensitization by estimating the fractionof AMPAR channels open at the peak ofthe first pulse using NSFA of pEPSCsevoked from intermediate light intensities(mean of 140 � 30 �W). Figure 7D showsthat there is an inverse correlation betweenthe peak Popen on the first pulse and thepaired-pulse ratio (P2/P1). These data in-dicate that, for brief glutamate waveforms,there is a tight coupling between activationand desensitization.
To examine whether the 10 ms paired-pulse ratio was a result of modest desensi-tization or attributable to a fast recovery,we examined how AMPARs enter the de-sensitization state after transient activa-tion at high laser intensities (Fig. 7E). Fornear saturating responses, desensitizationreached a maximum at 10 ms and thenrecovered over a slower time course (Fig.7F), similar to that observed for extrasyn-aptic receptors in Purkinje cells after 1 msapplications of 1 mM glutamate (Hausserand Roth, 1997). These results indicatethat synaptic AMPARs in GCs are surpris-ingly resistant to desensitization duringtransient synaptic-like activations at phys-iologically relevant occupancies.
Desensitization by spillover-likephotolysis-evoked AMPAR currentsThe amount of AMPAR desensitizationthat occurs in the presence and absence ofthe direct quantal component has beendifficult to address experimentally because
Figure 6. Numerical simulations of single-photon and two-photon diffraction-limited uncaging within a simplified 3D MF–GCstructure. A, Cross section (x–z plane) of part of the MF–GC diffusional space and the superimposed small diffraction-limited UV iPSF (blue)used for small-spot simulations. Glutamate uncaging and diffusion occurred in the space between dendritic digits, GC soma, and the MFs(20 nm wide). Black rectangle indicates 200 nm PSD. Open circles represent MF synaptic vesicles. B, Diffusional space rotated by 90° withrespect to the iPSF used to estimate the extreme condition when the long axis of iPSF is parallel to the synaptic cleft. C, Simulatedphotolysis-evoked [Glut]cleft transients for a brief illumination pulse (20 �s) using the measured one-photon iPSF (from Fig. 4 B; red) anda simulated two-photon excitation volume (blue). The two-photon excitation volume was approximated by a 3D Gaussian function withlateral and axial dimensions corresponding to the minimum theoretical values for 720 nm light (FWHMs of 276 and 995 nm; NA 1.0) (Zipfelet al., 2003). Solid traces are simulations when the iPSF orientation is as in A, and dashed lines are when the iPSF is rotated 90° as in B. Theblack trace is the simulated quantal [Glut]cleft decay waveform arising from the instantaneous release of 4000 glutamate molecules (Nielsen et al.,2004) aligned to start at the end of the illumination pulse. All traces are normalized to their peak values. D, Simulated one-photon iPSF photolysis-evoked [Glut]cleft transients (solid lines) and [MNI-glutamate]cleft (dashed lines) for three different uncaging rate constants (k), using a 20 �suncaging duration. E, Peak normalized simulated [Glut]cleft transients from D (solid lines) and simulations for the 90° rotation (dashedlines). Black trace is the simulated quantal [Glut]cleft time course as in C. F, Spatial profile of the [Glut] at the end of a 20�s uncaging pulsefor the upright spot orientation and different values of k (FWHM of 0.27, 0.30, and 0.49 �m for increasing uncaging rates, respectively).Dashed lines are the predicted spatial profiles at 200�s after the start of the uncaging pulse, which are scaled to their corresponding peakamplitude at 20 �s (the color code is preserved; 0.90, 0.94, and 1.15 �m for increasing uncaging rates, respectively).
8352 • J. Neurosci., August 1, 2007 • 27(31):8344 – 8357 DiGregorio et al. • Synaptic AMPA Receptor Properties

the receptor population activated by stochastic release variesfrom trial to trial, whereas all PSDs are activated by spillover oneach trial. We therefore used diffraction-limited small-spot pho-tolysis protocols of different amplitudes and durations to exam-ine the desensitization produced by the various [Glut]cleft com-ponents. Figure 8A compares pEPSCs generated with 20 �s and 1ms illumination protocols with the quantal-plus-spillover andspillover-only eEPSC components from DiGregorio et al. (2002).The light intensities were adjusted so that the mean rise times andthe relative occupancies of the pEPSCs were reasonably close tothose calculated for the spillover and quantal components of theeEPSC. This resulted in a slight overestimation of the fractional
activation for the spillover-only pEPSC (9vs 6% for the eEPSC) and an underesti-mate for the quantal-plus-spillover pEPSC(34 vs 49% for the eEPSC) (Fig. 8B). Wethen tested the level of desensitization aris-ing from these different activations with asecond brief illumination pulse that pro-duced maximal activation. The P2/P1 indi-cates that, after a spillover-like pEPSC,only 10 � 2% (n � 5) of the receptorsenter desensitization, whereas a quantal-plus-spillover pEPSC induced 41 � 3%.These results suggest that the high levels of[Glut]cleft that produce an intermediateoccupancy after quantal release, in thepresence of spillover, are more effective atinducing desensitization than the slowerlow [Glut]Cleft during transmitter spilloveralone.
Modification of an existing channelmodel to match GC AMPAR behaviorOur measurement of AMPAR desensitiza-tion is a macroscopic property of the cur-rent, which arises from at least two distinctmicroscopic processes: activation (gluta-mate binding and channel opening) anddesensitization. The concentration depen-dence of the time course of activation sug-gests that glutamate binding is limiting atlow occupancies and may influence thetime course of desensitization. To under-stand how the unique macroscopic desen-sitization properties of GC AMPARsmight arise from microscopic transitions,we examined whether an existing AMPARmodel (WJ) (Wadiche and Jahr, 2001)could be modified to reproduce the GCAMPAR responses to [Glut]cleft steps (Fig.3) and to predict the EPSC depression dur-ing a train stimulus (Fig. 8D). A strikingfeature of the GC AMPAR response to stepchanges in glutamate is the strong concen-tration dependence of the time course ofdesensitization and the large steady-statecurrent at low levels of activation (�10%).Changing the rate constants that governedglutamate binding could mimic the con-centration dependence of the time courseof desensitization but failed to reproducethe large steady-state current. We there-
fore adjusted the transitions into the desensitized states. We firstreduced the rate of entry into only the singly bound desensitiza-tion state in the AMPAR model (C1 to C3) (Fig. 8C) to reproducethe observed large acceleration in desensitization time course as afunction of activation. To maintain microscopic reversibility, weincreased the rates out of the doubly liganded desensitizationstates, which also increased the nondesensitizing component. Fi-nally, we adjusted the off-rate of the first single bound state tocompensate for changes in the apparent affinity to reproduce theoccupancy of the quantal response (Fig. 2C). A fourfold change inthese rates produced time constants of desensitization (�des of2.4 –12.3 ms) and steady-state levels of activation (16 – 89%) that
Figure 7. Desensitization properties after transient AMPAR activation using paired-pulse small-spot UV photolysis. A, pEPSCsin response to pairs of 20 �s small-spot illumination pulses using a 10 ms interval. Light intensity of the first pulse (P1) was varied,whereas the intensity of the second pulse (P2) was maintained at the highest (saturating) intensity of the first pulse. B, Amplitudesof small-spot pEPSC responses at different distances for P1 across a dendritic digit in same region as A. Color coding indicatesdifferent light intensities as for P1 in A. Dotted lines show Gaussian fits with FWHMs of 0.55, 0.82, 1.44, and 2.00 �m (for green toblack P1 intensity). Cyan region shows region over which traces in A were collected and averaged. C, Relationships betweenfractional activation of the first pulse (blue circles) or P2/P1 pEPSC amplitude ratio (black triangles) and light intensity. Mean P2/P1
amplitude ratios were 0.88 � 0.04 (n � 6), 0.49 � 0.05 (n � 6), and 0.30 � 0.02 (n � 7) for low, medium, high light levels,respectively. D, Relationship between P2/P1 pEPSC amplitude ratio and channel open probability (Popen) for 13 cells. Dashed lineshows linear regression fit with right-hand intercept of 0.38 for a Popen � 1. E, High-intensity paired-pulse pEPSC responses forvarious interpulse intervals (2 ms, gray; 5 ms, blue; 10 ms, red; 50 ms, green; 100 ms, black). F, Relationship between 1 � (P2/P1),which indicates the fraction of desensitization, and interpulse interval for 10 cells.
DiGregorio et al. • Synaptic AMPA Receptor Properties J. Neurosci., August 1, 2007 • 27(31):8344 – 8357 • 8353

closely matched those for the GC AMPARat high and low occupancies, respectively(Fig. 8C). A uniform change of similarmagnitude in either the entry or exit fromthe desensitized states (C3–C6) did not re-produce the observed change in desensiti-zation time constant but matched thesteady-state desensitization as a functionof receptor activation.
We then examined how well the modi-fied AMPAR model could predict the ex-perimentally measured eEPSC amplitudesgenerated by 100 Hz MF stimulation bysimulating the [Glut]cleft with a 3D modelof the MF–GC synapse (Nielsen et al.,2004), which included stochastic release,presynaptic short-term plasticity, gluta-mate diffusion, and uptake (see Materialsand Methods). Figure 8D shows that thesimulated 100 Hz train closely matchedthe measured GC EPSC train, unlike theoriginal WJ scheme, which exhibited amore pronounced depression during thetrain. Moreover, the behavior of the mod-ified scheme could not be reproduced bythe affinity change alone or by only speed-ing the exit from desensitization stateswith multiple glutamate molecules bound(C4–C6; simulations not shown). Thesesimulations show that low probabilities ofoccupying desensitization states, espe-cially those with few glutamate moleculesbound, could account for the kineticand steady-state macroscopic propertiesof currents during steps of glutamateand during high-frequency synaptictransmission.
DiscussionWe examined the properties of AMPARdesensitization at the cerebellar MF–GCsynapse using glutamate uncaging. Thetime course of desensitization, after stepincreases in [Glut]cleft, accelerated sixfoldas the fraction of activated AMPARs in-creased. However, the final level of desen-sitization was only weakly dependenton occupancy, with a desensitization-resistant current compo-nent remaining in saturating glutamate. Synaptic-like activationof GC AMPARs exhibited a marked resistance to desensitizationat low occupancies, explaining how GCs can maintain phasic andtonic signaling during high-frequency transmission.
A photolysis method for probing the kinetics ofsynaptic receptorsWe have taken advantage of the efficiency and versatility ofsingle-photon excitation to produce both transient and step-like[Glut]cleft waveforms with illumination spots of different sizes.Although large UV illumination spots have been used previouslyto create step changes in [Glut]cleft (Otis et al., 1996b; Canepari etal., 2001; Lowe, 2003), by modulating the light intensity, and thusthe uncaged [Glut]cleft, we determined the activation-dependentkinetic properties of desensitization of synaptic AMPARs for the
first time. In preparations in which synaptic receptors are notlocated at the end of the dendrite, it may be necessary to use largerspots that cover a dendritic branch or the whole arbor to achieveuniform [Glut]cleft. In these cases, the potentially larger contribu-tion of extrasynaptic receptors should be considered. However,we also show that pairs of small-spot illumination pulses can alsobe used to assay the level of desensitization of synaptic receptors.
Desensitization properties of GC AMPARsOur results show that synaptic AMPARs in GCs are more resis-tant to desensitization than reported previously for native chan-nels from a range of different neurons (Jonas et al., 1993; Geiger etal., 1995; Raman and Trussell, 1995; Hausser and Roth, 1997).Weak desensitization could arise from a slower rate of entry intoor a faster recovery from desensitization states. Our simulations,using a modified version of an existing native AMPAR kinetic
Figure 8. Weak desensitization of pEPSCs at low receptor occupancies. A, pEPSCs in response to a 10 ms paired-pulse protocol(top traces), in which P1 intensity was set to a low and long duration to mimic activation by glutamate spillover alone (�1 �W,1 ms; red traces) or a brief intermediate intensity to mimic the quantal and spillover current components together (20 �s, 15–30�W; blue traces). P2 was set to a brief high intensity. A maximal pEPSC response to P2 was obtained when P1 was omitted (dashedline). For comparison, the inset shows the overall mean AMPAR-mediated synaptic eEPSC and the spillover-mediated eEPSC takenfrom DiGregorio et al. (2002). Calibration: 10 pA, 3 ms. B, Summary plot for five cells, showing fractional pEPSC activation (Rel.active.), 10 –90% rise time, and fractional activation of P2 (P2/P2max) for quantal-plus-spillover and spillover-only pEPSC re-sponses. In these experiments, when P1 and P2 were both maximal, P2/P1 was 0.31 � 0.02, indicating a near saturated response,similar to that obtained for the dataset in Figure 7. C, Simulated AMPAR responses of the kinetic scheme (Wadiche and Jahr, 2001)with modified rate constants indicated in blue (inset): rate constants between C1–C3 was decreased by fourfold, whereas C1–C0,C4–C2, C5–O, and C6–C7 were all increased fourfold. The desensitization states are C3–C7, and the asterisks denote [Glut]-dependent transitions. The [Glut] was stepped from 0 to 0.1, 0.2, 0.5, 1, and 10 mM for 100 ms. Gray dashed lines are single-exponential fits. Red lines are the step responses of the WJ model for 0.06 and 10 mM. D, Response of modified AMPAR model(black; from C) to a simulated [Glut]cleft waveform train (data not shown). Mean EPSC trains were constructed for each kineticscheme by feeding 500 stochastic [Glut]cleft trains through the model and averaging the currents. The peak [Glut]cleft of thequantal component was 8 mM, and the steady-state level was 0.06 mM at the end of 10 stimuli. All traces are normalized to theirfirst peak amplitude. The gray trace is a recorded EPSC train from the MF–GC synapse, and the filled circles are mean valuesaveraged across five cells (both taken from Saviane and Silver, 2006). The simulated EPSC trains with the modified kinetic schemeproduce much less depression than the original WJ model (red) and are comparable with the experimental data (SS) (Saviane andSilver, 2006). The peak open probabilities were 0.22 and 0.27 for the modified AMPAR model and the WJ model, respectively.
8354 • J. Neurosci., August 1, 2007 • 27(31):8344 – 8357 DiGregorio et al. • Synaptic AMPA Receptor Properties
scheme (Wadiche and Jahr, 2001), suggest that a slowed rate ofentry into a singly bound desensitization state (C3) (Fig. 8C) isimportant for producing the pronounced slowing of the desensi-tization time course at low occupancies. Moreover, they also in-dicate that a faster exit from multi-liganded desensitization states(C3–C6) (Fig. 8C) could contribute to the weak steady-state de-sensitization observed during glutamate steps. However, directmeasurement of the time course of recovery from desensitizationusing paired pEPSCs showed that the recovery in the current isnot as fast as the ultrafast recovery observed at parallel fiber tostellate cell synapses (Crowley et al., 2007) but is similar to thatobserved at multipolar interneurons in cortex (�60% at 100ms)(Rozov et al., 2001). These results suggest that slowed entry intodesensitization states at low levels of activation together with afaster exit from desensitization states at higher levels of acti-vation could underlie the concentration dependence of desen-sitization of GC AMPARs and thus, their ability to maintainhigh-frequency transmission in the presence of glutamateaccumulation.
The time course of desensitization of AMPARs at the MF–GCsynapse is similar to non-NMDA receptors from cultured imma-ture GCs at saturating concentrations (Silver et al., 1996a), butthe synaptic AMPARs exhibit much stronger occupancy-dependent kinetics and a larger desensitization-resistant currentcomponent. These unique desensitization properties could arisefrom a number of potential mechanisms, including subunit com-position, posttranslational modification, modulation by ancillaryproteins, or channel phosphorylation state. Because previousstudies of native AMPARs were performed using the outside-outpatch method, it is also possible that these distinct propertiescould arise from differences between extrasynaptic and synapticreceptors (Liu and Cull-Candy, 2000) (but see Spruston et al.,1995; Hausser and Roth, 1997; Lawrence and Trussell, 2000) orfrom altered receptor properties in patches (Clark et al., 1997).
Cerebellar GCs express both flip and flop splice variants ofGluR2 and GluR4 subunits (Mosbacher et al., 1994), and theirheteromers are likely to mediate the AMPAR synaptic current(Cathala et al., 2005). Here we show that the steady-state compo-nent of the GC AMPAR current is larger than for recombinantGluR2 and GluR4 (flip and flop splice variants) subunits (Mos-bacher et al., 1994). However, it is intriguing that the steady-statecurrents we observed are similar to the incomplete desensitiza-tion behavior of GluR2 and GluR4 when coexpressed with Star-gazin (Priel et al., 2005; Tomita et al., 2005), a transmembraneAMPA receptor regulatory protein that is essential for traffickingAMPARs to the membrane in GCs (Hashimoto et al., 1999).Interaction of AMPARs with an extracellular domain of Stargazinhas also been shown to slow deactivation, slow the time courseand the extent of desensitization, and increase apparent affinityfor glutamate (Priel et al., 2005; Tomita et al., 2005; Turetsky etal., 2005). Our results, showing that synaptic AMPARs in GCshave a slower time course of desensitization and a much largersteady-state current than GluR2/4 AMPAR subunits expressedwithout Stargazin, are therefore consistent with the idea thatStargazin modifies synaptic AMPAR channels in GCs, makingthem more resistant to desensitization.
Deactivation and desensitization of AMPARs duringsynaptic transmissionIt has been proposed that the decay of the quantal AMPAR EPSCis mediated by desensitization in cerebellar GCs on the basis ofthe expression and fast desensitization time course of the flopisoforms of GluR2 and GluR4 (Mosbacher et al., 1994). However,
immature cultured GCs have desensitization time constantsmuch slower than the mEPSC decay (Silver et al., 1996a), arguingthat deactivation plays a predominant role. More recent studieshave argued that desensitization plays a role in the decay of EPSCson the basis of a slowing of mEPSCs by CTZ in slices and a fastcomponent desensitization in patches from cell cultures (Wall etal., 2002). By directly measuring the kinetics of AMPAR desensi-tization and the occupancy during the MF–GC EPSC with large-spot uncaging in slices (see Materials and Methods and Results),we have shown that desensitization is too slow to account for themajor component of the mEPSC decay.
We estimate that, after quantal release, 49% of AMPARs areactivated, producing 30 – 40% desensitization after 10 ms. Thismatches the 20% desensitization obtained with quantal analysisfor paired-pulse and tetanic synaptic stimulation protocols (Sa-viane and Silver, 2006), given that release occurs at only 50% ofthe synaptic contacts on each trial (Sargent et al., 2005). Previousstudies at this synapse (Xu-Friedman and Regehr, 2003) and else-where (Otis et al., 1996b; Taschenberger et al., 2005) have pro-posed that the [Glut]cleft generated by spillover could cause sig-nificant receptor desensitization and thus give rise to STD.Although the spillover component provides half the charge trans-fer during a single AMPAR-mediated EPSC (DiGregorio et al.,2002), the peak of the spillover conductance, which representsthe summed activation of receptors at all PSDs on a particular GChand (180 pS) (DiGregorio et al., 2002), represents only 6% of themaximal current (2.3 nS) (Fig. 2C). Our results from paired-pulse uncaging show that, at these levels of activation, synapticAMPARs in GCs are resistant to desensitization, and the majorityof the desensitization observed at the MF–GC synapse duringpaired-pulse stimulation arises when quantal release and spill-over occur together.
The brief nature of the [Glut]cleft waveform after quantal re-lease may shield AMPA receptors from entering desensitizedstates at many central synapses, thereby preventing postsynapticSTD (Dobrunz et al., 1997; Dittman and Regehr, 1998; Silver etal., 1998; Hjelmstad et al., 1999; Renden et al., 2005). Our resultssuggest that the presence of AMPARs with a lower-affinity desen-sitization state is another possible way synapses could minimizethe effects of desensitization, during repetitive activation and de-layed clearance of glutamate during high-frequency trains. Thisbehavior might contribute to the lack of desensitization-dependent STD in medial nucleus of the trapezoid body neuronswhen residual glutamate is modulated by blocking uptake (Taka-yasu et al., 2004, 2005; Renden et al., 2005) and could possiblyaccount for some of the developmental changes in STD (Brenow-itz and Trussell, 2001; Renden et al., 2005). A related mechanisminvolving AMPARs with fast recovery from desensitization isthought to minimize desensitization at some synapses onto inter-neurons (Rozov et al., 2001; Crowley et al., 2007). These resultssuggest that AMPAR desensitization properties may be tuned toproduce differing patterns of short-term plasticity at synapsesthat experience either repetitive activation or delayed glutamateclearance.
Implications for signal processing in the cerebellar GC layerThe rapid kinetics of activation and deactivation of synaptic AM-PARs are likely to be important for conveying temporal signals,because the EPSC time course determines the temporal precisionof spike generation (Galarreta and Hestrin, 2001; Cathala et al.,2003; Sargent et al., 2005). In vivo recordings from awake behav-ing monkeys show that some MFs convey sustained high-frequency rate-coded signals that encode features such as joint
DiGregorio et al. • Synaptic AMPA Receptor Properties J. Neurosci., August 1, 2007 • 27(31):8344 – 8357 • 8355

position (van Kan et al., 1993). Synaptic AMPARs in GCs appeartuned to transmit both phasic and tonic current componentssimultaneously during such high-frequency trains. Preservationof the fast quantal component will ensure that noise is present inthe excitatory input over a wide range of frequencies, a propertythat is essential for inhibition-mediated multiplicative gain mod-ulation (Mitchell and Silver, 2003). Moreover, the modest desen-sitization of the quantal component of the EPSC, which underliesthe majority of STD at the MF–GC synapse (Saviane and Silver,2006), may enhance the sensitivity of GCs to changes in firing rateover absolute rates (Abbott et al., 1997). Here, we show that aweak level of desensitization at low occupancies is the mechanismby which synaptic AMPARs convert the residual glutamate andspillover that builds up during sustained high-frequency trans-mission into a tonic current that conveys the majority of thecharge at high MF firing rates (Saviane and Silver, 2006). TheseAMPAR properties enable the GC to detect changes in MF firingrate and transmit rate-coded information over an unusuallybroad bandwidth.
ReferencesAbbott LF, Varela JA, Sen K, Nelson SB (1997) Synaptic depression and
cortical gain control. Science 275:220 –224.Akopian G, Walsh JP (2007) Reliable long-lasting depression interacts with
variable short-term facilitation to determine corticostriatal paired-pulseplasticity in young rats. J Physiol (Lond) 580:225–240.
Bagal AA, Kao JP, Tang CM, Thompson SM (2005) Long-term potentiationof exogenous glutamate responses at single dendritic spines. Proc NatlAcad Sci USA 102:14434 –14439.
Brenowitz S, Trussell LO (2001) Maturation of synaptic transmission atend-bulb synapses of the cochlear nucleus. J Neurosci 21:9487–9498.
Canepari M, Nelson L, Papageorgiou G, Corrie JE, Ogden D (2001) Photo-chemical and pharmacological evaluation of 7-nitroindolinyl-and4-methoxy-7-nitroindolinyl-amino acids as novel, fast caged neurotrans-mitters. J Neurosci Methods 112:29 – 42.
Carter AG, Regehr WG (2000) Prolonged synaptic currents and glutamatespillover at the parallel fiber to stellate cell synapse. J Neurosci20:4423– 4434.
Carter AG, Sabatini BL (2004) State-dependent calcium signaling in den-dritic spines of striatal medium spiny neurons. Neuron 44:483– 493.
Cathala L, Brickley S, Cull-Candy S, Farrant M (2003) Maturation of EPSCsand intrinsic membrane properties enhances precision at a cerebellarsynapse. J Neurosci 23:6074 – 6085.
Cathala L, Holderith NB, Nusser Z, DiGregorio DA, Cull-Candy SG (2005)Changes in synaptic structure underlie the developmental speeding ofAMPA receptor-mediated EPSCs. Nat Neurosci 8:1310 –1318.
Chen C, Blitz DM, Regehr WG (2002) Contributions of receptor desensiti-zation and saturation to plasticity at the retinogeniculate synapse. Neuron33:779 –788.
Clark BA, Farrant M, Cull-Candy SG (1997) A direct comparison of thesingle-channel properties of synaptic and extrasynaptic NMDA receptors.J Neurosci 17:107–116.
Colquhoun D, Jonas P, Sakmann B (1992) Action of brief pulses of gluta-mate on AMPA/kainate receptors in patches from different neurones ofrat hippocampal slices. J Physiol (Lond) 458:261–287.
Crowley JJ, Carter AG, Regehr WG (2007) Fast vesicle replenishment andrapid recovery from desensitization at a single synaptic release site. J Neu-rosci 27:5448 –5460.
Cull-Candy S, Kelly L, Farrant M (2006) Regulation of Ca 2�-permeableAMPA receptors: synaptic plasticity and beyond. Curr Opin Neurobiol16:288 –297.
DiGregorio DA, Nusser Z, Silver RA (2002) Spillover of glutamate ontosynaptic AMPA receptors enhances fast transmission at a cerebellar syn-apse. Neuron 35:521–533.
Dittman JS, Regehr WG (1997) Mechanism and kinetics of heterosynapticdepression at a cerebellar synapse. J Neurosci 17:9048 –9059.
Dittman JS, Regehr WG (1998) Calcium dependence and recovery kineticsof presynaptic depression at the climbing fiber to Purkinje cell synapse.J Neurosci 18:6147– 6162.
Dobrunz LE, Huang EP, Stevens CF (1997) Very short-term plasticity inhippocampal synapses. Proc Natl Acad Sci USA 94:14843–14847.
Eder M, Becker K, Rammes G, Schierloh A, Azad SC, Zieglgansberger W,Dodt HU (2003) Distribution and properties of functional postsynaptickainate receptors on neocortical layer V pyramidal neurons. J Neurosci23:6660 – 6670.
Galarreta M, Hestrin S (2001) Spike transmission and synchrony detectionin networks of GABAergic interneurons. Science 292:2295–2299.
Geiger JR, Melcher T, Koh DS, Sakmann B, Seeburg PH, Jonas P, Monyer H(1995) Relative abundance of subunit mRNAs determines gating andCa 2� permeability of AMPA receptors in principal neurons and interneu-rons in rat CNS. Neuron 15:193–204.
Greengard P, Jen J, Nairn AC, Stevens CF (1991) Enhancement of the glu-tamate response by cAMP-dependent protein kinase in hippocampalneurons. Science 253:1135–1138.
Hashimoto K, Fukaya M, Qiao X, Sakimura K, Watanabe M, Kano M (1999)Impairment of AMPA receptor function in cerebellar granule cells ofataxic mutant mouse stargazer. J Neurosci 19:6027– 6036.
Hausser M, Roth A (1997) Dendritic and somatic glutamate receptor chan-nels in rat cerebellar Purkinje cells. J Physiol (Lond) 501:77–95.
Heinemann SH, Conti F (1992) Nonstationary noise analysis and applica-tion to patch clamp recordings. Methods Enzymol 207:131–148.
Hestrin S (1993) Different glutamate receptor channels mediate fast excita-tory synaptic currents in inhibitory and excitatory cortical neurons. Neu-ron 11:1083–1091.
Hjelmstad GO, Isaac JT, Nicoll RA, Malenka RC (1999) Lack of AMPAreceptor desensitization during basal synaptic transmission in the hip-pocampal slice. J Neurophysiol 81:3096 –3099.
Isaacson JS, Walmsley B (1996) Amplitude and time course of spontaneousand evoked excitatory postsynaptic currents in bushy cells of the antero-ventral cochlear nucleus. J Neurophysiol 76:1566 –1571.
Jahn K, Bufler J, Franke C (1998) Kinetics of AMPA-type glutamate recep-tor channels in rat caudate-putamen neurones show a wide range of de-sensitization but distinct recovery characteristics. Eur J Neurosci10:664 – 672.
Jonas P (2000) The time course of signaling at central glutamatergic syn-apses. News Physiol Sci 15:83– 89.
Jonas P, Major G, Sakmann B (1993) Quantal components of unitary EPSCsat the mossy fibre synapse on CA3 pyramidal cells of rat hippocampus.J Physiol (Lond) 472:615– 663.
Jones MV, Westbrook GL (1996) The impact of receptor desensitization onfast synaptic transmission. Trends Neurosci 19:96 –101.
Koike M, Tsukada S, Tsuzuki K, Kijima H, Ozawa S (2000) Regulation ofkinetic properties of GluR2 AMPA receptor channels by alternative splic-ing. J Neurosci 20:2166 –2174.
Krampfl K, Schlesinger F, Zorner A, Kappler M, Dengler R, Bufler J (2002)Control of kinetic properties of GluR2 flop AMPA-type channels: impactof R/G nuclear editing. Eur J Neurosci 15:51– 62.
Lawrence JJ, Trussell LO (2000) Long-term specification of AMPA receptorproperties after synapse formation. J Neurosci 20:4864 – 4870.
Liu SQ, Cull-Candy SG (2000) Synaptic activity at calcium-permeableAMPA receptors induces a switch in receptor subtype. Nature405:454 – 458.
Losonczy A, Magee JC (2006) Integrative properties of radial oblique den-drites in hippocampal CA1 pyramidal neurons. Neuron 50:291–307.
Lowe G (2003) Flash photolysis reveals a diversity of ionotropic glutamatereceptors on the mitral cell somatodendritic membrane. J Neurophysiol90:1737–1746.
Matsuzaki M, Ellis-Davies GC, Nemoto T, Miyashita Y, Iino M, Kasai H(2001) Dendritic spine geometry is critical for AMPA receptor expres-sion in hippocampal CA1 pyramidal neurons. Nat Neurosci4:1086 –1092.
Mitchell SJ, Silver RA (2003) Shunting inhibition modulates neuronal gainduring synaptic excitation. Neuron 38:433– 445.
Morrison J, Wan P, Corrie JE, Papageorgiou G (2002) Mechanisms of pho-torelease of carboxylic acids from 1-acyl-7-nitroindolines in solutions ofvarying water content. Photochem Photobiol Sci 1:960 –969.
Mosbacher J, Schoepfer R, Monyer H, Burnashev N, Seeburg PH, Ruppers-berg JP (1994) A molecular determinant for submillisecond desensitiza-tion in glutamate receptors. Science 266:1059 –1062.
Nielsen TA, DiGregorio DA, Silver RA (2004) Modulation of glutamate
8356 • J. Neurosci., August 1, 2007 • 27(31):8344 – 8357 DiGregorio et al. • Synaptic AMPA Receptor Properties

mobility reveals the mechanism underlying slow-rising AMPAR EPSCsand the diffusion coefficient in the synaptic cleft. Neuron 42:757–771.
Otis TS, Wu YC, Trussell LO (1996a) Delayed clearance of transmitter andthe role of glutamate transporters at synapses with multiple release sites.J Neurosci 16:1634 –1644.
Otis T, Zhang S, Trussell LO (1996b) Direct measurement of AMPA recep-tor desensitization induced by glutamatergic synaptic transmission.J Neurosci 16:7496 –7504.
Papageorgiou GCJ (2000) Effects of aromatic substituents on the photo-cleavage of 1-acyl-7nitroindolines. Tetrahedron 56:8197– 8205.
Priel A, Kolleker A, Ayalon G, Gillor M, Osten P, Stern-Bach Y (2005) Star-gazin reduces desensitization and slows deactivation of the AMPA-typeglutamate receptors. J Neurosci 25:2682–2686.
Raman IM, Trussell LO (1992) The kinetics of the response to glutamateand kainate in neurons of the avian cochlear nucleus. Neuron 9:173–186.
Raman IM, Trussell LO (1995) The mechanism of alpha-amino-3-hydroxy-5-methyl-4-isoxazolepropionate receptor desensitization after removal ofglutamate. Biophys J 68:137–146.
Raman IM, Zhang S, Trussell LO (1994) Pathway-specific variants of AMPAreceptors and their contribution to neuronal signaling. J Neurosci14:4998 –5010.
Renden R, Taschenberger H, Puente N, Rusakov DA, Duvoisin R, Wang LY,Lehre KP, von Gersdorff H (2005) Glutamate transporter studies revealthe pruning of metabotropic glutamate receptors and absence of AMPAreceptor desensitization at mature calyx of held synapses. J Neurosci25:8482– 8497.
Robert A, Howe JR (2003) How AMPA receptor desensitization depends onreceptor occupancy. J Neurosci 23:847– 858.
Rozov A, Jerecic J, Sakmann B, Burnashev N (2001) AMPA receptor chan-nels with long-lasting desensitization in bipolar interneurons contributeto synaptic depression in a novel feedback circuit in layer 2/3 of rat neo-cortex. J Neurosci 21:8062– 8071.
Sargent PB, Saviane C, Nielsen TA, DiGregorio DA, Silver RA (2005) Rapidvesicular release, quantal variability and spillover contribute to the preci-sion and reliability of transmission at a glomerular synapse. J Neurosci25:8173– 8187.
Saviane C, Silver RA (2006) Fast vesicle reloading and a large pool sustainhigh bandwidth transmission at a central synapse. Nature 439:983–987.
Sheppard CJR, Torok P (1997) Effects of specimen refractive index on con-focal imaging. J Microsc 185:366 –374.
Silver RA, Cull-Candy SG, Takahashi T (1996a) Non-NMDA glutamate re-ceptor occupancy and open probability at a rat cerebellar synapse withsingle and multiple release sites. J Physiol (Lond) 494:231–250.
Silver RA, Colquhoun D, Cull-Candy SG, Edmonds B (1996b) Deactivationand desensitization of non-NMDA receptors in patches and the timecourse of EPSCs in rat cerebellar granule cells. J Physiol (Lond)493:167–173.
Silver RA, Momiyama A, Cull-Candy SG (1998) Locus of frequency-dependent depression identified with multiple-probability fluctuationanalysis at rat climbing fibre-Purkinje cell synapses. J Physiol (Lond)510:881–902.
Smith MA, Ellis-Davies GC, Magee JC (2003) Mechanism of the distance-
dependent scaling of Schaffer collateral synapses in rat CA1 pyramidalneurons. J Physiol (Lond) 548:245–258.
Smith TC, Wang LY, Howe JR (2000) Heterogeneous conductance levels ofnative AMPA receptors. J Neurosci 20:2073–2085.
Spruston N, Jonas P, Sakmann B (1995) Dendritic glutamate receptor chan-nels in rat hippocampal CA3 and CA1 pyramidal neurons. J Physiol(Lond) 482:325–352.
Takayasu Y, Iino M, Ozawa S (2004) Roles of glutamate transporters inshaping excitatory synaptic currents in cerebellar Purkinje cells. EurJ Neurosci 19:1285–1295.
Takayasu Y, Iino M, Kakegawa W, Maeno H, Watase K, Wada K, YanagiharaD, Miyazaki T, Komine O, Watanabe M, Tanaka K, Ozawa S (2005)Differential roles of glial and neuronal glutamate transporters in Purkinjecell synapses. J Neurosci 25:8788 – 8793.
Tanaka J, Matsuzaki M, Tarusawa E, Momiyama A, Molnar E, Kasai H, Shige-moto R (2005) Number and density of AMPA receptors in single syn-apses in immature cerebellum. J Neurosci 25:799 – 807.
Taschenberger H, Scheuss V, Neher E (2005) Release kinetics, quantal pa-rameters and their modulation during short-term depression at a devel-oping synapse in the rat CNS. J Physiol (Lond) 568:513–537.
Tomita S, Adesnik H, Sekiguchi M, Zhang W, Wada K, Howe JR, Nicoll RA,Bredt DS (2005) Stargazin modulates AMPA receptor gating and traf-ficking by distinct domains. Nature 435:1052–1058.
Trussell LO, Fischbach GD (1989) Glutamate receptor desensitization andits role in synaptic transmission. Neuron 3:209 –218.
Trussell LO, Zhang S, Raman IM (1993) Desensitization of AMPA receptorsupon multiquantal neurotransmitter release. Neuron 10:1185–1196.
Turetsky D, Garringer E, Patneau DK (2005) Stargazin modulates nativeAMPA receptor functional properties by two distinct mechanisms. J Neu-rosci 25:7438 –7448.
van Kan PL, Gibson AR, Houk JC (1993) Movement-related inputs to in-termediate cerebellum of the monkey. J Neurophysiol 69:74 –94.
Wadiche JI, Jahr CE (2001) Multivesicular release at climbing fiber-Purkinje cell synapses. Neuron 32:301–313.
Wall MJ (2005) Short-term synaptic plasticity during development of ratmossy fibre to granule cell synapses. Eur J Neurosci 21:2149 –2158.
Wall MJ, Robert A, Howe JR, Usowicz MM (2002) The speeding of EPSCkinetics during maturation of a central synapse. Eur J Neurosci15:785–797.
Wong AY, Graham BP, Billups B, Forsythe ID (2003) Distinguishing be-tween presynaptic and postsynaptic mechanisms of short-term depres-sion during action potential trains. J Neurosci 23:4868 – 4877.
Xu-Friedman MA, Regehr WG (2003) Ultrastructural contributions to de-sensitization at cerebellar mossy fiber to granule cell synapses. J Neurosci23:2182–2192.
Xu-Friedman MA, Regehr WG (2004) Structural contributions to short-term synaptic plasticity. Physiol Rev 84:69 – 85.
Zhang W, Robert A, Vogensen SB, Howe JR (2006) The relationship be-tween agonist potency and AMPA receptor kinetics. Biophys J91:1336 –1346.
Zipfel WR, Williams RM, Webb WW (2003) Nonlinear magic: multipho-ton microscopy in the biosciences. Nat Biotechnol 21:1369 –1377.
DiGregorio et al. • Synaptic AMPA Receptor Properties J. Neurosci., August 1, 2007 • 27(31):8344 – 8357 • 8357