celebrating 20 years - ferris.edu · ferris state university is an equal opportunity institution....
TRANSCRIPT
Ferris State University is an equal opportunity institution. For information on the University’s Policy on Non-Discrimination, visit ferris.edu/non-discrimination.
Celebrating 20 Years as a Public School Academy Authorizer
CONTRACTPERFORMANCEREPORT2016-2017
Charter Schools Office
Blended Learning Academies Credit Recovery High School

Charter Schools Offi ceFerris State UniversityBig Rapids, MI 49307(231) 591-5802www.ferris.edu/charterschools
Copyright © 2017 Ferris State University Charter Schools Offi ce
CONTRACTUAL GOALS 6
ACADEMY OVERVIEW 8
ACADEMIC PERFORMANCE 10 MEASURE 1: GROWTH MEASURE 2: ACHIEVEMENT MEASURE 3: STATE & FEDERAL ACCOUNTABILITY
THE CHARTER CONTRACT 14
BOARD of DIRECTORS 15
FISCAL PERFORMANCE 16
OTHER MEASURES 18
END NOTES 19
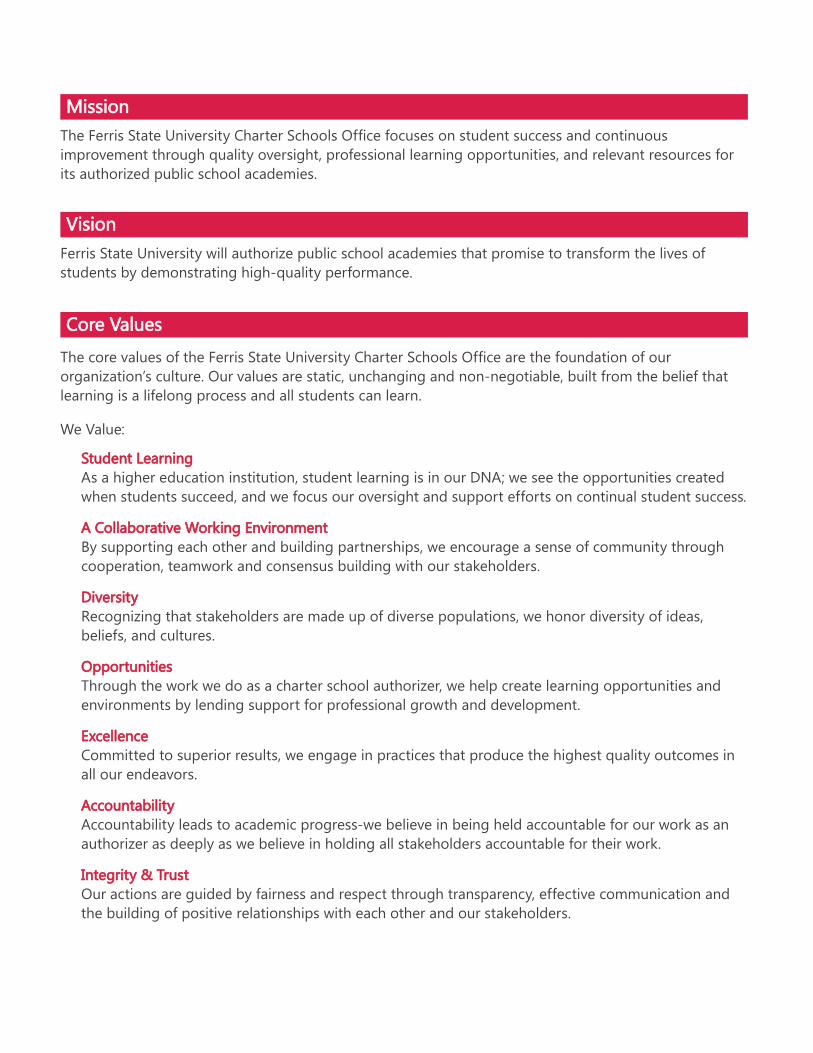
The Ferris State University Charter Schools Offi ce focuses on student success and continuous improvement through quality oversight, professional learning opportunities, and relevant resources for its authorized public school academies.
MissionMission
Ferris State University will authorize public school academies that promise to transform the lives of students by demonstrating high-quality performance.
The core values of the Ferris State University Charter Schools Offi ce are the foundation of our organization’s culture. Our values are static, unchanging and non-negotiable, built from the belief that learning is a lifelong process and all students can learn.
Student LearningStudent LearningAs a higher education institution, student learning is in our DNA; we see the opportunities created when students succeed, and we focus our oversight and support efforts on continual student success.
A Collaborative Working EnvironmentA Collaborative Working EnvironmentBy supporting each other and building partnerships, we encourage a sense of community through cooperation, teamwork and consensus building with our stakeholders.
DiversityDiversityRecognizing that stakeholders are made up of diverse populations, we honor diversity of ideas, beliefs, and cultures.
OpportunitiesOpportunitiesThrough the work we do as a charter school authorizer, we help create learning opportunities and environments by lending support for professional growth and development.
ExcellenceExcellenceCommitted to superior results, we engage in practices that produce the highest quality outcomes in all our endeavors.
AccountabilityAccountabilityAccountability leads to academic progress-we believe in being held accountable for our work as an authorizer as deeply as we believe in holding all stakeholders accountable for their work.
Integrity & TrustIntegrity & TrustOur actions are guided by fairness and respect through transparency, effective communication and the building of positive relationships with each other and our stakeholders.
We Value:
VisionVision
Core ValuesCore Values
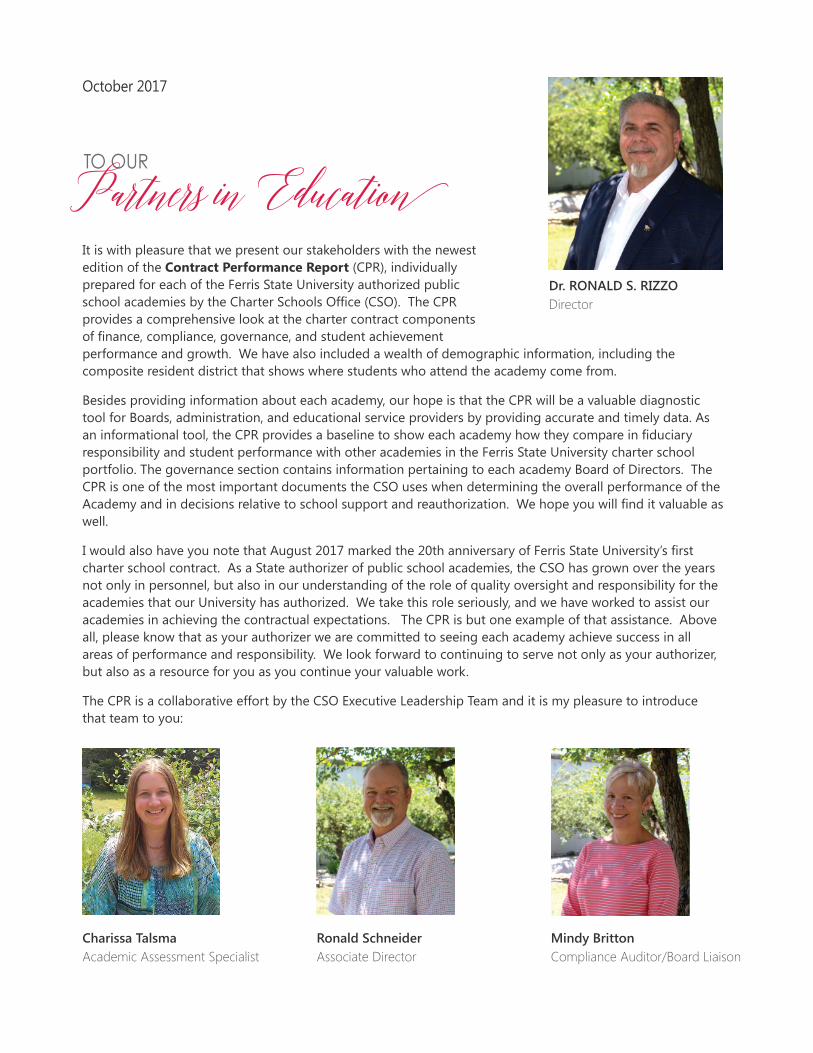
It is with pleasure that we present our stakeholders with the newest edition of the Contract Performance Report (CPR), individually prepared for each of the Ferris State University authorized public school academies by the Charter Schools Offi ce (CSO). The CPR provides a comprehensive look at the charter contract components of fi nance, compliance, governance, and student achievement performance and growth. We have also included a wealth of demographic information, including the composite resident district that shows where students who attend the academy come from.
Besides providing information about each academy, our hope is that the CPR will be a valuable diagnostic tool for Boards, administration, and educational service providers by providing accurate and timely data. As an informational tool, the CPR provides a baseline to show each academy how they compare in fi duciary responsibility and student performance with other academies in the Ferris State University charter school portfolio. The governance section contains information pertaining to each academy Board of Directors. The CPR is one of the most important documents the CSO uses when determining the overall performance of the Academy and in decisions relative to school support and reauthorization. We hope you will fi nd it valuable as well.
I would also have you note that August 2017 marked the 20th anniversary of Ferris State University’s fi rst charter school contract. As a State authorizer of public school academies, the CSO has grown over the years not only in personnel, but also in our understanding of the role of quality oversight and responsibility for the academies that our University has authorized. We take this role seriously, and we have worked to assist our academies in achieving the contractual expectations. The CPR is but one example of that assistance. Above all, please know that as your authorizer we are committed to seeing each academy achieve success in all areas of performance and responsibility. We look forward to continuing to serve not only as your authorizer, but also as a resource for you as you continue your valuable work.
The CPR is a collaborative effort by the CSO Executive Leadership Team and it is my pleasure to introduce that team to you:
Dr. RONALD S. RIZZODirector
October 2017
TO OUR
Charissa TalsmaAcademic Assessment Specialist
Ronald SchneiderAssociate Director
Mindy BrittonCompliance Auditor/Board Liaison
Partners in Educatio
66 Contract Performance Report 2016-2017 © 2017 Ferris State University Charter Schools Offi ce
The Academy shall pursue the educational goal of preparing all students academically for success in college, work, and life. Although an increase in academic achievement for all groups of pupils as measured by assessments and other objective criteria is the most important factor in determining the Academy’s progress toward the achievement of the educational goal, the CSO also considers other factors. Upon request, the Academy shall provide to Ferris State University a written report, along with supporting data, demonstrating:
1. Improved academic achievement for all groups of students, and2. Measurable progress toward the achievement of the educational goal.
It is expected that the Academy will meet the State of Michigan’s accreditation standards and any improvement targets required to be achieved pursuant to state and federal law. The Academy is also expected to remain off the Priority and Focus school lists published by the Michigan Department of Education. If the Academy already has school buildings identifi ed on these lists, it is expected to make the progress necessary for them to no longer be identifi ed.
Pursuant to the Terms and Conditions of the Contract (“Contract”) issued by the Ferris State University Board of Trustees (“University Board”), these Educational Goal Policies (“EG Policies”) have been prepared by the Charter Schools Offi ce (CSO). They now become part of the Contract and will go into effect 30 days after Academy Board notifi cation, as stated in Article XII, Section 12.16 of the Contract for all academies being authorized or re-authorized pursuant to Contracts issued by the University Board. Failure by the Academy Board to comply with these Policies may result in the non-issuance of a Contract, or for existing academies, the initiation of suspension, termination or revocation proceedings under the Contract, and will be taken into account when considering reauthorization of an academy upon expiration of the contract.
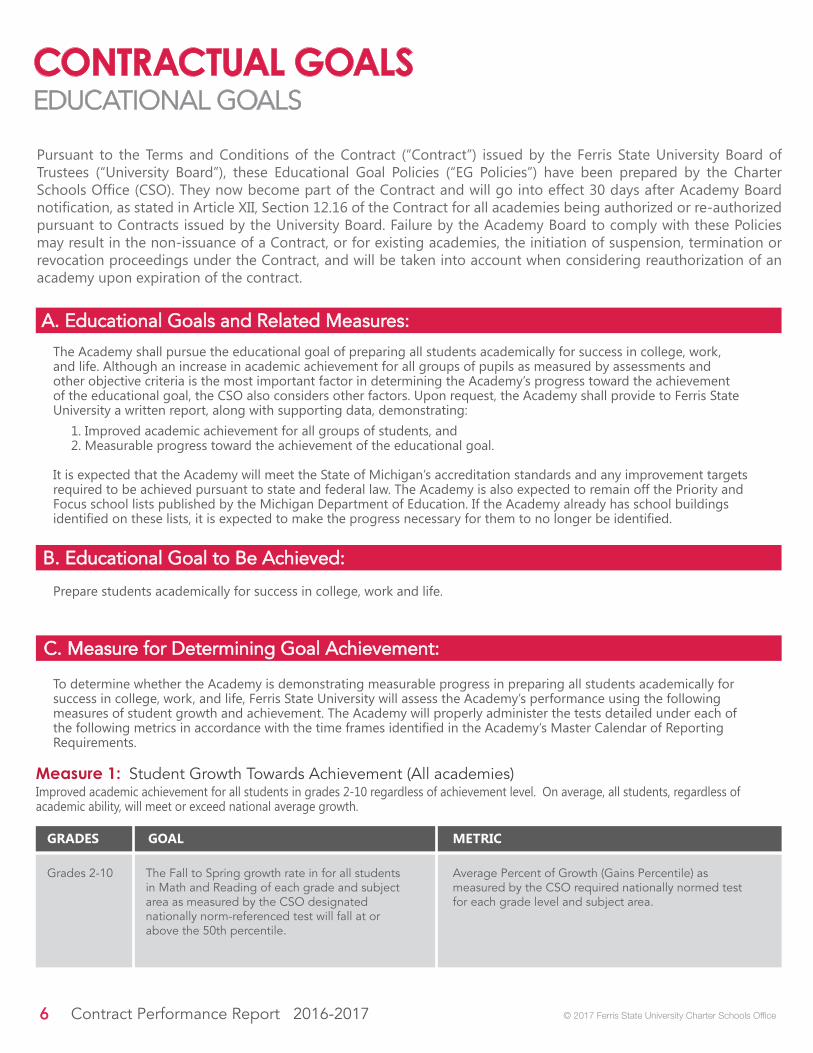
Measure 1: Student Growth Towards Achievement (All academies)Improved academic achievement for all students in grades 2-10 regardless of achievement level. On average, all students, regardless of academic ability, will meet or exceed national average growth.
Prepare students academically for success in college, work and life.
Average Percent of Growth (Gains Percentile) as measured by the CSO required nationally normed test for each grade level and subject area.
Grades 2-10
GRADES GOAL METRIC
The Fall to Spring growth rate in for all students in Math and Reading of each grade and subject area as measured by the CSO designated nationally norm-referenced test will fall at or above the 50th percentile.
To determine whether the Academy is demonstrating measurable progress in preparing all students academically for success in college, work, and life, Ferris State University will assess the Academy’s performance using the following measures of student growth and achievement. The Academy will properly administer the tests detailed under each of the following metrics in accordance with the time frames identifi ed in the Academy’s Master Calendar of Reporting Requirements.
CONTRACTUAL EDUCATIONAL GOALS
A. Educational Goals and Related Measures:A. Educational Goals and Related Measures:
B. Educational Goal to Be Achieved:B. Educational Goal to Be Achieved:
C. Measure for Determining Goal Achievement:C. Measure for Determining Goal Achievement:
77© 2017 Ferris State University Charter Schools Offi ce
GRADES GOAL METRIC
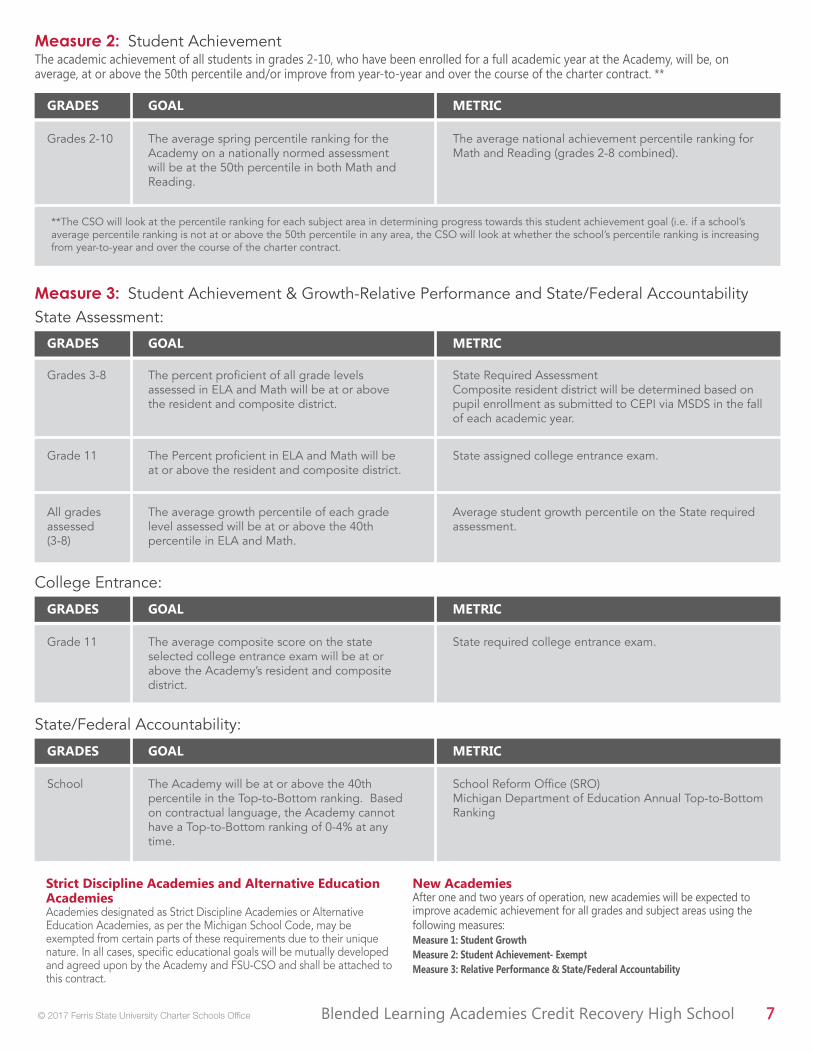
The Academy will be at or above the 40th percentile in the Top-to-Bottom ranking. Based on contractual language, the Academy cannot have a Top-to-Bottom ranking of 0-4% at any time.
School Reform Offi ce (SRO)Michigan Department of Education Annual Top-to-Bottom Ranking
School
CONTRACTUAL EDUCATIONAL GOALSMeasure 2: Student AchievementThe academic achievement of all students in grades 2-10, who have been enrolled for a full academic year at the Academy, will be, on average, at or above the 50th percentile and/or improve from year-to-year and over the course of the charter contract. **
The average spring percentile ranking for the Academy on a nationally normed assessment will be at the 50th percentile in both Math and Reading.
The average national achievement percentile ranking for Math and Reading (grades 2-8 combined).
Grades 2-10
GRADES GOAL METRIC
New AcademiesAfter one and two years of operation, new academies will be expected to improve academic achievement for all grades and subject areas using the following measures:Measure 1: Student GrowthMeasure 2: Student Achievement- ExemptMeasure 3: Relative Performance & State/Federal Accountability
Strict Discipline Academies and Alternative Education AcademiesAcademies designated as Strict Discipline Academies or Alternative Education Academies, as per the Michigan School Code, may be exempted from certain parts of these requirements due to their unique nature. In all cases, specifi c educational goals will be mutually developed and agreed upon by the Academy and FSU-CSO and shall be attached to this contract.
Measure 3: Student Achievement & Growth-Relative Performance and State/Federal Accountability
GRADES GOAL METRIC
**The CSO will look at the percentile ranking for each subject area in determining progress towards this student achievement goal (i.e. if a school’s average percentile ranking is not at or above the 50th percentile in any area, the CSO will look at whether the school’s percentile ranking is increasing from year-to-year and over the course of the charter contract.
The percent profi cient of all grade levels assessed in ELA and Math will be at or above the resident and composite district.
State Required AssessmentComposite resident district will be determined based on pupil enrollment as submitted to CEPI via MSDS in the fall of each academic year.
Grades 3-8
The Percent profi cient in ELA and Math will be at or above the resident and composite district.
State assigned college entrance exam.Grade 11
The average growth percentile of each grade level assessed will be at or above the 40th percentile in ELA and Math.
Average student growth percentile on the State required assessment.
All grades assessed (3-8)
GRADES GOAL METRIC
The average composite score on the state selected college entrance exam will be at or above the Academy’s resident and composite district.
State required college entrance exam.Grade 11
GRADES GOAL METRIC
State Assessment:
College Entrance:
State/Federal Accountability:
88 Contract Performance Report 2016-2017 © 2017 Ferris State University Charter Schools Offi ce
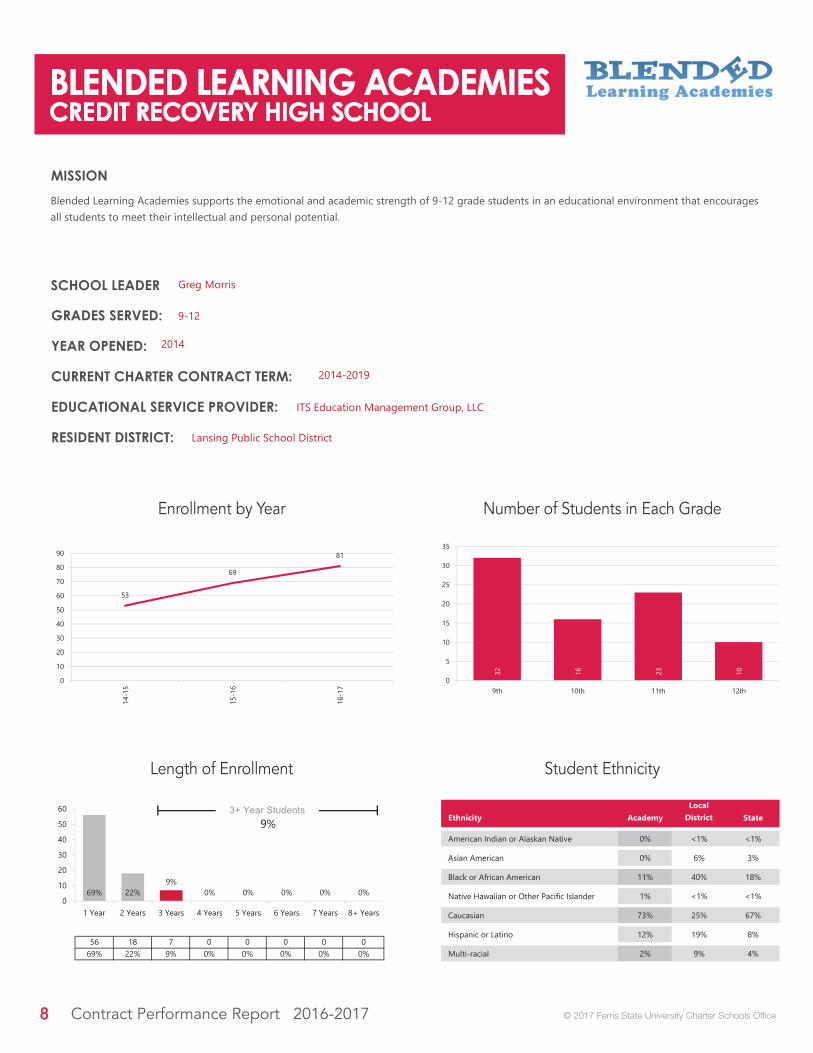
Enrollment by Year
Length of Enrollment
Number of Students in Each Grade
Student Ethnicity
MISSION
GRADES SERVED:
YEAR OPENED:
CURRENT CHARTER CONTRACT TERM:
EDUCATIONAL SERVICE PROVIDER:
RESIDENT DISTRICT:
SCHOOL LEADER
99© 2017 Ferris State University Charter Schools Offi ce
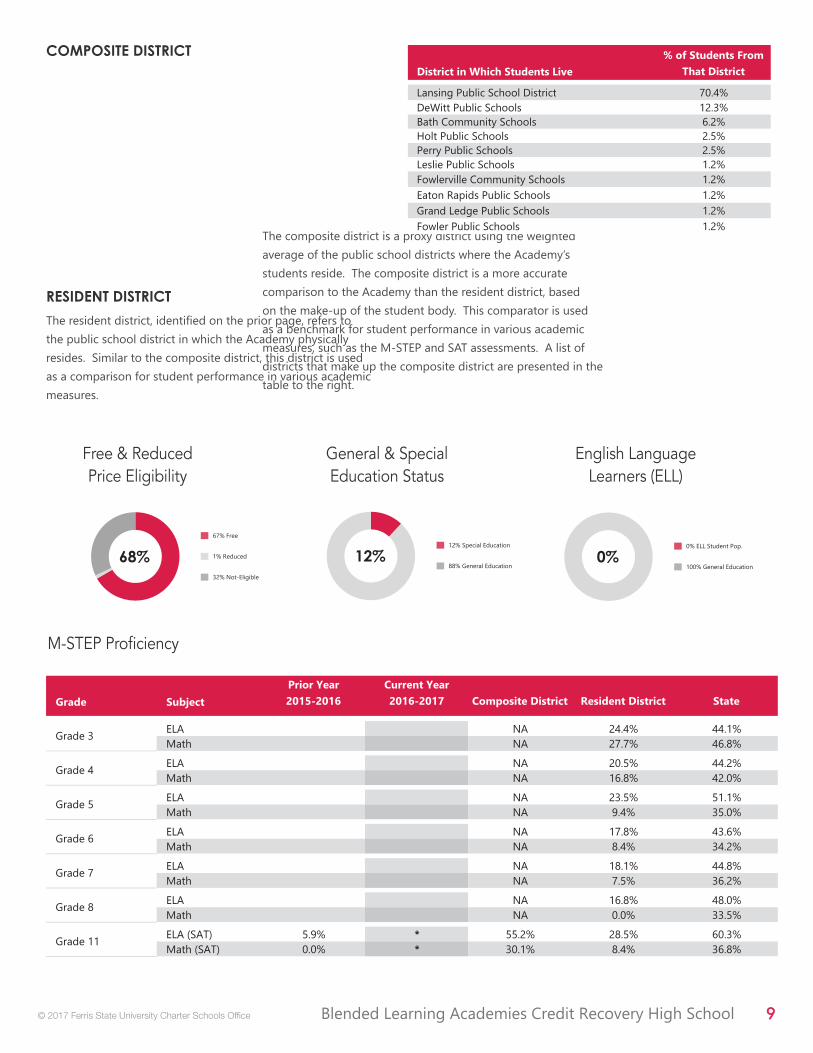
68%
Free & ReducedPrice Eligibility
General & SpecialEducation Status
English LanguageLearners (ELL)
The composite district is a proxy district using the weighted average of the public school districts where the Academy’s students reside. The composite district is a more accurate comparison to the Academy than the resident district, based on the make-up of the student body. This comparator is used as a benchmark for student performance in various academic measures, such as the M-STEP and SAT assessments. A list of districts that make up the composite district are presented in the table to the right.
COMPOSITE DISTRICT
M-STEP Profi ciency
The resident district, identifi ed on the prior page, refers to the public school district in which the Academy physically resides. Similar to the composite district, this district is used as a comparison for student performance in various academic measures.
RESIDENT DISTRICT
12% 0%
1010 Contract Performance Report 2016-2017 © 2017 Ferris State University Charter Schools Offi ce
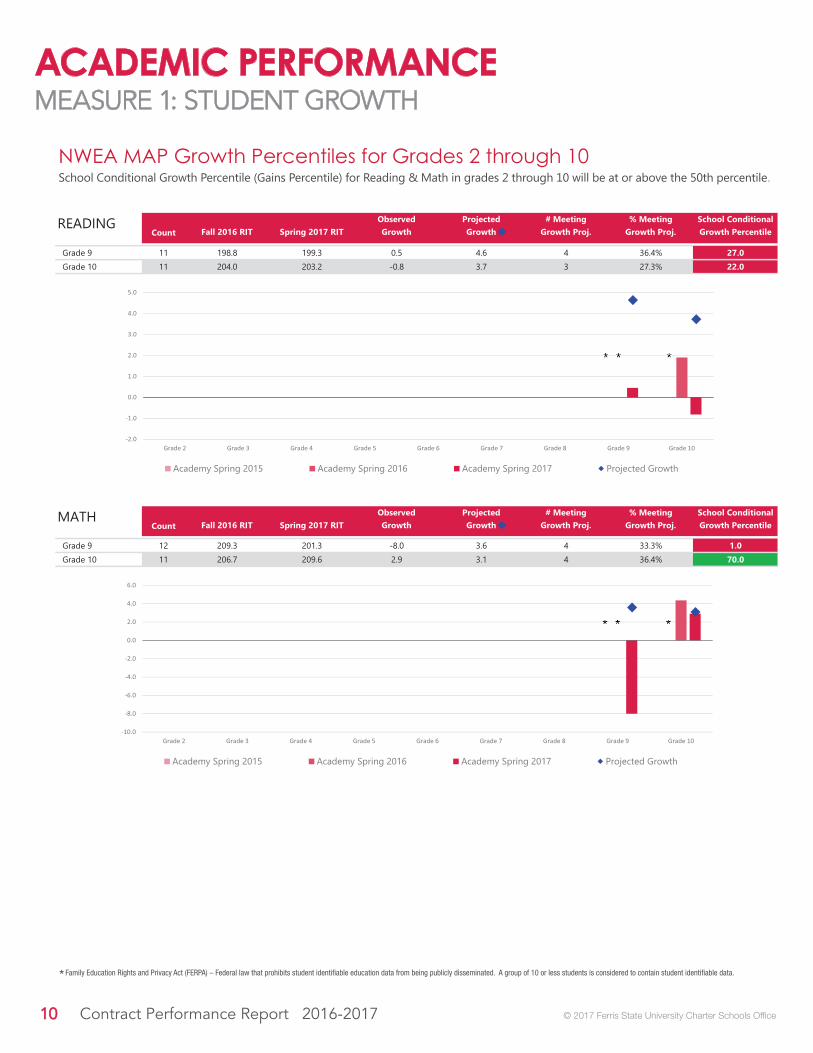
NWEA MAP Growth Percentiles for Grades 2 through 10School Conditional Growth Percentile (Gains Percentile) for Reading & Math in grades 2 through 10 will be at or above the 50th percentile.
* Family Education Rights and Privacy Act (FERPA) – Federal law that prohibits student identifi able education data from being publicly disseminated. A group of 10 or less students is considered to contain student identifi able data.
1111© 2017 Ferris State University Charter Schools Offi ce
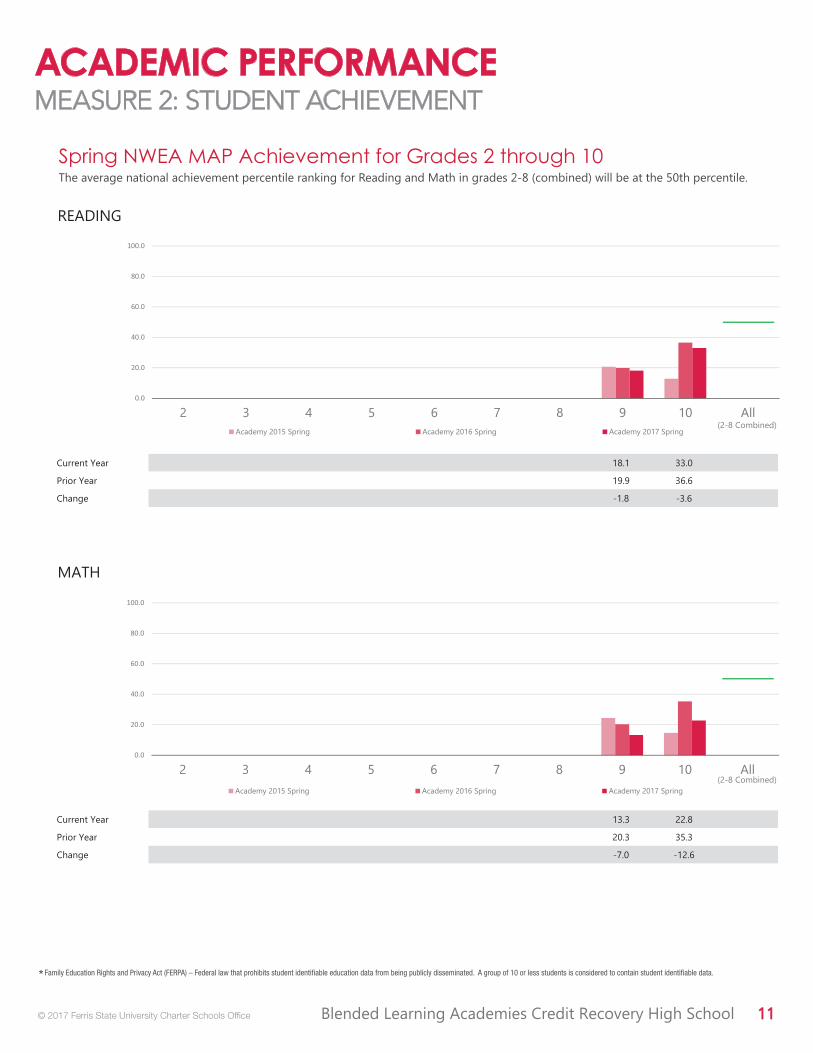
* Family Education Rights and Privacy Act (FERPA) – Federal law that prohibits student identifi able education data from being publicly disseminated. A group of 10 or less students is considered to contain student identifi able data.
Spring NWEA MAP Achievement for Grades 2 through 10The average national achievement percentile ranking for Reading and Math in grades 2-8 (combined) will be at the 50th percentile.
1212 Contract Performance Report 2016-2017 © 2017 Ferris State University Charter Schools Offi ce
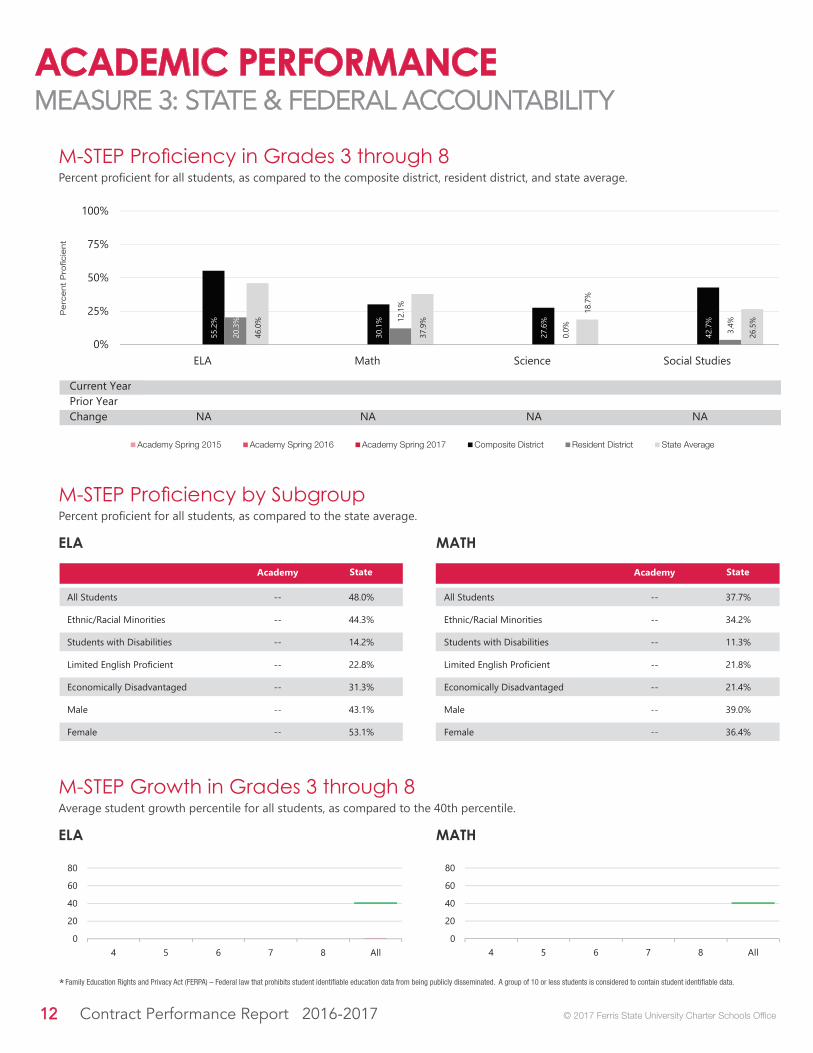
M-STEP Profi ciency in Grades 3 through 8Percent profi cient for all students, as compared to the composite district, resident district, and state average.
M-STEP Profi ciency by SubgroupPercent profi cient for all students, as compared to the state average.
ELA MATH
* Family Education Rights and Privacy Act (FERPA) – Federal law that prohibits student identifi able education data from being publicly disseminated. A group of 10 or less students is considered to contain student identifi able data.
M-STEP Growth in Grades 3 through 8Average student growth percentile for all students, as compared to the 40th percentile.
ELA MATH
Perc
ent
Pro
fi cie
nt
Academy Spring 2015 Academy Spring 2016 Academy Spring 2017 Composite District Resident District State Average
1313© 2017 Ferris State University Charter Schools Offi ce
Academy Spring 2015 Academy Spring 2016 Academy Spring 2017 Composite District Resident District State Average
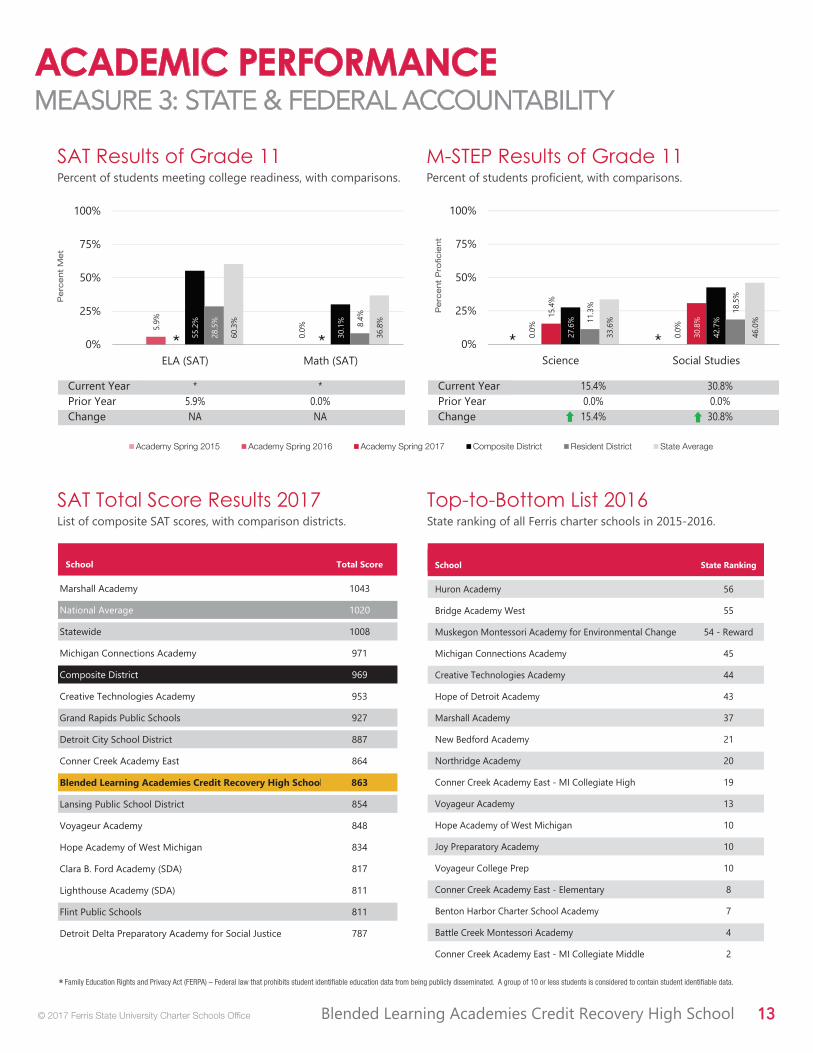
SAT Results of Grade 11Percent of students meeting college readiness, with comparisons.
SAT Total Score Results 2017List of composite SAT scores, with comparison districts.
Top-to-Bottom List 2016State ranking of all Ferris charter schools in 2015-2016.
* Family Education Rights and Privacy Act (FERPA) – Federal law that prohibits student identifi able education data from being publicly disseminated. A group of 10 or less students is considered to contain student identifi able data.
Perc
ent
Met
M-STEP Results of Grade 11Percent of students profi cient, with comparisons.
Perc
ent
Pro
fi cie
nt
1414 Contract Performance Report 2016-2017 © 2017 Ferris State University Charter Schools Offi ce
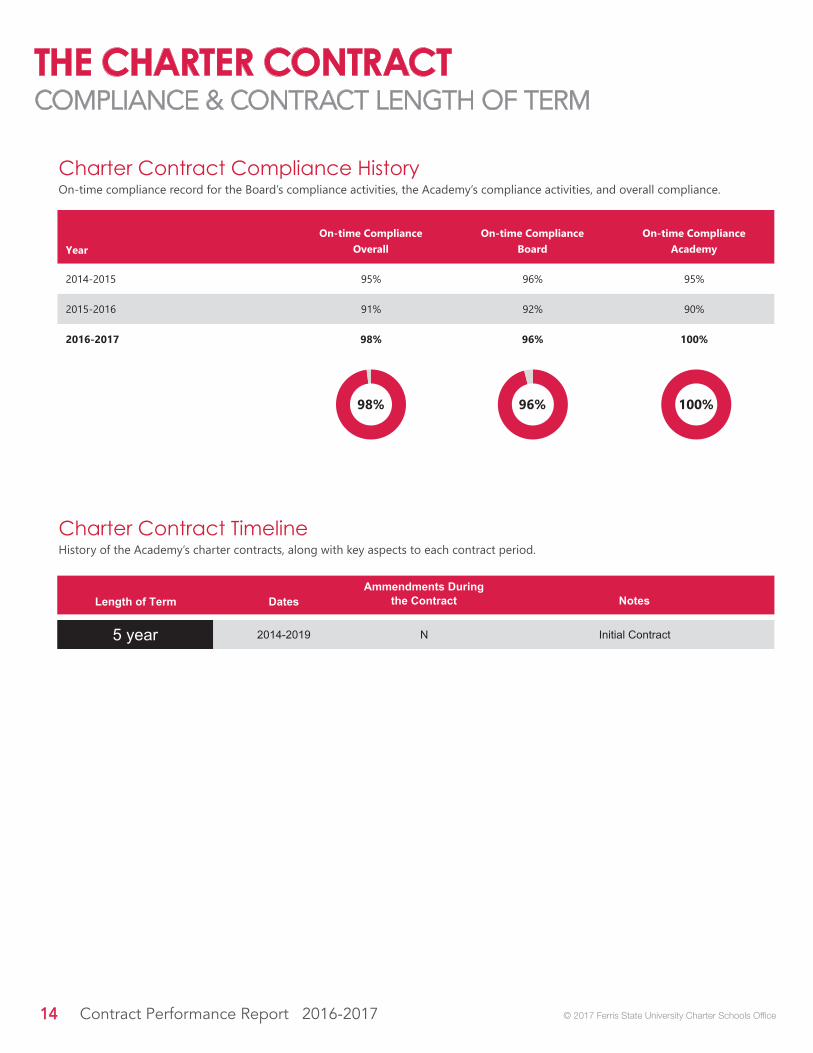
Charter Contract Compliance HistoryOn-time compliance record for the Board’s compliance activities, the Academy’s compliance activities, and overall compliance.
Charter Contract TimelineHistory of the Academy’s charter contracts, along with key aspects to each contract period.
1515© 2017 Ferris State University Charter Schools Offi ce
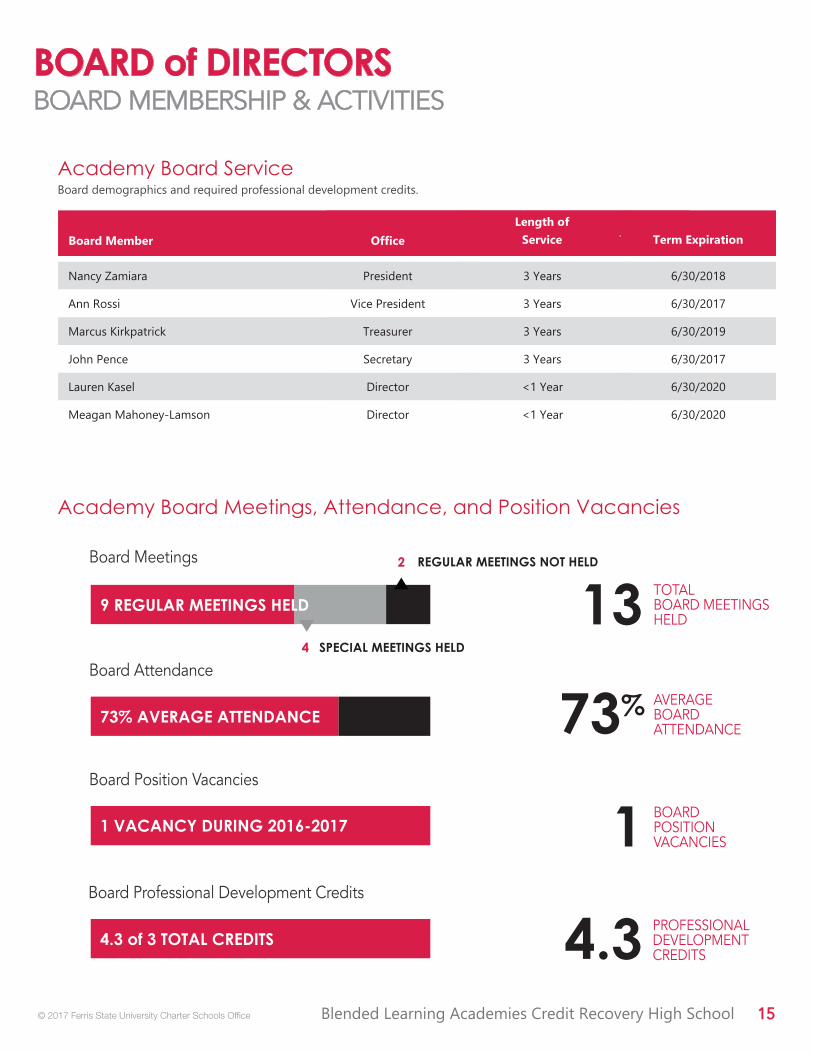
Academy Board ServiceBoard demographics and required professional development credits.
Academy Board Meetings, Attendance, and Position Vacancies
TOTALBOARD MEETINGS HELD
AVERAGEBOARDATTENDANCE
%
BOARDPOSITIONVACANCIES
Board Meetings
Board Attendance
Board Position Vacancies
9 REGULAR MEETINGS HELD
PROFESSIONAL DEVELOPMENT CREDITS
Board Professional Development Credits
REGULAR MEETINGS NOT HELD
1373% AVERAGE ATTENDANCE 73
1
4.3
1 VACANCY DURING 2016-2017
4.3 of 3 TOTAL CREDITS
2
SPECIAL MEETINGS HELD4
1616 Contract Performance Report 2016-2017 © 2017 Ferris State University Charter Schools Offi ce
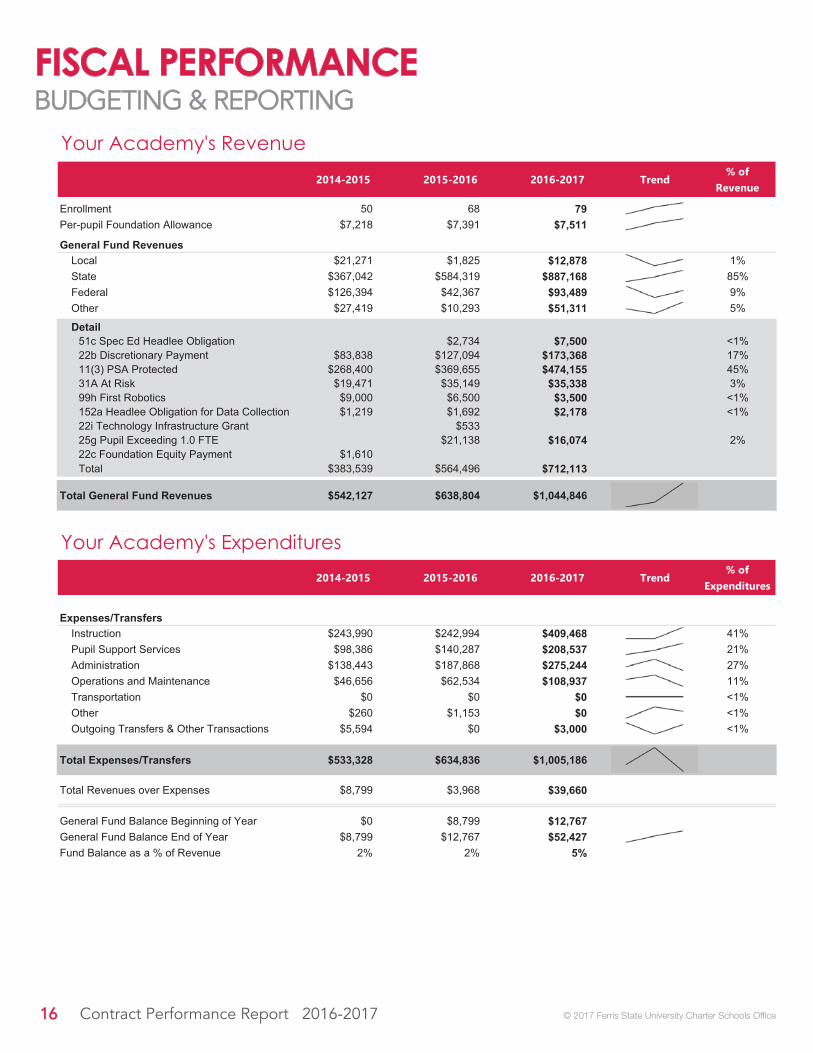
Your Academy's Expenditures
Your Academy's Revenue
1717© 2017 Ferris State University Charter Schools Offi ce
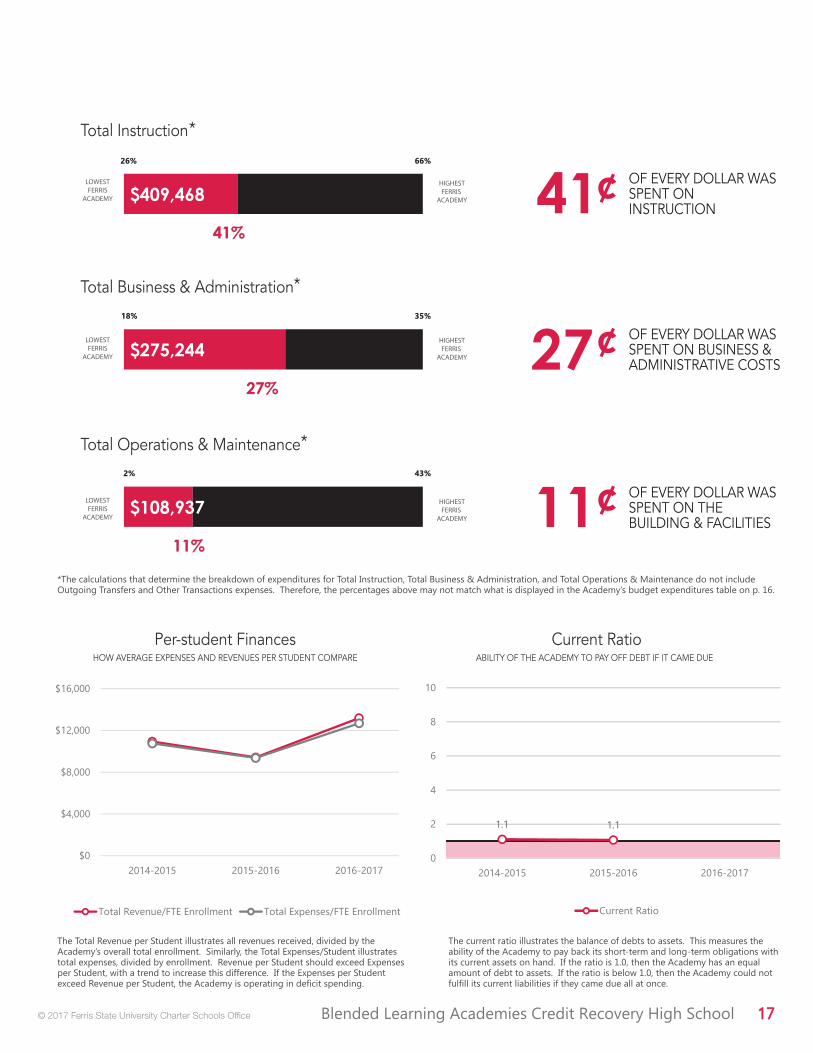
Total Instruction
OF EVERY DOLLAR WASSPENT ONINSTRUCTION
¢
OF EVERY DOLLAR WASSPENT ON BUSINESS &ADMINISTRATIVE COSTS
OF EVERY DOLLAR WASSPENT ON THEBUILDING & FACILITIES
Total Business & Administration
Total Operations & Maintenance
Total Instruction
Total Business & Administration
Total Operations & Maintenance
Per-student FinancesHOW AVERAGE EXPENSES AND REVENUES PER STUDENT COMPARE
Current RatioABILITY OF THE ACADEMY TO PAY OFF DEBT IF IT CAME DUE
The Total Revenue per Student illustrates all revenues received, divided by the Academy’s overall total enrollment. Similarly, the Total Expenses/Student illustrates total expenses, divided by enrollment. Revenue per Student should exceed Expenses per Student, with a trend to increase this difference. If the Expenses per Student exceed Revenue per Student, the Academy is operating in defi cit spending.
$409,468
41%
LOWESTFERRIS
ACADEMY
$275,244
27%
$108,937
11%
¢
¢
LOWESTFERRIS
ACADEMY
LOWESTFERRIS
ACADEMY
HIGHESTFERRIS
ACADEMY
HIGHESTFERRIS
ACADEMY
HIGHESTFERRIS
ACADEMY
The current ratio illustrates the balance of debts to assets. This measures the ability of the Academy to pay back its short-term and long-term obligations with its current assets on hand. If the ratio is 1.0, then the Academy has an equal amount of debt to assets. If the ratio is below 1.0, then the Academy could not fulfi ll its current liabilities if they came due all at once.
27
41
11*The calculations that determine the breakdown of expenditures for Total Instruction, Total Business & Administration, and Total Operations & Maintenance do not include Outgoing Transfers and Other Transactions expenses. Therefore, the percentages above may not match what is displayed in the Academy’s budget expenditures table on p. 16.
*
*
*
1818 Contract Performance Report 2016-2017 © 2017 Ferris State University Charter Schools Offi ce
School VisitsIn order to carry out its responsibility for evaluating academy performance, the CSO has developed the Mid-Contract and Reauthoriza-tion Visitation procedures. The CSO views these visitations as part of an ongoing evaluative process, and not as a single event. Visita-tion teams of three to four educators spend one to two days interviewing stakeholders, observing operations, and reviewing informa-tion for each visited school. Visitation guides are sent to each school outlining the procedures for their upcoming visit. The Academy Internal Review Guide focuses on what the school will do before the visit. This internal review process provides an opportunity for the Academy’s School Improvement Team and other key stakeholders to self-refl ect on some of the key indicators of quality student per-formance and organizational effectiveness. The Visitation Preparation Guide describes the review procedures and the responsibilities of the school and the CSO.
After each visit, CSO personnel discuss observations, review data, and create a comprehensive Visitation Report. These reports help determine placement in the School Support Team designation process, share visitation fi ndings, and review the school’s School Im-provement Plan. In addition, the report contains Opportunities for Growth related to facilities, school systems, school culture, mission accomplishment, student academic outcomes, governance/leadership, resources, and the school’s support system. Reauthorization Vis-its are used to make recommendations to the FSU Board of Trustees regarding contract renewal, extension, revocation, or non-renewal. Mid-Contract Visits help schools to focus on areas of concern, recognize points of pride, and ensure boards of directors and the CSO understand any issues that must be addressed before the Reauthorization Visit.
Visitation Reports are available on the FSU CSO website by selecting the authorized school and going to the Reports/Performance Data link (https://ferris.edu/HTMLS/administration/academicaffairs/charterschools/schools/homepage.htm)
Quality ReviewsThe CSO may elect to contract with a nationally recognized expert in the area of charter school reviews to conduct a Quality School Re-view (QSR). An external review team conducts a multi-day site visit utilizing the QSR Protocol, which is grounded in the Charter Contract and focuses on critical areas of inquiry associated with curriculum, instruction, assessment, and a limited fi scal review of support of the Educational Program. The external team conducts classroom observations and schedules interviews with board members, administra-tors, staff members, and students. In addition to school reviews, the CSO may bring in external teams to provide an analysis of offi ce procedures and policies.
1919© 2017 Ferris State University Charter Schools Offi ce
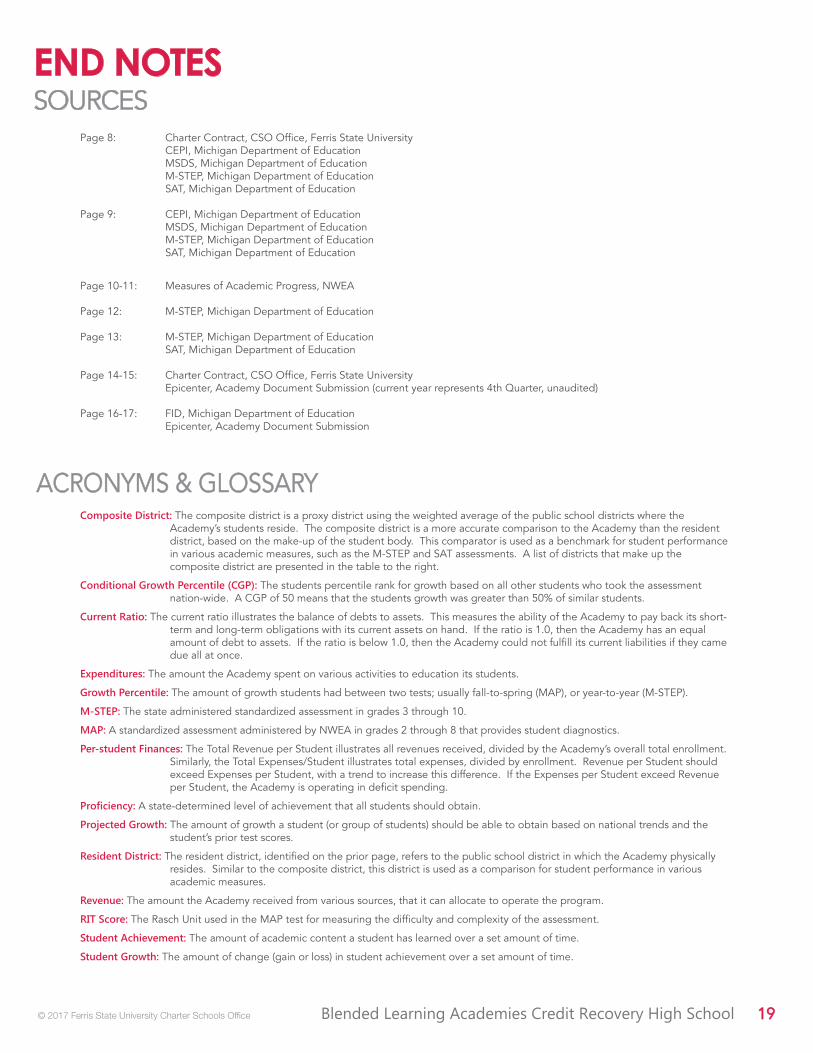
Page 8: Charter Contract, CSO Offi ce, Ferris State University CEPI, Michigan Department of Education MSDS, Michigan Department of Education M-STEP, Michigan Department of Education SAT, Michigan Department of Education
Page 9: CEPI, Michigan Department of Education MSDS, Michigan Department of Education M-STEP, Michigan Department of Education SAT, Michigan Department of Education
Page 10-11: Measures of Academic Progress, NWEA
Page 12: M-STEP, Michigan Department of Education Page 13: M-STEP, Michigan Department of Education SAT, Michigan Department of Education
Page 14-15: Charter Contract, CSO Offi ce, Ferris State University Epicenter, Academy Document Submission (current year represents 4th Quarter, unaudited)
Page 16-17: FID, Michigan Department of Education Epicenter, Academy Document Submission
ACRONYMS & GLOSSARYACRONYMS & GLOSSARYComposite District: The composite district is a proxy district using the weighted average of the public school districts where the
Academy’s students reside. The composite district is a more accurate comparison to the Academy than the resident district, based on the make-up of the student body. This comparator is used as a benchmark for student performance in various academic measures, such as the M-STEP and SAT assessments. A list of districts that make up the composite district are presented in the table to the right.
Conditional Growth Percentile (CGP): The students percentile rank for growth based on all other students who took the assessment nation-wide. A CGP of 50 means that the students growth was greater than 50% of similar students.
Current Ratio: The current ratio illustrates the balance of debts to assets. This measures the ability of the Academy to pay back its short-term and long-term obligations with its current assets on hand. If the ratio is 1.0, then the Academy has an equal amount of debt to assets. If the ratio is below 1.0, then the Academy could not fulfi ll its current liabilities if they came due all at once.
Expenditures: The amount the Academy spent on various activities to education its students.
Growth Percentile: The amount of growth students had between two tests; usually fall-to-spring (MAP), or year-to-year (M-STEP).
M-STEP: The state administered standardized assessment in grades 3 through 10.
MAP: A standardized assessment administered by NWEA in grades 2 through 8 that provides student diagnostics.
Per-student Finances: The Total Revenue per Student illustrates all revenues received, divided by the Academy’s overall total enrollment. Similarly, the Total Expenses/Student illustrates total expenses, divided by enrollment. Revenue per Student should exceed Expenses per Student, with a trend to increase this difference. If the Expenses per Student exceed Revenue per Student, the Academy is operating in defi cit spending.
Profi ciency: A state-determined level of achievement that all students should obtain.
Projected Growth: The amount of growth a student (or group of students) should be able to obtain based on national trends and the student’s prior test scores.
Resident District: The resident district, identifi ed on the prior page, refers to the public school district in which the Academy physically resides. Similar to the composite district, this district is used as a comparison for student performance in various academic measures.
Revenue: The amount the Academy received from various sources, that it can allocate to operate the program.
RIT Score: The Rasch Unit used in the MAP test for measuring the diffi culty and complexity of the assessment.
Student Achievement: The amount of academic content a student has learned over a set amount of time.
Student Growth: The amount of change (gain or loss) in student achievement over a set amount of time.

FERRIS STATE
Charter Schools OfficeUNIVERSITY
Ferris State UniversityBig Rapids, MI 49307
(231) 591-5802www.ferris.edu/charterschools