cee 404 winter 2011 1 infrastructure. cee 404 winter 2011 2 a short survey 1.how much is all the...
Post on 19-Dec-2015
217 views
TRANSCRIPT
CEE 404 Winter 2011
1
Infrastructure

CEE 404 Winter 2011
2
A Short Survey
1. How much is all the transportation infrastructure in Seattle worth?
2. How do you rate Washington’s road conditions? (poor, mediocre, good, excellent)
3. Is the Alaskan Way viaduct bored tunnel project necessary? Is it too expensive?
4. Is the SR 520 Bridge project necessary? Is it too expensive?

CEE 404 Winter 2011
3
Infrastructure
The basic physical systems of a community's population, including roads, utilities, water, sewage, etc. These systems are considered essential for enabling productivity in the economy.

CEE 404 Winter 2011
4
Transportation Infrastructure

CEE 404 Winter 2011
5
U.S. Gross Domestic Product
2008 data from the Bureau of Transportation Statistics
a Includes all consumer and government purchases of goods (e.g., vehicles and fuel) and services (e.g., auto insurance) and exports related to transportation. b Includes all other categories (e.g., entertainment, personal care products and services, and payments to pension plans).

CEE 404 Winter 2011
6
Federal Funding for Transportation
• 2010 Federal Transportation Bill (THUD)– HR3288 (Transportation, Housing and Urban
Development, and Related Agencies Appropriations Act, 2010)
– Reauthorizes federal highway, public transportation, highway safety, and motor carrier safety programs for six years
– $447 billion over 6 years– FY2010: $117.1 billion– 56% increase over SAFETEA LU
• SAFETEA LU (old version)– Safe, Accountable, Flexible, Efficient Transportation
Equity Act: A Legacy For Users– $286.4 billion in funding– 42% increase over last bill (TEA-21)– December 2010: extended through March 4th, 2011
CEE 404 Winter 2011
7
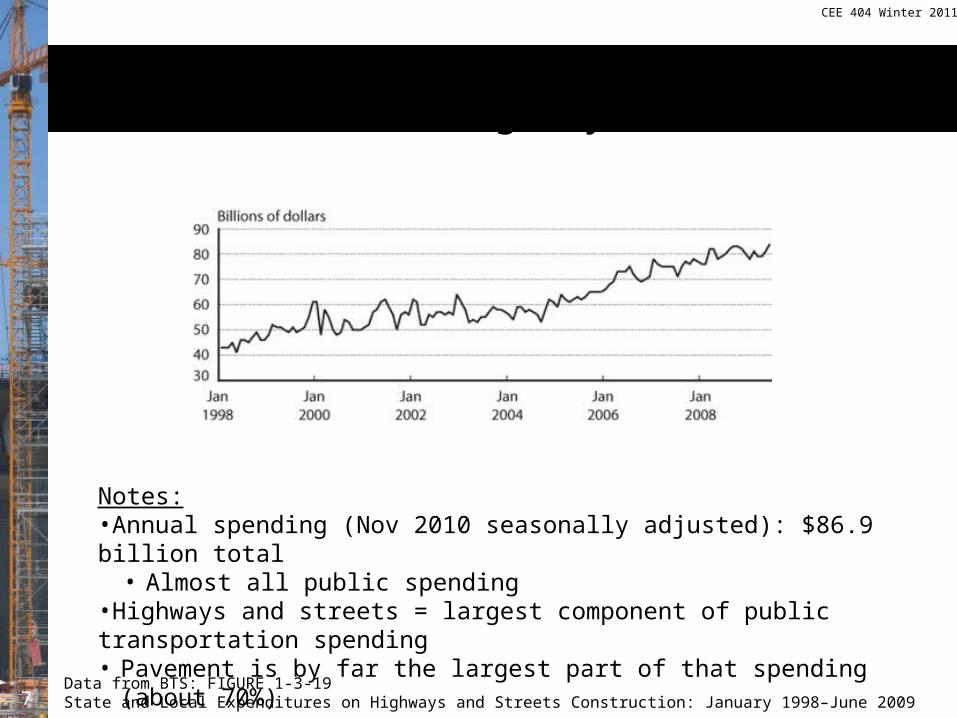
Public Expenditures on Construction of Highways and Streets
Notes:•Annual spending (Nov 2010 seasonally adjusted): $86.9 billion total
• Almost all public spending•Highways and streets = largest component of public transportation spending• Pavement is by far the largest part of that spending (about 70%)
Data from BTS: FIGURE 1-3-19State and Local Expenditures on Highways and Streets Construction: January 1998–June 2009
CEE 404 Winter 2011
8
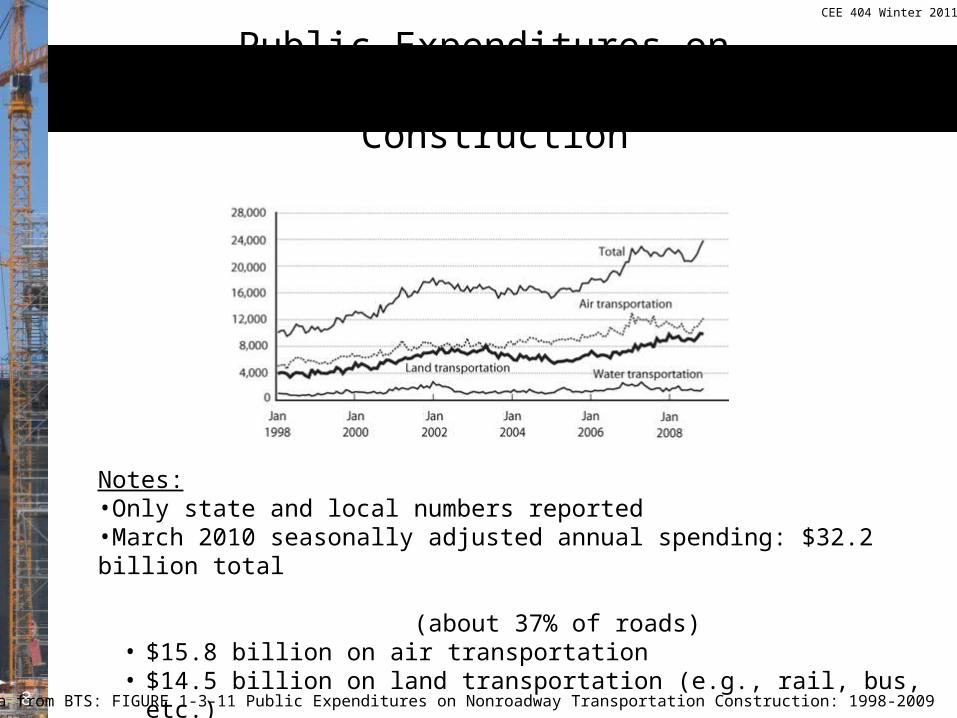
Public Expenditures on Non-Roadway Transportation Construction
Data from BTS: FIGURE 1-3-11 Public Expenditures on Nonroadway Transportation Construction: 1998-2009
Notes:•Only state and local numbers reported•March 2010 seasonally adjusted annual spending: $32.2 billion total (about 37% of roads)
• $15.8 billion on air transportation• $14.5 billion on land transportation (e.g., rail, bus, etc.)• $2.0 billion on water transportation

CEE 404 Winter 2011
9
Private Expenditures on Transportation Infrastructure Construction
Data from BTS: FIGURE 1-3-12A Private Expenditures on Transportation-Related Construction: January 1998–March 2010
Notes:•March 2010 seasonally adjusted annual rate: $8.26 billion total
• $0.35 billion on air transportation• $7.77 billion on land transportation• $0.14 billion on water transportation
CEE 404 Winter 2011
10
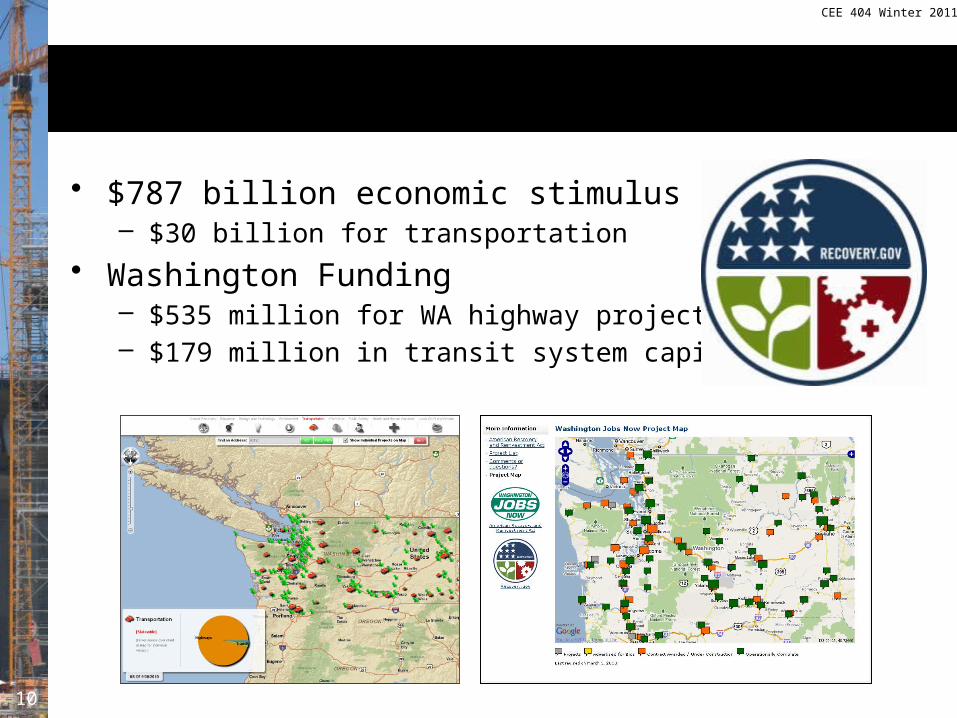
American Recovery and Reinvestment Act (ARRA)
• $787 billion economic stimulus bill– $30 billion for transportation
• Washington Funding– $535 million for WA highway projects– $179 million in transit system capital projects

CEE 404 Winter 2011
11
American Recovery and Reinvestment Act (ARRA)
Data and graph from WSDOT

CEE 404 Winter 2011
12
Seattle Transportation Infrastructure Inventory(not all are shown here but the total is right)
Category Some of the Inventory Value
Pavement 3,943 lane-miles $3.25 billion
Structures 125 bridges205 wallsRetaining walls (incl. seawall)
$3.1 billion
Traffic and parking 1,001 traffic signals46 cameras150,000 signs1,845 parking pay stations1,000 traffic circles
$125 million
Pedestrian/bike system 2,256 miles of sidewalks120 miles of bike routes6 miles of stairs39.4 miles of trails
$2.77 billion
Street landscaping 35,000 trees $49 million
Grand Total $12.1 billion
2008 data from http://www.ci.seattle.wa.us/transportation/inventory.htm

CEE 404 Winter 2011
13
General Condition (old) and Age (poor)From the ASCE Report Card for America’s Infrastructure
Rockefeller Road Bridge in Cleveland, OH from ASCE website
from ASCE website
• Total estimated 5-yr funding need: $930 billion• Total estimated 5-year spending: $381 billion• Projected 5-year shortfall: $549 billion
Information from: ASCE Report card for Roads (http://www.infrastructurereportcard.org/fact-sheet/roads)

CEE 404 Winter 2011
14
I-5 Bridge Decks in Seattle
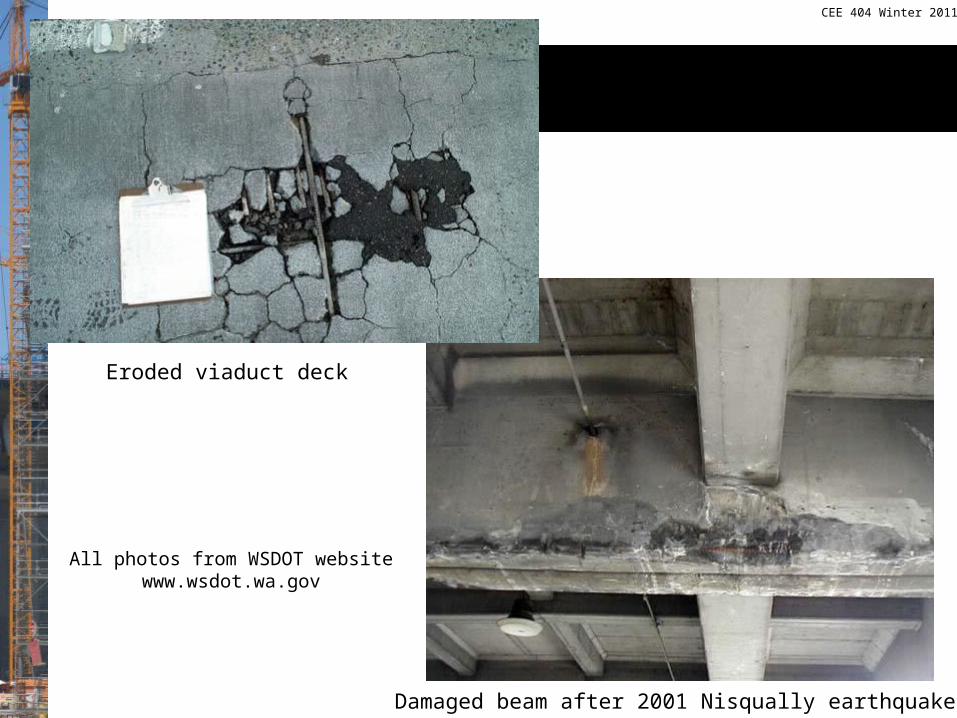
Damaged beam after 2001 Nisqually earthquake
Eroded viaduct deck
Alaskan Way Viaduct(current)
All photos from WSDOT websitewww.wsdot.wa.gov
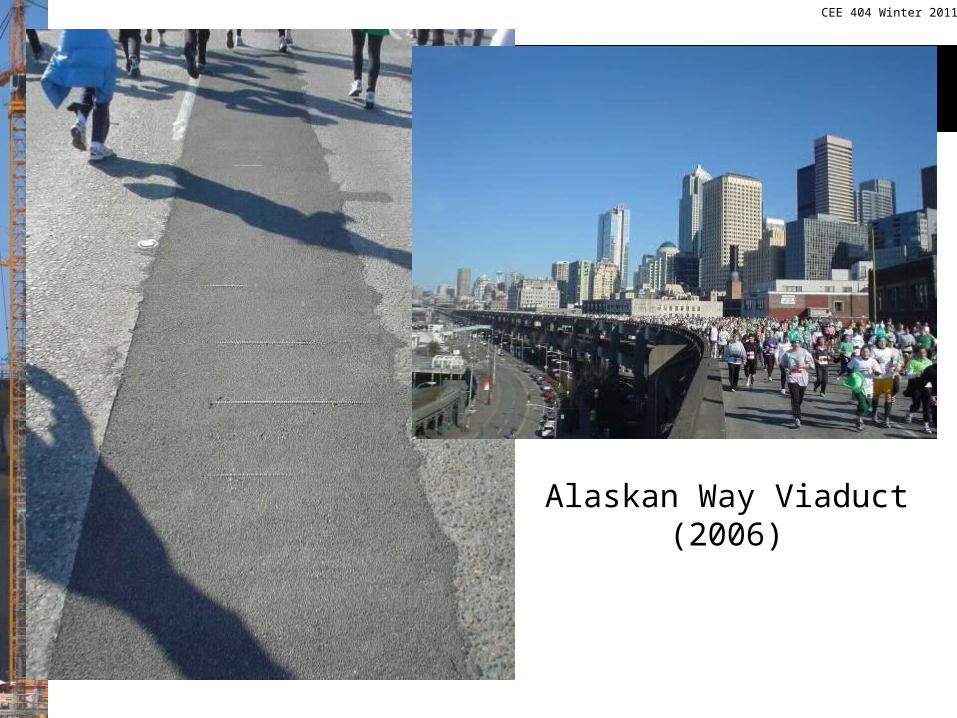
Alaskan Way Viaduct(2006)

Column support
Installing column supportsafter the Nisqually earthquake
Alaskan Way Viaduct(current)
All photos from WSDOT websitewww.wsdot.wa.gov
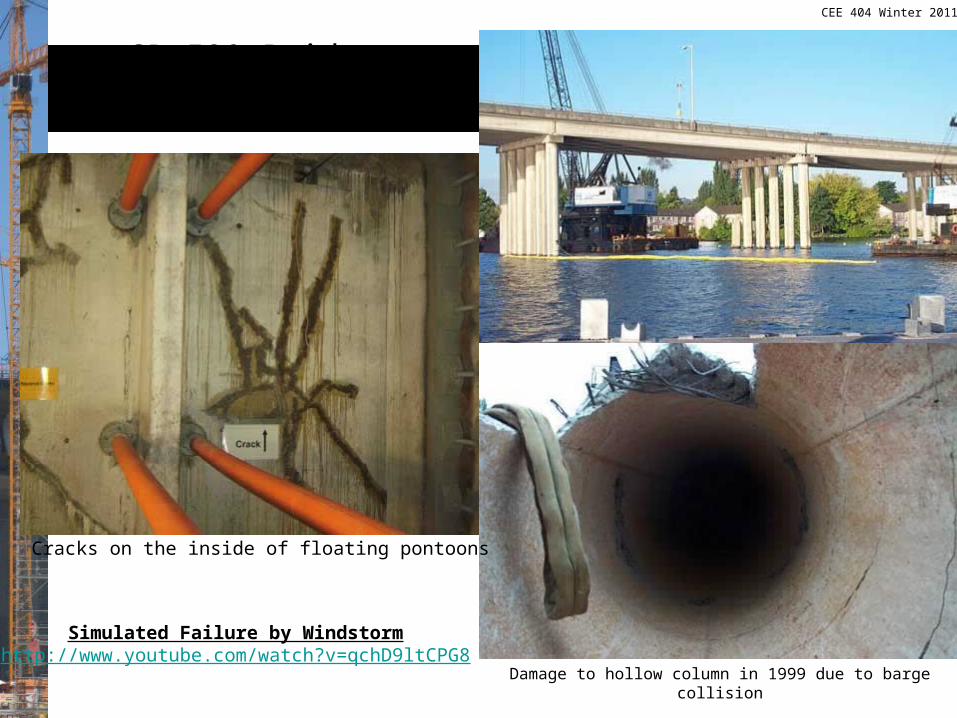
SR 520 BridgeAll photos from WSDOT website
www.wsdot.wa.gov
Damage to hollow column in 1999 due to barge collision
Cracks on the inside of floating pontoons
Simulated Failure by Windstormhttp://www.youtube.com/watch?v=qchD9ltCPG8

CEE 404 Winter 2011
19
Rural Road ConditionsRuralRoads in Poor or Mediocre Condition
by Functional Class: 1995–2006
Gra
ph f
rom
the
Bur
eau
of T
rans
port
atio
n S
tatis
tics,
Tr
ansp
orta
tion
Sta
tistic
s A
nnua
l Rep
ort
Sep
tem
ber
2008
0
5
10
15
20
25
30
35
1995 1996 1997 1998 1999 2000 2001 2002 2003 2004 2005 2006
Perc
enta
ge o
f tot
al M
ileag
e
Year
Interstates
Other principal arterials
Minor arterials
Collectors

CEE 404 Winter 2011
20
Urban Road ConditionsUrban Roads in Poor or Mediocre Condition
by Functional Class: 1995–2006
Gra
ph f
rom
the
Bur
eau
of T
rans
port
atio
n S
tatis
tics,
Tr
ansp
orta
tion
Sta
tistic
s A
nnua
l Rep
ort
Sep
tem
ber
2008
0
5
10
15
20
25
30
35
40
45
1995 1996 1997 1998 1999 2000 2001 2002 2003 2004 2005 2006
Perc
enta
ge o
f tot
al M
ileag
e
Year
Interstates
Other freeways
Other principal arterials
Minor arterials
Collectors
CEE 404 Winter 2011
21
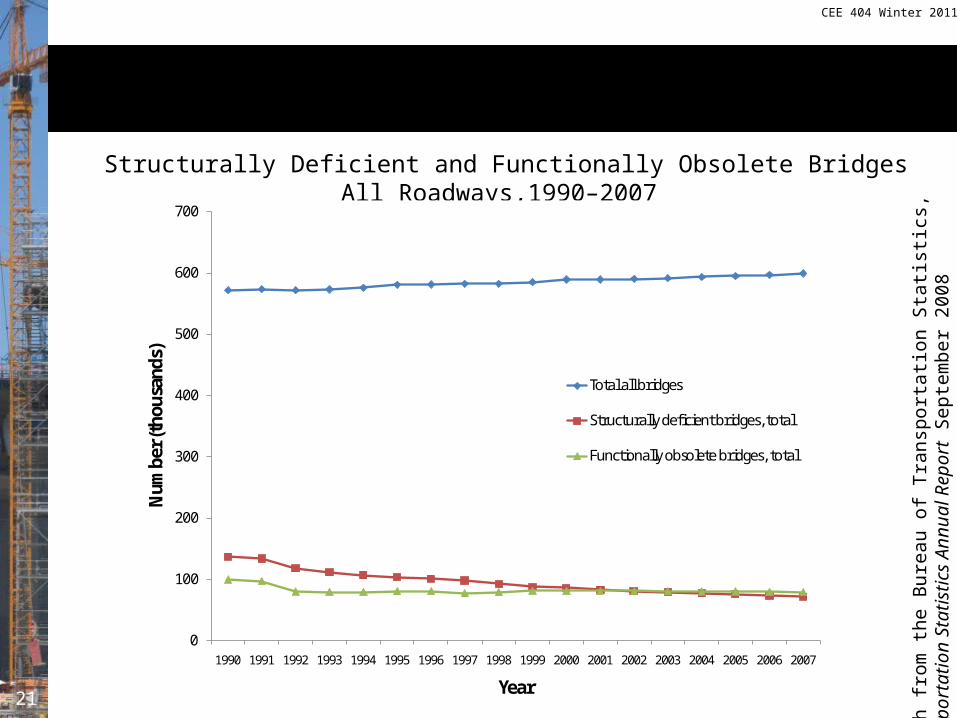
Bridge ConditionsStructurally Deficient and Functionally Obsolete Bridges
All Roadways,1990–2007
0
100
200
300
400
500
600
700
1990 1991 1992 1993 1994 1995 1996 1997 1998 1999 2000 2001 2002 2003 2004 2005 2006 2007
Num
ber (
thou
sand
s)
Year
Total all bridges
Structurally deficient bridges, total
Functionally obsolete bridges, total
Gra
ph f
rom
the
Bur
eau
of T
rans
port
atio
n S
tatis
tics,
Tr
ansp
orta
tion
Sta
tistic
s A
nnua
l Rep
ort
Sep
tem
ber
2008

July 1967 – Minneapolis Tribune
6:05 p.m. 1 August 2007

CEE 404 Winter 2011
24
Building Transportation Infrastructure
Mega-ProjectProjects with an estimated total cost greater than $1.0 billion, or projects approaching $1.0 billion with a high level of interest by the public.

CEE 404 Winter 2011
25
Periods of Mega-Projects in the U.S.• Pre-1950s era
– Minimal higher-level aid– Very little disruption of existing areas
• Great mega-project era (1950 – late 1960s)– Large amounts of federal aid– Retrofit cities for new preferences
• Transition era (mid 1960s – early 1970s)– Community & environment become important– Citizen protests
• Do no harm era (mid 1970s – present)– Investment is substantial at all levels– Must avoid or mitigate any significant
disruption
CEE 404 Winter 2011
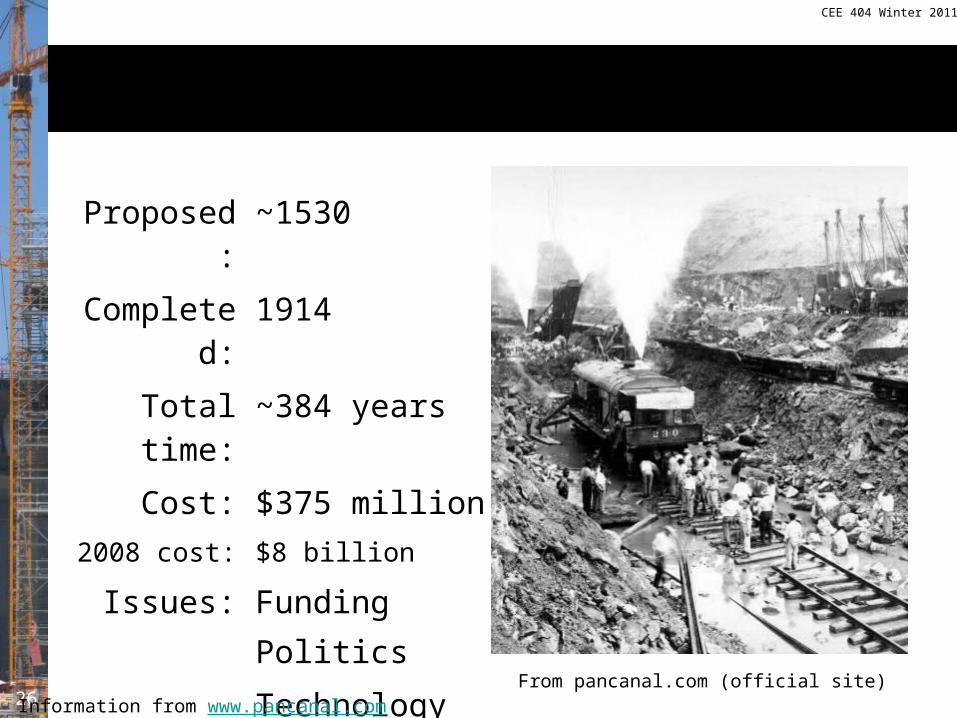
26
Panama Canal
Proposed: ~1530
Completed:
1914
Total time:
~384 years
Cost: $375 million2008 cost: $8 billion
Issues: FundingPolitics
TechnologyMalaria
From pancanal.com (official site)Information from www.pancanal.com

CEE 404 Winter 2011
27
Golden Gate Bridge
Proposed: 1869
Completed:
1937
Total time:
68 years
Cost: $35 million2008 cost: $511 million
Issues: FundingPolitics
From Metropolitan Transportation CommissionInformation from the Virtual Museum of the City of San Francisco

CEE 404 Winter 2011
28
Lake Washington Ship Canal
Proposed: 1854
Opened: 1917
Completed:
1934
Total time:
80 years
Cost: $3 million2008 cost: $50 million
Issues: FundingPolitics Under construction (1916)

CEE 404 Winter 2011
29
Lake Washington Floating Bridge
Proposed: 1921
Completed:
1940
Total Time:
19 years
Cost: $8.8 million2008 cost: $132 million
Issues: Funding
UW Libraries
1940
CEE 404 Winter 2011
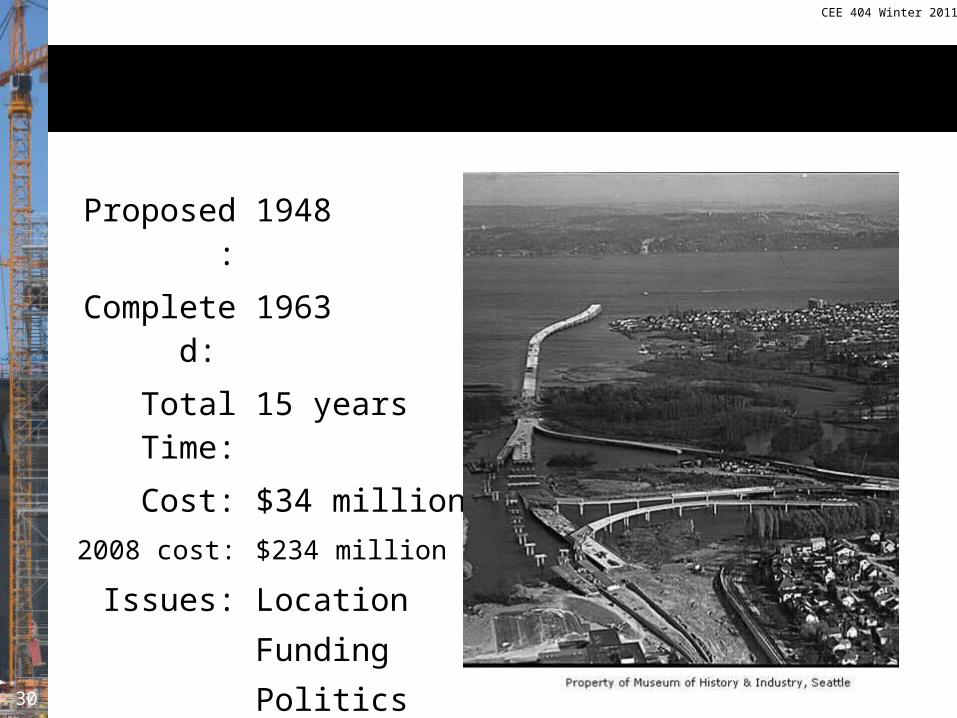
30
Evergreen Point Floating Bridge
Proposed: 1948
Completed:
1963
Total Time:
15 years
Cost: $34 million2008 cost: $234 million
Issues: LocationFundingPolitics
CEE 404 Winter 2011
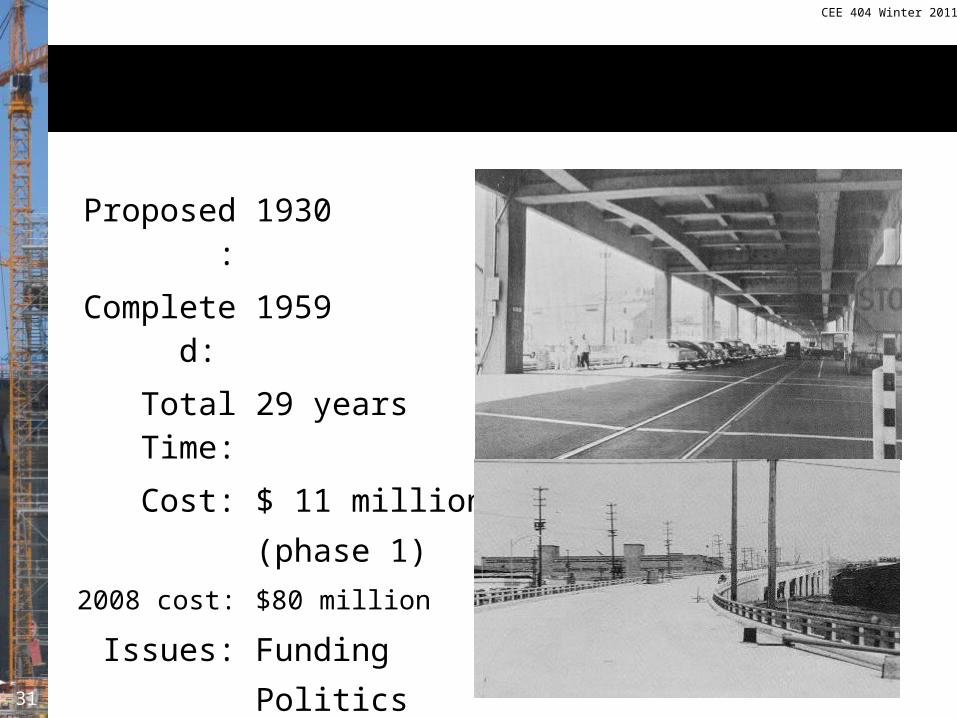
31
Alaskan Way Viaduct
Proposed: 1930
Completed:
1959
Total Time:
29 years
Cost: $ 11 million(phase 1)
2008 cost: $80 million
Issues: FundingPolitics

CEE 404 Winter 2011
32
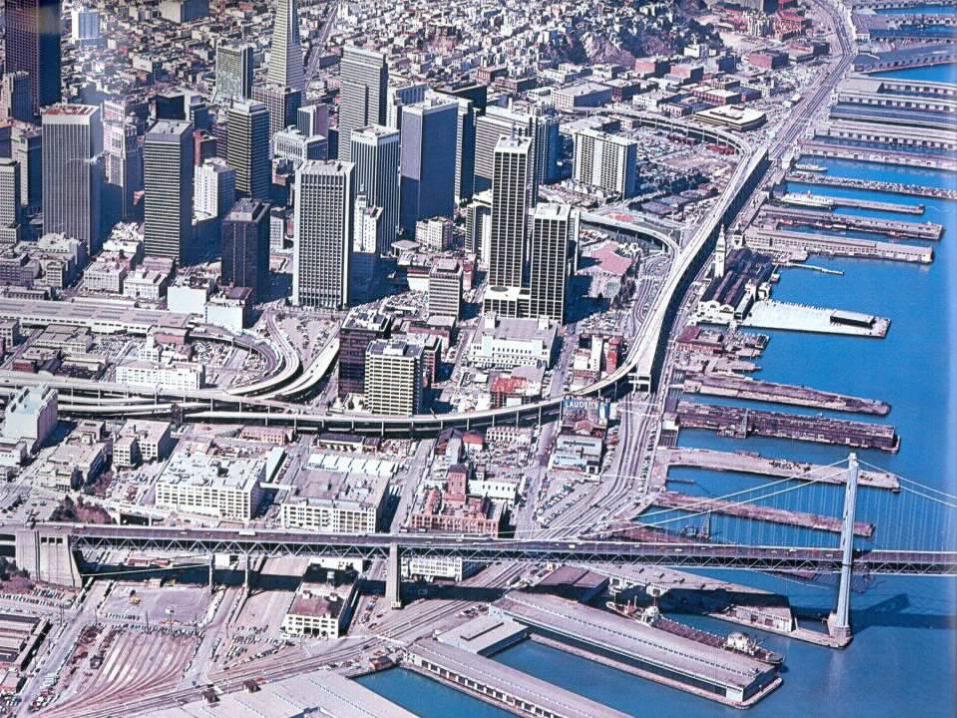
First Concession to Citizens
San Francisco, 1959City officials veto most further planned expressway construction in the city
Picture from Halttheramp.com
CEE 404 Winter 2011
33

CEE 404 Winter 2011
34
Embarcadero (San Francisco)
CEE 404 Winter 2011
35
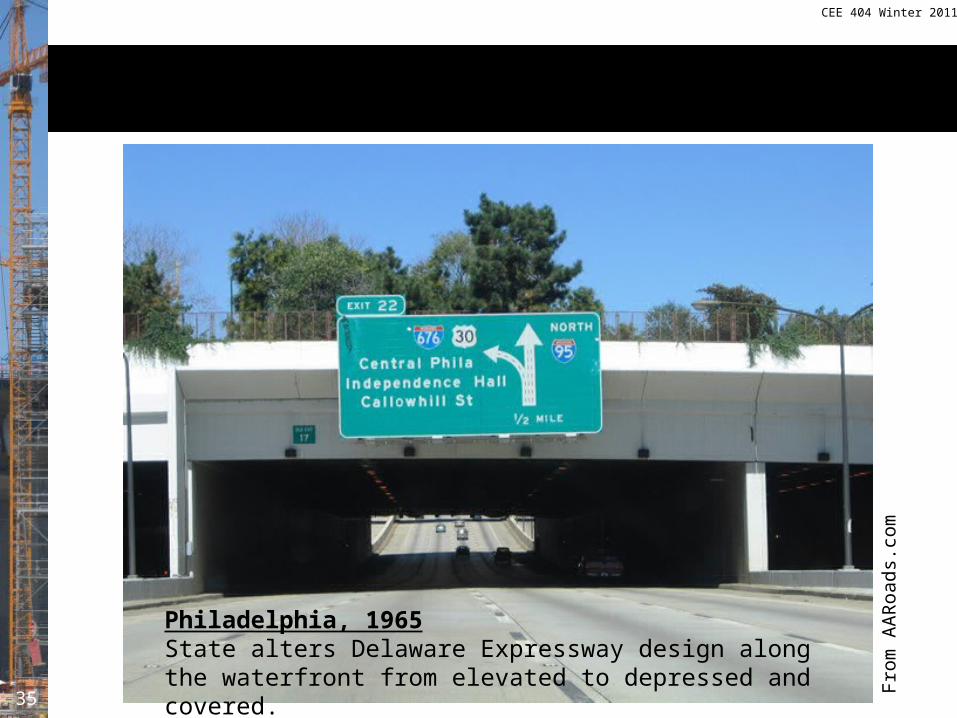
Mitigation Begins
Fro
m A
AR
oads
.com
Philadelphia, 1965State alters Delaware Expressway design along the waterfront from elevated to depressed and covered.

CEE 404 Winter 2011
36
Environmentalism
• National Environmental Policy Act (NEPA) (1970)– Environment to be considered for all major
federally aided projects– Public hearings– Authorizes citizen suits to ensure all issues are
addressed fully and candidly– Agency still free to decide after EIS
• Clean Water Act amendments (1972)– Difficult to fill wetlands (Section 404)– Runoff cannot pollute water resources (Section
402)• Clean Air Act amendments (1990)
CEE 404 Winter 2011
37
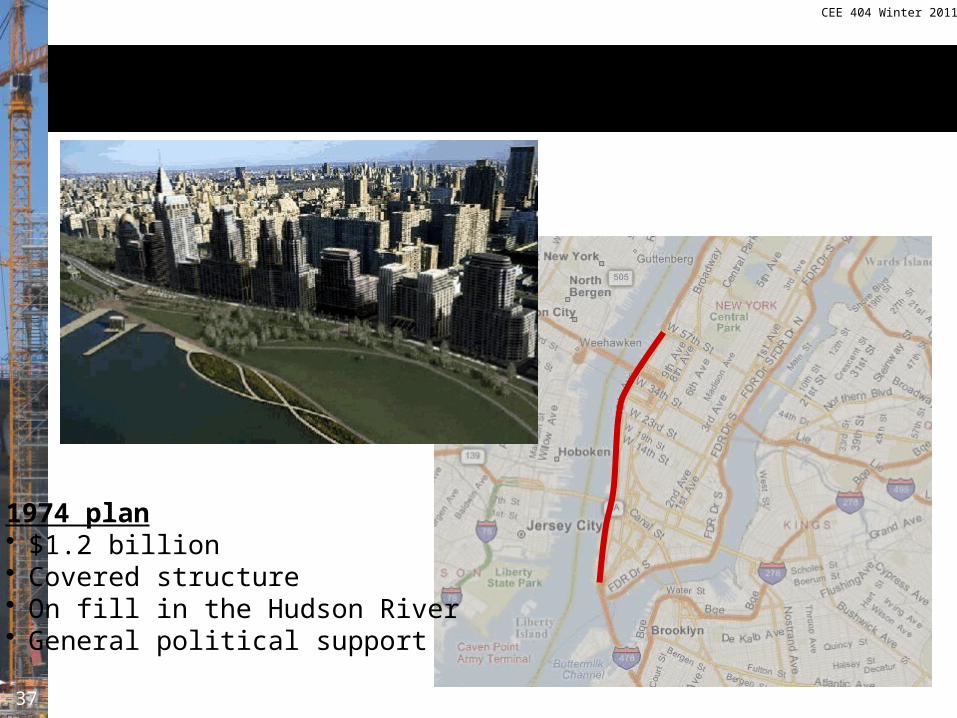
Westway (Manhattan Island)
1974 plan• $1.2 billion• Covered structure• On fill in the Hudson River• General political support
CEE 404 Winter 2011
38
Westway (Manhattan Island)
Relatively Minor Issue Sinks ProjectDo young stripped bass winter under rotting, unused piers that are scheduled to be removed by the project?• EIS: Few fish live under piers• NY and federal studies: Fish live under piers
U.S. Army Corps of Engineers needs further study
Failed to prove “no significant impact”
Clean Water Act says no fill permit can be issued
1985 U.S. House vote to ban further federal funding (NJ backs ban because Westway would move the bass over to the NJ side and potentially block NJ development)

CEE 404 Winter 2011
39
Mitigation Costs
• Century Freeway (I-105) – Los Angeles– 1977 cost estimate: $500 million– 1979 cost estimate: $1.6 billion
• 4,200 units of affordable housing• Job training program• Minority contracting
CEE 404 Winter 2011
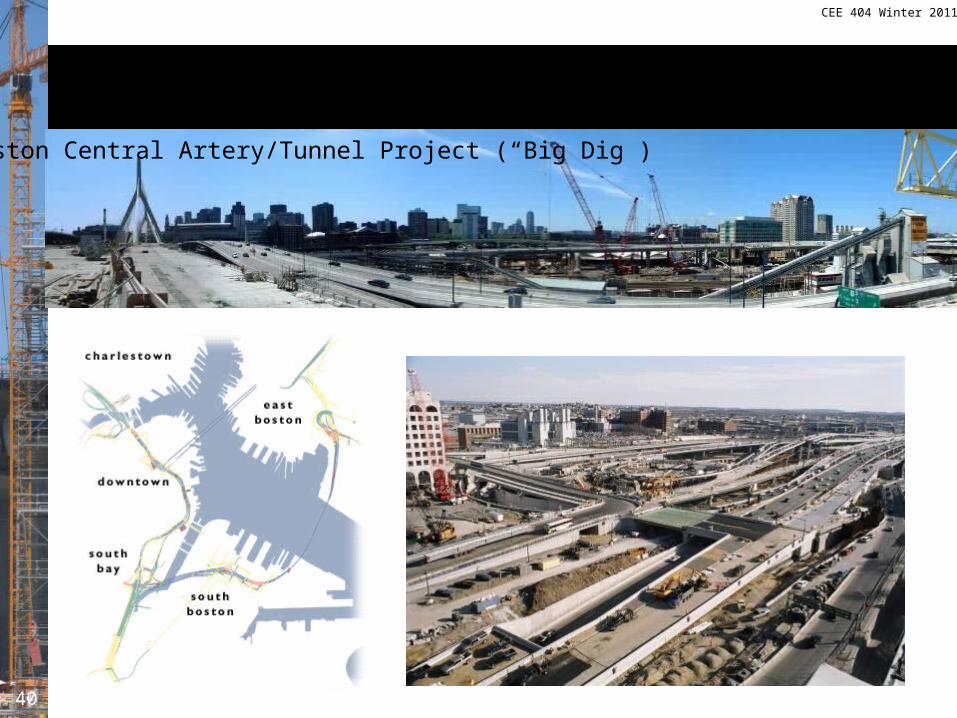
40
Consensus/Mitigation CostsBoston Central Artery/Tunnel Project (“Big Dig”)

CEE 404 Winter 2011
41
Consensus/Mitigation Costs
• Boston Central Artery/Tunnel (CA/T)
0
2
4
6
8
10
12
14
16
1980 1985 1990 1995 2000 2005
Year
Co
st i
n C
on
stan
t 20
02 D
oll
ars
(bil
lio
ns)

CEE 404 Winter 2011
42
Public Financing
• Local sources– Private investment (not likely)– Excise taxes (hotel rooms, restaurants, rental cars, taxis)– Sales tax– Airport passenger facility charges (PFC)– Airport landing fees– Sales/lease of land at below-market prices– Loans, access to credit at below-market rates
• State sources– Non-tax revenue: lotteries, tolls– Regional sales tax– Gas tax
• Federal sources
CEE 404 Winter 2011
43
Private Financing
Cintra, a subsidiary of the Spanish conglomerate, Ferrovial, develops and operates transportation infrastructure (http://www.cintra.es):• Chicago Skyway: 7.8 miles of toll road in Chicago, part of I-90• Texas SH 130 Segments 5 & 6: Toll road • Indiana Toll Road: 157-miles long, leased for 75 years for $3.8 billion
Macquarie Infrastructure Group, part of Macquarie Bank (an Australian bank), develops and operates transportation infrastructure http://www.macquarie.com/mgl/com/mqa):• Chicago Skyway: 7.8 miles of toll road in Chicago, part of I-90• Indiana Toll Road: 157-miles long, leased for 75 years for $3.8 billion• Dulles Greenway: 13.7 miles, Dulles to Leesburg, VA, $533 million• South Bay Expressway: 9.3 miles of toll road in SD, built for $635 million • Sea-to-Sky: 62 miles, Vancouver to Whistler, $600 million
MQA Macquarie Atlas Roads

CEE 404 Winter 2011
44
Chicago Skyway
• $1.83 billion for 99 year lease by Skyway Concession Company
• Toll revenues = $38-45 million annually

CEE 404 Winter 2011
45
Chicago Skyway
Axles
Day Night
2 $3.00 $3.00
3 $7.60 $5.40
4 $10.10 $7.20
5 $12.60 $9.00
6 $15.20 $10.80
7+ $17.70 $12.60
Tolls
Map from Skyway Concession Company

CEE 404 Winter 2011
47
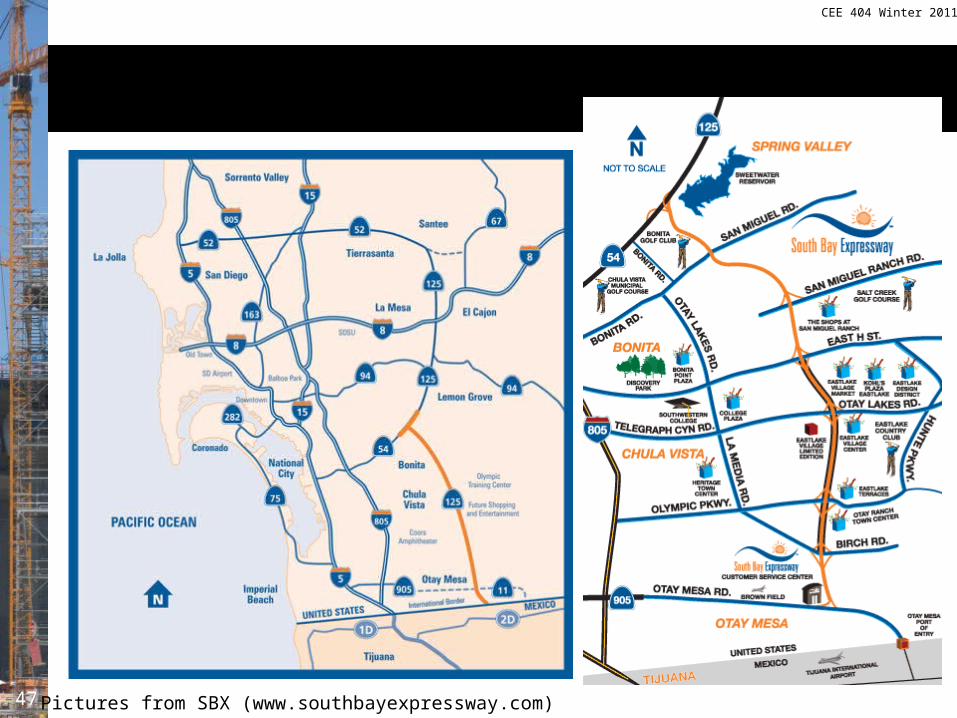
South Bay Expressway
Pictures from SBX (www.southbayexpressway.com)

CEE 404 Winter 2011
48
South Bay Expressway
Picture from SBX (www.southbayexpressway.com)
Picture from Macquarie
Opened November 2007

CEE 404 Winter 2011
49
Trends in Mega-Projects
• Not routine after 1970• Support coalitions
– Usually led by business enterprise• Project ideas
– Usually originate in the public sector• Only successful if they “do no harm”• Mitigation is essential• Support and purpose is local• Avoid increases in broad-based local taxes• Costs rose dramatically from 1970 – 2000• Private investment (2004 – present)
From Altshuler and Luberoff (2003) Mega-Projects: The Changing Politics of Urban Public Investment
CEE 404 Winter 2011
50
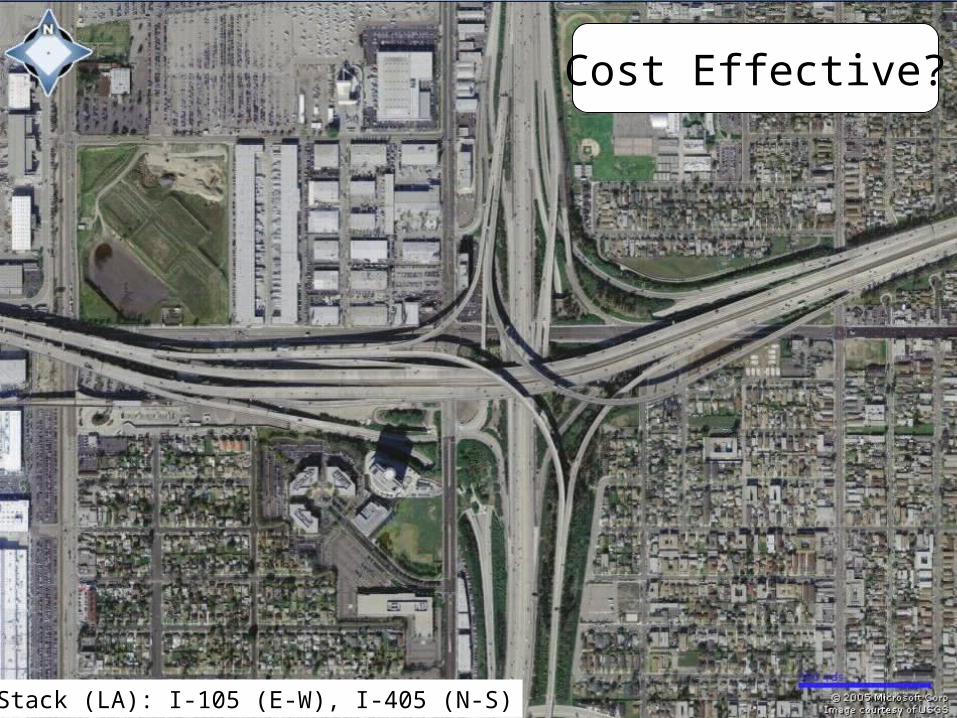
Cost Effective?
The Stack (LA): I-105 (E-W), I-405 (N-S)
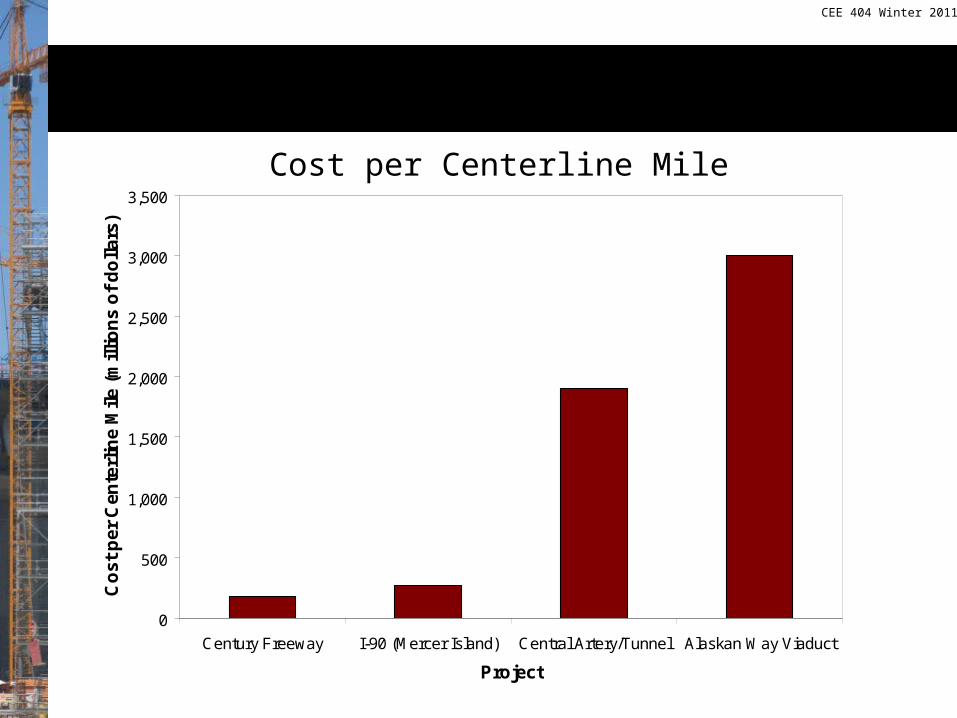
Rising Costs
0
500
1,000
1,500
2,000
2,500
3,000
3,500
Century Freeway I-90 (Mercer Island) Central Artery/Tunnel Alaskan Way Viaduct
Project
Co
st p
er C
ente
rlin
e M
ile (
mill
ion
s o
f d
olla
rs)
$176 million
$3 billion
$1.9 billion
$272 million
Cost per Centerline Mile
CEE 404 Winter 2011
52
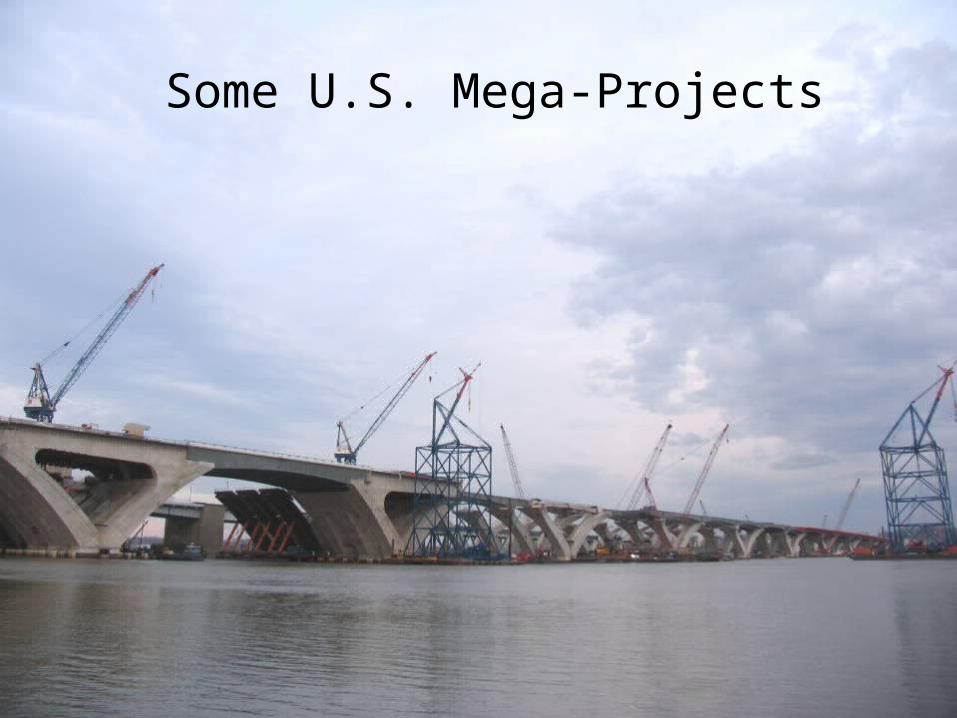
Some U.S. Mega-Projects
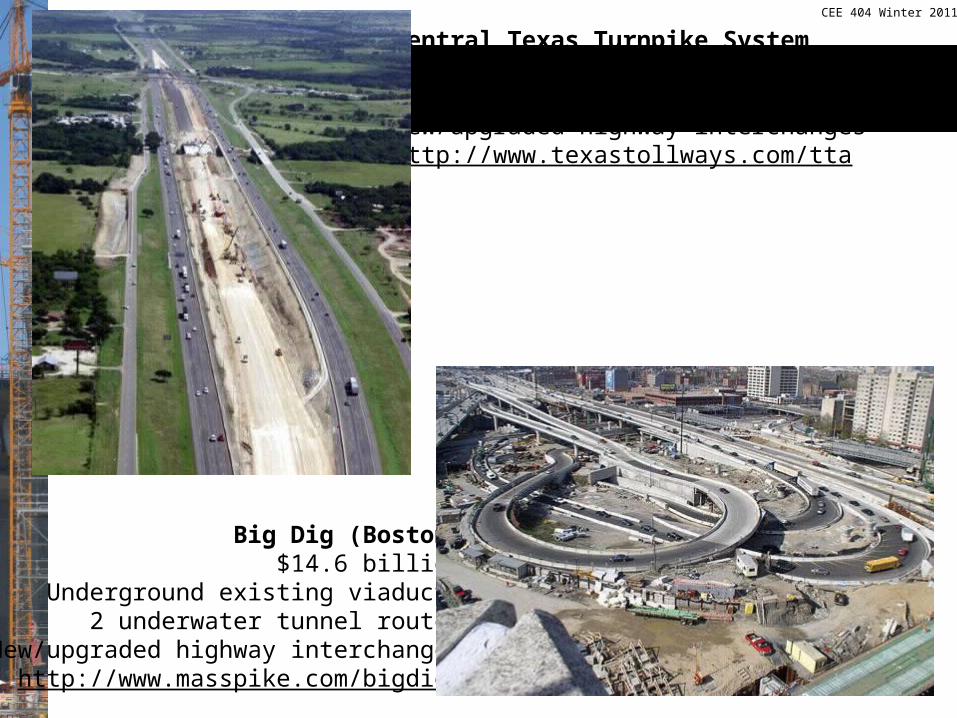
Big Dig (Boston)$14.6 billion
Underground existing viaducts2 underwater tunnel routes
New/upgraded highway interchangeshttp://www.masspike.com/bigdig
Central Texas Turnpike System$3.8 billion3 new highways around Austin areaNew/upgraded highway interchangeshttp://www.texastollways.com/tta
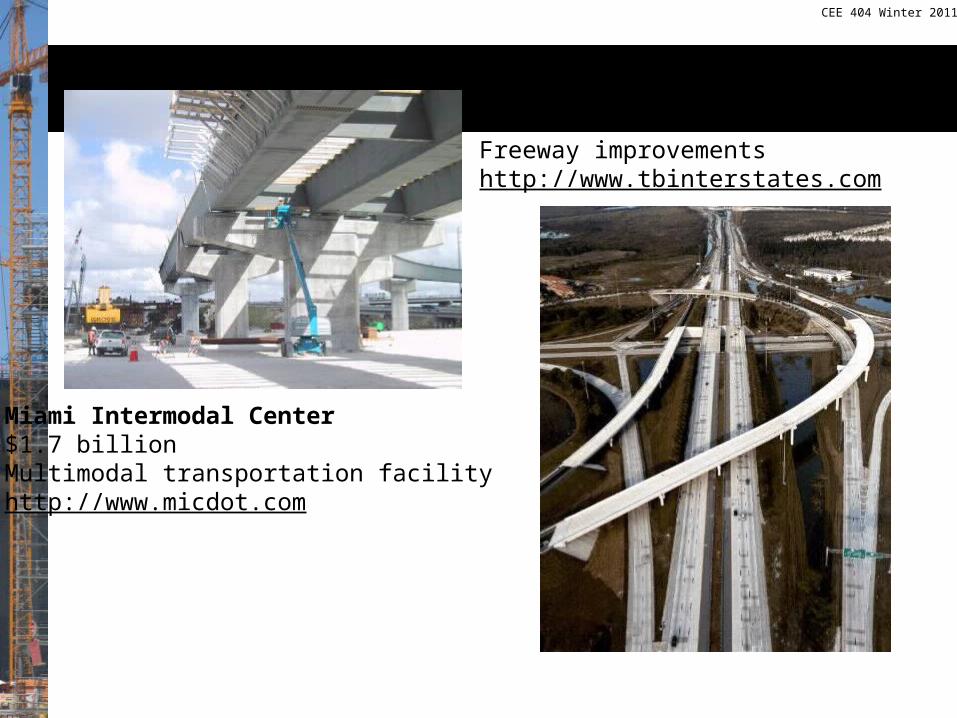
Miami Intermodal Center$1.7 billionMultimodal transportation facilityhttp://www.micdot.com
Tampa Bay Interstate System$1.5 billionFreeway improvementshttp://www.tbinterstates.com
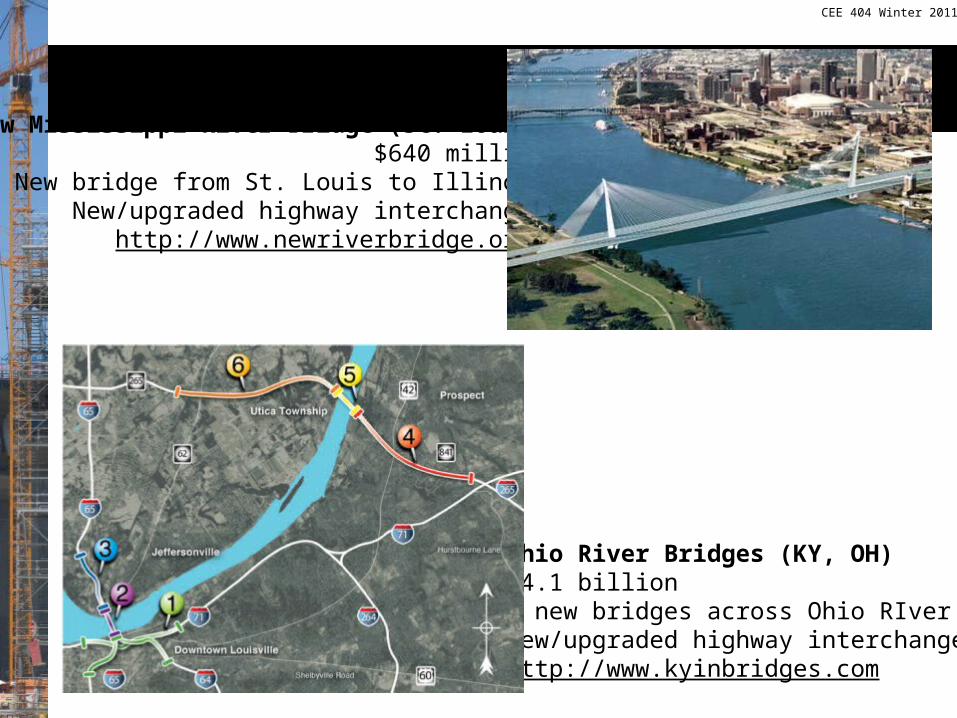
New Mississippi River Bridge (St. Louis)$640 million
New bridge from St. Louis to IllinoisNew/upgraded highway interchanges
http://www.newriverbridge.org
Ohio River Bridges (KY, OH)$4.1 billion2 new bridges across Ohio RIverNew/upgraded highway interchangeshttp://www.kyinbridges.com

Katy Freeway (Houston)$2.7 billion
Reconstruct 23 miles of I-102 upgraded interchanges
27 upgraded crossingshttp://www.katyfreeway.org
I-4 (Orlando)$1.7 billionReconstruct 18 miles of I-4http://www.trans4mation.org

Detroit River International Crossing$1.8 billionNew border crossing, bridge, plazawww.partnershipborderstudy.com
Birmingham, AL Northern Beltline$3.32 billion
52-mile freeway to bypass BirminghamCompletion: 2025
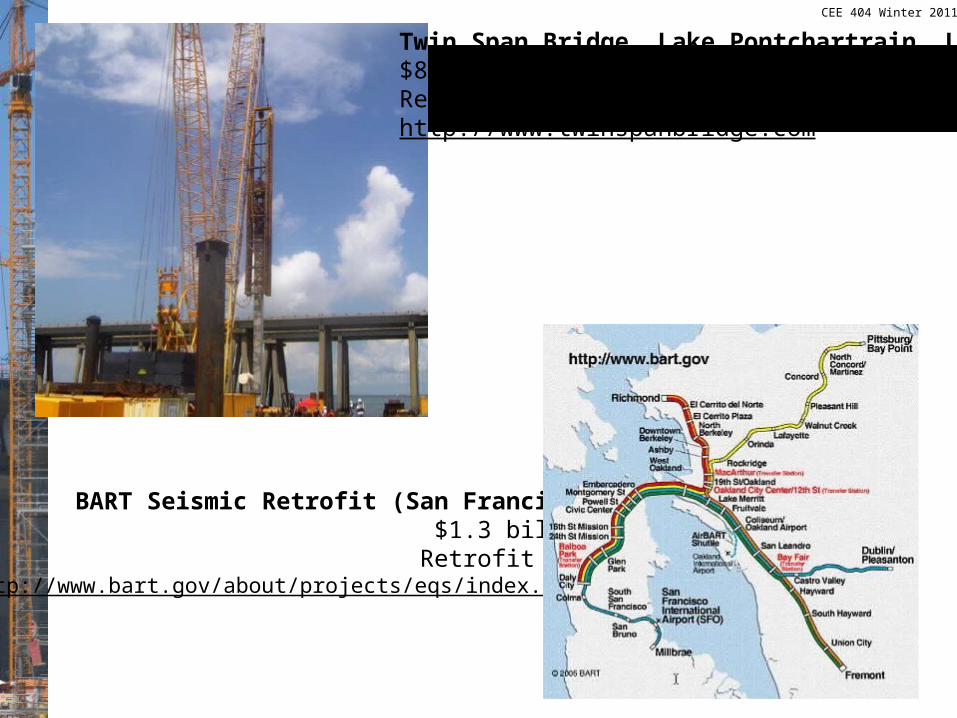
Twin Span Bridge, Lake Pontchartrain, LA$800 millionReplace bridge damaged by Katrinahttp://www.twinspanbridge.com
BART Seismic Retrofit (San Francisco)$1.3 billion
Retrofit BARThttp://www.bart.gov/about/projects/eqs/index.aspx

I-215 San Bernardino Corridor Imp.$0.8 billion
12 new lane-mileshttp://www.sanbag.ca.gov/projects/mi_fwy_215-sb.html
I-15 Managed Lanes (San Diego)$1.2 billion20 miles of HOT-type lanesNew/upgraded highway interchangeshttp://www.sandag.org/index.asp?projectid=34&fuseaction=projects.detail
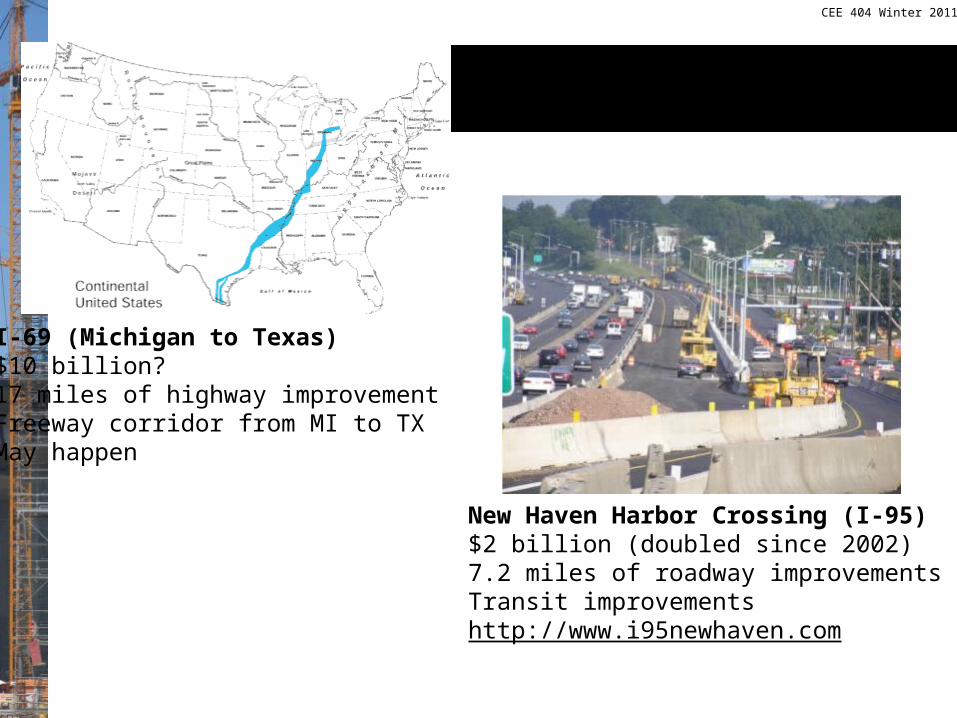
I-69 (Michigan to Texas)$10 billion?17 miles of highway improvementFreeway corridor from MI to TXMay happen
New Haven Harbor Crossing (I-95)$2 billion (doubled since 2002)7.2 miles of roadway improvementsTransit improvementshttp://www.i95newhaven.com
CEE 404 Winter 2011
62
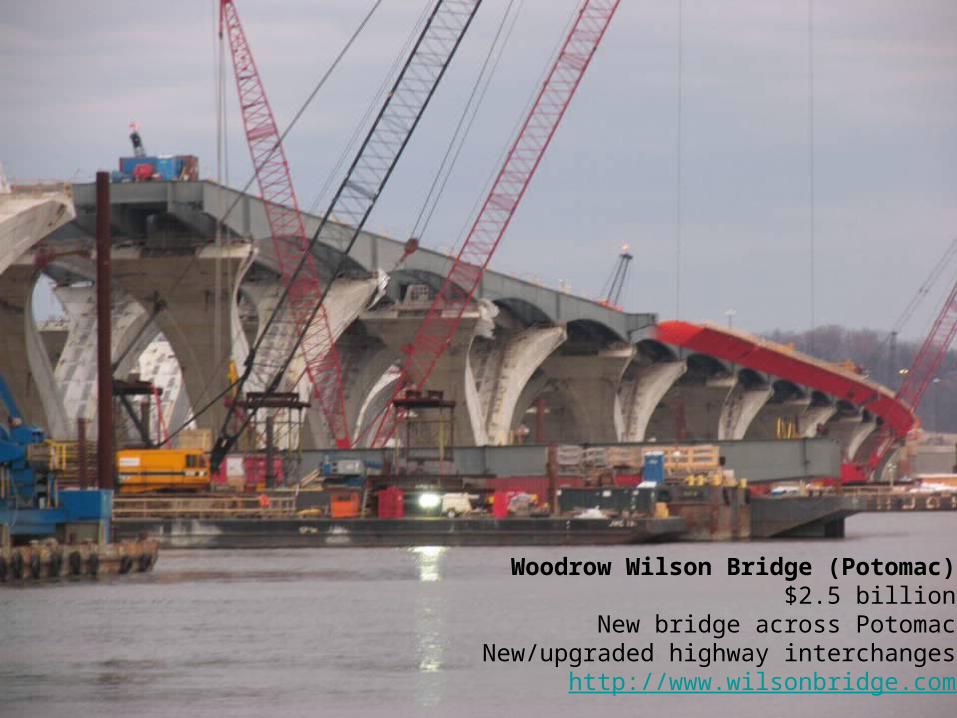
Woodrow Wilson Bridge (Potomac)$2.5 billion
New bridge across PotomacNew/upgraded highway interchanges
http://www.wilsonbridge.com

CEE 404 Winter 2011
63
Benicia-Martinez Bridge$1 billionNew bridge in Vallejo areahttp://www.dot.ca.gov/hq/esc/tollbridge/Ben-Mar/Ben-Mar.html

CEE 404 Winter 2011
64
San Francisco-Oakland Bay Bridge$6.3 billionNew bridge from Oakland to Y.B. Islandhttp://www.newbaybridge.org

CEE 404 Winter 2011
65
Boulder City/Hoover Dam Bypass$0.9 billion
10 miles of 4-lane freewayhttp://www.bouldercitybypass.com

Not just the U.S.Large project in China
Photos from Professor Dave Timm, Auburn University

Akashi Kaikyo Bridge (Pearl Bridge)$3.6 billion10 years to construct¥ 2,600 ($22) each way for cars25,000 vehicles/day
Great Belt (Storebǽlt - Denmark)$3.5 billion (1988 value)
28 Euros ($34) each way for cars132 Euros ($159) each way for lorries
Picture from B. Kattanppuram Blog
Picture from Mount Holyoke College
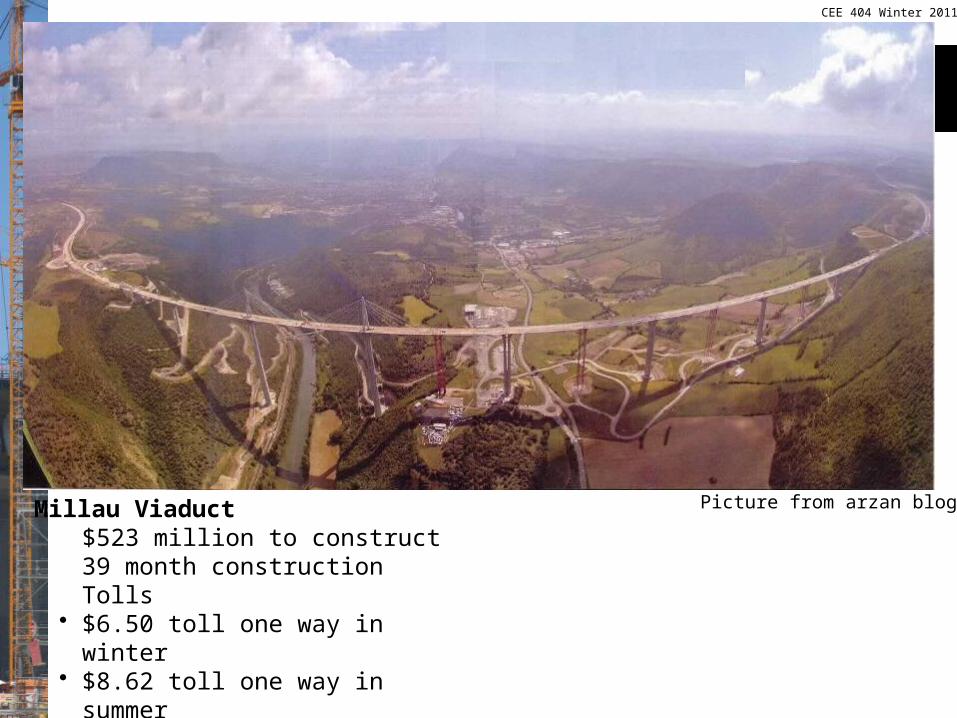
Millau Viaduct$523 million to construct39 month constructionTolls
• $6.50 toll one way in winter• $8.62 toll one way in summer
Picture from arzan blog
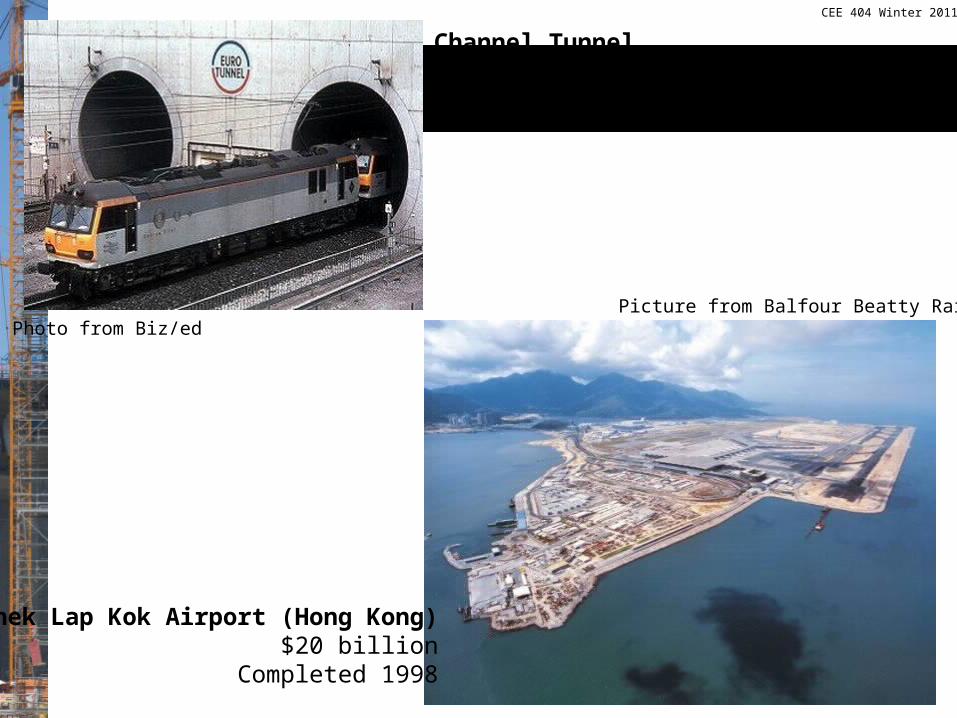
Photo from Biz/ed
Channel Tunnel$21 billionCompleted 1994
Chek Lap Kok Airport (Hong Kong)$20 billion
Completed 1998
Picture from Balfour Beatty Rail
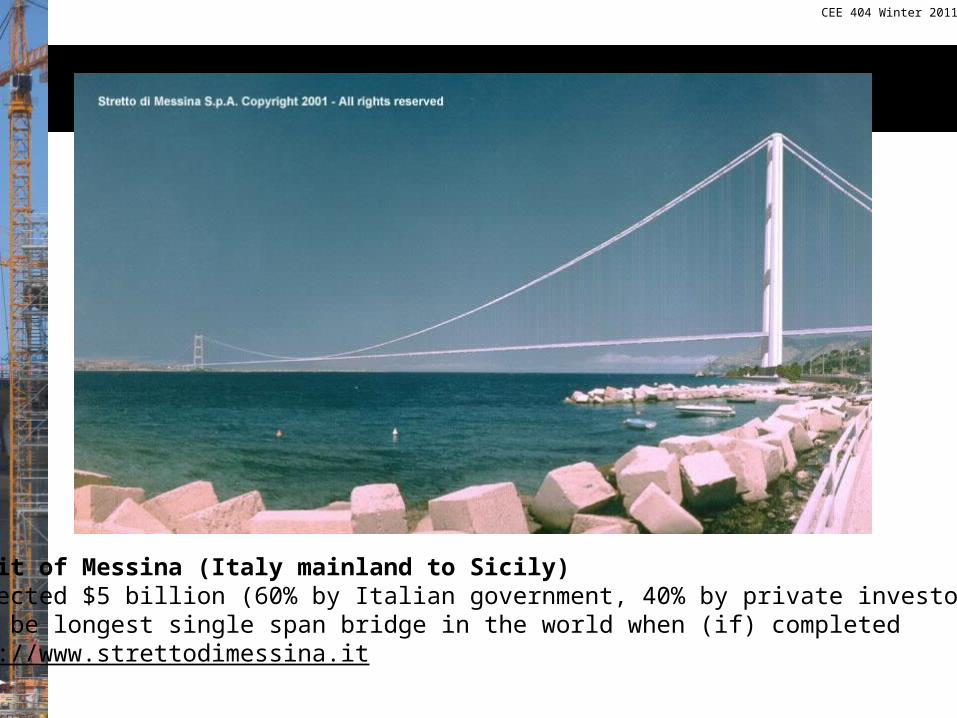
Strait of Messina (Italy mainland to Sicily)Projected $5 billion (60% by Italian government, 40% by private investors)Will be longest single span bridge in the world when (if) completedhttp://www.strettodimessina.it
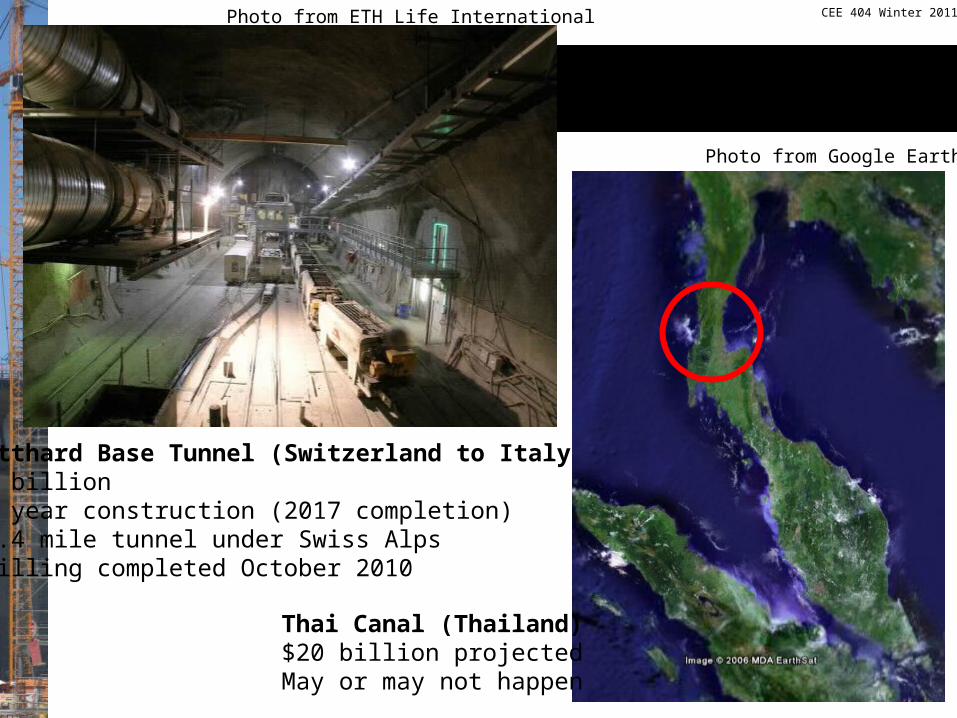
Gotthard Base Tunnel (Switzerland to Italy)$6 billion20 year construction (2017 completion)35.4 mile tunnel under Swiss AlpsDrilling completed October 2010
Photo from ETH Life International
Thai Canal (Thailand)$20 billion projected
May or may not happen
Photo from Google Earth

CEE 404 Winter 2011
72
Next on the List
• SR 167, Tacoma, WA• SR 520 Bridge, Seattle, WA• I-405 Corridor, Bellevue, WA• SR 509, Seattle WA • Alaskan Way Tunnel, Seattle WA

SR 167 Extension (Tacoma)Tacoma to Edgewood$2.3 billionExtend SR 167 to I-5 and SR 509
SR 520 Bridge Replacement$4 to 5 billion
Replace SR 520 bridgeImprove SR 520 corridor
Pictures from WSDOT website

I-405 Corridor Improvements$3.2 billionNew lanesReconfigured interchangesBus direct access
SR 509 Freight/Congestion Relief$1 billionExtend SR 509 to I-5 south of Seatac6 miles of new I-5 lanes
Pictures from WSDOT website

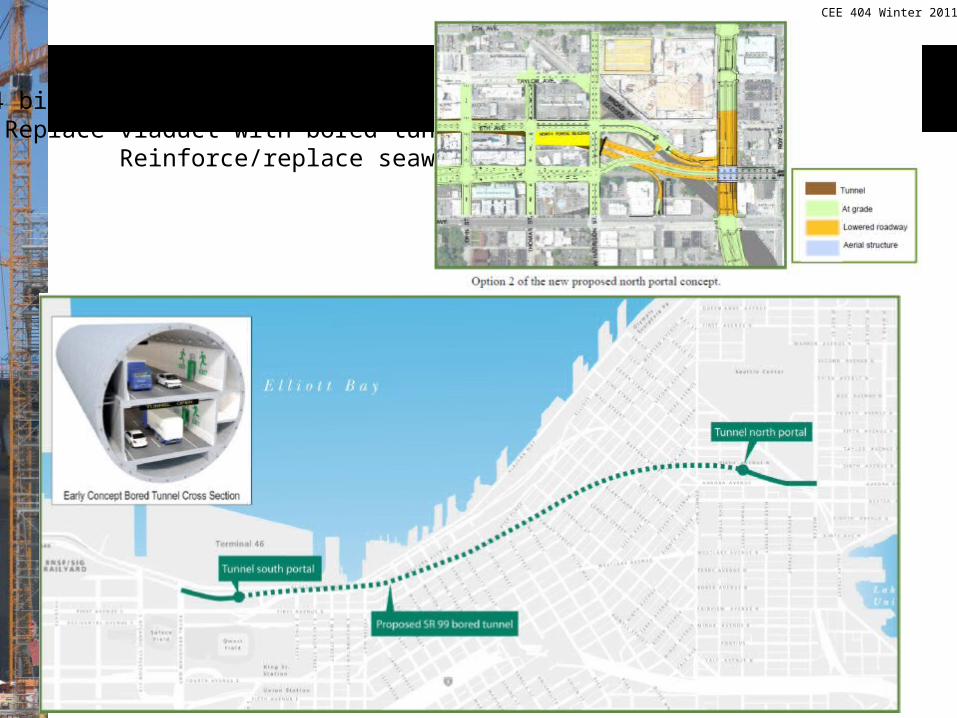
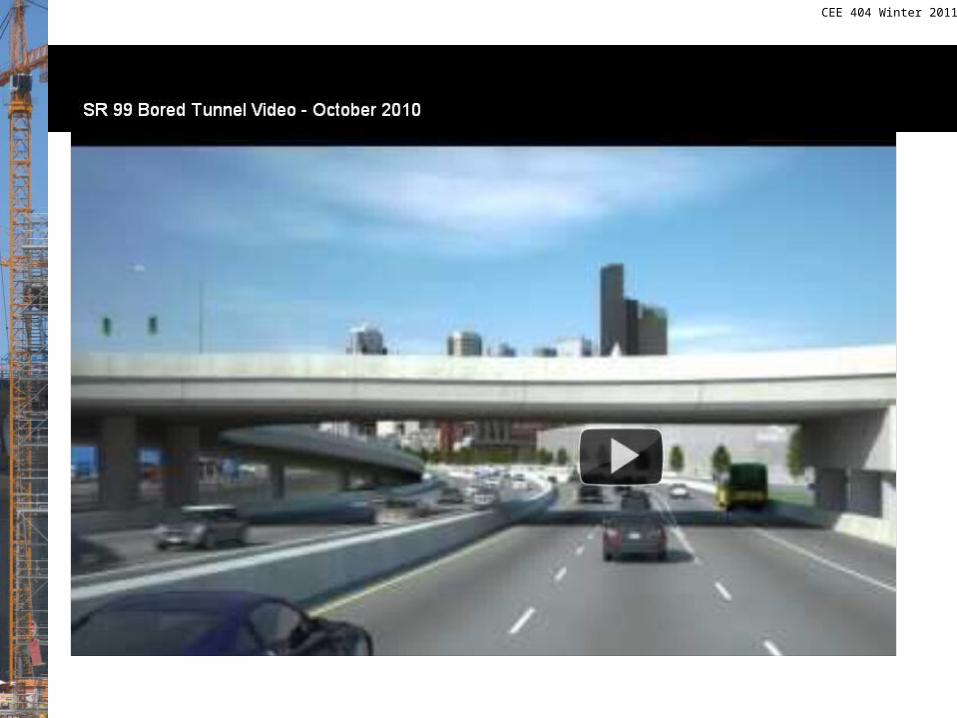
Alaskan Way Viaduct & Seawall$2.4 billion in funding available now
Replace viaduct with bored tunnelReinforce/replace seawall

I-5 - Pavement Reconstruction and Bottleneck Improvement ProjectsUndetermined CostRepair/replace I-5 pavement from Tukwila to Northgate (14 miles)Anticipated construction: 2017+Must coordinate with: • Alaskan Way viaduct replacement project
• SR 520 bridge replacement project• Link Light Rail• I-405 corridor improvements• SR 509 extension
CEE 404 Winter 2011
80
Primary References
• Altshuler, A. and Luberoff, D. (2003). Mega-Projects: The Changing Politics of Urban Public Investment. Brookings Institute Press, Washington, D.C.
• Federal Highway Administration (FHWA). (2008). Mega Projects web page. Maintained by the Office of Program Administration. www.fhwa.dot.gov/programadmin/mega.