cedim forensic disaster analysis group & catdat … · cedim forensic disaster analysis group...
TRANSCRIPT
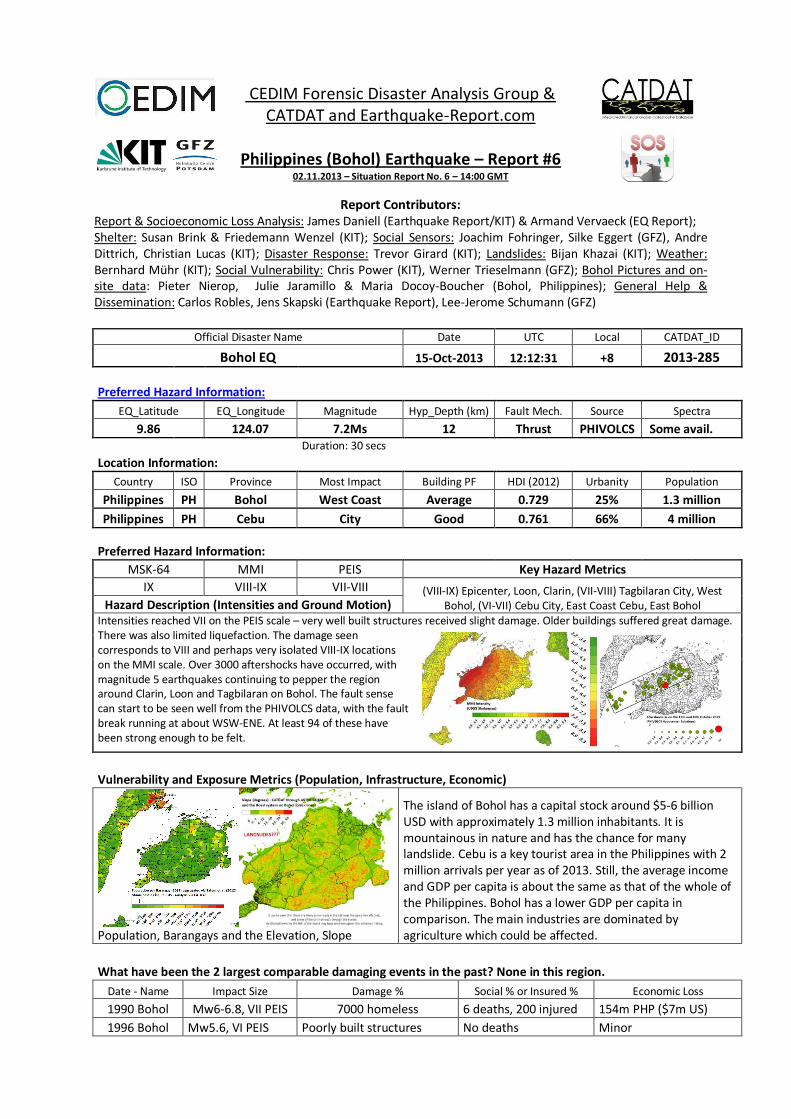
CEDIM Forensic Disaster Analysis Group & CATDAT and Earthquake-Report.com
Philippines (Bohol) Earthquake – Report #6
02.11.2013 – Situation Report No. 6 – 14:00 GMT
Report Contributors: Report & Socioeconomic Loss Analysis: James Daniell (Earthquake Report/KIT) & Armand Vervaeck (EQ Report); Shelter: Susan Brink & Friedemann Wenzel (KIT); Social Sensors: Joachim Fohringer, Silke Eggert (GFZ), Andre Dittrich, Christian Lucas (KIT); Disaster Response: Trevor Girard (KIT); Landslides: Bijan Khazai (KIT); Weather: Bernhard Mühr (KIT); Social Vulnerability: Chris Power (KIT), Werner Trieselmann (GFZ); Bohol Pictures and on-site data: Pieter Nierop, Julie Jaramillo & Maria Docoy-Boucher (Bohol, Philippines); General Help & Dissemination: Carlos Robles, Jens Skapski (Earthquake Report), Lee-Jerome Schumann (GFZ)
Official Disaster Name Date UTC Local CATDAT_ID
Bohol EQ 15-Oct-2013 12:12:31 +8 2013-285
Preferred Hazard Information:
EQ_Latitude EQ_Longitude Magnitude Hyp_Depth (km) Fault Mech. Source Spectra
9.86 124.07 7.2Ms 12 Thrust PHIVOLCS Some avail. Duration: 30 secs
Location Information:
Country ISO Province Most Impact Building PF HDI (2012) Urbanity Population
Philippines PH Bohol West Coast Average 0.729 25% 1.3 million
Philippines PH Cebu City Good 0.761 66% 4 million
Preferred Hazard Information:
MSK-64 MMI PEIS Key Hazard Metrics
IX VIII-IX VII-VIII (VIII-IX) Epicenter, Loon, Clarin, (VII-VIII) Tagbilaran City, West Bohol, (VI-VII) Cebu City, East Coast Cebu, East Bohol Hazard Description (Intensities and Ground Motion)
Intensities reached VII on the PEIS scale – very well built structures received slight damage. Older buildings suffered great damage. There was also limited liquefaction. The damage seen corresponds to VIII and perhaps very isolated VIII-IX locations on the MMI scale. Over 3000 aftershocks have occurred, with magnitude 5 earthquakes continuing to pepper the region around Clarin, Loon and Tagbilaran on Bohol. The fault sense can start to be seen well from the PHIVOLCS data, with the fault break running at about WSW-ENE. At least 94 of these have been strong enough to be felt.
Vulnerability and Exposure Metrics (Population, Infrastructure, Economic)
Population, Barangays and the Elevation, Slope
The island of Bohol has a capital stock around $5-6 billion USD with approximately 1.3 million inhabitants. It is mountainous in nature and has the chance for many landslide. Cebu is a key tourist area in the Philippines with 2 million arrivals per year as of 2013. Still, the average income and GDP per capita is about the same as that of the whole of the Philippines. Bohol has a lower GDP per capita in comparison. The main industries are dominated by agriculture which could be affected.
What have been the 2 largest comparable damaging events in the past? None in this region.
Date - Name Impact Size Damage % Social % or Insured % Economic Loss
1990 Bohol Mw6-6.8, VII PEIS 7000 homeless 6 deaths, 200 injured 154m PHP ($7m US)
1996 Bohol Mw5.6, VI PEIS Poorly built structures No deaths Minor

Preferred Building Damage Information: (Damage states will be filled in later when more info available)
Description: Many government, churches and private (over 66932 so far)
The counting of buildings destroyed has not been undertaken with only a few houses included in the current count of 13249 destroyed and 53683 damaged. Based on families displaced, this value could be up to at least 15-20000 destroyed. Loon has been particularly hard hit as well as Tubigon, Antequera, Carmen, Tagbilaran and others. See the pictures for locations of current counting. Julie Jaramillo (all rights reserved)
Secondary Effect Information: For weather impacts see reports 1-5 & http://www.wettergefahren-fruehwarnung.de/
Type Impact Damage % Social % Economic %
Landslides Many roads blocked, infrastructure damage Minor At least 20 deaths 1-5% See below in the pictures for Barangays affected
Preferred Social Impact Information:
Type Median Accepted Range Description Source
Deaths 230 incl. 8
missing May rise
Hypocenter played a major role in fatality estimation: 20 to 400 =various models
Daniell, CATDAT, Earthquake
Report. **NB: The lowest death toll is currently 222 as 8 are missing.
Injuries 976 Approx. 1000 877 Bohol, 96 Cebu NDRRMC
Sheltered Homeless 87000 Up to 105000 87146 currently in shelters NDRRMC Data
02.11.2013
All Homeless 368691 380906 peak 368691 currently displaced – see below NDRRMC
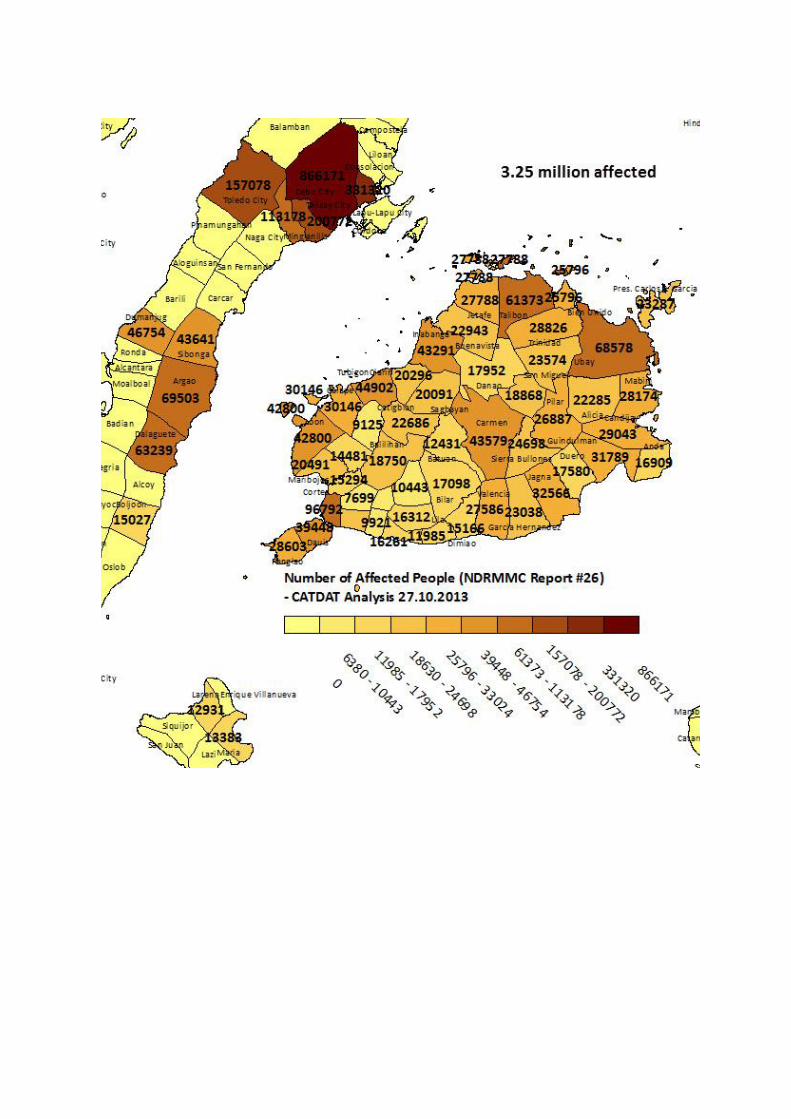
Affected 3.2m 3.5m peak Cebu, West Bohol, Negros NDRRMC *predicted
Preferred Current Economic Impact Information: $million int. event-day dollars
Type Median Accepted Range Description Source
Reconstruction Cost $162m $100m-$200m
Reconstruction costs have been estimated at 7 billion PHP NDRRMC/Govt
Total Loss $89.4m $55m-121m Total estimate (using rapid loss model
combined with damage for range) CATDAT/James
Daniell
Insured Loss <$2m $1m-5m Minor insurance takeout but some in Cebu CATDAT
Aid Impact $8m EU: $3.3mn, AU: $3mn - $46.8mn desired. NDRRMC
Direct Economic Damage (Total) - Summary Social Sensors & Disaster Response
There have been estimates of some components of the infrastructure damage being 2.2 billion PHP (around 50 million USD).
The rapid loss estimation of CATDAT/James Daniell, gives a total damage value coming out to between 55-100 million USD (up to 4.5 billion PHP) with a median 89.4 million USD (3.9 billion PHP).
The reconstruction cost has been estimated by the government to be approx 7 billion PHP (162m USD)
This is a significant percentage of the gross capital stock of the location, with a MDR approaching 2%.
Analysis has been undertaken as to the social media response during the earthquake, and also the associated aid and disaster response after the disaster. See the main chapters for more info.
Source: Silke Eggert, Joachim Fohringer (GFZ); Trevor Girard (KIT)
Insured Loss Estimates:
Some public infrastructure damage occurred, and in addition there was minor damage to tourist facilities in various locations. It is still expected that the damage will be insignificant for the insurance industry. In addition no global impacts on supply chains.
Abridged Summary Description from full CATDAT description sources:
A catastrophic earthquake hit the densely populated area of Cebu, and the less densely populated island of Bohol with catastrophic consequences.
CATDAT Economic Index Rank: 8: Very Damaging CATDAT Social Index Rank: 8: Destructive This report was produced in conjunction with the CATDAT database, earthquake-report.com, NDRRMC, PHIVOLCS and USGS data. As shown below is full size documentation of the diagrams shown in the summary above. The data is current as of 2nd November 2013, 6:00am European Standard Time. For the current data, go to www.earthquake-report.com.
The following report contains:- 1. Seismological Information 2. Geological Effects and Earthquake-Induced Landslides 3. Population and the Effects on Casualties 4. Shelter and Damage to homes 5. Social Sensors 6. Information Gap Analysis
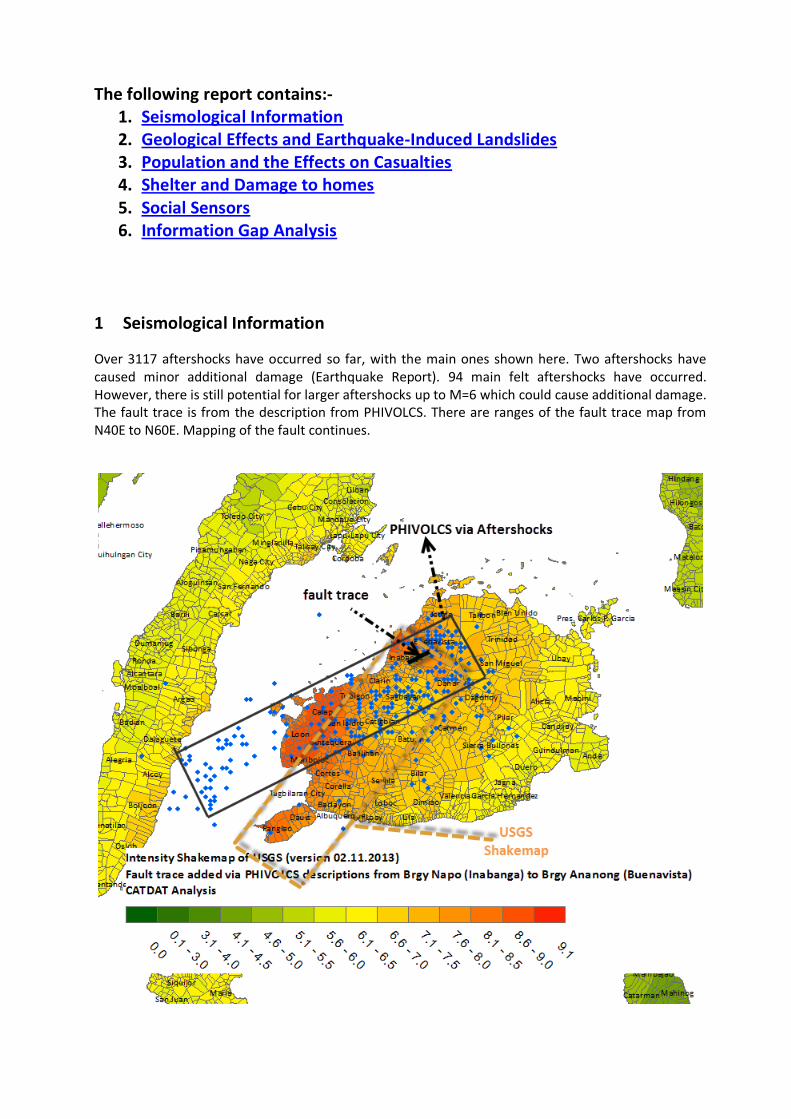
1 Seismological Information
Over 3117 aftershocks have occurred so far, with the main ones shown here. Two aftershocks have caused minor additional damage (Earthquake Report). 94 main felt aftershocks have occurred. However, there is still potential for larger aftershocks up to M=6 which could cause additional damage. The fault trace is from the description from PHIVOLCS. There are ranges of the fault trace map from N40E to N60E. Mapping of the fault continues.

The peak ground acceleration was likely around 0.7-0.8g with the highest recording being 0.37g. Data was collected 02.11.2013 from USGS (http://earthquake.usgs.gov/earthquakes/shakemap/global/shake/b000kdb4/download/stationlist.txt).

2 Geological Effects and Earthquake-Induced Landslides
The fault scarp has been found from Brgy. Napo in Inabanga to Brgy. Anonang in Buenavista (according
to PHIVOLCS). The range of the height of the fault scarp has been measured from 10cm to 5m.
Figure: PHIVOLCS-DOST website (http://www.phivolcs.dost.gov.ph/) In addition, there has been coastal uplift observed in Maribojoc. It is expected that the fault extends from Inabanga/Buenavista, down to Loon and Maribojoc in an approximately NE-SW direction.
Figure: Annotated by PHIVOLCS-DOST website (http://www.phivolcs.dost.gov.ph/)
In total, at least 20 people died due to landslide effects. This is much less than the 107 dead from landslides out of 113 dead and missing from the February 2012 Negros earthquake. The magnitude 7.2 earthquake on 15 October 2013 main shock, triggered shallow landslides that can be observed on the steep natural slopes of the famous Chocolate Hills in Bohol. The shallow disaggregated landslides are typically not associated with particular geologic units and/or type of slopes. They are usually as deep as the root zone of the vegetative cover, anywhere from several decimeters to a meter deep, and consist of dry, highly disaggregated and fractured material that cascaded down-slope to flatter areas at or near the base of slopes. Shallow disaggregated landslides account form most the failure types after earthquakes. However, some of the landslides shown on the Chocolate Hills (when looked at more closely are more deep-seated rock and earth slumps that involve relatively large volumes of material (see Figures at the end

of the report from Julie Jaramillo). Earthquake triggered landslides contributed to the following noted disruptions as shown and more than 40 barangays have reported landslides :
The highway in Cortes particularly in Lilo-and was rendered impassable due to a landslide. A part of Cortes’ highway was also damaged.
In Balilihan, the Bohol Mayor, Dominisio Chatto has confirmed that 5 people died from a landslide due to the earthquake.
In Loon, Bohol, numerous landslides have affected areas.
Left: Chocolate Hills Landslides (courtesy: @docjolt); Right: Julie Jaramillo on site at Choc Hills.
To aid in the rescue and relief as well as resettlement operations, the National Anti-Poverty Commission (NAPC) on Wednesday released the maps of Cebu, Negros Oriental, and Siquijor indicating location of poor households in barangays that are exposed to high risks of landslides.

The landslide distances are within the bounds seen in historical earthquakes as tested by Bijan Khazai for ChiChi, Northridge, Seattle (Nisqually) and El Salvador earthquakes, and James Daniell for Cebu-Bohol (after Keefer, 1999; Khazai, 2004). Keefer (1984a) presents magnitude-distance relationships using two distance definitions (epicentral and fault projection) for three different landslide categories: coherent, disrupted slides and falls, and lateral spreads and flows. The figure above shows the earthquake magnitude and the maximum distance from the epicenter limit curves obtained by Keefer (1984a) for both coherent and disrupted slides. Superimposed on these curves is a suite of more recent events that plots well within this envelope, indicating that for the most part the types of landslides that occurred were quite typical of what can be expected in major earthquakes. The range of landslides is shown in this diagram, but only the furthest away counts as the maximum distance (in this case around 65km).

3 General Information on Population and the effects of casualties
This region holds 10.75 % of the Total Elderly Population, as a percent of the Population of the Region VII the elderly make up 4.75 % of the total population which is higher than the national average (3.77 %). Poverty incidence (2009) Observed home values vs. spatially weighted average of neighbors shows that Bohol
Source: Philippine Human Development Report 2012/2013; Geography and human development in the Philippines: page 5

Most of the dead and missing are in Loon (68), Antequera, Maribojoc, Tubigon, Clarin, Sagbayan and are primarily located on the western side of Bohol island. There are currently 222 dead and 8 missing reported. At least 20 deaths are via landslides, and around 20 deaths are also via heart attacks and panic-related injuries. The proportion of the other 190 are expected to be shaking related.
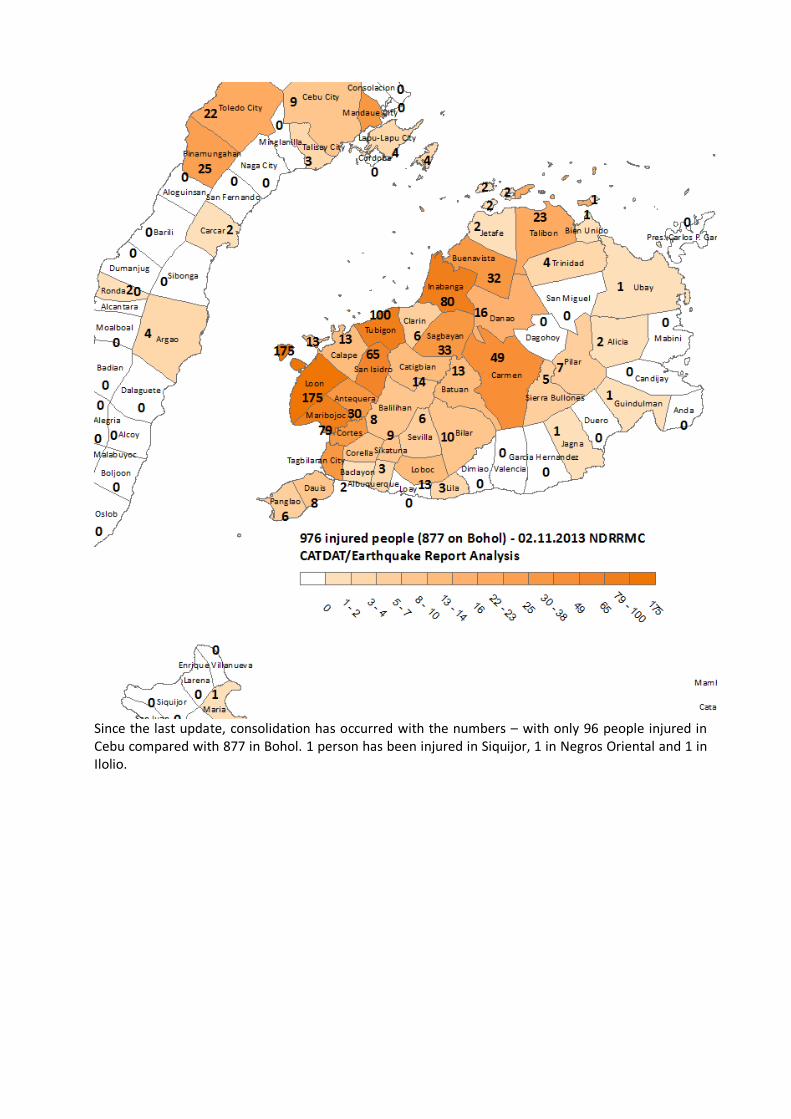
Since the last update, consolidation has occurred with the numbers – with only 96 people injured in Cebu compared with 877 in Bohol. 1 person has been injured in Siquijor, 1 in Negros Oriental and 1 in Ilolio.

4 Shelter and damage to homes
The number of homeless from this earthquake is somewhere between 87,000 and 370,000. Due to aftershocks, damaged houses, lack of basic services, 87,000 people are in shelters, but many remain also in tents next to their homes or along roads (around 280,000 are outside of shelters but still in need of basic support. Emergency Situation according to NDRRMC site report 34 (02.11.2013) for displaced families and
persons who are in or outside evacuation centers.
Province No. of evacuation centers
Displaced families/persons
Families/persons inside centers
Families/persons outside centers
Cebu 2 1378/6879 14/63 1364/6806
Bohol 375 73519/361775 17516/87083 56003/274692
Total 377 74907/368691 17530/87146 57377/281545
The numbers are still being counted and we must wait for more information as to the total of long-term homeless vs. the current short-term homeless numbers and in addition, the destroyed and damaged buildings vs. the homeless numbers.

13000+ houses have been counted as destroyed, 53000+ houses counted as damaged, as of
02.11.2013.

5 Social Sensors
Over 40% of people logging into the Earthquake Report website in the first 10 mins were from Cebu City, 12% of people logging into the website in the first 6 hours were from Cebu City, and around 30% from Philippines. The following diagram shows visitors in the first 6 hours from each city. The darker circle in Cebu City, and the other blue circle is Manila. Individual peaks were seen with each major aftershock and the initial alert after 1 minute was from IP address increases.
The social sensoring project of CEDIM at GFZ (Joachim Fohringer and Silke Eggert) has been active with characterising Twitter responses. Here is the full analysis that they have undertaken:- Method & Data
To get rapid information on what eye-witnesses report from the epicentral area, we analyze twitter
messages related to the Oct. 15 Mw7.1 Philippines (Bohol) earthquake. We extract Twitter messages,
so called tweets containing one or more specified keywords from the semantic field of “earthquake”
and use them for further analysis shown below. For the time frame of Oct. 15 to Oct 18 we get a data
base of in total 50.000 tweets whereof 2900 tweets are localized and 470 have a photo attached.
When do people twitter?
In general, people start to twitter seconds after or even during the shaking they feel. Studies showed
that the first tweets related to an earthquake are sent ~20 second after the p-wave arrival. Figure 1
shows the number of tweets per 10 minutes for the first three days after the mainshock. The number
of messages decays with the time but major aftershocks still evoke a peak of tweets even in later time.
The graph also reflects very well day-time and night-time (11pm – 7am are highlighted in grey in the
time axis).
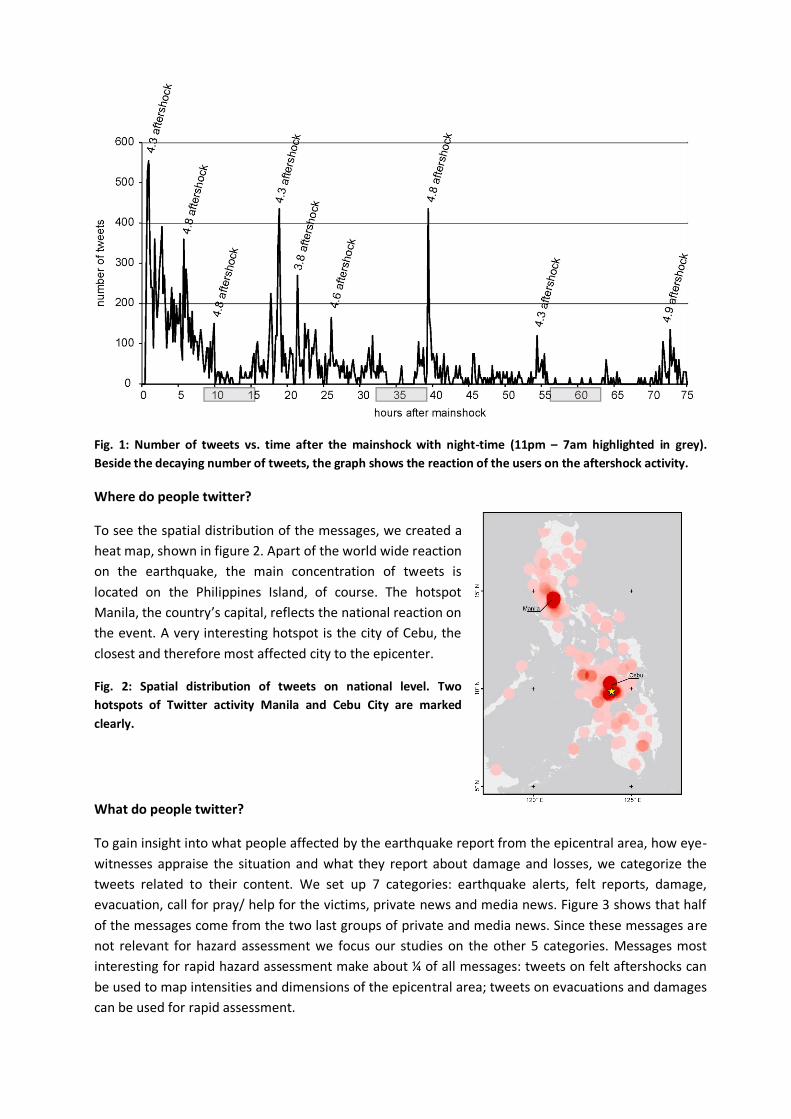
Fig. 1: Number of tweets vs. time after the mainshock with night-time (11pm – 7am highlighted in grey).
Beside the decaying number of tweets, the graph shows the reaction of the users on the aftershock activity.
Where do people twitter?
To see the spatial distribution of the messages, we created a
heat map, shown in figure 2. Apart of the world wide reaction
on the earthquake, the main concentration of tweets is
located on the Philippines Island, of course. The hotspot
Manila, the country’s capital, reflects the national reaction on
the event. A very interesting hotspot is the city of Cebu, the
closest and therefore most affected city to the epicenter.
Fig. 2: Spatial distribution of tweets on national level. Two
hotspots of Twitter activity Manila and Cebu City are marked
clearly.
What do people twitter?
To gain insight into what people affected by the earthquake report from the epicentral area, how eye-
witnesses appraise the situation and what they report about damage and losses, we categorize the
tweets related to their content. We set up 7 categories: earthquake alerts, felt reports, damage,
evacuation, call for pray/ help for the victims, private news and media news. Figure 3 shows that half
of the messages come from the two last groups of private and media news. Since these messages are
not relevant for hazard assessment we focus our studies on the other 5 categories. Messages most
interesting for rapid hazard assessment make about ¼ of all messages: tweets on felt aftershocks can
be used to map intensities and dimensions of the epicentral area; tweets on evacuations and damages
can be used for rapid assessment.

Fig. 3: Categories of tweets and their percental distribution: Above left: all tweets, below right: tweets directly
related to the earthquake.
Case study Cebu
While messages calling for spiritual support or containing personal information are distributed all over
the country, tweets related to damage, evacuation and felt shaking are located in the epicentral area.
They give a first view of the earthquake’s effects and dimensions. Cebu (870.000 inhabitants) is the
closest and probably most affected city to the epicenter. Figure 4 shows a close up view of the
municipal area with all tweets categorized by their content. Messages having a photo attached are
highlighted. Most tweets report about felt aftershocks but especially in the city center messages
report about damage and evacuations.
Fig. 4: Distribution of tweets in the municipal area of Cebu City. Text messages (circle) and messages with photo included (camera) are colored by category. Two examples are shown in detail.

As mentioned above, we focus our studies on two aspects: damage and intensities. We classify all
tweets related to damage and evacuation according to the type of damage. Furthermore, we
“translate” the content into intensities and color it according to the European Macroseismic Scale
EMS-98 (see figure 5).
Fig. 5: Tweets related to damage in the municipal area of Cebu. The symbols represent the type of damage, colors mark the intensity according to the EMS-98 scale.
Most people report about destroyed buildings, mainly about their home’s interior affected by the
shaking. Mainly fallen objects or small cracks in the walls are observed, not more than slight damages
(V/ VI). The damaging reports (VII) come from two heavily damaged churches with collapsed steeples
and some major cracks. Some people report about destroyed bridges and impassable roads whereas
very few tweets are related to debris, landslides or power outage. Minor but nonetheless useful
information for rapid response is also the group of tweets reporting about no damage. The map gives a
first overview about the situation after the earthquake in the city of Cebu. Intensities are always
subjective and influenced by the author’s impression. But numerous tweets on one building or
attached pictures can serve as a proof for correctness.
To see where and with what intensity people still feel the shaking of the aftershocks, we translate all
tweets related to the category “felt” into EMS-98 intensities: felt nothing (I), shaking (V), strong
shaking (VI), and very strong shaking (VII). An interpolated map of the intensities within the municipal
area of Cebu is shown in figure 6. Especially for the city center, we get a detailed, though still
subjective image of the shaking. Peripheral areas should be treated with caution.

Fig. 6: Intensity map for Cebu City created from the tweets related to felt shaking. The intensity is colored according to the EMS-98 scale, tweets included in the calculation are marked with black circles
Summary
Twitter messages related to the Mw7.1 Bohol earthquake give fast and eye-witness based information on the impact within the epicentral area. Nationwide, people mainly distribute news related to the earthquake and call for prayers, tweets from the epicentral area concern mainly aftershocks felt. For the city of Cebu we could produce both an intensity map and a damage map converting the content into the EMS-98 scale. Both maps give detailed information on local scale. Reliability of the information is an issue but attached photos and a high numbers of tweets concerning the same issue can be used as a correction factor or proof. All things considered, the information extracted from Twitter is an important and useful piece to the situational awareness of the earthquake’s impact.

TENAS – Twitter Event Notification and Analysis Service - KIT (Andre Dittrich and Christian Lucas)
(spatial resolution: 0.25° x 0.25°; temporal resolution: approx. 1 minute)
The grid-based Twitter Event Notification and Analysis Service of the CEDIM FDA Taskforce detected
the earthquake and delivered an automatic e-mail alert at 15th October, 12:15:07 UTC, i.e. a delay of 2
minutes and approx. 30 seconds. The automatic alerts from official notification services took for
example about 30 minutes (GEOFON) and 39 minutes (USGS).
The first alert was generated in the grid cell with the center at 123.875° (longitude) and 10.375°
(latitude), i.e. Cebu, Philippines, based on geo-referenced messages created between 12:14 and 12:15
UTC. The derived information from the first alert are shown in table ??? and figure ???.
Location Cebu, Philippines Cell center 123.875° (longitude) 10.375° (latitude) Centroid of messages 123.9094° (longitude) 10.334° (latitude) Keywords earthquake 5 times* Number of messages 8 Cell mean number of messages 2.1429 Cell standard deviation of number of messages 1.801 Probability** 94.6%
Table 1 First summarized information of the detected event on Twitter
*English and tagalog occurences combined
**Probability that the statistical test accepts the alternative hypothesis (“Event occurred”) if it is true
Following alerts for the same event occurred for several hours. Scattered messages reporting damage
mainly concerning infrastructure elements were collected for further analyses. Most of the aftershocks
exceeding an approx. magnitude of 4.7 could be separately detected and classified as such. In total,
the grid-based approach collected 1191 geo-referenced messages related to the earthquake and its
subsequent aftershocks during a time range of about one week. Further relevant Tweets without
direct geo-reference (i.e.
geographical coordinates) were
identified via keyword searches.
The disaster related keywords that
were mainly used to communicate
this specific event on Twitter were:
earthquake, quake, shaking, shock,
aftershock, alarm, tsunami,
epicenter, magnitude, crack,
warning, destroyed, damage,
depth, tremor, collapse
The figure shows the automatically
generated map provided through a
link in the e-mail alarm.

Over 530 felt reports were collected on Earthquake-Report.com, with additional intensity estimates from many people which are currently being geocoded. It can be seen that a lot of the responses came from Cebu City, but scattered responses came also from Bohol.

6 Information Gap Analysis
Information Gap Analysis:
Comparison of the data available following the Bohol Earthquake (2013) and Negros Oriental Earthquake (2012)
Produced by: Trevor Girard
Each chart is the result of an analysis of the information produced within the first three days following the
disaster. Information for the 15 Oct 2013 earthquake in Bohol was retrieved as it was released, and was mostly
obtained from Earthquake Report (http://earthquake-report.com/2013/10/15/very-strong-earthquake-
mindanao-philippines-on-october-15-2013/), NDRRMC Situation Reports obtained from ReliefWeb
(http://reliefweb.int/disaster/eq-2013-000134-phl), and various other documents released on ReliefWeb. The
information for the 06 Feb 2012 earthquake in Negros Oriental was obtained from reports archived on
ReliefWeb (http://reliefweb.int/disaster/eq-2012-000018-phl), with the majority being NDRRMC Situation
Reports. All information obtained from the referenced sources was categorized under the headings listed on
the left side of the graph. Each piece of critical information was separated into three types, being basic data
(who, what, where, when), analysis (how, so what), and root causes (how come, why so). Refer to Review of
Publicly Available Information document in appendix which summarizes information provided.

Review of Publicly Available Information provided as of 18 Oct 2013 for:
Bohol Earthquake, Philippines: 8:12 am local time, 15 Oct 2013 Produced by: Trevor Girard
Information predicting a disaster event, describing an event which has occurred, or describing the current situation:
When is the public made aware of the characteristics of the event (intensity, direction of travel, water levels) that could have been predicted? and: *What was the quality of this information? (*asked for every question which follows in this table)
Information detailed and provided within a reasonable time-frame, and updates were frequent Based on: Details were provided within 20 minutes and updates were very frequent. Within hours of the earthquake the potential for aftershocks was identified. Within the same day it was confirmed that there was no immediate threat of a tsunami.
How soon after the disaster event was the public made aware of the details? How often was the public provided with updates on the situation?
Description of affected area(s) or people:
How soon after the disaster event was information provided detailing the areas or specific people affected?
information detailed and provided within a reasonable time-frame Based on: cities suspected to be worst affected were identified within hours including populations. Number of affected and areas updated more than daily.
Human life safety and potential threats to human life safety in the near future (including particularly vulnerable populations)
How soon after event is the public made aware of the casualties/missing?
information detailed and provided within a reasonable time-frame Based on: casualties begin to be reported within 20 minutes, with updates to numbers every hour or two for the first day. By 2 days after, total dead risen to 156, 22 missing, and 374 injured, and identification of all casualties provided including name, age, address and cause of death where known (only for 5).
When is the public made aware of dangers to human life safety (potential tsunami/flooding, building failure, landslides, water/air contamination) that ought to have been predicted?
no information provided based on: although discussion of predicted aftershocks and landslides, there is no description of how these events are a threat to human life safety.
When did the DM system begin activities aimed at combating threats to human life safety (evacuations, SAR)?
information provided within a reasonable time-frame; however, coverage is questionable as 1 day after Loon is reported to have no SAR personnel even though it is identified as being one of hardest hit Based on: Same day descriptions of SAR activity, Disaster response team deployed including location and update on number rescued (3). After 1 day report states that in Loon the only people involved in the search and rescue efforts were residents and local police.
When did the DM system begin activities aimed at dealing with fatalities?
no information provided Based on: no info regardings handling of fatalities and to the contrary one case of a fatality not being able to receive last rites because the church was destroyed, which suggests there may be an issue with dealing with some of the dead.
Basic human needs (water, food, shelter, clean air, sanitation)
Disruption: How soon is the DM system aware of disruptions to basic human needs?
information detailed and provided within a reasonable time-frame Based on: After 1 hour report of many callapsed homes. On same day description of areas without water, number of families displaced provided, and number served in evacuation centers and updates follow

daily.
Solution: How soon are activities being undertaken to meet the basic needs of those affected?
information detailed and provided within a reasonable time-frame Based on: Same day DSWD is delivering relief material to Bohol, the PRC made available NFIs for at least 15,000, and government pre-positioned PhP98.66 million worth of standby funds, family food packs, and NFIs. After 1 day 13 evacuation centers are holding 12,500 people.
Transportation networks (road, air, rail, river/sea)
Disruption: How soon is the public made aware of disruptions to transportation networks?
information detailed and provided within a reasonable time-frame Based on: Within hours reports of road damage and sea travel is suspended. Same day updates detail on road, bridge, airport, and sea port disruptions.
Solution: How soon are activities being undertaken to meet the transportation needs of those affected?
information detailed and provided within a reasonable time-frame Based on: Most sea ports and airports resumed operation on same day. After 1 day helicopters were being used for transport and clearing of roads being conducted.
Capacity of medical/ health services
Disruption: How soon is the public made aware of disruptions to the capacity of medical/ health services?
information detailed and provided within a reasonable time-frame Based on: Same day description of collapsed hospital including location and cause, and list of damages to hospitals including location and status. After 1 day report confirms child births are being done in the open and patients are being treated outdoors, and states that medical supplies and hygiene kits are badly need. After 2 days 3 hospitals are deemed unsafe for occupancy.
Solution: How soon are activities being undertaken to meet the medical needs of those affected?
information detailed and provided within a reasonable time-frame Based on: Same day delivery of relief material and emergency response teams mobilized with ambulances, and list of corrective actions taken at hospitals (patients and personnel evacuated/ patients transported to other hospital/ rescue operation in progress for those trapped).
Communication Networks
Disruption: How soon is the public made aware of disruptions to communication networks?
information provided within a reasonable time-frame; however very limited detail on communication issues, particularly in areas which appear to have no communication Based on: First few hours there are no reports from certain areas suggesting communication issues; however, exact issues are not provided in government reports. Same day report states that phone networks went down after earthquake, but locations not provided.
Solution: How soon are activities being undertaken to meet the communication needs of those affected?
information provided within a reasonable time-frame; however, very limited detail on government activities to meet communication needs of those areas in particular that were said to be cutoff Based on: No discussion of communication issues being worked on until 3 days after (18 Oct) in Taglibaran.
Other systems (electricity, agriculture, education, financial, business)
Disruption: How soon is the public made aware of disruptions to other important networks?
information detailed and provided within a reasonable time-frame Based on: In the first few hours reports stating one school partially collapsed, school classes are suspended, electricity down, 400 year old churches damaged, economic damage expected to be huge, damage to Chocolate Hills tourist area. Other updates follow daily.
Solution: How soon are activities being undertaken to meet the other important needs of those affected?
information detailed and provided within a reasonable time-frame Based on: After 1 day 67% of power restored to Bohol as of 2pm with other areas said to be restored within 2-3 days, evaluations being carried out of structures and emergency price and supply monitoring of market goods put in place.
Assessment of needs of people or response
When have the various areas affected been assessed?
information detailed and provided within a reasonable time-frame Based on: numerous updates from NDRRMC detailing assessment activities including who is carrying out assessments, for what purpose and where.

Establishment of prioritised needs of those affected or needs to improve the response:
When has the DM system established the critical needs of those affected or of the response?
information provided within a reasonable time-frame; however, almost no detail from government regarding its priorities for the response Based on: Reports from other organisations stating their priorities, but none from the government, although it could be assumed to be assessment and SAR from their activities.
Activation/coordination of emergency services, i.e., EOC, medical teams, SAR, police, army
How quickly has the DM system activated emergency services?
information detailed and provided within a reasonable time-frame Based on: numerous updates from NDRRMC starting 7 hrs after earthquake detailing response activities including who is carrying out what and where and regularly updated.
How often have updates regarding emergency service activities been provided?
Acquisition of funding and/or dispersal
How soon after the event is funding begin to be acquired?
information detailed and provided within a reasonable time-frame, and so far system appears to be able to fund the disaster response phase Based on: Same day 89.7 million PHP earmarked for the people affected, and the DSWD has a standby fund of 8.7 million pesos, releases 10 million PHP for purchase of relief goods and operational expenses.
How soon after the event is funding dispersed?
Establishment and identification of resources available to those affected
When is the public made aware of the various resources which have been established?
information detailed and provided within a reasonable time-frame, and resources appear to have real ability to help Based on: First day NDRRMC report issued which in itself is resource (identifies damaged roads, bridges, buildings, affected areas etc. ), contact info provided for PRC, link provided to webpage which provides guidelines for what to do before during and after an earthquake. After 1.5 days map provided identifying areas at risk to landslides with Roadways overlaid. Exact launch time unknown, but Google Crisis and Needs map identifies location of structural damages, landslides, blocked roads, damaged bridges, locations without water or electricity, shelters, and hospitals.
Establishment of a system to distribute disaster related information and updates
When does the DM system establish a system to distribute disaster related information and updates?
information detailed and provided within a reasonable time-frame, and system appears to be capable of reaching a very large audience Based on: Immediately NDRRMC issue advisory to OCD V and VI through fax, sms, and website for further dissemination. Within 4 hours first press briefing held with more to come. After 7 hrs first NDRRMC Sit Rep issued which provides complete info with updates highlighted.

Photos by Julie Jaramillo (All rights reserved)


A Chocolate Hill landslide - Deep-seated rock slump