cedar rapids community school district in the county of ... · pdf filecedar rapids community...
TRANSCRIPT

Cedar Rapids Community School District
in the County of Linn, State of Iowa
Comprehensive Annual Financial Report
for the Fiscal Year Ended June 30, 2005

Comprehensive Annual Financial Report
Cedar Rapids Community School District
Fiscal Year Ended June 30, 2005
Prepared by:
Steve Graham Executive Director of Business Services,
Board Treasurer
Barb Harms Accounting Manager
346 Second Avenue S.W. Cedar Rapids, Iowa 52404
1

2
CEDAR RAPIDS COMMUNITY SCHOOL DISTRICT
Table of Contents
Page Introductory Section 7 Letter of Transmittal 8 GFOA Certificate of Achievement 18 ASBO Certificate of Excellence 19 Leadership Team 20 Board of Directors and District Officials 21 Financial Section 23 Independent Auditor’s Report 25 Management’s Discussion and Analysis (MD&A) 27 Basic Financial Statements: Government-wide Financial Statements (GWFS) 47 Statement of Net Assets 49 Statement of Activities 51 Fund Financial Statements (FFS) 53 Governmental Funds: Balance Sheet 54 Reconciliation of the Governmental Funds Balance Sheet to the Statement of Net Assets 57 Statement of Revenues, Expenditures, and Changes in Fund Balances 58 Reconciliation of the Governmental Funds Statement of Revenues, Expenditures, and Changes in Fund Balances to the Statement of Activities 59 Proprietary Funds: Statement of Net Assets 61 Statement of Revenues, Expenses, and Changes in Fund Net Assets 62 Statement of Cash Flows 63 Fiduciary Funds: Statement of Fiduciary Assets and Liabilities 65 Notes to the Financial Statements 66
3
CEDAR RAPIDS COMMUNITY SCHOOL DISTRICT
Table of Contents Page Financial Section (continued) Required Supplementary Information: 85 Budgetary Comparison Schedules General Fund 87 Major Special Revenue Funds With Legally Adopted Budget Management Fund 88 Physical Plant and Equipment Fund 89 Capital Projects Fund 90 Nonmajor Special Revenue Funds With Legally Adopted Budget Student Activity Fund 91 Debt Service Fund 92 Notes to Required Supplementary Information – Budgetary Reporting 93 Supplemental Information 95 Combining and Individual Fund Statements and Schedules: General Fund: 97 Statement of Revenue, Expenditures, and Changes in Fund Balance 98 Nonmajor Governmental Funds: 105 Combining Balance Sheet 106 Combining Statement of Revenues, Expenditures, and Changes in Fund Balances 107 Schedule of Changes in Fiduciary Assets and Liabilities – Agency Fund 109 Capital Assets Used in the Operation of Governmental Funds: 111 Schedule of Capital Assets – By Source 112 Schedule of Changes in Capital Assets – By Function 113 Schedule of Capital Assets – By Function 114 Statistical Section 115 Government-wide information: Government-wide Expenses, by Function 116 Government-wide Revenues 117 General Fund Expenditures, by Function 118 General Fund Revenues, by Source 120 Property Tax Levies and Collections 121 Assessed and Taxable Value of Property 122 Property Tax Rates Per $1,000 Assessed Valuation - All Direct and Overlapping Governments 124 Computation of Legal Debt Margin 130
4

CEDAR RAPIDS COMMUNITY SCHOOL DISTRICT
Table of Contents
Page Statistical Section (continued) Ratio of General Obligation Bonded Debt to Taxable Value and General Obligation Bonded Debt Per Capita 131 Ratio of Annual Debt Service Expenditures for General Obligation Bonded Debt to Total General Fund Expenditures 132 Computation of Direct and Overlapping Debt 133 Demographic Statistics 135 Construction and Property Values 136 Principal Taxpayers 138 General Analysis of Facilities and Staffing 139 Enrollment by Grade 140 Staffing Levels 142 Operating Cost Per Pupil 144 Internal Controls and Compliance Section 145 Independent Auditor’s Report on Internal Control over Financial Reporting and on Compliance and Other Matters Based on Audit of Financial Statements Performed in Accordance with Government Auditing Standards 146 Independent Auditor’s Report on Compliance with Requirements Applicable to Each Major Program and Internal Control over Compliance in Accordance with OMB Circular A-133 148 Schedule of Expenditures of Federal Awards 150 Schedule of Findings and Questioned Costs 152 Summary Schedule of Prior Federal Audit Findings 155 Corrective Action Plan for Federal Audit Findings 156
5

6

Introductory Section
7

December 31, 2005 To the Board of Directors: We are delighted to submit to you the Comprehensive Annual Financial Report, (CAFR) of the Cedar Rapids Community School District, (the “District”) for the year ending June 30, 2005. This report has been prepared to conform to guidelines recommended by the Association of School Business Officials International and the Government Finance Officers Association of the United States and Canada. For fiscal year 2001-2002, Governmental entities, whose revenues exceed $100 million, were required to meet the new reporting guidelines as promulgated by the Governmental Accounting Standards Board Statement No. 34, “Basic Financial Statements and Management’s Discussion and Analysis – for State and Local Governments.” (GASB-34). Consequently, fiscal year ending June 30, 2005, marks the fourth year in which our report includes all required revisions to conform to the new standards promulgated under GASB-34.
Management Responsibility Responsibility for both the accuracy of the data and the completeness and fairness of the presentation, including all disclosures, rests with the District. To the best of our knowledge and belief, the enclosed information is fairly stated in all material respects and is presented in a manner which sets forth the financial position and results of operations of the various funds of the District in accordance with generally accepted accounting principles, (GAAP). It includes the entire District. All disclosures necessary to enable a reader to gain maximum understanding of the District’s financial activities have been included.
CAFR The 2005 Comprehensive Annual Financial Report is presented in four sections: Introductory, Financial, Statistical and Internal Controls and Compliance. 1. The Introductory Section. This section includes a transmittal letter, economic outlook of the community, the District’s accomplishments, a District Financial Profile, the District’s Leadership Team and a list of the Board of Directors and District officials. 2. The Financial Section. The School District’s financial statements and schedules are presented in accordance with the financial reporting pyramid set forth by the Governmental Accounting Standards Board. The financial section consists of the independent auditor’s report, Management’s Discussion and Analysis (MD&A), audited basic financial statements, required supplemental information, and combined and individual fund statements and schedules. The audited basic financial statements present both an overview and a broad long-term perspective of the School District as a whole in the government-wide financial statements. GAAP requires that management provide a narrative introduction, overview, and analysis to accompany the basic financial statements in the form of the MD&A. This letter of transmittal is designed to complement the MD&A and should be read in conjunction with it. The District’s MD&A can be found immediately following the report of the independent auditors.
8

3. The Statistical Section. The statistical section sets forth selected unaudited financial and demographic information, generally presented on a multi-year basis. 4. The Internal Controls and Compliance Section. The School District is required to undergo an annual single audit in conformity with the provisions of the Single Audit Act Amendments of 1996 and the U.S. Office of Management and Budget Circular A-133, Audits of State, Local Governments, and Non-Profit Organizations. This section contains all necessary schedules and auditor’s reports required for the District to comply with these regulations.
Reporting Entity This report includes all entities or organizations that are required to be included in the School District’s reporting entity. The District is not included in any other reporting entity, nor is any other entity included within this report. The basic criteria for determining whether a governmental department, agency, institution, commission, public authority, or other governmental organization should be included in a governmental unit’s reporting entity is financial accountability. Financial accountability includes the appointment of a voting majority of the organization’s governing body and either the ability of the primary government to impose its will on the organization or a financial benefit/burden relationship. In addition, an organization, which is fiscally dependent on the primary government, should be included in its reporting entity. A seven-member elected Board of Directors who serve three-year terms governs the Cedar Rapids Community School District. The Board of Directors is a policy-making and planning body whose decisions are carried out by school administrators. The District is the second largest of Iowa’s public school systems. The “head count” enrollment is approximately 17,837 students. The District operates a total of three regular high schools and one alternative high school, six middle schools and twenty-four elementary schools. The District provides a full range of educational services appropriate to students in early childhood and grades kindergarten through twelve. These services include basic, regular and enriched academic education; special education for children with special needs; vocational education; and numerous individualized programs such as specialized instruction for students at-risk and for limited-English-speaking students. In addition to the elementary, middle school and high school programs offered in the District, there are additional opportunities for achieving success. Metro High School is an alternative school for students who function better in a less-structured environment. Public preschool, called the Step Up Preschool Program, is available to approximately 128 four-five year olds based on income levels and student needs. Finally, a Gifted and Talented learning program provides identified students at all levels an enriched and differentiated curricular program. The District also provides day care services for infants through age five and extended day programs for students in several of the school buildings through a partnership with St. Luke’s Hospital. The District is supported financially by state aid, property taxes, income surtaxes, state and federal grants for special projects, and local revenue received for tuition and other services.
Economic Condition and Outlook Because of its central location, Cedar Rapids has a tradition as an economic capital for more than 600,000 Eastern Iowans living within 60 minutes of the city. Cedar Rapids takes pride in its leadership in service industries, retail sales, and other related business such as insurance and government services. Cedar Rapids is home to more than 275 different manufacturing
9

plants. It has some two-dozen Fortune 500 companies, international exports reaching record numbers for the United States, and ties with companies from around the world. These include Canada, France, Germany, Ireland, Korea, Japan, the Netherlands, Switzerland and the United Kingdom. Cedar Rapids is the manufacturing capital of Iowa and the state’s second largest city. Manufactured exports from the Cedar Rapids area are estimated at over $500 million. More than 100 countries receive an almost endless variety of products and services from businesses and industries located in Cedar Rapids. Export products include road-building, earth moving, pharmaceutical and food processing equipment, home appliances, avionics and telecommunications equipment, grains and their by-products, computer software, computer hardware and more. More than 120,000 people live in Cedar Rapids, with an estimated metropolitan population, including Linn, Benton and Jones Counties of over 247,000 residents in 2004. The 2000 Census showed this area as one of the strongest growth areas in Iowa. Cedar Rapids is a regional hub for Eastern Iowa because of its proximity to several of the country’s largest metropolitan areas and major interstate highways. Cedar Rapids enjoys direct access to cities in the Midwest like Chicago, Minneapolis, Milwaukee, Omaha, St. Louis and Kansas City. Rockwell Collins remains the largest employer in the Cedar Rapids area producing advanced communications and aviation electronics for government and commercial customers. The company is a leading supplier of commercial and military aviation electronics and communication systems. Virtually every commercial airliner worldwide flies with Collins equipment and almost 70 percent of all U. S. military airborne communications is transmitted on Collins equipment. In new business dimensions, the company is advancing the technologies of interactive in-flight entertainment, direct broadcast satellite TV and cabin management systems for commercial and business aircraft. As a leader in GPS technology, Rockwell Collins is applying its expertise to improve air traffic management and safety in increasingly crowded airways. Employing more than 2,500 scientists and engineers, Rockwell Collins has the state’s largest technical workforce. Rockwell Collins also supports the teaching of math and science in schools with a well-established K-12 education partnership program. Other companies within the electronic equipment and components industry include VDO Automotive Corporation, Intermec, MCI, Skyworks Solutions Inc, Siemans Transportation, Systems Integrated-Local Government Division, WABTEC, Crystal Group and Schnieder Electric to name a few. These companies make the Cedar Rapids area one of the largest communities per capita for electrical and software engineers. Construction activity, which includes developments in commercial, industrial and single/multiple dwelling categories, increased 15 percent from the previous year. Building permit valuation for all construction activity in the City of Cedar Rapids stood at $158,936,944 in 2004, compared to $138,226,684 in 2003. Single-family housing starts in Cedar Rapids experienced a decrease over the prior year declining from $37,635,431 in 2003, to $34,423,845 in 2004. Permits for 334 new single-family dwellings were issued in Cedar Rapids in 2004 compared to 378 permits issued the previous year. In the Cedar Rapids metropolitan area, 679 permits for single-family dwellings were issued, virtually the same number, (681) as the previous year.
10

Retail sales in Linn County reached an all time high in 2004 of $2.832 billion, up from $2.329 billion in 2003. The three largest sectors of retail sales in the Cedar Rapids metropolitan area were Utilities at $540.3 million, General Merchandise at $392.0 million and Services at $367.7 million. Since 1990 retail sales have increased by more than $1.76 billion dollars. Mean household income, (as measured in 1996 dollars) in the Cedar Rapids metropolitan area increased to $68,200 in 2004, from $67,815 in 2003. Income per capita, (also measured in 1996 dollars) shows similar trends increasing to $28,102 in 2004 from $27,818 the previous year. Linn County resident total employment declined slightly from 110,900 in 2003 to 109,800 in 2004. Unemployment increased slightly from 4.7% to 4.9% over the same time period. Steeped in the lore and history of Cedar Rapids is the early emergence of agriculture-based businesses. The sector continues to make up an important base of the economy. Quaker Food and Beverages, a division of Pepsico Inc. runs the world’s largest cereal manufacturing plant in Cedar Rapids. General Mills, HJ Heinz, Ralston Foods, Diamond V Mills, Penford Products, ADM Corn Processing and Cargill all have key positions in our agriculture-based economy. Cedar Rapids is also home to Genencor International, JRS Pharma LP, J Rettenmaier USA LP and Red Star Yeast LLC where their bioproducts plants illustrate good marriages between high technology and agribusiness. Genencor is a leading producer of industrial enzymes and other chemicals. Customers routinely use their products to make common household items such as laundry detergents and soft drinks. The insurance and financial services sectors have been a source of growth and strength in the area economy. AEGON Insurance Group and United Fire Group are giants in the insurance industry and long-time players in the local community. Toyota Financial Services, GreatAmerica Leasing and GE Capital/Vendor Financial Services are more recent additions to the community, highlighting some of the tremendous growth of the 1990’s. Cedar Rapids is also a regional leader in service industries, retail sales, and other businesses such as health care and government services. The variety of business and industry not only helps insulate the community from rocky economic times, it also virtually assures newcomers of finding a job that fits their skills and education. Economic development organizations and local governments in Linn County have teamed with colleagues to the south in Johnson County to market the region as an ideal location for companies using the highest level of technology within their given industries. The “Technology Corridor” encompasses a wide region including the Cedar Rapids and Iowa City metropolitan areas and several surrounding communities. In 2004, Forbes ranked Iowa City no. 3 and Cedar Rapids no. 32 for “Best Places for Business and Careers”. The civilian labor force within the “Technology Corridor” stood at 244,400 in 2004. District Accomplishments 2004-2005 Past efforts on behalf of our children have been legion, and we are especially grateful to our wonderful community as we look back on the 2004-05 school year. It was a year of notable academic achievement as well as stellar performances in the arts and athletics.
11

Accomplishments included: • The percentage of students proficient in reading and mathematics exceeded the state
targets for No Child Left Behind at all required grade levels (4, 8, 11). • Achieved annual improvement goals of one year or more of growth in reading,
mathematics and science. • The percentage of graduates completing core coursework in Language Arts, (4 yrs.)
Social Studies, (3 yrs.) Mathematics, (3 yrs.) and Science, (3 yrs.) increased to 66.99%. • Average daily attendance in grades K-8 was 95.7%. • Eighty percent of Cedar Rapids students who took the ACT in 2004-05 scored 20 or
higher compared to 70% in Iowa and 59% in the nation. • The percentage of seniors intending to pursue post-secondary training increased from
85.7% to 87.3%. • District’s e-portfolio teacher evaluation tool continues to remain a model for others. • Maintained a high level of family and community involvement. • Received a $500,000 Iowa Demonstration Construction Grant to help fund the
installation of a new geo-thermal heating ventilation and cooling (HVAC) system at Wilson Middle/Elementary School.
• Began installation of new geo-thermal HVAC system at Truman Elementary School. • Completed bond-funded school repairs and construction within budget.
Improved Learning Environments The District is in the process of completing the fifth and final year of its $52.7 million facilities plan, funded by voter-approved bonds plus federal and state grants. In addition, the District invests in its facilities through the use of Physical Plant and Equipment Levy (PPEL) resources. The repairs and upgrades continued to improve the learning and teaching environment in our schools. Projects started or completed during the year included:
• HVAC system and water pipe replacement at McKinley Middle School. • HVAC system and water pipe replacement at Wilson School. • Continued removal of asbestos materials from all district buildings. • Electrical upgrades at Arthur and Taylor Elementary Schools and Washington High
School. • HVAC improvements at Harding Middle School.
Accomplishments for Students with Disabilities
• Students receiving special education services are achievers. 75% demonstrated substantial progress toward the goals in their Individual Education Plans.
• Students with disabilities are striving to reach their full potential. 86% made substantial progress toward greater independence.
• Parents are active partners in the educational process for their students. 95% of parents participated in annual Individualized Education Plan meetings.
• Intervention begins with young children. Last year, 168 students ages 3-5, with disabilities, were served in Early Childhood Special Education programs.
• Students are achieving literacy. Students in special reading programs, on average, gained one year of growth.
• Students with disabilities are a part of our community. More than 300 high school students worked at job placement and transition sites around the city.
Improved Graduation Rate
• The Class of 2004 graduation rate was 92.41%, an increase of 3.42% over 2003.
12

Updated Teaching Tools Last school year, $6.5 million was invested in new curriculum, teaching tools, and technology. These funds come from the Instructional Support Levy and break down as follows:
• $1.2 million for kindergarten reading assistance. • $1.5 million for technology software, hardware, support, and staff development. • $977,000 for instructional materials (science equipment, band instruments, etc.). • $1.5 million for curriculum needs (textbooks, learning materials, staff development, etc.). • $1.3 million for counselors and related support.
Business Partnerships Every school in the District has one official business partner, and some have as many as five. A few examples of recent business partnerships include:
• Mount Mercy College offers unique resources to the elementary staff and students of Arthur/Erskine Elementary Schools in exchange for classroom experiences for teacher education students and student teachers to build their professional skills.
• Timberland Corporation designed and funded a butterfly garden and outdoor learning center at Polk Elementary.
• Mercy Medical Center provided medical career tours for students at McKinley Middle School.
• GE Capital funded the purchase of Orff xylophones for Van Buren Elementary, helping to inspire imagination and creativity in students.
• Cedar River Paper Company provided many opportunities for Jefferson High School students, including sponsoring a team of five students who participated in the “Student Teams Training” acquiring real world problem solving skills.
• Rockwell Collins mentors and Gibson Elementary students took first place at the state competition in Ames and represented Iowa at the national Lego League Trials in Atlanta, Georgia.
Budgetary Highlights
Budgetary Controls The Board of Directors annually adopts a budget on a basis consistent with generally accepted accounting principles. In accordance with state law, annual budgets are adopted for the General, Management, Student Activity, Physical Plant and Equipment, Capital Projects, Debt Service and School Nutrition Funds as a whole. Appropriations lapse at fiscal year-end and then are reappropriated for the next year, if necessary. The District also maintains an encumbrance accounting system as one technique of accomplishing budgetary control. By April 15 of each year, the budget must be adopted by an affirmative vote of a majority of the Board of Directors for the fiscal year beginning July 1 through June 30, which immediately follows. Once adopted, the budget can be amended through the same process, with all budget amendments to be completed by May 31 of the budget year affected. Expenditures during a school year may not exceed the lesser of the certified budget plus any allowable amendments, or the authorized budget, which is the sum of the District cost for that year plus the actual miscellaneous revenue received for that year plus the actual unspent balance from the preceding year.
13

Formal and legal budgetary control for the certified budget is based upon four major classes of expenditures known as functional areas, not by fund or fund type. Combined budgeted expenditures from all District funds, Governmental and Proprietary, are “certified” based upon four functional categories. These four functional areas are instruction, support services, non-instructional programs and other expenditures. It is the actual expenditures in each of these categories that are compared at year-end to the “certified” spending levels to determine whether or not the District has exceeded its certified budget in any one of these respective categories. During the year, expenditures in each of these four functional categories did not exceed the certified budget. Additional information regarding budgetary legal compliance may be found in the Required Supplementary Information section following the Notes to the Financial Statements. General Fund Budgetary Highlights Of all Governmental Funds, the General Fund is by far the largest, comprising over three quarters of all Governmental Fund expenses in the fiscal year. Due to the sheer size of the General Fund it is important to point out a few important highlights that occurred during the 2004-2005 fiscal year.
• State allowable growth for public schools in fiscal year 2004-2005 was 2%. Though the headcount enrollment increased slightly from the prior year, the “budget enrollment” declined by approximately 205 students or 1.2% of enrollment. The budget enrollment drives critical funding from year to year. As a result, the District relied on the State budget guarantee program that ensured the District would receive revenue growth or “new money” of 1% over the prior year.
• Faced with the prospect of growing wages and benefits and with little new money to
support such growth, the District was forced to make approximately $2.5 million in budget adjustments for FY05 in order to balance the budget. Central Administration was reduced $260,000 consisting of 2 cabinet level administrative positions and a confidential secretary position. Aligning teaching staff with actual enrollments at all grade levels provided for additional budget reductions of approximately $500,000. Additional revenues of $1.78 million were made possible with a one-year increase of the Instructional Support Levy from $4.95 million to $6.73 million in funding.
• The District continued to replenish cash reserves by holding steady the cash reserve
levy at the relatively high level of $7.92 million in FY05, down slightly from $8.00 million in FY04.
• The impact of maintaining a strong cash reserve levy, as well as targeted budget
reductions over the past four consecutive fiscal years is reflected in the ending fund balance of the General Fund, increasing from $4.9 million, or 3.7% of expenditures at the end of FY03, to $10.1 million, or 7.6% of expenditures, at the end of FY04, and now for FY05, an ending fund balance of $16.8 million or 12.3% of expenditures.
• General Fund expenditures, excluding other financing sources, totaled $136.5 million for
the fiscal year compared with $131.9 million in the previous year, representing an increase of $4.6 million in expenditures, or 3.5% budget growth.
14

Internal Control Management of the District is responsible for establishing and maintaining an internal control structure designed to ensure that the assets of the District are protected from loss, theft or misuse and to ensure that adequate accounting data are compiled to allow for the preparation of financial statements in conformity with generally accepted accounting principles. The internal control structure is designed to provide reasonable, but not absolute, assurance that these objectives are met. The concept of reasonable assurance recognizes that: (1) the cost of a control should not exceed the benefits likely to be derived; and (2) the evaluation of costs and benefits requires estimates and judgments by management. All internal accounting controls adequately safeguard assets and provide reasonable assurance of proper recording of financial transactions. As a recipient of federal, state and local financial assistance, the District is also responsible for ensuring that adequate internal control is in place to ensure compliance with applicable laws and regulations related to those programs. As a part of the District’s single audit, described earlier, tests are made to determine the adequacy of internal control, including that portion related to federal awards programs, as well as to determine that the District has complied with applicable laws and regulations.
Enterprise Operation Revenues in the School Nutrition Fund totaled $6,569,844, representing an increase of $479,990 over the fiscal year 2004 amount. Operating expenses and transfers to other funds for the School Nutrition Fund totaled $6,138,486, representing an increase of $255,317, from the fiscal year 2004 amount. Retained earnings were $1,461,038 at June 30, 2005 compared to $1,029,680 for the prior fiscal period, resulting in an increase of $431,358 for the year. The fund’s finances were solid over the year, due to an increase of approximately 5% in meal ticket prices that was implemented at the beginning of the 2003-2004 school year. Another ticket price increase of approximately 5% was approved for the 2004-2005 school year, which is also reflected in the improved level of reserves in the fund for the fiscal year. A major achievement in the Food and Nutrition Department was the installation of a point of sale meal accounting system, which was fully operational during the 2002-2003 school year. Payment for this system will be over a five-year period, resulting in additional operating costs to the program. Continued vigilance of the School Nutrition program finances will be necessary over the course of the next several years as the department implements the replacement of aging kitchen equipment at many locations in our District.
Debt Administration On December 12, 2000, the District successfully passed a $46 million bond referendum for improvement of District facilities. In January of 2001, the District sold $10 million in general obligation bonds for the purpose of financing school building renovations and new construction. In December 2001, the District sold the remaining $36 million in general obligation bonds to take advantage of historically low interest rates. As of June 30, 2005, the District has total general obligation bonded indebtedness of $41.225 million.
15

Cash Management The District, in its effort to be a good manager of public funds, competitively bids its banking services. To maximize investment return while complying with Iowa Code Chapters 12B and 12C, related to allowable investments of the District’s public funds, the District invested in savings accounts, bank certificates of deposit and short-term commercial paper during the fiscal year ended June 30, 2005. Interest revenue of $919,888 was earned on all investments for the year ended June 30, 2005. This represents an increase of $414,137 or 82% over fiscal year 2004 earnings. Higher investment revenues experienced by the District in all funds except the Capital Projects Fund are attributable to the Federal Reserve’s monetary policy of raising the federal funds interest rates throughout the course of the 2004-2005 fiscal year. The Capital Projects Fund had a decrease in earnings, ($134,609) because of the lower amount of principal invested as the District’s capital improvement program nears its conclusion.
Risk Management The District currently covers property, liability and worker’s compensation losses with traditional insurance coverage through the Iowa Association of School Board’s, (IASB) group plan carried by Employer’s Mutual Insurance Company. The IASB insurance plan continues to be used by all but 7 of the K-12 public school districts and Area Education Agencies in the state of Iowa and by 8 out of the state’s 15 community colleges.
Independent Audit The Code of the State of Iowa requires an annual audit of the District to be performed by an accounting firm selected in a competitively bid process. The annual audit meets the requirements of the Code of Iowa, generally accepted auditing standards and the requirements of the 1996 Amendment to the Single Audit Act, and related OMB Circular A-133. The auditor’s report on the basic financial statements and combining and individual fund statements is included in the financial section of this report. The auditor’s reports related specifically to the single audit are included in a separate section for internal controls and compliance.
Certificate of Excellence in Financial Reporting The Government Finance Officers Association of the United States and Canada, (GFOA) awards a Certificate of Achievement for Excellence in Financial Reporting and the Association of School Business Officials International, (ASBO) awards a Certificate of Excellence in Financial Reporting. The Cedar Rapids Community School District received both of these Certificates for its comprehensive annual financial report for the fiscal year ending June 30, 2004. This was the tenth consecutive year that the District has achieved these prestigious awards. Each Certificate is a prestigious national award, recognizing conformance with the highest standards for preparation of government financial reports. In order to be eligible to receive the Certificates, a governmental unit must publish an easily readable and efficiently organized Comprehensive Annual Financial Report, (CAFR) whose contents conform to program standards. Such CAFR must satisfy both generally accepted accounting principals and applicable legal requirements. These Certificates are valid for a period of one year only. We believe that our current CAFR continues to meet the requirements for both awards and therefore, we are submitting it to GFOA and ASBO to determine its eligibility for each Certificate.
16
Acknowledgments The publication of this report is a major step toward the commitment to professionalism in financial reporting and significantly increases the accountability of the District to the taxpayers. This report would not have been possible without the help of several people. We would like to express our appreciation to all District, and County employees who assisted in the preparation of this report. A special thank you is extended to Barb Harms the Accounting Manager, for assistance in planning, designing, preparing and reviewing this financial report. Finally, sincere appreciation is extended to the Board of Directors, where the commitment to excellence begins. It is with great pride that this year’s Comprehensive Annual Financial Report is submitted to the Board of Directors. Steve Graham Dr. David Markward Executive Director of Business Superintendent of Schools Services, Board Treasurer
17

18

19

20
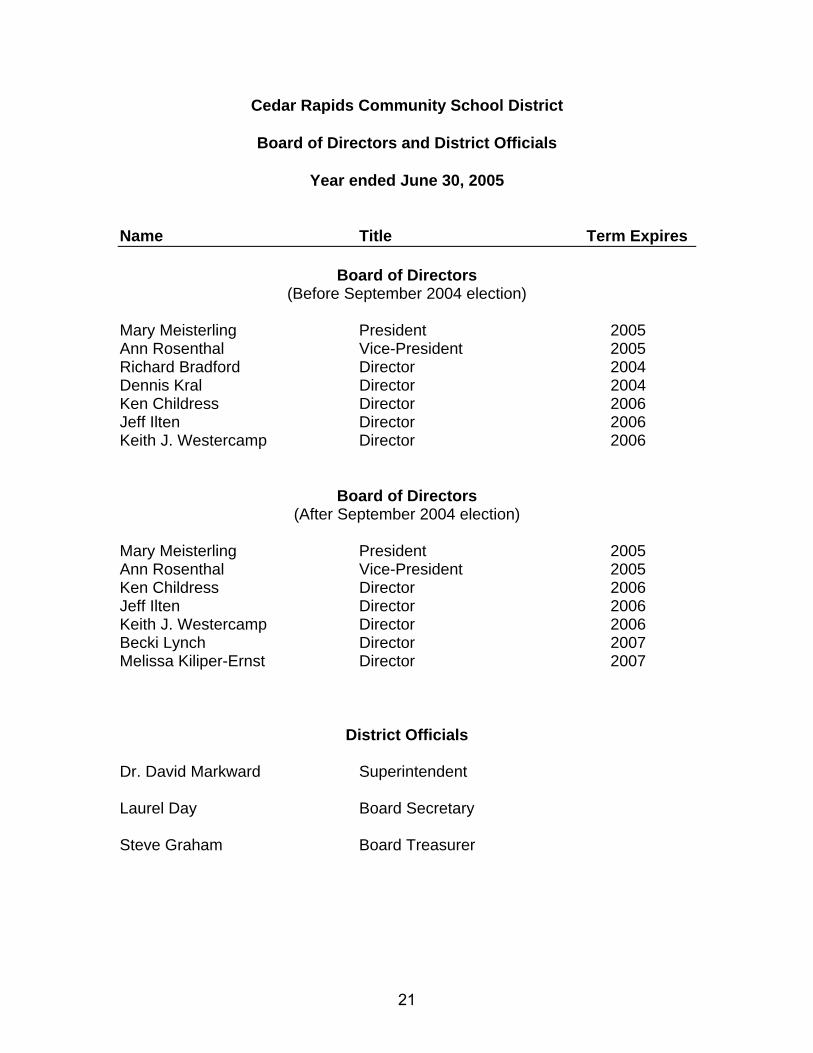
Cedar Rapids Community School District
Board of Directors and District Officials
Year ended June 30, 2005
Name Title Term Expires
Board of Directors (Before September 2004 election)
Mary Meisterling President 2005 Ann Rosenthal Vice-President 2005 Richard Bradford Director 2004 Dennis Kral Director 2004 Ken Childress Director 2006 Jeff Ilten Director 2006 Keith J. Westercamp Director 2006
Board of Directors (After September 2004 election)
Mary Meisterling President 2005 Ann Rosenthal Vice-President 2005 Ken Childress Director 2006 Jeff Ilten Director 2006 Keith J. Westercamp Director 2006 Becki Lynch Director 2007 Melissa Kiliper-Ernst Director 2007
District Officials
Dr. David Markward Superintendent Laurel Day Board Secretary Steve Graham Board Treasurer
21

22

Financial Section
23

24

25

26
Management’s Discussion and Analysis
(MD&A)
27

Management Discussion and Analysis This section of the Cedar Rapids Community School District’s Comprehensive Annual Financial Report presents its “discussion and analysis” of the District’s financial performance during the fiscal year ending June 30, 2005. Please read it in conjunction with the transmittal letter at the front of this report and the District’s financial statements, which immediately follow this section.
Financial Highlights
• Faced with the prospect of growing wages and benefits and with little new money to support such growth, the District was forced to make approximately $2.5 million in budget adjustments for FY05 in order to balance the budget. Central Administration was reduced $260,000 consisting of 2 cabinet level administrative positions and a confidential secretary position. Aligning teaching staff with actual enrollments at all grade levels provided for additional budget reductions of approximately $500,000. Additional revenues of $1.78 million were made possible with an increase in the Instructional Support Levy from $4.95 million to $6.73 million in funding.
• The impact of maintaining a strong cash reserve levy, as well as targeted budget
reductions over the past four consecutive fiscal years is reflected in the ending fund balance of the General Fund, increasing from $4.9 million, or 3.7% of expenditures at the end of FY03, to $10.1 million, or 7.6% of expenditures, at the end of FY04, and now for FY05, an ending fund balance of $16.8 million or 12.3% of expenditures.
• General Fund investment revenues have rebounded in fiscal year 2005, which is
reflective of an increase in interest rates during the period as well as an increase in the fund’s cash reserves. Interest revenues totaled $535,146 compared to $122,948 for fiscal year 2004.
• The District’s $52.7 million plan of facilities construction and improvement progressed
through its fifth fiscal year. Capital expenses over the past five fiscal years now total over $51.78 million. This program was made possible by overwhelming voter approval of a $46 million bond issue on December 12, 2000. Federal and State grants totaling $4.75 million have helped to fully fund all capital projects.
Some of the final capital projects completed or in progress during fiscal year 2005 include:
• Heating, ventilation, air conditioning, and water pipe replacement at McKinley Middle School.
• Heating, ventilation, air conditioning, and water pipe replacement at Wilson School.
• All projects are estimated to be completed by the end of fiscal year 2005-2006 with an
estimated ending balance in the Capital Projects fund of $1 million.
Overview of the Financial Statements • This annual report consists of three parts: management’s discussion and analysis (this
section), the basic financial statements, and required supplementary information. The
28

basic financial statements include two kinds of statements that present different views of the District:
• The first two statements are Government-wide financial statements that provide
both short-term and long-term information about the District’s overall financial status. • The remaining statements are fund financial statements that focus on individual
parts of the District, reporting the District’s operations in more detail than the Government-wide statements.
• The governmental funds statements tell how basic services such as regular and special education were financed in the short term as well as what remains for future spending.
• Proprietary funds statements offer short and long-term financial information about the activities the District operates like businesses, such as food services.
• Fiduciary funds statements provide information about the financial relationships in which the District acts solely as a trustee or agent for the benefit of others.
The financial statements also include notes that explain some of the information in the statements and provide more detailed data. The statements are followed by a section of required supplementary information that further explains and supports the financial statements with a comparison of the District’s budget for the year. Figure A-1 shows how the various parts of this annual report are arranged and related to one another. Figure A-2 summarizes the major features of the District’s financial statements, including the portion of the District’s activities they cover and the types of information they contain. The remainder of this overview section of management’s discussion and analysis highlights the structure and contents of each of the statements.
Management’s Discussion and
Analysis
Basic Financial Statements
Required Supplementary
Information
Government-wide Financial
Statements
Fund Financial Statements
Notes to the Financial
Statements
Summary Detail
Figure A-1
Cedar Rapids Community School District Annual Financial Report
29

Figure A-2: Major Features of the District Wide and Fund Financial Statements Fund Financial Statements District-wide
Statements Governmental Funds
Proprietary Funds Fiduciary Funds
Scope Entire district (except fiduciary funds)
The activities of the district that are not proprietary or fiduciary, such as special education and building maintenance
Activities the district operates similar to private businesses: food services is included here
Instances in which the district administers resources on behalf of someone else, such as scholarship programs and student activities monies
Required financial statements
• Statement of net assets
• Statement of activities
• Balance sheet • Statement of
revenues, expenditures, and changes in fund balances
• Statement of net assets
• Statement of revenues expenses and changes in fund net assets
• Statement of cash flows
• Statement of fiduciary net assets
• Statement of changes in fiduciary net assets
Accounting Basis and measurement focus
Accural accounting and economic resources focus
Modified accrual accounting and current financial focus
Accrual accounting and economic resources focus
Accrual accounting and economic resources focus
Type of asset/liability information
All assets and liabilities, both financial and capital, short-term and long-term
Generally assets expected to be used up and liabilities that come due during the year or soon thereafter; no capital assets or long-term liabilities included
All assets and liabilities, both financial and capital, and short-term and long-term
All assets and liabilities, both short-term and long-term; funds do not currently contain capital assets, although they can
Type of inflow/outflow information
All revenues and expenses during year, regardless of when cash is received or paid
Revenues for which cash is received during or soon after the end of the year; expenditures when goods or services have been received and the related liability is due and payable
All revenues and expenses during the year, regardless of when cash is received or paid
All additions and deductions during the year, regardless of when cash is received or paid
30

Government-Wide Financial Statements The Government-wide statements report information about the District as a whole using accounting methods similar to those used by private sector companies. The statement of net assets includes all of the District’s assets and liabilities. All of the current year’s revenues and expenses are accounted for in the statement of activities regardless of when cash is received or paid. The two Government-wide statements report the District’s net assets and how they have changed. Net assets – the difference between the District’s assets and liabilities – is one way to measure the District’s financial health or position.
• Over time, increases or decreases in the District’s net assets are an indicator of whether its financial position is improving or deteriorating, respectively.
• To assess the District’s overall health, you need to consider additional non-financial factors such as changes in the District’s property tax base and the condition of school buildings and other facilities.
In the Government-wide financial statements, the District’s activities are divided into two categories:
• Governmental activities: Most of the District’s basic services are included here, such as regular and special education, transportation and administration. Property taxes and state aid finance most of these activities.
• Business-type activities: The District charges fees to help it cover the costs of certain services it provides. The District’s food service program would be included here.
Fund Financial Statements The fund financial statements provide more detailed information about the District’s funds, focusing on its most significant or “major” funds – not the District as a whole. Funds are accounting devices the District uses to keep track of specific sources of funding and spending on particular programs.
• Some funds are required by state law and by bond covenants. • The District establishes other funds to control and manage money for particular
purposes, (such as repaying its long-term debts) or to show that it is properly using certain revenues, (such as federal grants).
The District has three kinds of funds:
• Governmental funds: Most of the District’s basic services are included in governmental funds, which generally focus on (1) how cash and other financial assets that can readily be converted to cash flow in and out and (2) the balances left at year-end that are available for spending. Consequently, the governmental funds statements provide a detailed short-term view that helps the reader determine whether there are more or fewer financial resources that can be spent in the near future to finance the District’s programs. Because this information does not encompass the additional long-term focus of the Government-wide statements, additional information following the governmental funds statements explains the relationship (or differences) between them.
• Proprietary funds: Services for which the District charges a fee are generally reported in
proprietary funds. Proprietary funds are reported in the same way as the Government-
31
wide statements. The District’s enterprise funds (one type of proprietary fund) are the same as its business-type activities but provide more detail and additional information, such as cash flows. Internal service funds, (the other kind of proprietary fund) are optional and available to report activities that provide supplies and services for other District programs and activities. At this time the District chooses not to use any internal service funds.
• Fiduciary funds: The District is the trustee, or fiduciary, for assets that belong to others,
such as a scholarship fund. The District accounts for outside donations to specific District schools for specific purposes in this fund. The District is responsible for ensuring that the assets reported in these funds are used only for their intended purposes and by those to whom the assets belong. The District excludes these activities from the Government-wide financial statements because it cannot use these assets to finance its operations.
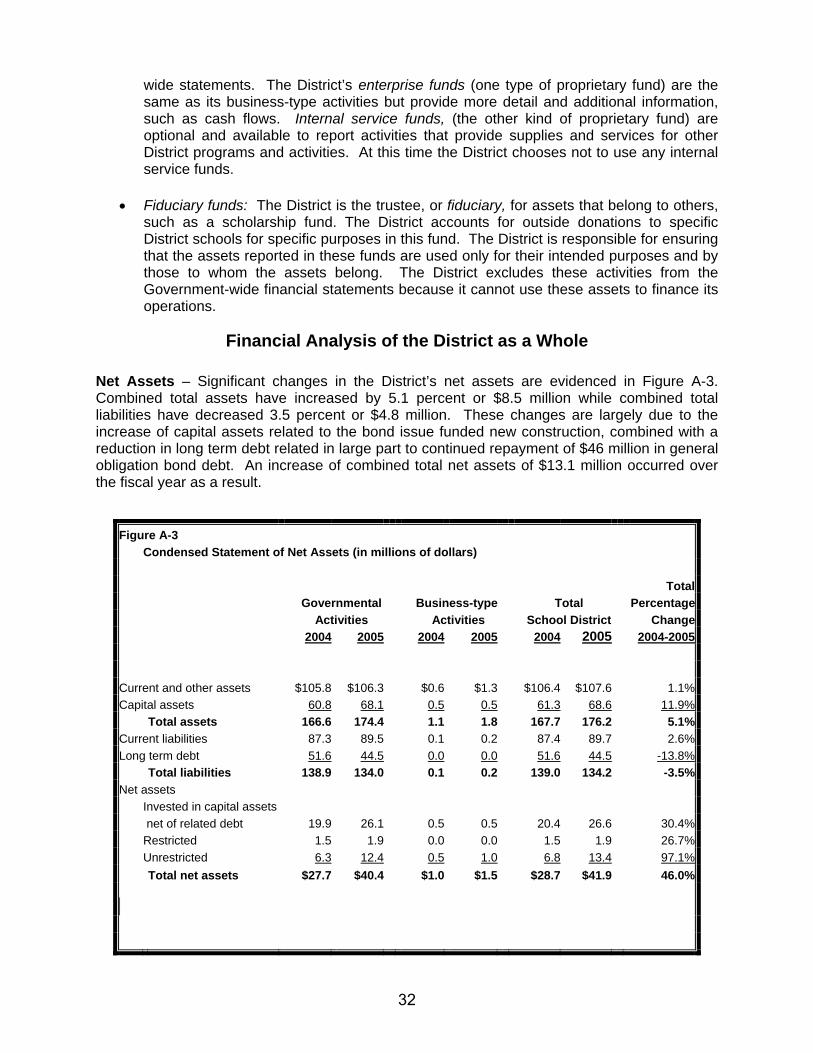
Financial Analysis of the District as a Whole Net Assets – Significant changes in the District’s net assets are evidenced in Figure A-3. Combined total assets have increased by 5.1 percent or $8.5 million while combined total liabilities have decreased 3.5 percent or $4.8 million. These changes are largely due to the increase of capital assets related to the bond issue funded new construction, combined with a reduction in long term debt related in large part to continued repayment of $46 million in general obligation bond debt. An increase of combined total net assets of $13.1 million occurred over the fiscal year as a result.
Figure A-3 Condensed Statement of Net Assets (in millions of dollars) Total Governmental Business-type Total Percentage Activities Activities School District Change 2004 2005 2004 2005 2004 2005 2004-2005 Current and other assets $105.8 $106.3 $0.6 $1.3 $106.4 $107.6 1.1%Capital assets 60.8 68.1 0.5 0.5 61.3 68.6 11.9% Total assets 166.6 174.4 1.1 1.8 167.7 176.2 5.1%Current liabilities 87.3 89.5 0.1 0.2 87.4 89.7 2.6%Long term debt 51.6 44.5 0.0 0.0 51.6 44.5 -13.8% Total liabilities 138.9 134.0 0.1 0.2 139.0 134.2 -3.5%Net assets Invested in capital assets net of related debt 19.9 26.1 0.5 0.5 20.4 26.6 30.4% Restricted 1.5 1.9 0.0 0.0 1.5 1.9 26.7% Unrestricted 6.3 12.4 0.5 1.0 6.8 13.4 97.1% Total net assets $27.7 $40.4 $1.0 $1.5 $28.7 $41.9 46.0%
32
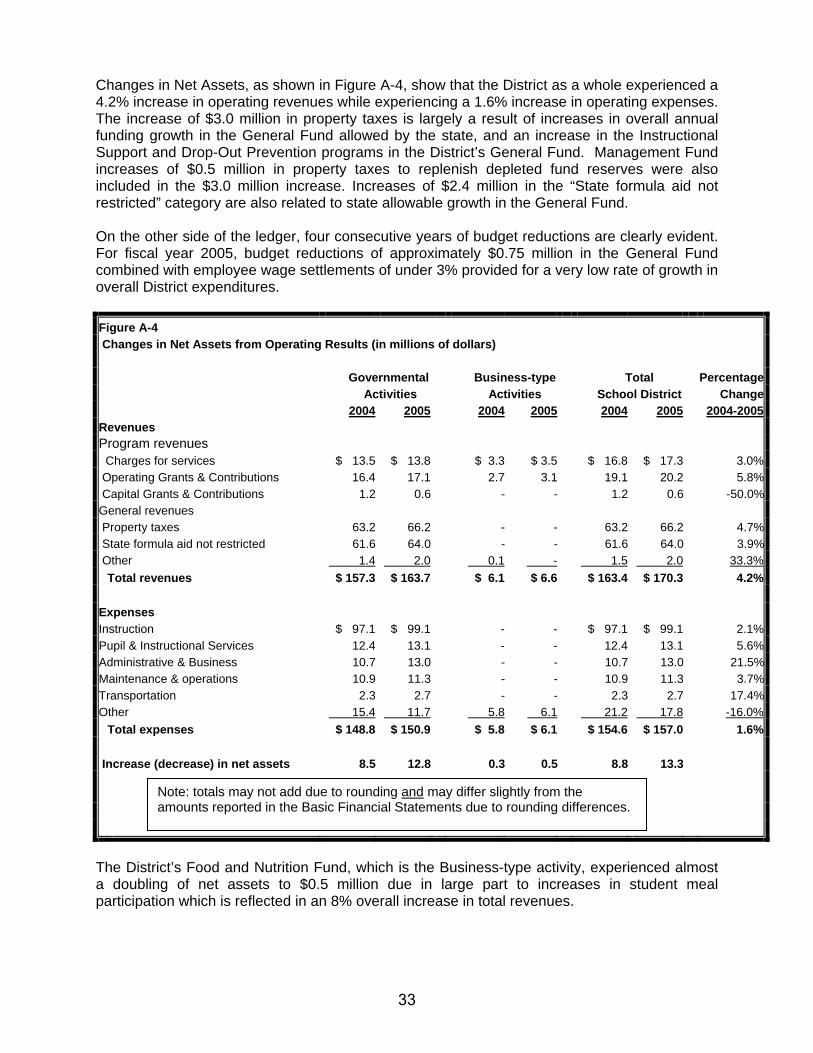
Changes in Net Assets, as shown in Figure A-4, show that the District as a whole experienced a 4.2% increase in operating revenues while experiencing a 1.6% increase in operating expenses. The increase of $3.0 million in property taxes is largely a result of increases in overall annual funding growth in the General Fund allowed by the state, and an increase in the Instructional Support and Drop-Out Prevention programs in the District’s General Fund. Management Fund increases of $0.5 million in property taxes to replenish depleted fund reserves were also included in the $3.0 million increase. Increases of $2.4 million in the “State formula aid not restricted” category are also related to state allowable growth in the General Fund. On the other side of the ledger, four consecutive years of budget reductions are clearly evident. For fiscal year 2005, budget reductions of approximately $0.75 million in the General Fund combined with employee wage settlements of under 3% provided for a very low rate of growth in overall District expenditures. Figure A-4 Changes in Net Assets from Operating Results (in millions of dollars) Governmental Business-type Total Percentage Activities Activities School District Change 2004 2005 2004 2005 2004 2005 2004-2005Revenues Program revenues Charges for services $ 13.5 $ 13.8 $ 3.3 $ 3.5 $ 16.8 $ 17.3 3.0% Operating Grants & Contributions 16.4 17.1 2.7 3.1 19.1 20.2 5.8% Capital Grants & Contributions 1.2 0.6 - - 1.2 0.6 -50.0%General revenues Property taxes 63.2 66.2 - - 63.2 66.2 4.7% State formula aid not restricted 61.6 64.0 - - 61.6 64.0 3.9% Other 1.4 2.0 0.1 - 1.5 2.0 33.3% Total revenues $ 157.3 $ 163.7 $ 6.1 $ 6.6 $ 163.4 $ 170.3 4.2% Expenses Instruction $ 97.1 $ 99.1 - - $ 97.1 $ 99.1 2.1%Pupil & Instructional Services 12.4 13.1 - - 12.4 13.1 5.6%Administrative & Business 10.7 13.0 - - 10.7 13.0 21.5%Maintenance & operations 10.9 11.3 - - 10.9 11.3 3.7%Transportation 2.3 2.7 - - 2.3 2.7 17.4%Other 15.4 11.7 5.8 6.1 21.2 17.8 -16.0% Total expenses $ 148.8 $ 150.9 $ 5.8 $ 6.1 $ 154.6 $ 157.0 1.6% Increase (decrease) in net assets 8.5 12.8 0.3 0.5 8.8 13.3
The District’s Food and Nutrition Fund, which is the Business-type activity, experienced almost a doubling of net assets to $0.5 million due in large part to increases in student meal participation which is reflected in an 8% overall increase in total revenues.
Note: totals may not add due to rounding and may differ slightly from the amounts reported in the Basic Financial Statements due to rounding differences.
33

Figure A-5, shows the sources of total District revenues. Property Taxes, the largest revenue source, comprise 39% of District revenues while State Foundation Aid holds a nearly equal share at 38%. Grant revenues from Federal, State and local sources, playing an increasingly important role in funding District programs, represent 12% of District revenues. Charges for services, largely tuition charges, comprise 10% of District revenues. Total District expenses are reflected in Figure A-6. As can be seen, the vast majority of District resources (71%) are devoted to direct Instruction and Pupil & Instructional Services. Bond supported capital projects totaling $2.0 million are reported in the “Other” category. Fiscal year 2005 marks the fifth complete year of the District’s five year $52.7 million capital improvements program, supported primarily by the sale of $46 million in general obligation bonds. The “Other” category also includes $5.2 million in state mandated “flow through” funding support to Grant Wood Area Education Agency. Grant Wood AEA is an intermediary educational unit providing instructional support to 33 public school Districts and 35 nonpublic schools in eastern Iowa. Governmental Activities The strength of the local economy was evident as the unemployment rate decreased slightly from 4.9% to 4.7% over the past year in the metro area. Additionally, the District continued to experience an increase in the overall property tax base. As can be seen in Figure A-7, taxable valuation increased slightly from $3.97 billion to $3.99 for FY2005. Though the current year’s
Figure A-6
Expenses for Fiscal Year 2005
$17.9$2.7
$11.3
$13.0
$13.1 $99.1
Instruction: $99.1
P upil & Instructional Services: $13.1
Administrative & B usiness: $13.0
Maintenance & Operations: $11.3
Transportation: $2.7
Other: $17.9
Total Expenditures: $157,109,397
Figures shown in $ millions.
Figure A-5
Sources of Revenues Fiscal Year 2005
$17.2
$20.7
$66.2
$64.0
$2.0
Charges for Services: $17.2
Grants and Contributions: $20.7
Property Taxes: $66.2
State Aid Not Restricted: $64.0
Other: $2.0
Total Revenues: $170,199,376
Figures shown in $ millions.
34

increase was slight, overall property tax valuation trends show that over the past nine years, average growth has been approximately 3 percent. Despite the historical growth in our property tax base, which tends to mitigate increases in the tax levy rate, the overall District tax rate trends over recent years, as depicted in Figure A-8, have shown a gradual increase overall with a significant increase of over 18% between FY2002 and FY2003. The reasons for this significant increase are three fold: First, the District increased its cash reserve levy in order to replace a loss of $2.75 million due to an across the board cut in state foundation aid, and to build cash reserves that had been depleted in recent years. Second, the District began full payment on general obligation bond debt as authorized by voters following a December 12, 2000, voter approved $46 million bond issue to fund District infrastructure improvements. Finally, the Board of Education approved an increase in the property tax funded early retirement program to encourage District staff to retire and allow attrition to reduce the number of employees on the payroll in order to reduce the General Fund budget. The levy rate in FY05 increased from $15.37 to $15.74 per $1,000 of taxable valuation. This was due in large part to the District’s reliance on the property tax funded, state 101% “budget guarantee” triggered by a 1.2% decline in “budget enrollment,” an increase in health insurance costs attributed to our retirees and paid for with local property tax dollars and an increase in the
District Levy Rate TrendsFigure A-8
$12.83 $12.63 $12.49 $11.88 $12.41 $12.95
$15.36 $15.37 $15.74
$0.00$2.00$4.00$6.00$8.00
$10.00$12.00$14.00$16.00$18.00
FY 97 FY 98 FY 99 FY 00 FY 01 FY 02 FY 03 FY 04 FY 05Dol
lars
per
$1,
000
in T
axab
le V
alua
tion
Property Tax Valuation Trends
Figure A-7
$0.00$0.50$1.00$1.50$2.00$2.50$3.00$3.50$4.00$4.50
($B
illio
ns)
Values* $3.22 $3.31 $3.46 $3.60 $3.56 $3.67 $3.86 $3.97 $3.99
FY 97 FY 98 FY 99 FY 00 FY 01 FY 02 FY 03 FY 04 FY 05
Average Annual Growth Rate Past Ten Years: 3%•Excludes TIF valuations
35

Instructional Support Levy to a funding level of 9.5%, whose increased revenues largely were supported by local property tax revenues. Figure A-9 presents the cost of six major District activities: Instruction, Pupil and Instructional Services, Administrative and Business, Maintenance and Operations, Transportation and Other. The table shows each activity’s net cost, (total costs, less fees generated by the activities and intergovernmental aid provided for specific programs). The net cost shows the financial burden placed on the District’s taxpayers by each of these functions. Several highlights include the following:
• The cost of all governmental activities this year was $151.0 million. • Some of the cost was financed by the users of the District’s programs, ($13.8 million). • The federal and state governments as well as local sources, subsidized certain
programs with grants and contributions, ($17.7 million). • Most of the District’s costs ($119.6 million), however, were financed by District and state
taxpayers. • This portion of governmental activities was financed with $66.2 million in property taxes,
$64.0 million in unrestricted state aid based on the statewide education aid formula and investment earnings.
• Property taxes and state education aid exceeded net governmental costs by $10.5 million, accounting for the majority of the $12.7 million increase in Government-wide net assets from Governmental Activities.
Business-Type Activities Revenues of the District’s business-type activities rose approximately 8% over the previous year from $6.1 million to $6.7 million. Charges for services totaled $3.5 million, with operating grants and contributions (federal and state subsidies) totaling $3.1 million. Expenses for the year increased 5% over the previous year from $5.8 million to $6.1 million. (Refer to Figure A-4.) At the present time, the Food and Nutrition Fund is the only fund categorized as a Business-Type Activity.
Figure A-9 Net Cost of Governmental Activities (in millions of dollars) Total Cost Percentage Net Cost Percentage of Services Change of Services Change 2004 2005 2004-2005 2004 2005 2004-2005 Instruction $ 97.1 $ 99.1 2.1% $ 75.6 $ 77.1 2.0%Pupil & Instructional Services 12.4 13.1 5.6% 12.1 12.5 3.3%Administrative & Business 10.7 13.0 21.5% 10.7 12.9 20.6%Maintenance & operations 10.9 11.3 3.7% 10.9 11.3 3.7%Transportation 2.3 2.7 17.4% 2.2 2.6 18.2%Other 15.4 11.8 -23.4% 6.1 3.3 -45.9% Total $ 148.8 $ 151.0 1.5% $ 117.6 $ 119.7 1.8%
Note: totals may not add due to rounding and may differ slightly from the amounts reported in the Basic Financial Statements due to rounding
36

Other highlights of the Food and Nutrition Fund include: • Students qualifying for free and reduced meals remained steady at approximately 34.5%
of District students. • A five-year equipment replacement schedule was developed. • Designated $145,000 specifically for equipment replacement. • Implemented an across the board $0.10 ticket price increase. • Made nutrient analysis for K-5 menus available on the District's Intranet as a service for
school personnel. • Provided menus more aligned to student’s diverse dietary preferences. • Continued growth in student participation:
o School Year 01-02 = 10,537 o School Year 02-03 = 10,932 o School Year 03-04 = 11,051 o School Year 04-05 = 11,400
Financial Analysis of The District’s Funds
A summary financial analysis of each individual District Fund follows: Business-Type Fund Highlights
• The Food and Nutrition Fund as previously stated, is the District’s only fund categorized as a Business-Type Fund. Retained earnings in the Food and Nutrition Fund increased a solid 41% from $1.03 million to $1.46 million over the past fiscal year. This increase reflects sound business practices in aligning meal pricing to reflect all costs of operations. Continued vigilance over the renewal of the program’s aging equipment continues to be an important focus.
• Currently, the program has equipment valued at $2.62 million with total accumulated
depreciation of $2.16 million. With over 82 percent of kitchen equipment fully depreciated it is clear that the program’s equipment is aging and in need of continued investment.
Governmental Fund Highlights Most District functions are financed through the governmental fund types, which include the General, Special Revenue, Debt Service and Capital Projects Funds. Due to the significant size and scope of the General Fund, revenues and expense summaries that follow will be separated into General Fund only and then “all other Governmental Funds.” General Fund General educational activities, which are accounted for in the General Fund, are supported principally by local taxes and state aid. A breakdown of General Fund revenues by source follows in Figure A-10.
• Total General Fund revenues increased by 4.4% from the prior period. Increases over the prior year were driven by several key factors.
• The annual increase in State “allowable growth” is funded in large part with property
taxes. In FY05, due to a decline in “budget enrollment,” the District benefited from the state budget guarantee, which was entirely funded by property taxes.
37

• An increase in the Instructional Support Levy to a funding level of 9.5%, whose increased revenues were supported primarily by local property tax revenues also contributed to increases in local taxes.
• State Foundation Aid revenues increased by 3.97% or $2.4 million over the previous
year. This increase reflects state allowable growth to the District.
• Investment earnings grew significantly over the prior period at over 335%, due to a
combination of improved fund reserves and increases in interest rates.
General Fund expenses by function for fiscal years 2004 and 2005 are summarized in Figure A-11, as follows:
• Total Expenditures, before “Other Financing Uses” increased by 3.47% or $4.57 million
from the previous fiscal year. During the development of the FY05 budget, the District was again faced with the prospect of another round of budget reductions because of a decline in enrollment, a low level of state allowable growth and increases in staff compensation levels beyond revenue growth. As a result, the Board of Education approved an increase in the Instructional Support Levy that added $1.77 million in spending authority to the District’s General Fund budget. This increased level of funding contributed to a corresponding growth in District expenditures. By comparison, the previous year’s growth in General Fund expenditures was only 0.72%.
• A shift in funding for District counseling positions to the Instructional Support Levy to
maintain support for other key instructional staff, explains the increase of 24% in Instructional Staff Support Services and a decrease of 28% in Student Support Services.
Figure A-10
General Fund FY 2005 FY 2004
Revenues by Source Amount Percent Amount Percent Change Local Sources Local Taxes $52,293,616 36.5% $50,007,021 36.4% 4.57%Tuition 5,320,560 3.7% 5,016,438 3.7% 6.06%Student Fees and Activities 63,420 0.0% 107,869 0.1% -41.21%Investment Earnings 535,146 0.4% 122,948 0.1% 335.26%Other Local Sources 4,640,532 3.2% 4,598,211 3.3% 0.92% State Sources State Foundation Aid 63,294,455 44.1% 60,876,493 44.3% 3.97%Phase I, II and III 1,465,574 1.0% 1,478,873 1.1% -0.90%Other State Aid 10,467,074 7.3% 10,034,165 7.3% 4.31% Federal Sources Title I 2,125,602 1.5% 2,326,114 1.7% -8.62%Other Federal Aid 3,229,347 2.3% 2,782,291 2.0% 16.07% Total Revenues $143,435,326 100.0% $137,350,423 100.0% 4.43%Other Financing Sources 60,251 73,077 -17.55%Grand Total Resources $143,495,577 $137,423,500 4.42%
38

• Area Education Agency (AEA) support shows a flat funding level. This is reflective of the state’s limitations placed upon AEA funding support over the past several years.
• A State of Iowa required change in accounting codes has caused Central Support Services expenditures to be recorded in the Business Services category.
Figure A-11 General Fund FY 2005 FY 2004
Expenditures by Function Amount Percent Amount Percent Change
Instruction $91,252,850 66.85% $88,729,689 67.26% 2.84% Student Support Services 3,305,725 2.42% 4,605,785 3.49% -28.23% Instructional Staff Support Services 9,585,545 7.02% 7,717,289 5.85% 24.21% General Administration 1,394,156 1.02% 1,032,754 0.78% 34.99% School Administration Services 7,569,451 5.56% 7,162,153 5.43% 5.69% Business Services 3,408,382 2.50% 1,931,776 1.46% 76.44% Operations and Maintenance 10,330,323 7.57% 9,976,127 7.56% 3.55% Student Transportation 2,073,076 1.52% 1,734,064 1.31% 19.55% Central Support Services - 0.00% 1,483,455 1.12% -100.00% Community Services 2,347,160 1.73% 2,320,485 1.77% 1.15% AEA Support - Direct to AEA 5,231,164 3.83% 5,232,029 3.97% -0.02% Total Expenditures $136,497,832 100.00% $131,925,606 100.00% 3.47% Other Financing Uses 336,130 333,480 0.79% Total Expenditures and Uses $136,833,962 $132,259,086 3.46%
All Other Governmental Funds The revenue and expense summaries that follow include all other Governmental Funds. These funds include the Special Revenue Funds, (comprised of the Activity, Management and PPEL Funds) Debt Service and Capital Projects Funds. The term, “Major Funds” is a designation required under reporting standards promulgated by the Governmental Accounting Standards Board statement number 34 (GASB 34). In addition to the General Fund, which is automatically included as a major fund, the District’s most “significant” governmental and enterprise funds are also included. Significant, is determined by measuring the “value” of the fund’s total assets, liabilities, revenues, or expenses and applying a 10% and 5% test. The ten percent test measures these values against all funds in the respective governmental or enterprise category. The five percent test measures these values against all governmental and enterprise funds combined. In addition, a fund may be considered major if the District believes that the fund is important to the users of its financial statements. As can be seen in Figure A-12, in addition to the General Fund, the Management, Physical Plant and Equipment Levy (PPEL) and Capital Projects Funds are considered “major funds” in the “Governmental Funds Group” for the reasons described above. Summary of Revenues In the “All Other Governmental Funds” group, the District experienced an increase of $0.26 million in “Total Revenues” (excluding other financing sources) from the prior year. The following points highlight revenue changes in each fund.
39
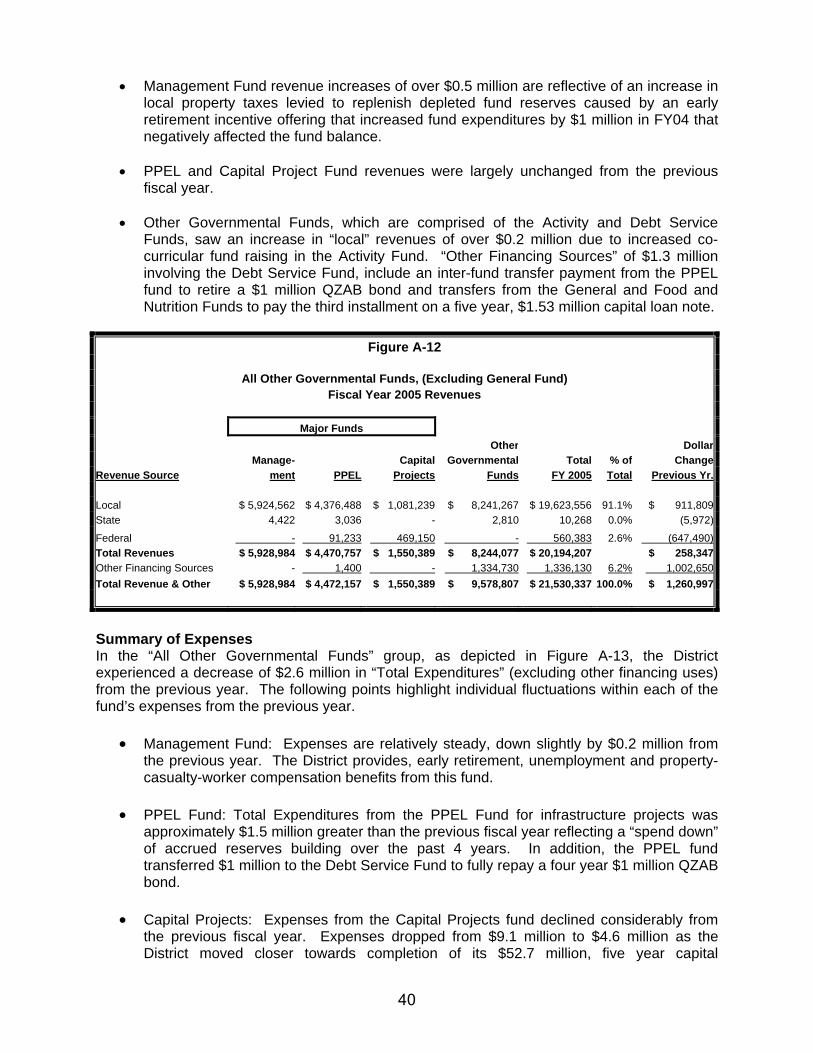
• Management Fund revenue increases of over $0.5 million are reflective of an increase in local property taxes levied to replenish depleted fund reserves caused by an early retirement incentive offering that increased fund expenditures by $1 million in FY04 that negatively affected the fund balance.
• PPEL and Capital Project Fund revenues were largely unchanged from the previous
fiscal year. • Other Governmental Funds, which are comprised of the Activity and Debt Service
Funds, saw an increase in “local” revenues of over $0.2 million due to increased co-curricular fund raising in the Activity Fund. “Other Financing Sources” of $1.3 million involving the Debt Service Fund, include an inter-fund transfer payment from the PPEL fund to retire a $1 million QZAB bond and transfers from the General and Food and Nutrition Funds to pay the third installment on a five year, $1.53 million capital loan note.
Figure A-12
All Other Governmental Funds, (Excluding General Fund)
Fiscal Year 2005 Revenues
Major Funds Other Dollar Manage- Capital Governmental Total % of ChangeRevenue Source ment PPEL Projects Funds FY 2005 Total Previous Yr. Local $ 5,924,562 $ 4,376,488 $ 1,081,239 $ 8,241,267 $ 19,623,556 91.1% $ 911,809 State 4,422 3,036 - 2,810 10,268 0.0% (5,972)
Federal - 91,233 469,150 - 560,383 2.6% (647,490)Total Revenues $ 5,928,984 $ 4,470,757 $ 1,550,389 $ 8,244,077 $ 20,194,207 $ 258,347 Other Financing Sources - 1,400 - 1,334,730 1,336,130 6.2% 1,002,650 Total Revenue & Other $ 5,928,984 $ 4,472,157 $ 1,550,389 $ 9,578,807 $ 21,530,337 100.0% $ 1,260,997
Summary of Expenses In the “All Other Governmental Funds” group, as depicted in Figure A-13, the District experienced a decrease of $2.6 million in “Total Expenditures” (excluding other financing uses) from the previous year. The following points highlight individual fluctuations within each of the fund’s expenses from the previous year.
• Management Fund: Expenses are relatively steady, down slightly by $0.2 million from the previous year. The District provides, early retirement, unemployment and property-casualty-worker compensation benefits from this fund.
• PPEL Fund: Total Expenditures from the PPEL Fund for infrastructure projects was
approximately $1.5 million greater than the previous fiscal year reflecting a “spend down” of accrued reserves building over the past 4 years. In addition, the PPEL fund transferred $1 million to the Debt Service Fund to fully repay a four year $1 million QZAB bond.
• Capital Projects: Expenses from the Capital Projects fund declined considerably from
the previous fiscal year. Expenses dropped from $9.1 million to $4.6 million as the District moved closer towards completion of its $52.7 million, five year capital
40

improvements program. All capital projects are scheduled to be complete by the end of fiscal year 2006.
Figure A-13
All Other Governmental Funds, (Excluding General Fund)
Fiscal Year 2005 Expenditures Major Funds Other DollarExpenditure Manage- Capital Governmental Total % of ChangeFunction ment PPEL Projects Funds FY 2005 Total Previous Yr. Regular instruction $ 2,821,106 $ 41,420 $ - $ - $ 2,862,526 11.1% $ (866,020)Special Instruction 254,521 - - - 254,521 1.0% $ 193,113 Other instruction - - - 4,065,361 4,065,361 15.8% $ (453,295)Student support services 4,658 - - - 4,658 0.0% $ 600 Instructional staff support 140,379 - - - 140,379 0.5% $ 97,626 General administration services 141,355 - - - 141,355 0.5% $ 43,582 School administration services 642,164 - - - 642,164 2.5% $ 172,186 Business services 56,314 4,079 - - 60,393 0.2% $ (1,595)Operations and maintenance 868,836 137,864 - - 1,006,700 3.9% $ 59,669 Student transportation 333,324 518,027 - - 851,351 3.3% $ 297,924 Central services - - - - - 0.0% $ (120,669)Community services 92,645 - - - 92,645 0.4% $ 76,752 Facilities/construction - 4,829,632 4,633,535 - 9,463,167 36.7% $ (3,001,739)Debt Service Principal - - - 3,105,000 3,105,000 12.0% $ 1,035,000
Debt Service Interest - - - 2,115,993 2,115,993 8.2% $ (92,150)Total Expenditures $ 5,355,302 $ 5,531,022 $ 4,633,535 $ 9,286,354 $ 24,806,213 $ (2,559,016)Other Financing Uses - 1,000,000 - - 1,000,000 3.9% 1,000,000 Total Expenditures & Other $ 5,355,302 $ 6,531,022 $ 4,633,535 $ 9,286,354 $ 25,806,213 100.0% -$1,559,016
• Non-Major Funds: Non-Major Funds, which are comprised of the Activity and Debt
Service Funds, saw an increase in expenses of approximately $0.5 million largely due to the year-end $1 million QZAB bond re-payment from the Debt Service Fund. Principal and interest expenses related to the Districts $46 million in general obligation bond debt was largely unchanged from the previous year. From this point forward, it is anticipated that the District will incur approximately $4 million annually in principal and interest payments over the 20-year life of the general obligation bonded debt, ending in fiscal year 2021.
Fund Balances: Governmental Funds Fund balances reflect the accumulated excess of revenues over expenses for governmental functions. A comparison of individual fund(s) balances can be seen in Figures A-14 and A-15. The General Fund balance experienced a significant increase of over $6.6 million or 66% from the previous fiscal year. This is a result of several significant factors. First, the District made targeted reductions of approximately $0.75 million for fiscal year 2005, in staffing and instructional equipment and materials. Secondly, the District maintained an aggressive cash reserve levy in the General Fund of $8.0 million. And finally, several categorical grants were left with “planned” unspent reserves in anticipation of several long-term program initiatives.
41

The Special Revenue Funds, (Activity, Management and PPEL funds combined) experienced a decrease of approximately $1.2 million in fund balance from the previous year. This can largely be attributed to the previously mentioned “spend down” of approximately $2.0 million in accrued reserves that accumulated over the past four years in the PPEL fund. Management Fund reserves increased $0.5 million, with Activity Fund reserves holding steady from the previous fiscal year. The Capital Projects Fund experienced a significant draw down in its fund balance. The fund’s balance was reduced by over $3 million as capital projects expenses were paid from revenues
received from $46 million in general obligation bond sales that occurred in fiscal years 2001 and 2002. The ending balance in the Debt Service Fund is reflective of levying only the amount of local property tax necessary to pay principal and interest on the District’s $41.23 million in general obligation bond debt outstanding. Capital Asset and Debt Administration Capital Assets As indicated in Figure A-16, by the end of 2005, the District had invested, net of depreciation, $68.6 million in a broad range of assets, including school buildings, athletic facilities, computer and audio-visual equipment, and administrative offices. This amount represents a net increase of $7.3 million or 12 percent from last year. This continued increase in capital assets is reflective of the many exciting new construction projects and remodeling improvements to the District’s infrastructure made possible with a voter approved $46 million bond issue passed in December 12, 2000.
Figure A-14 $ Increase % Increase
Fund Balances June 30, 2005 June 30, 2004 (Decrease) (Decrease)General Fund $ 16,769,374 $ 10,107,759 $ 6,661,615 65.9%Special Revenue Funds 4,464,362 5,682,474 (1,218,112) -21.4%Capital Projects Fund 1,861,374 4,944,520 (3,083,146) -62.4%Debt Service Fund 26,096 714 25,382 3554.9% Total $ 23,121,206 $ 20,735,467 $ 2,385,739 11.5%
Governmental Fund Balances by Fund Type Fiscal Year Ended June 30, 2005
$4,464,362
$1,861,374
$16,769,374
$26,096
$-$2,000,000$4,000,000$6,000,000$8,000,000
$10,000,000$12,000,000$14,000,000$16,000,000$18,000,000
Gen
eral
Fun
d
Spe
cial
Rev
enue
Fund
s
Cap
ital P
roje
cts
Fund
Deb
t Ser
vice
Fun
d
Figure A-15
42
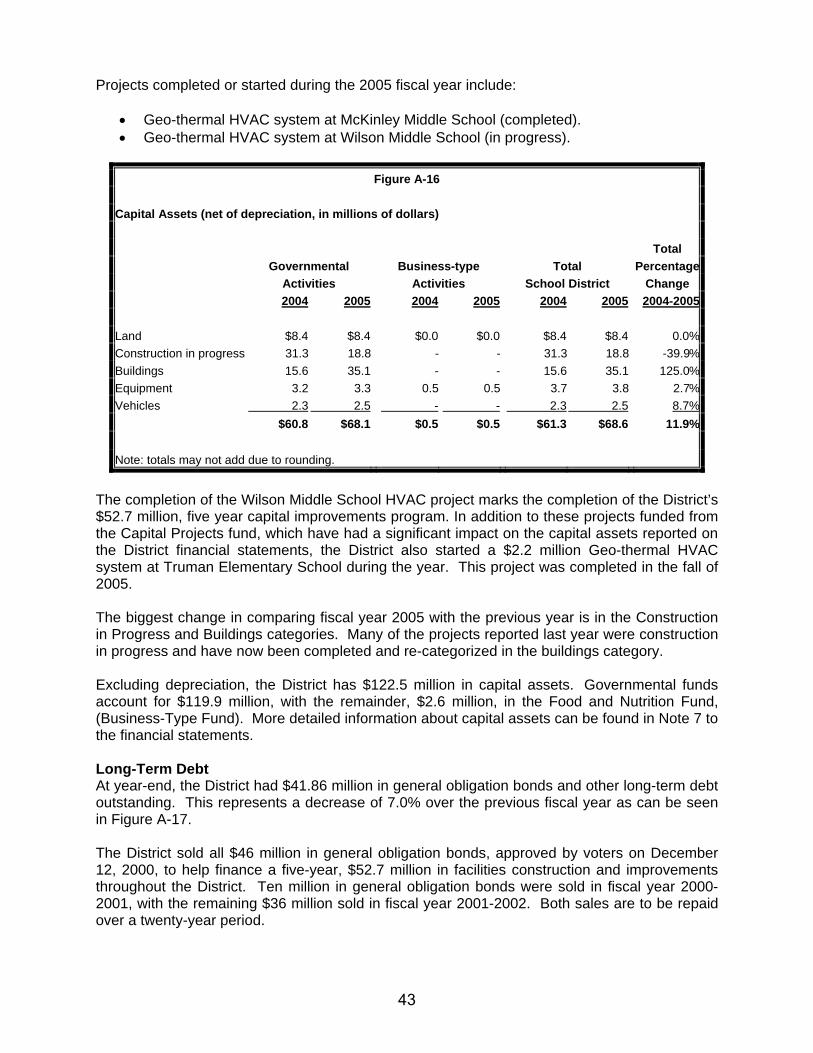
Projects completed or started during the 2005 fiscal year include:
• Geo-thermal HVAC system at McKinley Middle School (completed). • Geo-thermal HVAC system at Wilson Middle School (in progress).
The completion of the Wilson Middle School HVAC project marks the completion of the District’s $52.7 million, five year capital improvements program. In addition to these projects funded from the Capital Projects fund, which have had a significant impact on the capital assets reported on the District financial statements, the District also started a $2.2 million Geo-thermal HVAC system at Truman Elementary School during the year. This project was completed in the fall of 2005. The biggest change in comparing fiscal year 2005 with the previous year is in the Construction in Progress and Buildings categories. Many of the projects reported last year were construction in progress and have now been completed and re-categorized in the buildings category. Excluding depreciation, the District has $122.5 million in capital assets. Governmental funds account for $119.9 million, with the remainder, $2.6 million, in the Food and Nutrition Fund, (Business-Type Fund). More detailed information about capital assets can be found in Note 7 to the financial statements. Long-Term Debt At year-end, the District had $41.86 million in general obligation bonds and other long-term debt outstanding. This represents a decrease of 7.0% over the previous fiscal year as can be seen in Figure A-17. The District sold all $46 million in general obligation bonds, approved by voters on December 12, 2000, to help finance a five-year, $52.7 million in facilities construction and improvements throughout the District. Ten million in general obligation bonds were sold in fiscal year 2000-2001, with the remaining $36 million sold in fiscal year 2001-2002. Both sales are to be repaid over a twenty-year period.
Figure A-16
Capital Assets (net of depreciation, in millions of dollars) Total Governmental Business-type Total Percentage Activities Activities School District Change 2004 2005 2004 2005 2004 2005 2004-2005 Land $8.4 $8.4 $0.0 $0.0 $8.4 $8.4 0.0%Construction in progress 31.3 18.8 - - 31.3 18.8 -39.9%Buildings 15.6 35.1 - - 15.6 35.1 125.0%Equipment 3.2 3.3 0.5 0.5 3.7 3.8 2.7%Vehicles 2.3 2.5 - - 2.3 2.5 8.7% $60.8 $68.1 $0.5 $0.5 $61.3 $68.6 11.9% Note: totals may not add due to rounding.
43

In addition, the District sold $1 million in federal Qualified Zone Academy Bonds, (QZAB) to fund HVAC improvements at Roosevelt Middle School. QZAB bonds are federally subsidized, zero interest bonds to be repaid over a four year time period. In accordance with GAAP, the full amount of the QZAB principal was reported throughout the life of the bonds until this year, when the bonds were fully paid. As of June 30, 2005 the District did not exceed its legal debt margin of $209,902,198. More detailed information about long-term debt can be found in Note 9 to the financial statements.
Factors Bearing on the District’s Future At the time these financial statements were prepared and audited, the District was aware of five existing circumstances that could significantly affect its financial health in the future:
• In fiscal year 2002 and again in fiscal year 2004, the state cut, at mid-year, state aid to schools by 4.3% and 2.5% respectively. The impact upon the Cedar Rapids Community School District totaled approximately $4.6 million in funding cuts. It is certainly a possibility that the state could reduce this funding to schools again and force Districts to consider increasing the property tax supported cash reserve levy to replace these losses.
• Future enrollment stability is a critical element in maintaining a sound financial
foundation. Over the past ten years, District “budget enrollments” a key factor in determining funding, have indicated a long-term pattern of slow decline. Over this period District budget enrollments have shown an overall decline of 190 students or 1% of total enrollment. Fortunately this past fall, the District budget enrollment increased for the second consecutive year by 64 students or 0.36% of total budget enrollment compared with the prior year increase of 36 students or 0.2% of total budget enrollment.
• In recent years, growth in employee wages and benefits has outpaced state funding to
schools. For fiscal year 2006, wages and benefits for District staff increased an average of 4.75% compared to “regular program” revenue growth of 4.0%. Fortunately, growth in other key General Fund revenue sources allowed the District to balance its budget without any staff reductions. Fiscal year 2006 marked the first time in the past five budget years that staff reductions were not necessary.
Figure A-17 Outstanding Long-Term Debt (in millions of dollars) Total Total Percentage School District Change 2004 2005 2004-2005 General obligation bonds & notes $43.030 $41.200 -4.3% (financed with property taxes) *QZAB bond payable 1.000 0.000 -100.0% Capital loan payable 0.940 0.640 -31.9% Total $44.970 $41.840 -7.0%
44

• Health insurance premiums increasing at a rate exceeding both the consumer price index and increases in District revenues will likely continue. The District received great news for fiscal year 2006, with an increase in premiums of only three percent. This compares to a 16% increase in fiscal year 2005 and increases that have exceeded 20% in recent years. Because most District employees pay all or a significant share of their health insurance premiums through a salary reduction program, net incomes for many of our District employees will be adversely effected by any future rate increases that exceed wage growth rates.
• The continued link between residential and agriculture property values in the State of
Iowa for taxation purposes has caused increases in the valuation of commercial property. Many commercial property interests believe this is unfair. In recent years in response to this dilemma, an increasing number of commercial property owners have successfully appealed their property assessments and have effectively reduced their tax burden. Unfortunately, a reduction in property tax collections, some retroactive, has adversely impacted the District’s tax receipts. A solution to this dilemma is in the hands of the State legislature.
Contacting the District’s Financial Management This financial report is designed to provide the District’s citizens, taxpayers, customers, investors and creditors with a general overview of the District’s finances and to demonstrate the District’s accountability of the money it receives. If you have questions about this report or need additional financial information, contact Steve Graham, Executive Director – Business Services, Cedar Rapids Community School District, 346 Second Avenue SW, Cedar Rapids, IA 52404.
45

46

Government-Wide Financial Statements
47

48

CEDAR RAPIDS COMMUNITY SCHOOL DISTRICT
Statement of Net Assets
June 30, 2005
Governmental Business-TypeActivities Activity Total
Assets Current assets:
Cash and cash equivalents 36,805,898$ 1,008,662$ 37,814,560$ Receivables: Property tax: Delinquent 1,015,740 - 1,015,740 Succeeding year 62,276,000 - 62,276,000 Other 1,120,342 66,328 1,186,670 Due from other governments 4,294,537 51,632 4,346,169 Interfund loans 121,409 - 121,409 Inventories 207,822 130,714 338,536 Prepaid items 471,545 - 471,545 Total current assets 106,313,293 1,257,336 107,570,629
Noncurrent assets:Capital assets: Land and construction in progress 27,227,173 - 27,227,173 Depreciable assets 92,704,977 2,615,573 95,320,550 Less: accumulated depreciation (51,819,501) (2,162,410) (53,981,911) Total noncurrent assets 68,112,649 453,163 68,565,812
Total assets 174,425,942 1,710,499 176,136,441
Liabilities Current liabilities:
Accounts payable and accrued items 18,657,255 36,251 18,693,506 Due to other governments 1,223,977 - 1,223,977 Interfund loans - 121,409 121,409 Accrued interest payable 166,113 - 166,113 Unearned revenue: Succeeding year property tax 62,276,000 - 62,276,000 Other 1,034,855 91,801 1,126,656 Current portion of long-term obligations 6,190,969 - 6,190,969 Total current liabilities 89,549,169 249,461 89,798,630
Noncurrent liabilities:Noncurrent portion of long-term obligations 44,529,188 - 44,529,188 Total noncurrent liabilities 44,529,188 - 44,529,188
Total liabilities 134,078,357 249,461 134,327,818
Net Assets Invested in capital assets, net of related debt 26,105,053 453,163 26,558,216 Restricted for:
Capital projects 1,861,374 - 1,861,374 Unrestricted 12,381,158 1,007,875 13,389,033
Total net assets 40,347,585$ 1,461,038$ 41,808,623$
The notes to the basic financial statements are an integral part of this statement.
49

50
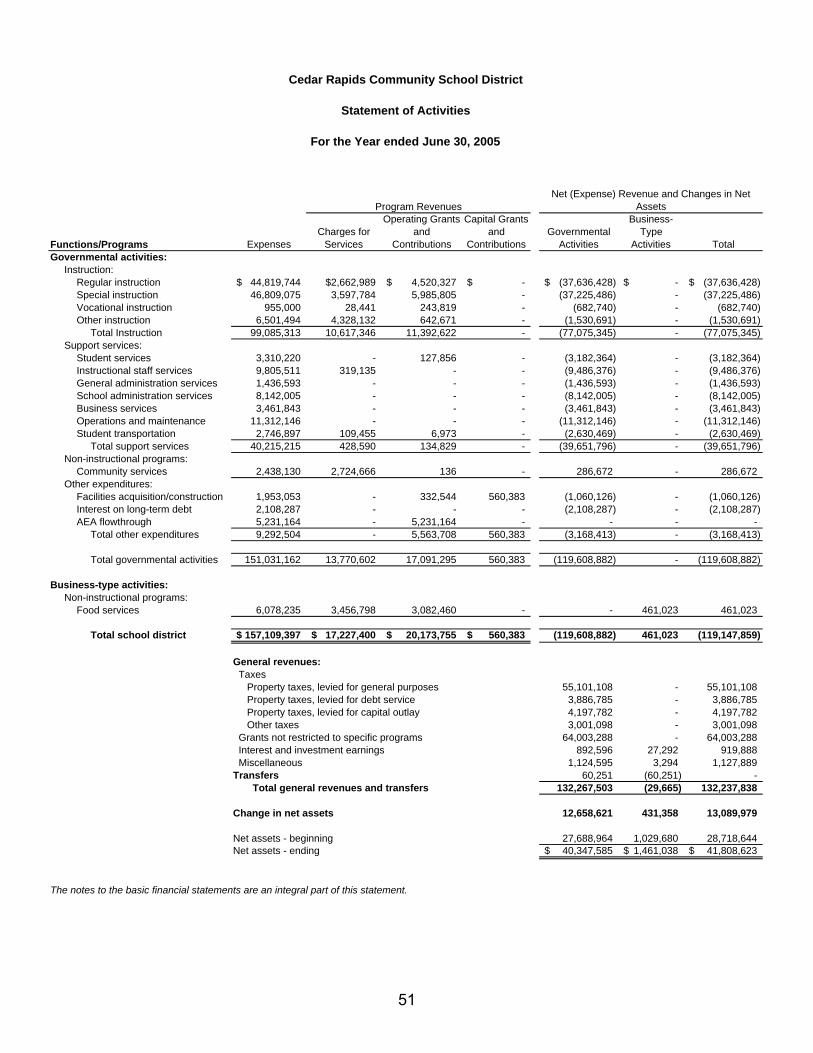
Net (Expense) Revenue and Changes in Net Assets
Functions/Programs ExpensesCharges for
Services
Operating Grants and
Contributions
Capital Grants and
ContributionsGovernmental
Activities
Business- Type
Activities TotalGovernmental activities: Instruction:
Regular instruction 44,819,744$ $2,662,989 4,520,327$ -$ (37,636,428)$ -$ (37,636,428)$ Special instruction 46,809,075 3,597,784 5,985,805 - (37,225,486) - (37,225,486) Vocational instruction 955,000 28,441 243,819 - (682,740) - (682,740) Other instruction 6,501,494 4,328,132 642,671 - (1,530,691) - (1,530,691) Total Instruction 99,085,313 10,617,346 11,392,622 - (77,075,345) - (77,075,345)
Support services:Student services 3,310,220 - 127,856 - (3,182,364) - (3,182,364) Instructional staff services 9,805,511 319,135 - - (9,486,376) - (9,486,376) General administration services 1,436,593 - - - (1,436,593) - (1,436,593) School administration services 8,142,005 - - - (8,142,005) - (8,142,005) Business services 3,461,843 - - - (3,461,843) - (3,461,843) Operations and maintenance 11,312,146 - - - (11,312,146) - (11,312,146) Student transportation 2,746,897 109,455 6,973 - (2,630,469) - (2,630,469) Total support services 40,215,215 428,590 134,829 - (39,651,796) - (39,651,796)
Non-instructional programs:Community services 2,438,130 2,724,666 136 - 286,672 - 286,672
Other expenditures:Facilities acquisition/construction 1,953,053 - 332,544 560,383 (1,060,126) - (1,060,126) Interest on long-term debt 2,108,287 - - - (2,108,287) - (2,108,287) AEA flowthrough 5,231,164 - 5,231,164 - - - - Total other expenditures 9,292,504 - 5,563,708 560,383 (3,168,413) - (3,168,413)
Total governmental activities 151,031,162 13,770,602 17,091,295 560,383 (119,608,882) - (119,608,882)
Business-type activities: Non-instructional programs:
Food services 6,078,235 3,456,798 3,082,460 - - 461,023 461,023
Total school district 157,109,397$ 17,227,400$ 20,173,755$ 560,383$ (119,608,882) 461,023 (119,147,859)
General revenues: Taxes Property taxes, levied for general purposes 55,101,108 - 55,101,108 Property taxes, levied for debt service 3,886,785 - 3,886,785 Property taxes, levied for capital outlay 4,197,782 - 4,197,782 Other taxes 3,001,098 - 3,001,098 Grants not restricted to specific programs 64,003,288 - 64,003,288 Interest and investment earnings 892,596 27,292 919,888 Miscellaneous 1,124,595 3,294 1,127,889 Transfers 60,251 (60,251) - Total general revenues and transfers 132,267,503 (29,665) 132,237,838
Change in net assets 12,658,621 431,358 13,089,979
Net assets - beginning 27,688,964 1,029,680 28,718,644 Net assets - ending 40,347,585$ 1,461,038$ 41,808,623$
The notes to the basic financial statements are an integral part of this statement.
Cedar Rapids Community School District
Statement of Activities
For the Year ended June 30, 2005
Program Revenues
51

52

Fund Financial Statements
53

CEDAR RAPIDS COMMUNITY SCHOOL DISTRICT
Balance Sheet Governmental Funds
As of June 30, 2005
General ManagementAssets Cash and cash equivalents 25,550,000$ 2,768,567$ Receivables:
Property tax: Delinquent 792,122 95,132 Succeeding year 47,636,000 6,500,000 Other 1,082,627 15,698
Due from other governments 3,656,788 - Due from other funds 155,823 - Inventories--supplies and materials 207,822 - Prepaid items 471,545 -
Total Assets 79,552,727$ 9,379,397$
Liabilities and Fund BalancesLiabilities: Accounts payable and accrued items $13,042,906 3,128,150$ Due to other governments 1,223,977 - Due to other funds - 4,424 Unearned revenue:
Succeeding year property tax 47,636,000 6,500,000 Other 880,470 - Total Liabilities 62,783,353 9,632,574
Fund Balances (Deficits): Reserved for encumbrances $809,174 - Reserved for inventories 207,822 - Reserved for prepaid items 471,545 - Reserved for categorical programs 13,329 - Reserved for capital projects - - Unreserved, undesignated reported in:
General fund 15,267,504 - Special revenue funds - (253,177) Total Fund Balances (Deficits) 16,769,374 (253,177)
Total Liabilities and Fund Balances (Deficits) 79,552,727$ 9,379,397$
The notes to the basic financial statements are an integral part of this statement.
54
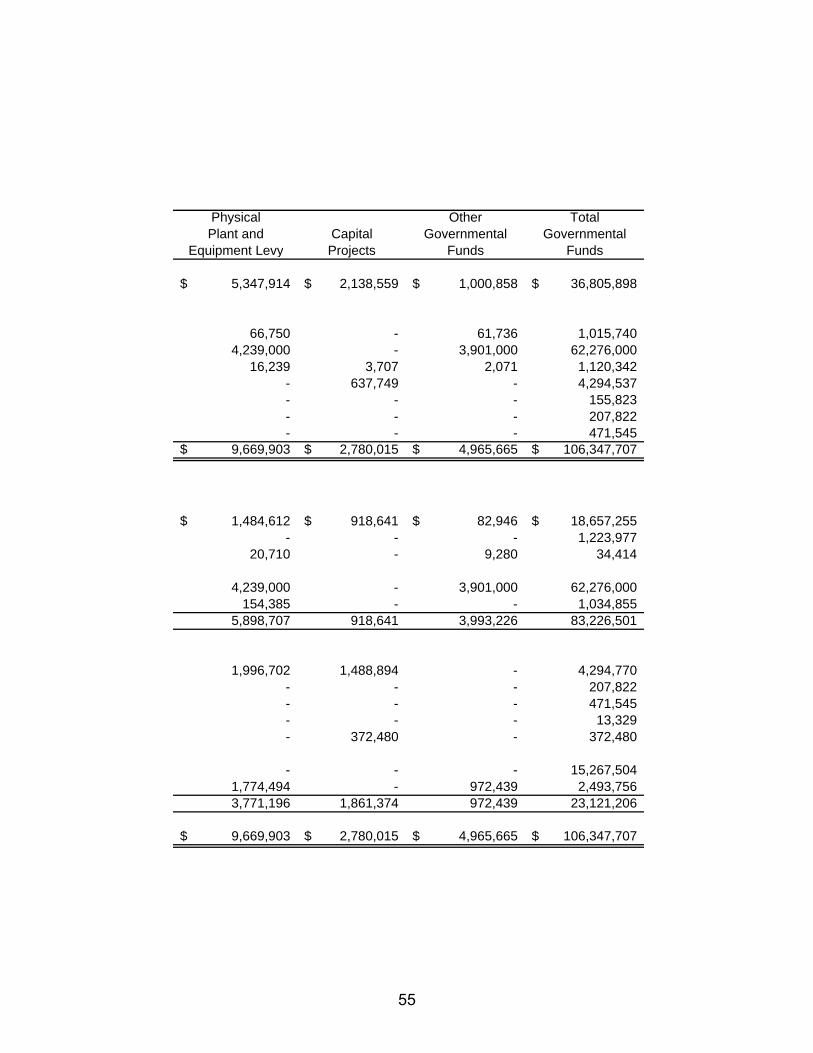
Physical Other TotalPlant and Capital Governmental Governmental
Equipment Levy Projects Funds Funds
5,347,914$ 2,138,559$ 1,000,858$ 36,805,898$
66,750 - 61,736 1,015,740 4,239,000 - 3,901,000 62,276,000
16,239 3,707 2,071 1,120,342 - 637,749 - 4,294,537 - - - 155,823 - - - 207,822 - - - 471,545
9,669,903$ 2,780,015$ 4,965,665$ 106,347,707$
1,484,612$ 918,641$ 82,946$ 18,657,255$ - - - 1,223,977
20,710 - 9,280 34,414
4,239,000 - 3,901,000 62,276,000 154,385 - - 1,034,855
5,898,707 918,641 3,993,226 83,226,501
1,996,702 1,488,894 - 4,294,770 - - - 207,822 - - - 471,545 - - - 13,329 - 372,480 - 372,480
- - - 15,267,504 1,774,494 - 972,439 2,493,756 3,771,196 1,861,374 972,439 23,121,206
9,669,903$ 2,780,015$ 4,965,665$ 106,347,707$
55

56

Amounts reported for governmental activities in the statement of net assets are different because:
Total fund balance - governmental funds 23,121,206$
The cost of capital assets is 119,932,150 Accumulated depreciation is 51,819,501
68,112,649
Bonds Payable 41,225,000 Accrued interest on the bonds 166,113
Capital loans payable 635,000 Compensated absences (vacations) 1,477,985 Special termination benefits payable 7,382,172 (50,886,270)
Total net assets - governmental activities 40,347,585$
The notes to the basic financial statements are an integral part of this statement.
Capital assets used in governmental activities are not financial resources and therefore are not reported as assets in governmental funds.
Long-term liabilities, including bonds payable, are not due and payable in the current period and therefore are not reported as liabilities in the funds. Long-term liabilities at year end consist of:
Cedar Rapids Community School DistrictReconciliation of the Governmental Funds Balance Sheet
to the Statement of Net AssetsJune 30, 2005
57

Physical Other TotalsPlant and Capital Governmental (Memorandum
General Management Equipment Levy Projects Funds Only)RevenuesLocal sources: Local Taxes 52,293,616$ 5,808,554$ 4,197,779$ -$ 3,885,949$ 66,185,898$ Tuition 5,320,560 - - - - 5,320,560 Other local sources 5,239,098 116,008 178,709 1,081,239 4,355,318 10,970,372 State sources 75,227,103 4,422 3,036 - 2,810 75,237,371 Federal sources 5,354,949 - 91,233 469,150 - 5,915,332 Total Revenues 143,435,326 5,928,984 4,470,757 1,550,389 8,244,077 163,629,533
Expenditures Current: Instruction: Regular instruction 41,287,198 2,821,106 41,420 - - 44,149,724 Special instruction 46,518,919 254,521 - - - 46,773,440 Vocational instruction 950,062 - - - - 950,062 Other instruction 2,496,671 - - - 4,065,361 6,562,032 Total instruction 91,252,850 3,075,627 41,420 - 4,065,361 98,435,258
Support Services: Student services 3,305,725 4,658 - - - 3,310,383 Instruction staff services 9,585,545 140,379 - - - 9,725,924 General administration services 1,394,156 141,355 - - - 1,535,511 School administration services 7,569,451 642,164 - - - 8,211,615 Business services 3,408,382 56,314 4,079 - - 3,468,775 Operations and maintenance 10,330,323 868,836 137,864 - - 11,337,023 Student transportation 2,073,076 333,324 518,027 - - 2,924,427 Total support services 37,666,658 2,187,030 659,970 - - 40,513,658
Non-instructional programs: Community services 2,347,160 92,645 - - - 2,439,805 Total non-instructional programs 2,347,160 92,645 - - - 2,439,805
Other expenditures: Debt Service: Principal - - - - 3,105,000 3,105,000 Interest - - - - 2,115,993 2,115,993 Capital Outlay: Facilities acquisition - - 4,829,632 4,633,535 - 9,463,167 Other support services 5,231,164 - - - - 5,231,164 Total other expenditures 5,231,164 - 4,829,632 4,633,535 5,220,993 19,915,324 Total Expenditures 136,497,832 5,355,302 5,531,022 4,633,535 9,286,354 161,304,045
Excess (deficiency) of revenues over expenditures 6,937,494 573,682 (1,060,265) (3,083,146) (1,042,277) 2,325,488
Other Financing Sources (Uses): Transfers in 60,251 - 1,400 - 1,334,730 1,396,381 Transfers out (336,130) - (1,000,000) - - (1,336,130)
(275,879) - (998,600) - 1,334,730 60,251
Net Change in Fund Balances 6,661,615 573,682 (2,058,865) (3,083,146) 292,453 2,385,739
Fund balances (deficits) at beginning of year 10,107,759 (826,859) 5,830,061 4,944,520 679,986 20,735,467
Fund balances (deficits) at end of year 16,769,374$ (253,177)$ 3,771,196$ 1,861,374$ 972,439$ 23,121,206$
Year ended June 30, 2005
The notes to the basic financial statements are an integral part of this statement.
CEDAR RAPIDS COMMUNITY SCHOOL DISTRICT
Statement of Revenues, Expenditures and Changes in Fund BalancesGovernmental Funds
58

Total net change in fund balances - governmental funds 2,385,739$
Amounts reported for governmental activities in the statement of activities are different because:
Capital outlays to purchase or build capital assets are reported in governmental funds as expenditures.
This is the amount by which capital outlays exceeds depreciation in the period.Capital outlays 26,696,683$
Construction in progress completed (17,103,053) Depreciation expense (2,274,036) 7,319,594
In the statement of activities, certain operating expenses--compensated absences (vacations) and
(147,595)
Proceeds from the sale of equipment is reported in the governmental funds ($-0-), however in the statement of activities it is netted against the book value of the assets being deleted and reported as a loss on sale of capital assets ($11,823). (11,823)
Repayment of bond principal is an expenditure in the governmental funds, but it reduces long-termliabilities in the statement of net assets and does not affect the statement of activities. 3,105,000
Interest on long-term debt in the statement of activities differs from the amount reported in the
7,706
Change in net assets - governmental activities 12,658,621$
The notes to the basic financial statements are an integral part of this statement.
governmental funds because interest is recorded as an expenditure in the funds, when it is due, and thus requires the use of current financial resources. In the statement of activities, however, interest expense is recognized as the interest accrues, regardless of when it is due. Accrued interest on bonds decreased by $7,706.
However, for governmental activities those costs are shown in the statement of net assets and allocated over their estimated useful lives as annual depreciation expenses in the statement of activities.
special termination benefits (early retirement)--are measured by the amounts earned during the year. In governmental funds, however, expenditures for these items are measured by the amount of financial resources used (essentially, the amounts actually paid). This year, special termination benefits earned ($7,382,172) was greater than the amounts paid ($7,305,107) by $77,065. Vacation earned ($1,477,985) was greater than the amounts used ($1,407,455) by $70,530.
Cedar Rapids Community School DistrictReconciliation of the Governmental Funds, Statement of Revenues, Expenditures,
and Changes in Fund Balance to the Government-wide Statement of ActivitiesYear Ended June 30, 2005
59

60
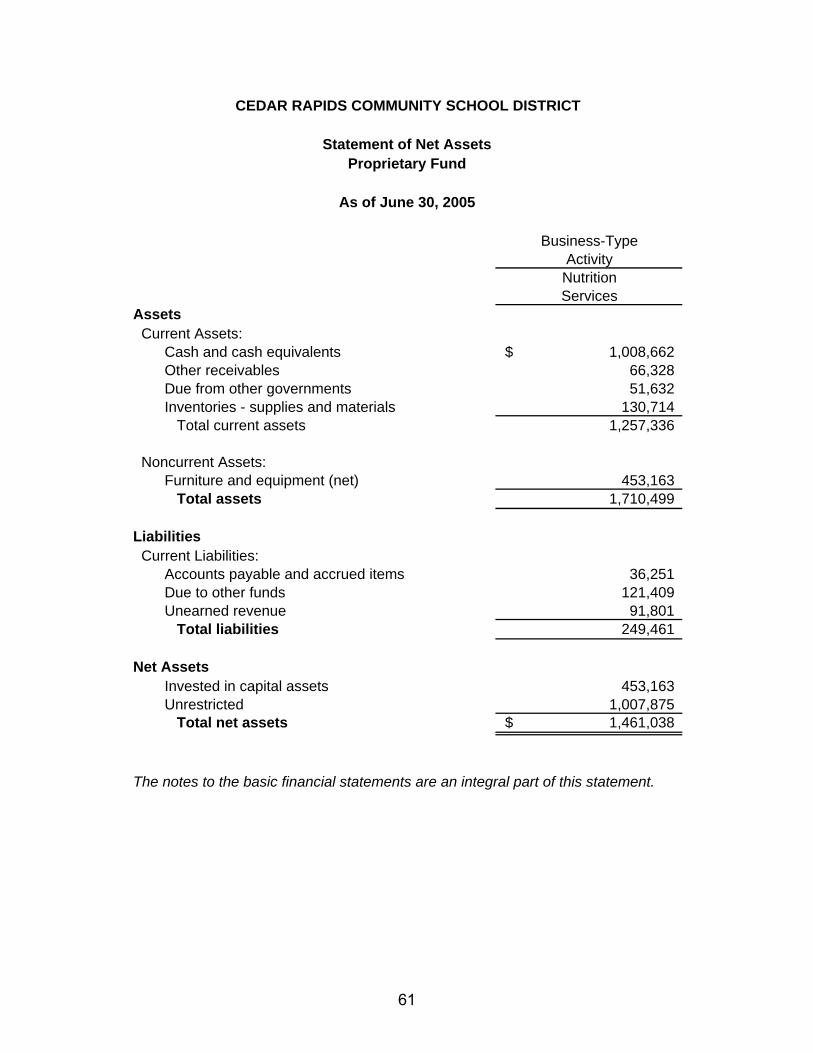
CEDAR RAPIDS COMMUNITY SCHOOL DISTRICT
Statement of Net AssetsProprietary Fund
As of June 30, 2005
Business-TypeActivity
NutritionServices
Assets Current Assets:
Cash and cash equivalents 1,008,662$ Other receivables 66,328 Due from other governments 51,632 Inventories - supplies and materials 130,714 Total current assets 1,257,336
Noncurrent Assets:Furniture and equipment (net) 453,163 Total assets 1,710,499
Liabilities Current Liabilities:
Accounts payable and accrued items 36,251 Due to other funds 121,409 Unearned revenue 91,801 Total liabilities 249,461
Net AssetsInvested in capital assets 453,163 Unrestricted 1,007,875
Total net assets 1,461,038$
The notes to the basic financial statements are an integral part of this statement.
61
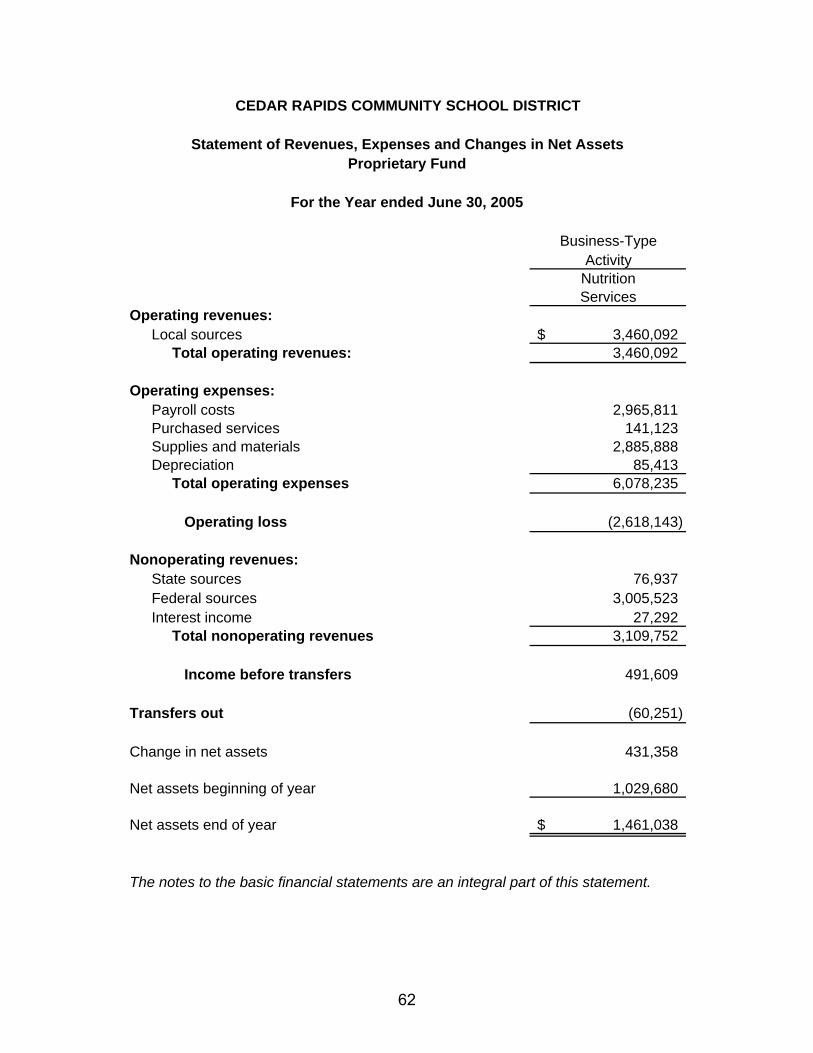
CEDAR RAPIDS COMMUNITY SCHOOL DISTRICT
Statement of Revenues, Expenses and Changes in Net AssetsProprietary Fund
For the Year ended June 30, 2005
Business-TypeActivity
NutritionServices
Operating revenues:Local sources 3,460,092$ Total operating revenues: 3,460,092
Operating expenses:Payroll costs 2,965,811 Purchased services 141,123 Supplies and materials 2,885,888 Depreciation 85,413 Total operating expenses 6,078,235
Operating loss (2,618,143)
Nonoperating revenues:State sources 76,937 Federal sources 3,005,523 Interest income 27,292 Total nonoperating revenues 3,109,752
Income before transfers 491,609
Transfers out (60,251)
Change in net assets 431,358
Net assets beginning of year 1,029,680
Net assets end of year 1,461,038$
The notes to the basic financial statements are an integral part of this statement.
62

CEDAR RAPIDS COMMUNITY SCHOOL DISTRICT
Statement of Cash Flows
Proprietary Fund
For the Year ended June 30, 2005
Business-TypeActivity
NutritionServices
Cash Flows from Operating Activities: Cash received from sale of lunches and breakfasts 3,141,816$ Cash received from services 228,113 Cash received from miscellaneous operating activities 49,832 Cash payments to employees for services (2,967,207) Cash payments to suppliers for good and services (2,663,526) Cash payments for other operating expenses (2,251) Net cash used in operating activities (2,213,223)
Cash Flows from Non-Capital Financing Activities: State lunch and breakfast reimbursements 76,937 Federal lunch and breakfast reimbursements 2,651,847 Transfers to other funds (60,251) Net cash provided by non-capital financing activities 2,668,533
Cash Flows from Capital and Related Financing Activities: Acquisition of capital assets (15,888)
Cash Flows from Investing Activities: Interest on investments 27,292
Net increase in cash and cash equivalents 466,714
Cash and cash equivalents at beginning of year 541,948
Cash and cash equivalents at end of year 1,008,662$
Reconciliation of operating loss to net cash used in operating activities: Operating loss (2,618,143)$ Adjustments to reconcile operating loss to net cash used in operating activities: Depreciation expense 85,413 Commodities consumed 353,542 Changes in assets and liabilities: Decrease in receivables, net (42,897) Increase in inventories 7,263 Decrease in accounts payable and accrued expenses (1,106) Increase in due to other funds 139 Decrease in deferred revenues 2,566 Net cash used in operating activities (2,213,223)$
Non-Cash Investing, Capital and Financing Activities: During the year ended June 30, 2005, the District received federal commodities valued at $236,199 during the year.
The notes to the basic financial statements are an integral part of this statement.
63

64

Cedar Rapids Community School District
Statement of Fiduciary Assets and Liabilities
As of June 30, 2005
AgencyFund
Assets:Cash 39,502$ Total Assets 39,502$
Liabilities: Accounts payable 39,502$ Total Liabilities 39,502$
The notes to the basic financial statements are anintegral part of this statement.
65

Cedar Rapids Community School District
Notes to the Financial Statements
June 30, 2005
1. Summary of Significant Accounting Policies The Cedar Rapids Community School District (the “District”) is a political subdivision of the State of Iowa and operates public schools for children in grades kindergarten through twelve with a student enrollment of 17,837. Additionally, the District either operates or sponsors various adult education programs. These courses include remedial education, as well as vocational and recreational courses. The geographic area served includes the cities of Cedar Rapids, Bertram, Hiawatha, Palo, Robins and portions of Marion, Iowa. The District is governed by a Board of Directors whose members are elected on a nonpartisan basis. A. Basis of Presentation The accompanying basic financial statements have been prepared in conformity with generally accepted accounting principles (GAAP) as prescribed by the Governmental Accounting Standards Board (GASB). GASB is the accepted standard-setting body for governmental accounting and financial reporting principles. B. Reporting Entity For financial reporting purposes, the District has included all funds, organizations, agencies, boards, commissions and authorities. The District has also considered all potential component units for which it is financially accountable, and other organizations for which the nature and significance of their relationship with the District are such that exclusion would cause the District’s financial statements to be misleading or incomplete. The GASB has set forth criteria to be considered in determining financial accountability. These criteria include appointing a voting majority of an organization’s governing body, and (1) the ability of the District to impose its will on that organization; or (2) the potential for the organization to provide specific benefits to, or impose specific financial burdens on, the District. The District has no component units that meet the GASB criteria, and is not a component unit for another entity.
66

Cedar Rapids Community School District
Notes to the Financial Statements
June 30, 2005
1. Summary of Significant Accounting Policies (continued)
C. Government-wide and Fund Financial Statements The Government-wide financial statements (i.e., the statement of net assets and the statement of activities) report information on all of the nonfiduciary activities of the District. For the most part, the effect of interfund activity has been removed from these statements. Governmental activities, which normally are supported by taxes and intergovernmental revenues, are reported separately from business-type activities, which rely to a significant extent on fees and charges for support. The statement of activities demonstrates the degree to which the direct expenses of a given function are offset by program revenues. Direct expenses are those that are clearly identifiable with a specific function. Program revenues include 1) charges to customers or applicants who purchase, use, or directly benefit from goods, services, or privileges provided by a given function and 2) grants and contributions that are restricted to meeting the operational or capital requirements of a particular function. Taxes and other items not properly included among program revenues are reported instead as general revenues. Separate financial statements are provided for governmental funds, proprietary funds, and fiduciary funds, even though the latter are excluded from the Government-wide financial statements. Major individual governmental funds and major individual enterprise funds are reported as separate columns in the fund financial statements. D. Measurement Focus, Basis of Accounting and Financial Statement Presentation The Government-wide financial statements are reported using the economic resources measurement focus and the accrual basis of accounting, as is the proprietary fund. Fiduciary fund financial statements for the District’s agency fund apply the accrual basis of accounting but do not involve a measurement focus, since it is custodial in nature. Revenues are recorded when earned and expenses are recorded when a liability is incurred, regardless of the timing of related cash flows. Property taxes are recognized as revenues in the year for which they are levied. Grants and similar items are recognized as revenue as soon as all eligibility requirements imposed by the provider have been met.
67

Cedar Rapids Community School District
Notes to the Financial Statements
June 30, 2005
1. Summary of Significant Accounting Policies (continued)
D. Measurement Focus, Basis of Accounting and Financial Statement Presentation (continued) Governmental fund financial statements are reported using the current financial resources measurement focus and the modified accrual basis of accounting. Revenues are recognized as soon as they are both measurable and available. Revenues are considered to be available when they are collectible within the current period or soon enough thereafter to pay liabilities of the current period. For this purpose, the District considers revenues to be available if they are collected within 60 days of the end of the current fiscal period. Expenditures generally are recorded when a liability is incurred, as under accrual accounting. However, debt service expenditures, as well as expenditures related to compensated absences and claims and judgments, are recorded only when payment is due. Property taxes, interest revenue, tuition from other districts and state foundation aid are all considered to be susceptible to accrual and so have been recognized as revenues of the current fiscal period. All other revenue items are considered to be measurable and available only when cash is received by the District. The District reports the following major governmental funds:
The general fund is the government’s primary operating fund. It accounts for all financial resources of the District, except those required to be accounted for in another fund. The management fund accounts for the resources accumulated and payments made for property insurance, fidelity bonds, worker compensation, liability insurance premiums, unemployment insurance claims and early retirement incentives. The physical, plant and equipment levy fund accounts for the resources accumulated and payments made for the purchase and improvement of grounds; purchase of buildings; major repairs, remodeling, reconstructing, improving or expanding the schoolhouses or buildings; expenditures for energy conservation; and for equipment purchases which must be equal to or greater than $1,500 in unit value. The purchase of transportation vehicles qualify under the law.
68
Cedar Rapids Community School District
Notes to the Financial Statements
June 30, 2005
1. Summary of Significant Accounting Policies (continued)
D. Measurement Focus, Basis of Accounting and Financial Statement Presentation (continued) The capital projects fund is utilized to account for all resources used in the acquisition and construction of capital facilities with the exception of those that are financed through enterprise funds. The government reports the following major proprietary fund:
The nutrition fund is used to account for the food service operations of the District. Proprietary funds are used to account for activities similar to those found in private industry, where the determination of net income is necessary or useful to provide sound financial administration.
Additionally, the government reports the following fund type:
The agency fund is used to account for assets held by the District as an agent for private donations from individuals. These donations are to be used for specific purposes, such as scholarships. The agency fund is custodial in nature; assets equal liabilities, and do not involve measurement of results of operations.
Private-sector standards of accounting and financial reporting issued prior to December 1, 1989, generally are followed in both the Government-wide and proprietary fund financial statements to the extent that those standards do not conflict with or contradict guidance of the GASB. Governments also have the option of following subsequent private-sector guidance for their business-type activities and enterprise funds, subject to the same limitation. The government has elected not to follow subsequent private-sector guidance.
Amounts reported as program revenues include 1) charges to customers or applicants for goods, services, or privileges provided, 2) operating grants and contributions, and 3) capital grants and contributions. Internally dedicated resources are reported as general revenues rather than as program revenues. Likewise, general revenues include all taxes. Proprietary funds distinguish operating revenues and expenses from nonoperating items. Operating revenues and expenses generally result from providing services and producing and delivering goods in connection with a proprietary fund’s principal ongoing operations. The principal operating revenues of the District’s nutrition enterprise fund are charges to customers for meals. Operating expenses for enterprise funds include the cost of sales and
69
Cedar Rapids Community School District
Notes to the Financial Statements
June 30, 2005
1. Summary of Significant Accounting Policies (continued)
D. Measurement Focus, Basis of Accounting and Financial Statement Presentation (continued) services, administrative expenses, and depreciation on capital assets. All revenues and expenses not meeting this definition are reported as nonoperating revenues and expenses. When both restricted and unrestricted resources are available for use, it is the District’s policy to use restricted resources first, then unrestricted resources as they are needed. E. Cash, Cash Equivalents and Investments The District considers cash on hand, demand deposits and certificates of deposits with original maturities of three months or less from the date of acquisition to be cash equivalents. Investments are stated at fair value. F. Property Taxes Receivable Property tax receivable is recognized in these funds on the levy or lien date, which is the date that the tax asking is certified by the Board of Education to the County Board of Supervisors. Current year delinquent property taxes receivable represents unpaid taxes from the current year. The succeeding year property tax receivable represents taxes certified by the Board of Education to be collected in the next fiscal year for the purposes set out in the budget for the next fiscal year. By statute, the Board of Education is required to certify its budget to the County Auditor by April 15 of each year for the subsequent fiscal year. However, by statute, the tax asking and budget certification for the following fiscal year becomes effective on the first day of that year. Although the succeeding year property tax receivable has been recorded, the related revenue is deferred and will not be recognized as revenue until the year for which it is levied. Property tax revenue recognized in these funds become due and collectible in September and March of the fiscal year with a 1.5% per month penalty for delinquent payments; is based on January 1, 2003 assessed property valuations; is for the tax accrual period July 1, 2004 through June 30, 2005 and reflects the tax asking contained in the budget certified to the County Board of Supervisors in April 2004. Linn County bills and collects property taxes for the District with monthly collections remitted to the District before the 15th of the month following collection.
70
Cedar Rapids Community School District
Notes to the Financial Statements
June 30, 2005
1. Summary of Significant Accounting Policies (continued)
G. Short-Term Interfund Receivable/Payables During the course of operations, numerous transactions occur between individual funds for goods provided or services rendered. To the extent that certain transfers between funds had not been received as of June 30, 2005, balances of interfund amounts receivable or payable have been recorded. These receivables and payables are classified as “due from other funds” or “due to other funds” on the balance sheet.
H. Elimination and Reclassifications In the process of aggregating data for the statement of net assets and the statement of net activities, some amounts reported as interfund activity and balances in the funds were eliminated or reclassified. Interfund receivables and payables were eliminated to minimize the “grossing up” effect on assets and liabilities within the governmental activities column. I. Inventories Inventories of the General Fund are stated at the moving average cost for purchased items and are accounted for using the consumption method, whereby inventory acquisitions are recorded in inventory accounts when purchased or received by other means and are charged to operations when consumed or sold. Reported inventories in the General Fund are offset by a fund balance reserve which indicates these assets are unavailable for appropriation even though they are a component of reported assets. Inventories of the Nutrition Fund are valued at the lower of cost (first-in, first-out) or market for purchased items and the contributed value for government commodities. At June 30, 2005, government commodities valued at $87,009 were on hand. J. Capital Assets Capital assets, which included property, plant, and equipment, are reported in the applicable governmental or business-type activities columns in the Government-wide financial statements. The District defines capital assets as assets with an initial, individual cost of more than $1,000 (amount not rounded) and an estimated useful life in excess of two years. Such assets are recorded at historical cost or estimated historical cost if purchased or constructed. Donated
71

Cedar Rapids Community School District
Notes to the Financial Statements
June 30, 2005
1. Summary of Significant Accounting Policies (continued)
J. Capital Assets (continued) Capital assets are recorded at estimated fair market value at the date of donation. The costs of normal maintenance and repairs that do not add to the value of the asset or materially extend asset lives are not capitalized. Land is not depreciated. Capital assets of the District are depreciated using the straight-line method over the following estimated useful lives: During the year ended June 30, 2005, no interest costs were capitalized since the District’s policy is not to capitalize interest costs on assets constructed or acquired with tax-exempt debt paid for from annual debt service tax levies. K. Salaries and Benefits Payable Payroll and related expenditures for teachers with annual contracts corresponding to the current school year, which are payable in July and August, have been accrued as liabilities. L. Unearned Revenue Although certain revenues are measurable, they are not available. Available means collectible within the current period or soon enough thereafter to be used to pay liabilities of the current period. Unearned revenue represents the amount of assets that have been recognized, but the related revenue has not been recognized since the assets are not collected within the current period or expected to be collected soon enough thereafter to be used to pay liabilities of the current period. Unearned revenue consists of unspent grant proceeds, the succeeding year property tax receivable and other receivables not collected within sixty days after year-end.
Assets Years Buildings 50 Furniture 20 Kitchen equipment 15 Office/school equipment 10 Vehicles 8 Computer equipment 5
72

Cedar Rapids Community School District
Notes to the Financial Statements
June 30, 2005
1. Summary of Significant Accounting Policies (continued)
M. Compensated Absences District employees accumulate a limited amount of earned but unused vacation for subsequent use or for payment upon termination, death or retirement. Compensated absences are accrued when incurred in the Government-wide and proprietary fund financial statements. A liability for these amounts, including FICA and IPERS, is reported in governmental funds only if they are matured, for example, as a result of employee resignations and retirements. For the governmental activities, compensated absences are liquidated by the general fund. N. Long-Term Liabilities In the Government-wide financial statements and proprietary fund type in the fund financial statements, long-term debt and other long-term obligations are reported as liabilities in the applicable governmental activities, business-type activities, or proprietary fund type statement of net assets. Bond premiums and discounts, as well as issuance costs, are deferred and amortized over the life of the bonds using the effective interest method. Bonds payable are reported net of the applicable bond premium or discount. Bond issuance costs are reported as deferred charges and amortized over the term of the related debt. In the fund financial statements, governmental fund types recognize bond premiums and discounts, as well as bond issuance costs, during the current period. The face amount of debt issued is reported as other financing sources. Issuance costs, whether or not withheld from the actual debt proceeds received, are reported as debt service expenditures.
O. Restricted Net Assets For the Government-wide statement of net assets, net assets are reported as restricted when constraints placed on net asset use are either:
• Externally imposed by creditors (such as debt covenants), grantors, contributors, or laws or regulations of other governments;
• Imposed by law through constitutional provisions or enabling legislation.
73

Cedar Rapids Community School District
Notes to the Financial Statements
June 30, 2005
1. Summary of Significant Accounting Policies (continued)
P. Fund Balances of Fund Financial Statements Reservations of fund balances for encumbrances, inventories, prepaid items, categorical programs and long-term notes receivable represent amounts that are not available for appropriation. Q. Interfund Transactions Interfund services provided and used are accounted for as revenues in the “selling” fund and expenditures in the “purchasing” fund. Transactions that constitute reimbursements to a fund for expenditures initially made from it that are properly applicable to another fund are recorded as expenditures in the reimbursing fund and as reductions of expenditures in the fund that is reimbursed. All other interfund transactions are reported as transfers. 2. Budgeting and Budgetary Control The budgetary comparison and related disclosures are reported as Required Supplementary Information. 3. Deposits and Investments The District’s deposits in banks at June 30, 2005 were entirely covered by federal depository insurance or by the State Sinking Fund in accordance with Chapter 12C of the Code of Iowa. This chapter provides for additional assess-ments against the depositories to insure there will be no loss of public funds. The District is authorized by statute to invest public funds in obligations of the United States government, its agencies and instrumentalities; certificates of deposit or savings accounts in federally insured depository institutions approved by the Board of Education; prime eligible bankers acceptances; certain high rated commercial paper; perfected repurchase agreements; certain registered open-end management investment companies; certain joint investment trusts; and warrants or improvement certificates of a drainage district. During the year ended June 30, 2005, the District invested primarily in savings accounts, which are considered cash equivalents.
74

Cedar Rapids Community School District
Notes to the Financial Statements
June 30, 2005
3. Deposits and Investments (continued) At June 30, 2005, the District also had investments in the Iowa Schools Joint Investment Trust as follows: Amortized Cost Fixed Term Flexible Withdrawal Certificate of Deposit – deposited with Wells Fargo Bank NA $ 2,000,000 The investments are valued at an amortized cost pursuant to Rule 2a-7 under the Investment Company Act of 1940. Interest rate risk - The District’s investment policy limits the investment of operating funds (funds expected to be expended in the current budget year or within 15 months of receipt) in instruments that mature within 397 days. Funds not identified as operating funds may be invested in investments with maturities longer than 397 days but the maturities shall be consistent with the needs and use of the District. Credit risk - The investment with Wells Fargo Bank through the Iowa Schools Joint Investment Trust was rated Aaa by Moody’s Investors Service. 4. Due from Government Agencies The following amounts are due to the General Fund of the District by various local, state and federal government agencies at June 30, 2005: Tuition from other districts $1,900,682 IDEA part B grant 489,163 Title I program 382,430 Non-public transportation 302,939 Foster care/district court claim 243,788 Perkins grant 153,034 Other 184,752 $3,656,788
75
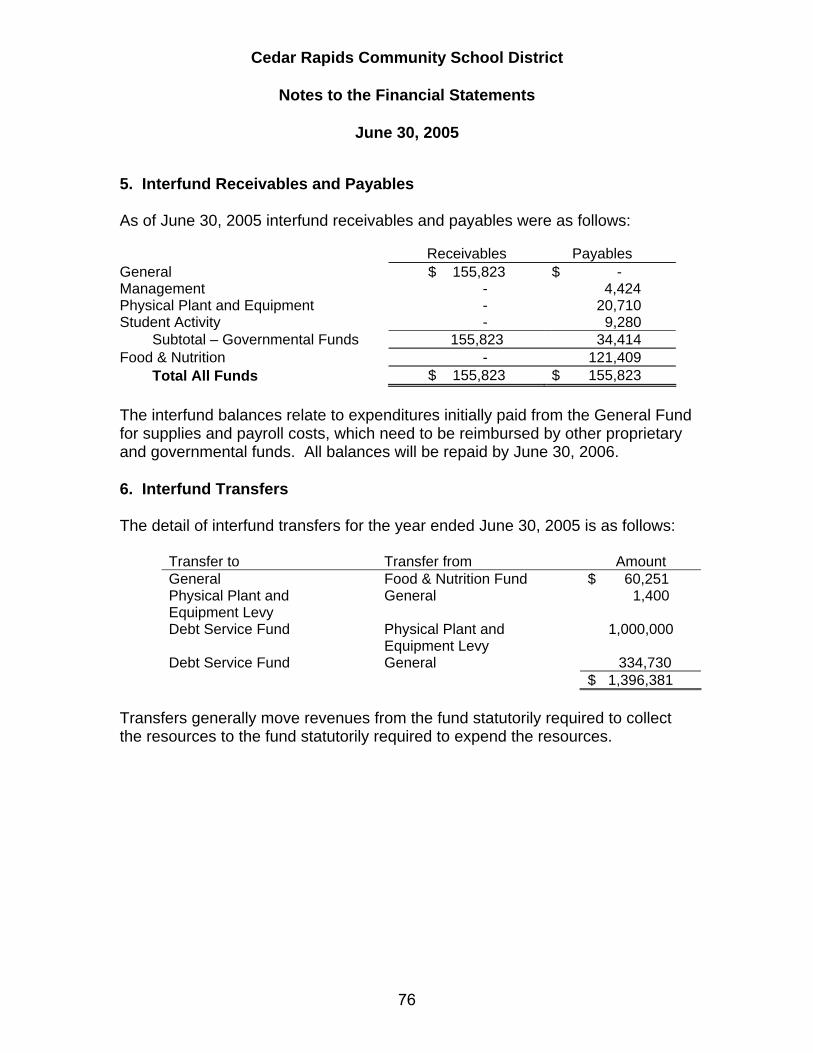
Cedar Rapids Community School District
Notes to the Financial Statements
June 30, 2005
5. Interfund Receivables and Payables As of June 30, 2005 interfund receivables and payables were as follows: Receivables Payables General $ 155,823 $ - Management - 4,424 Physical Plant and Equipment - 20,710 Student Activity - 9,280 Subtotal – Governmental Funds 155,823 34,414 Food & Nutrition - 121,409 Total All Funds $ 155,823 $ 155,823 The interfund balances relate to expenditures initially paid from the General Fund for supplies and payroll costs, which need to be reimbursed by other proprietary and governmental funds. All balances will be repaid by June 30, 2006. 6. Interfund Transfers The detail of interfund transfers for the year ended June 30, 2005 is as follows:
Transfer to Transfer from Amount General Food & Nutrition Fund $ 60,251 Physical Plant and Equipment Levy
General 1,400
Debt Service Fund Physical Plant and Equipment Levy
1,000,000
Debt Service Fund General 334,730 $ 1,396,381
Transfers generally move revenues from the fund statutorily required to collect the resources to the fund statutorily required to expend the resources.
76

Cedar Rapids Community School District
Notes to the Financial Statements
June 30, 2005
7. Capital Assets Capital asset balances and activity for the year ended June 30, 2005 were as follows:
Beginning Retirements EndingBalance Additions and Transfers Balance
Governmental activities:Capital assets, not being depreciated: Land 8,367,636$ 61,709$ -$ 8,429,345$ Construction in progress 31,285,654 4,615,227 (17,103,053) 18,797,828 Total capital assets, not being depreciated 39,653,290 4,676,936 (17,103,053) 27,227,173 Capital assets, being depreciated: Buildings and improvements 48,124,320 20,660,158 - 68,784,478 Furniture and equipment 16,038,856 685,178 (572,784) 16,151,250 Vehicles 7,492,455 674,411 (397,617) 7,769,249 Total capital assets being depreciated 71,655,631 22,019,747 (970,401) 92,704,977
Less accumulated depreciation for: Buildings and improvements 32,569,882 1,089,433 - 33,659,315 Furniture and equipment 12,794,196 666,696 (565,285) 12,895,607 Vehicles 5,139,965 517,907 (393,293) 5,264,579 Total accumulated depreciation 50,504,043 2,274,036 (958,578) 51,819,501
Total capital assets, being depreciated, net 21,151,588 19,745,711 (11,823) 40,885,476
Governmental activities capital assets, net 60,804,878$ 24,422,647$ (17,114,876)$ 68,112,649$
Business-type activities: Furniture and equipment 2,601,084$ 15,888$ (1,399)$ 2,615,573$ Less accumulated depreciation: 2,078,396 85,413 (1,399) 2,162,410 Business-type activities capital assets, net 522,688$ (69,525)$ -$ 453,163$
Depreciation expense was charged to governmental functions as follows: Instruction 1,464,938$ Instructional staff services 217,756 General administration services 4,402 School administration services 2,112 Business services 46,455 Operations & maintenance 109,314 Student transportation 405,643 Central services 23,416 Total 2,274,036$
During 1995, the District completed an inventory of its capital assets, including the property and equipment held by the School Nutrition Fund. The District used the historical cost of the capital asset, if available, or estimated a historical cost using industry back trending factors. Approximately $13.1 million of the total historical cost balance was estimated.
77
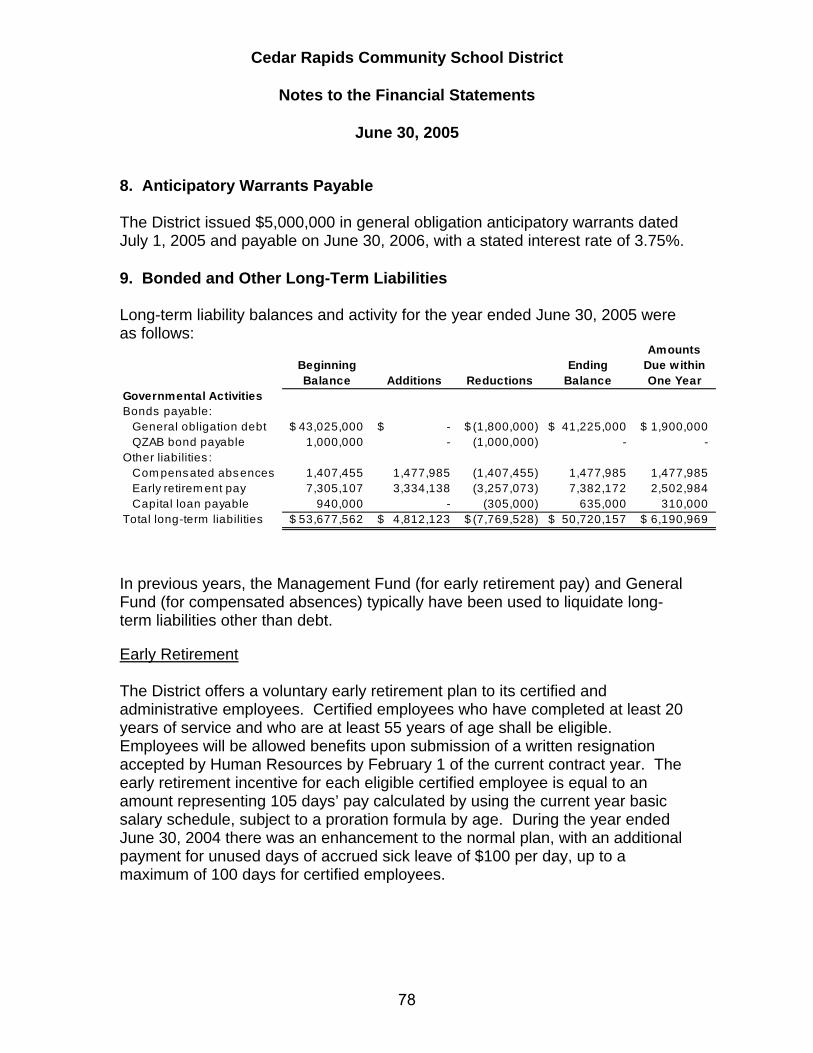
Cedar Rapids Community School District
Notes to the Financial Statements
June 30, 2005
8. Anticipatory Warrants Payable The District issued $5,000,000 in general obligation anticipatory warrants dated July 1, 2005 and payable on June 30, 2006, with a stated interest rate of 3.75%. 9. Bonded and Other Long-Term Liabilities Long-term liability balances and activity for the year ended June 30, 2005 were as follows:
AmountsBeginning Ending Due withinBalance Additions Reductions Balance One Year
Governmental ActivitiesBonds payable: General obligation debt 43,025,000$ -$ (1,800,000)$ 41,225,000$ 1,900,000$ QZAB bond payable 1,000,000 - (1,000,000) - - Other liabilities : Com pensated absences 1,407,455 1,477,985 (1,407,455) 1,477,985 1,477,985 Early retirem ent pay 7,305,107 3,334,138 (3,257,073) 7,382,172 2,502,984 Capital loan payable 940,000 - (305,000) 635,000 310,000 Total long-term liabilities 53,677,562$ 4,812,123$ (7,769,528)$ 50,720,157$ 6,190,969$
In previous years, the Management Fund (for early retirement pay) and General Fund (for compensated absences) typically have been used to liquidate long-term liabilities other than debt. Early Retirement The District offers a voluntary early retirement plan to its certified and administrative employees. Certified employees who have completed at least 20 years of service and who are at least 55 years of age shall be eligible. Employees will be allowed benefits upon submission of a written resignation accepted by Human Resources by February 1 of the current contract year. The early retirement incentive for each eligible certified employee is equal to an amount representing 105 days’ pay calculated by using the current year basic salary schedule, subject to a proration formula by age. During the year ended June 30, 2004 there was an enhancement to the normal plan, with an additional payment for unused days of accrued sick leave of $100 per day, up to a maximum of 100 days for certified employees.
78

Cedar Rapids Community School District
Notes to the Financial Statements
June 30, 2005
9. Bonded and Other Long-Term Liabilities (continued) Early Retirement (continued) The District will pay eligible employees an early retirement benefit to be contributed by the district directly to a tax-sheltered annuity owned by the employee and qualifying under section 403(b) of the Internal Revenue Code of 1986, as amended. An employee may choose to receive the accumulated days’ salary in equal annual installments spread out over three to five years beginning in October of the same year following early separation. Administrators age 55 through 65 whose age plus years of service with the District totals 75 shall be eligible for early retirement pay. Administrators will be allowed benefits upon submission of a written resignation accepted by the Board of Directors. The early retirement incentive for each eligible administrative employee is equal to an amount representing 195 days’ pay. The daily rate of pay shall be the administrator’s contract salary in effect during the last full year of employment. During the year ended June 30, 2004 there was an enhancement to the normal plan, with an additional payment for unused days of accrued sick leave of $100 per day, up to a maximum of 100 days for administrators. The District will pay eligible employees an early retirement benefit to be contributed by the district directly to a tax-sheltered annuity owned by the employee and qualifying under section 403(b) of the Internal Revenue Code of 1986, as amended. An administrator may choose to receive the accumulated days’ salary in equal annual installments spread out over four or five years beginning in October of the same year following early separation. Early retirement benefits paid during the year ended June 30, 2005 totaled $3,257,073, of which the Management Fund paid $3,113,471 and the General Fund paid $143,602. The cost of early retirement payments expected to be liquidated currently are recorded as a liability of the Management and General Funds. A liability has been recorded in the government-wide financial statements representing the District’s commitment to fund non-current early retirement benefits.
79

Cedar Rapids Community School District
Notes to the Financial Statements
June 30, 2005
9. Bonded and Other Long-Term Liabilities (continued) Bonded Debt Details of the District’s June 30, 2005 bonded indebtedness are as follows:
Year Ending June 30, Principal Interest Total
2006 $ 2,210,000 $ 2,021,043 $ 4,231,043 2007 2,250,000 1,922,088 4,172,088 2008 2,050,000 1,820,863 3,870,863 2009 2,075,000 1,724,238 3,799,238 2010 2,200,000 1,626,125 3,826,125
2011-2015 12,575,000 6,447,450 19,022,450 2016-2020 15,700,000 3,113,700 18,813,700
2021 2,800,000 140,000 2,940,000
Totals $41,860,000 $18,815,507 $60,675,507
As of June 30, 2005 the District did not exceed its legal debt margin of $209,902,198. 10. Pension and Retirement Benefits The District contributes to the Iowa Public Employees Retirement System (IPERS), which is a cost-sharing multiple-employer defined benefit pension plan administered by the State of Iowa. IPERS provides retirement and death benefits which are established by State statute to plan members and beneficiaries. IPERS issues a publicly available financial report that includes financial statements and required supplementary information. The report may be obtained by writing to IPERS, P.O. Box 9117, Des Moines, Iowa, 50306-9117. Plan members are required to contribute 3.70% of their annual salary and the District is required to contribute 5.75% of annual covered payroll. Contribution requirements are established by State statute. The District’s contribution to IPERS for the years ended June 30, 2005, 2004 and 2003 were $5,601,896, $5,552,662 and $5,694,142 respectively, equal to the required contribution for each year.
80

Cedar Rapids Community School District
Notes to the Financial Statements
June 30, 2005
11. Post-Employment Benefits Other Than Pension Benefits The District provides two types of post-employment benefits other than pension benefits: health insurance and life insurance. These benefits are provided to qualified employees under collective bargaining agreements and are financed and accounted for on a pay-as-you-go-basis. Therefore, no liability has been actuarially determined or provided for in the financial statements. Health Insurance For the employee groups of teachers, administrators, supervisor/technicians, confidential secretaries, custodial/maintenance, food service and secretary/clerical, the District provides for health insurance coverage under contract provisions for those electing early retirement. The District pays the premium amount specified in the individual contracts on the date of separation. Administrators An administrator electing early retirement shall continue to receive health insurance coverage, not to exceed the cost of the premium on the date of separation of the Alliance Select Standard family plan. Coverage shall cease when the retired employee reaches age 65, secures other employment covered by a health insurance program or dies. When an administrator who has elected early separation reaches age 65, his/her spouse shall continue to receive the premium for a period not to exceed three years or age 65. The spouse of an administrator who has elected early retirement or has attained eligibility for early retirement, shall, upon death of the administrator, continue to receive health insurance until the date the deceased administrator would have reached age 65. In no instance shall the spouse continue to receive health insurance for a period longer than ten years. For the year ended June 30, 2005 the District recognized $140,664 in expenditures for 22 former employees. Teachers For a certified employee electing early retirement, the District shall continue to pay the premium for the elected health coverage selected on the date of early separation. Coverage shall cease when the retired employee reaches age 65, secures other employment or dies. For the year ended June 30, 2005, the District recognized $1,131,329 in expenditures for 247 former employees. Supervisors/Technicians/Confidential Secretaries For an employee electing early retirement, the District shall continue to pay the premium for the elected health coverage, in an amount not to exceed the premium for the Alliance Select Standard plan on the date of early separation. Coverage shall cease when the retired employee reaches age 65, secures other
81

Cedar Rapids Community School District
Notes to the Financial Statements
June 30, 2005
11. Post-Employment Benefits Other Than Pension Benefits (continued) employment covered by a health insurance program or dies. For the year ended June 30, 2005 the District recognized $11,405 in expenditures for 2 former employees. Custodial/Maintenance/Food Service/Secretary/Clerical Employees who separate from the District before becoming eligible for Medicare shall have the option to continue participation in the District’s health insurance plan. The employee must be at least age 55 and must have completed at least 20 years of service with the District. The District will pay the cost of the premium specified in the individual group contracts. Coverage shall cease when the retired employee reaches age 65, secures other employment covered by a health insurance program or dies. For the year ended June 30, 2005 the District recognized $59,334 in expenditures for 19 former employees. Life Insurance An administrator electing early retirement as provided above shall continue to receive life insurance coverage and an accidental death and dismemberment benefit of $100,000 until the administrator secures other employment covered by a life insurance program or reaches age 65. For the year ended June 30, 2005, 24 administrators had qualified under this provision, with the District recognizing $4,293 in expenditures. 12. Construction Contractual Commitments Total outstanding contractual commitments for construction projects at June 30, 2005 for the Physical, Plant and Equipment Fund was $913,926 and for the Capital Projects Fund was $953,910. 13. Risk Management The District is exposed to various risks of loss related to torts; theft; damage to and destruction of assets; errors and omissions; injuries to employees; and natural disasters. These risks are covered by the purchase of commercial insurance. The District assumes liability for any deductibles and claims in excess of coverage limitations. There has been no significant reduction in insurance coverage from the prior year. Settled claims resulting from these risks have not exceeded commercial insurance coverage in any of the past three fiscal years.
82

Cedar Rapids Community School District
Notes to the Financial Statements
June 30, 2005
14. Area Education Agency The District is required by the Code of Iowa to budget for its share of special education support, media and educational services provided through Grant Wood Area Education Agency. The District’s actual amount for this purpose totals $5,231,164 for the year ended June 30, 2005. The District’s budgeted and actual share is included in these financial statements. 15. Deficit Fund Equity The Management Special Revenue Fund had a deficit fund balance of $253,177 as of June 30, 2005. The deficit relates to early retirement benefits for teachers and administrators retiring at the end of the 2004-2005 school year that are recorded on the accrual basis, but paid in the following year. Local property taxes have been increased in fiscal year 2006 to fund these costs. 16. New Pronouncements The District adopted Governmental Accounting Standards Board (GASB) Statement No. 40, Deposit and Investment Risk Disclosures, during the year ended June 30, 2005. This statement establishes and modifies disclosure requirements related to investment risks related to credit risk, concentration of credit risk, interest rate risk, and foreign currency risk. As an element of interest rate risk, this Statement requires certain disclosures of investments that have fair values that are highly sensitive to changes in interest rates. This statement also establishes and modifies disclosure requirements for deposit risks. As of June 30, 2005, the Governmental Accounting Standards Board had issued the following statements not yet implemented by the District. The Statements, which may impact the District, are as follows: Statement No. 42, Accounting and Financial Reporting for Impairment of Capital Assets and for Insurance Recoveries, issued November 2003, will be effective for the District beginning with its year ending June 30, 2006. This Statement requires governments to report the effects of capital asset impairment in their financial statements when it occurs and requires all governments to account for insurance recoveries in the same manner.
83

Cedar Rapids Community School District
Notes to the Financial Statements
June 30, 2005
16. New Pronouncements (continued) Statement No. 43, Financial Reporting for Postemployment Benefit Plans Other Than Pension Plans, issued April 2004, will be effective for the District beginning with its year ending June 30, 2007. The Statement establishes uniform financial reporting standards for other postemployment benefit plans (OPEB) and supercedes existing guidance. Statement No. 44, Economic Condition Reporting: The Statistical Section, issued in May 2004, will be effective for the District beginning with its year ending June 30, 2006. The Statement improves the understandability and usefulness of the statistical section information by addressing the comparability problems that have developed in practice and by adding information from the new financial reporting model required by Statement No. 34 and related statements. Statement No. 45, Accounting and Financial Reporting by Employers for Postemployment Benefits Other Than Pensions, issued June 30, 2004, will be effective for the District beginning with its year ending June 30, 2008. The Statement requires governments to report any liability associated with providing employees benefits other than pensions subsequent to their employment with the District that have not been fully funded. The District’s management has not yet determined the effect these Statements will have on the District’s financial statements.
84

Required Supplementary Information
85

86

ActualOriginal Final (GAAP Basis)
Revenues:Local Taxes 52,451,079$ 52,451,079$ 52,293,616$ -$ (157,463)$ Tuition 5,353,000 5,205,000 5,320,560 (148,000) 115,560 Other local sources 4,304,229 5,157,628 5,239,098 853,399 81,470 State sources 75,306,522 75,717,713 75,227,103 411,191 (490,610) Federal sources 5,040,330 6,368,210 5,354,949 1,327,880 (1,013,261) Total revenues 142,455,160 144,899,630 143,435,326 2,444,470 (1,464,304)
Expenditures:Instruction:
Regular instruction 43,324,115 41,764,473 41,287,198 1,559,642 477,275 Special instruction 46,406,920 48,056,099 46,518,919 (1,649,179) 1,537,180 Vocational instruction 948,908 947,011 950,062 1,897 (3,051) Other instruction 2,332,894 2,460,023 2,496,671 (127,129) (36,648) Total instruction 93,012,837 93,227,606 91,252,850 (214,769) 1,974,756
Support Services:Student services 3,428,154 3,447,354 3,305,725 (19,200) 141,629 Instructional staff services 9,623,429 10,521,082 9,585,545 (897,653) 935,537 General administration services 1,241,160 1,109,261 1,394,156 131,899 (284,895) Building administration services 7,516,014 7,450,689 7,569,451 65,325 (118,762) Business services 3,892,666 3,894,550 3,408,382 (1,884) 486,168 Operations and maintenance 10,692,332 10,327,698 10,330,323 364,634 (2,625) Student transportation 2,185,616 2,019,853 2,073,076 165,763 (53,223) Total support services 38,579,371 38,770,487 37,666,658 (191,116) 1,103,829
Non-instructional programs:Community services 2,322,464 2,454,905 2,347,160 (132,441) 107,745
Other expenditures:Other support services 5,231,164 5,231,164 5,231,164 - - Total expenditures 139,145,836 139,684,162 136,497,832 (538,326) 3,186,330
Excess (deficiency) of revenues over expenditures 3,309,324 5,215,468 6,937,494 1,906,144 1,722,026
Other Financing Sources (uses):Sale of assets 7,000 7,000 - - (7,000) Transfers in - - 60,251 - 60,251 Transfers out (274,151) (274,151) (336,130) - (61,979) Total other financing sources (uses) (267,151) (267,151) (275,879) - (8,728)
Net change in fund balances 3,042,173 4,948,317 6,661,615 1,906,144 1,713,298
Fund balance--Beginning 10,107,759 10,107,759 10,107,759 - -
Fund balance--Ending 13,149,932$ 15,056,076$ 16,769,374$ 1,906,144$ 1,713,298$
Budget AmountsOriginal to Final Final to Actual
Cedar Rapids Community School District
Budgetary Comparison Schedule for the General Fund
For the Year Ended June 30, 2005
Variances --Positive (Negative)
87

ActualOriginal Final (GAAP Basis)
Revenues:Property Taxes 5,835,000$ 5,835,000$ 5,808,554$ -$ (26,446)$ Other local sources 10,000 10,000 116,008 - 106,008 State sources 4,000 4,000 4,422 - 422 Total revenues 5,849,000 5,849,000 5,928,984 - 79,984
Expenditures:Instruction:
Regular instruction 4,356,610 3,322,217 2,821,106 1,034,393 501,111 Special instruction - - 254,521 - (254,521) Total instruction 4,356,610 3,322,217 3,075,627 1,034,393 246,590
Support Services:Student services - - 4,658 - (4,658) Instructional staff services - - 140,379 - (140,379) General administration services 245,991 309,491 141,355 (63,500) 168,136 Building administration services 258,780 258,780 642,164 - (383,384) Business services - - 56,314 - (56,314) Operations and maintenance 672,710 704,710 868,836 (32,000) (164,126) Student transportation 203,013 198,013 333,324 5,000 (135,311) Total support services 1,380,494 1,470,994 2,187,030 (90,500) (716,036)
Non-instructional programsCommunity services 108,896 108,896 92,645 - 16,251 Total non-instructional programs 108,896 108,896 92,645 - 16,251 Total expenditures 5,846,000 4,902,107 5,355,302 943,893 (453,195)
Net change in fund balances 3,000 946,893 573,682 (943,893) 533,179
Fund balance--Beginning (826,859) (826,859) (826,859) - -
Fund balance--Ending (823,859)$ 120,034$ (253,177)$ 943,893$ (373,211)$
Positive (Negative)Budget Amounts
Original to Final Final to Actual
Cedar Rapids Community School District
Budgetary Comparison Schedule for the Management Fund
For the Year Ended June 30, 2005
Variances --
88

ActualOriginal Final (GAAP Basis)
Revenues:Property Taxes 4,221,043$ 4,221,043$ 4,197,779$ -$ (23,264)$ Other local sources 157,000 157,000 178,709 - 21,709 State sources 3,000 3,000 3,036 - 36 Federal sources - - 91,233 - 91,233 Total revenues 4,381,043 4,381,043 4,470,757 - 89,714
Expenditures:Instruction:
Regular instruction - - 41,420 - (41,420) Total instruction - - 41,420 - (41,420)
Support Services:Business services - - 4,079 - (4,079) Operations and maintenance - - 137,864 - (137,864) Student transportation 636,000 636,000 518,027 - 117,973 Total support services 636,000 636,000 659,970 - (23,970)
Other expenditures:Capital outlay: Facilities acquisition 3,475,409 3,475,409 4,829,632 - (1,354,223) Total other expenditures 3,475,409 3,475,409 4,829,632 - (1,354,223) Total expenditures 4,111,409 4,111,409 5,531,022 - (1,419,613)
Excess (deficiency) of revenues over expenditures 269,634 269,634 (1,060,265) - (1,329,899)
Other Financing Sources (Uses):Transfers in - - 1,400 - 1,400 Transfers out (219,000) (219,000) (1,000,000) - (781,000)
(219,000) (219,000) (998,600) - (779,600)
Net change in fund balances 50,634 50,634 (2,058,865) - (2,109,499)
Fund balance--Beginning 5,830,061 5,830,061 5,830,061 - -
Fund balance--Ending 5,880,695$ 5,880,695$ 3,771,196$ -$ (2,109,499)$
Positive (Negative)Budget Amounts
Original to Final Final to Actual
Cedar Rapids Community School District
Budgetary Comparison Schedule for the Physical Plant and Equipment Levy Fund
For the Year Ended June 30, 2005
Variances --
89

ActualOriginal Final (GAAP Basis)
Revenues:Other local sources 500,000$ 500,000$ 1,081,239$ -$ 581,239$ Federal sources - - 469,150 - 469,150 Total revenues 500,000 500,000 1,550,389 - 1,050,389
Expenditures:Other expenditures:
Capital outlay: Facilities acquisition 3,701,486 3,774,459 4,633,535 (72,973) (859,076)
Net change in fund balances (3,201,486) (3,274,459) (3,083,146) 72,973 1,909,465
Fund balance--Beginning 4,944,520 4,944,520 4,944,520 - -
Fund balance--Ending 1,743,034$ 1,670,061$ 1,861,374$ (72,973)$ 191,313$
Positive (Negative)Budget Amounts Original to
Final Final to Actual
Cedar Rapids Community School District
Budgetary Comparison Schedule for the Capital Projects Fund
For the Year Ended June 30, 2005
Variances --
90

ActualOriginal Final (GAAP Basis)
Revenues:Other local sources 3,980,000$ 3,980,000$ 4,332,432$ -$ 352,432$ Total revenues 3,980,000 3,980,000 4,332,432 - 352,432
Expenditures:Instruction:
Other instruction 4,000,000 4,000,000 4,065,361 - (65,361)
Net change in fund balances (20,000) (20,000) 267,071 - 417,793
Fund balance--Beginning 679,272 679,272 679,272 - -
Fund balance--Ending 659,272$ 659,272$ 946,343$ -$ 287,071$
Positive (Negative)Budget Amounts Original to
Final Final to Actual
Cedar Rapids Community School District
Budgetary Comparison Schedule for the Student Activity Fund
For the Year Ended June 30, 2005
Variances --
91

ActualOriginal Final (GAAP Basis)
Revenues:Property Taxes 3,895,463$ 3,895,463$ 3,885,949$ -$ (9,514)$ Other local sources - - 22,886 - 22,886 State sources - - 2,810 - 2,810 Total revenues 3,895,463 3,895,463 3,911,645 - 16,182
Expenditures:Other expenditures:
Debt service: Principal 2,324,000 2,324,000 3,105,000 - (781,000) Interest 2,114,793 2,114,793 2,115,993 - (1,200) Total expenditures 4,438,793 4,438,793 5,220,993 - (782,200)
Excess (deficiency) of revenues over expenditures (543,330) (543,330) (1,309,348) - (766,018)
Other Financing Sources (Uses):Transfers in 553,330 553,330 1,334,730 - 781,400
553,330 553,330 1,334,730 - 781,400
Net change in fund balances 10,000 10,000 25,382 - (766,018)
Fund balance--Beginning 714 714 714 - -
Fund balance--Ending 10,714$ 10,714$ 26,096$ -$ 15,382$
Positive (Negative)Budget Amounts
Original to Final Final to Actual
Cedar Rapids Community School District
Budgetary Comparison Schedule for the Debt Service Fund
For the Year Ended June 30, 2005
Variances --
92

Cedar Rapids Community School District
Notes to Required Supplementary Information – Budgetary Reporting
Year ended June 30, 2005 The Board of Directors annually adopts a budget on a basis consistent with generally accepted accounting principles. In accordance with the code of Iowa, annual budgets are adopted for the General, Management, Student Activity, Physical Plant and Equipment, Capital Projects, Debt Service and School Nutrition Funds as a whole. Appropriations lapse at fiscal year-end and then are reappropriated for the next year, if necessary. Around January 15 of each year, all departments of the District must submit budget requests to the Executive Director of Business Services so that the budget for the next fiscal year may be prepared. The budget is prepared by fund, function, program, object and facility and is presented in the 2004-05 Budget document. The 2004-05 Budget also includes information on the past year, current year estimates, requested appropriations for the next fiscal year and the number of full-time equivalent personnel available to be utilized next year. Before March 1, the proposed budget is presented to the Board of Directors for review. The Board of Directors holds public hearings and may add to, subtract from or change appropriations, but may not change the form of the budget. The budget must be adopted by an affirmative vote of a majority of the Board of Directors by April 15. Once adopted, the budget can be amended through the same process, with all budget amendments to be completed by May 31 of the budget year affected. For 2004-2005, amendments increased the instructional functional area by $2,583,801, total support services by $3,886,201 and the non-instructional programs by $1,181,615. These increases all relate to wage settlements that were higher than initially projected by the District. Total other expenditures was increased by $2,628,864 for facilities construction costs. The budgetary data presented in the required supplementary information reflect all approved budget amendments. The Code of Iowa also provides that District expenditures in the General Fund may not exceed the amount authorized by the school finance formula. Formal and legal budgetary control for the certified budget is based upon four major classes of expenditures known as functional areas, not by fund or fund type. These four functional areas are instruction, support services, non-instructional programs and other expenditures.
93

Cedar Rapids Community School District
Notes to Required Supplementary Information – Budgetary Reporting
Year ended June 30, 2005 It is the actual expenditures in each of these categories that are compared at year-end to the “certified” spending levels to determine whether or not the district has exceeded its certified budget in any one of these respective categories. During the year, expenditures in each of these four functional categories did not exceed the certified budget. The following is a comparison of the certified budget with the actual results for the year ended June 30, 2005:
Certified Budget
Actual
Variance- Favorable
(Unfavorable) Expenditures:
Instruction $102,781,350 $ 98,435,258 $ 4,346,092 Support Services 45,075,853 40,513,658 4,562,195 Non-instructional Programs 9,201,079 8,518,040 683,039 Other Expenditures 19,919,825 19,915,324 4,501 Total Expenditures $176,978,107 $167,382,280 $ 9,595,827
The legal level of control (the level at which expenditures may not legally exceed appropriations) is the functional area level for all funds combined rather than at the individual fund level. Management can transfer within functional area, within fund type, without approval of the governing body. It is necessary, therefore, to aggregate the expenditures of the budgeted activities within the governmental funds on a functional area basis and to compare such functional area totals to functional area budgeted totals in order to demonstrate legal compliance with the budget. In addition, the School Nutrition Enterprise Fund is included in the certified budget figures but not in the budgetary comparison schedules, which includes only governmental fund types. The District utilizes encumbrance accounting for budgetary control purposes. Obligations incurred for goods and services that have not been received or rendered are recorded to reserve that portion of the applicable fund balances. Encumbrances of $809,174 in the General Fund, $1,996,702 in the Physical Plant and Equipment Levy Fund and $1,488,894 in the Capital Projects Fund were carried forward to fiscal year 2005-2006.
94
Supplemental Information
95

96

Cedar Rapids Community School District
General Fund The General Fund accounts for all revenues and expenditures traditionally associated with government, which are not required legally or by sound financial management to be accounted for in other funds. The District’s General Fund is the operating fund that is used to account for most of the instructional and administrative aspects of the District’s operations. The Fund’s revenue consists primarily of local property taxes, and state and federal government aid.
97
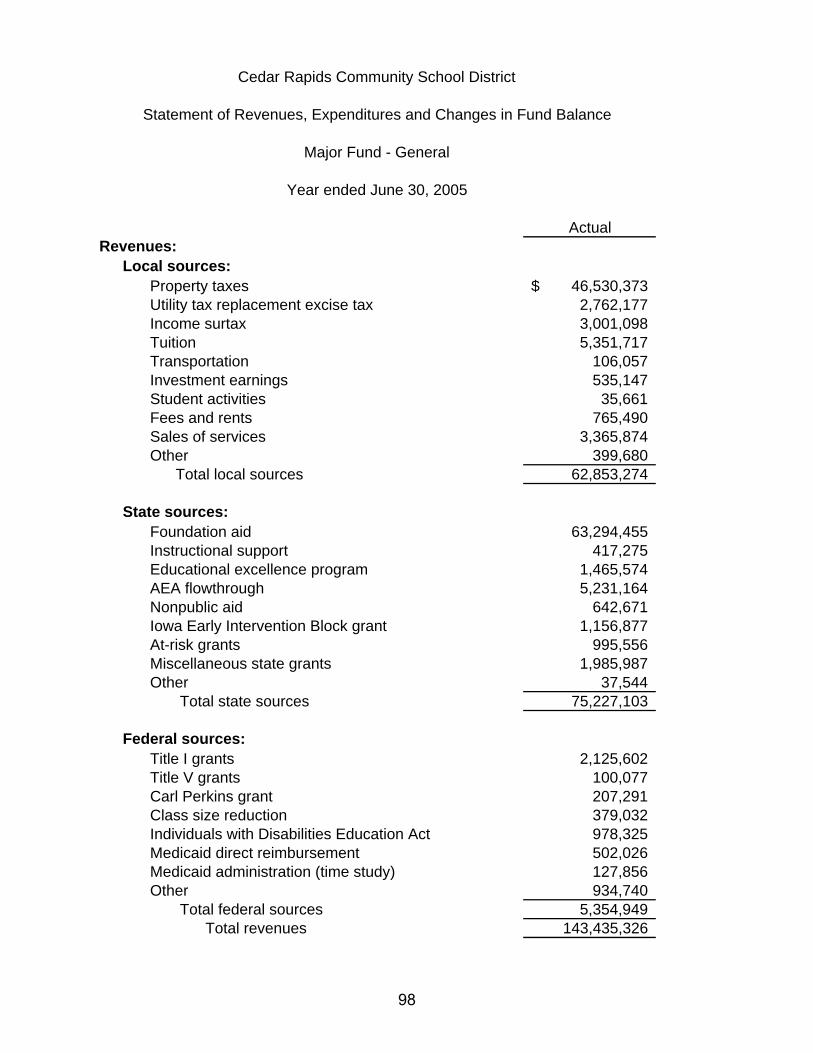
Cedar Rapids Community School District
Statement of Revenues, Expenditures and Changes in Fund Balance
Major Fund - General
Year ended June 30, 2005
ActualRevenues:
Local sources:Property taxes 46,530,373$ Utility tax replacement excise tax 2,762,177Income surtax 3,001,098Tuition 5,351,717Transportation 106,057Investment earnings 535,147Student activities 35,661Fees and rents 765,490Sales of services 3,365,874Other 399,680 Total local sources 62,853,274
State sources:Foundation aid 63,294,455Instructional support 417,275Educational excellence program 1,465,574AEA flowthrough 5,231,164Nonpublic aid 642,671Iowa Early Intervention Block grant 1,156,877At-risk grants 995,556Miscellaneous state grants 1,985,987Other 37,544 Total state sources 75,227,103
Federal sources:Title I grants 2,125,602Title V grants 100,077Carl Perkins grant 207,291Class size reduction 379,032Individuals with Disabilities Education Act 978,325Medicaid direct reimbursement 502,026Medicaid administration (time study) 127,856Other 934,740 Total federal sources 5,354,949 Total revenues 143,435,326
98

Cedar Rapids Community School District
Statement of Revenues, Expenditures and Changes in Fund Balance
Major Fund - General
Year ended June 30, 2005
ActualExpenditures:
Instruction:Regular instruction: Salaries 34,499,156$ Employee benefits 11,564,566 Purchased services 2,968,662 Supplies 1,204,979 Capital outlay 536,690 Other (9,486,855)
41,287,198 Special education: Salaries 16,587,525 Employee benefits 4,795,486 Purchased services 3,299,031 Supplies 397,100 Capital outlay 193,459 Other 9,778,126
35,050,727 Other special instruction: Salaries 6,974,300 Employee benefits 2,041,352 Purchased services 601,784 Supplies 454,066 Capital outlay 48,408 Other 1,348,282
11,468,192 Vocational instruction: Salaries 617,521 Employee benefits 195,667 Purchased services 28,245 Supplies 42,075 Capital outlay 54,967 Other 11,587
950,062
(continued)
99

Cedar Rapids Community School District
Statement of Revenues, Expenditures and Changes in Fund Balance
Major Fund - General
Year ended June 30, 2005
ActualCo-curricular instruction: Salaries 1,743,087$ Employee benefits 237,921 Purchased services 180,473 Supplies 17,232 Capital outlay 1,711 Other 107,805
2,288,229 Nonpublic instruction: Purchased services 160,887 Supplies 47,555
208,442
Total instruction 91,252,850
Support services:Guidance services: Salaries 988,440 Employee benefits 737,081 Purchased services 936 Supplies 2,560
1,729,017 Health services: Salaries 1,024,574 Employee benefits 349,507 Purchased services 69,128 Supplies 26,534 Capital outlay 5,133 Other 880
1,475,756 Other student services: Salaries 89,567 Employee benefits 11,385
100,952
100

Cedar Rapids Community School District
Statement of Revenues, Expenditures and Changes in Fund Balance
Major Fund - General
Year ended June 30, 2005
ActualImprovement of instruction: Salaries 3,339,961$ Employee benefits 897,535 Purchased services 553,556 Supplies 1,324,204 Capital outlay 200,082 Other 15,141
6,330,479 Educational media: Salaries 2,083,687 Employee benefits 655,144 Purchased services 318,011 Supplies 153,324 Capital outlay 41,043 Other 3,857
3,255,066 Board of education: Purchased services 136,245 Supplies 2,091 Other 24,953
163,289 Executive administration: Salaries 788,109 Employee benefits 286,332 Purchased services 83,395 Supplies 38,413 Capital outlay 24,750 Other 9,868
1,230,867
(continued)
101
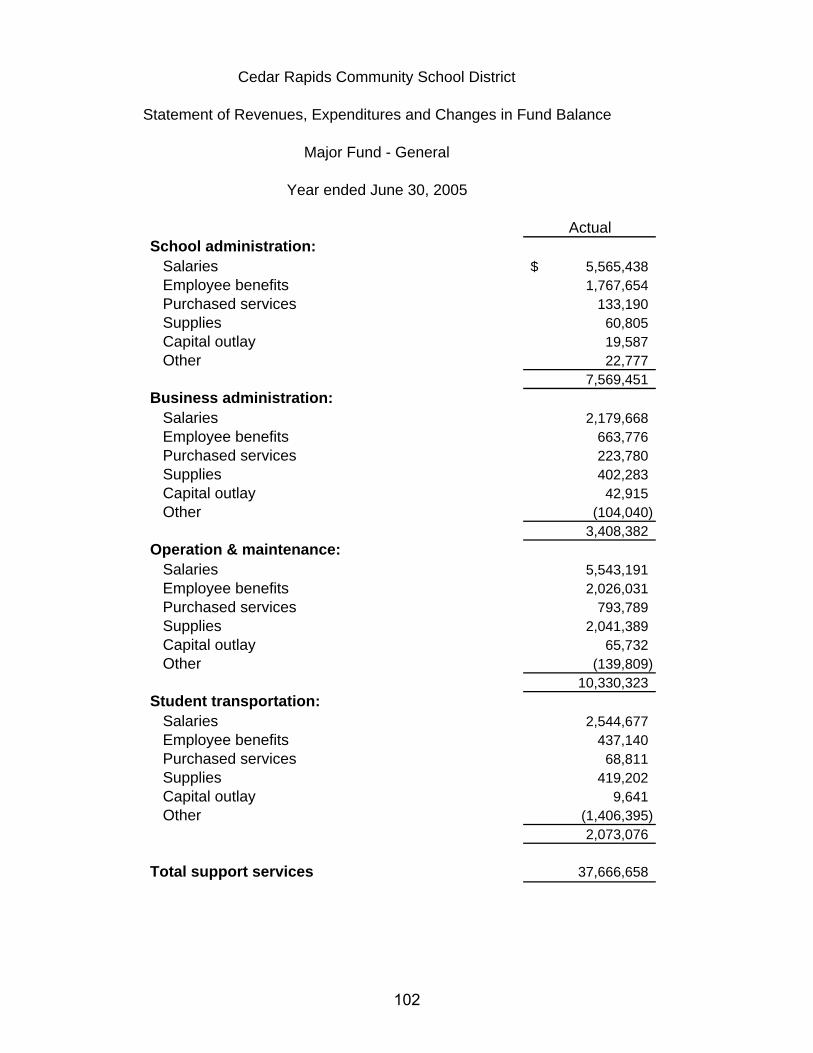
Cedar Rapids Community School District
Statement of Revenues, Expenditures and Changes in Fund Balance
Major Fund - General
Year ended June 30, 2005
ActualSchool administration: Salaries 5,565,438$ Employee benefits 1,767,654 Purchased services 133,190 Supplies 60,805 Capital outlay 19,587 Other 22,777
7,569,451 Business administration: Salaries 2,179,668 Employee benefits 663,776 Purchased services 223,780 Supplies 402,283 Capital outlay 42,915 Other (104,040)
3,408,382 Operation & maintenance: Salaries 5,543,191 Employee benefits 2,026,031 Purchased services 793,789 Supplies 2,041,389 Capital outlay 65,732 Other (139,809)
10,330,323 Student transportation: Salaries 2,544,677 Employee benefits 437,140 Purchased services 68,811 Supplies 419,202 Capital outlay 9,641 Other (1,406,395)
2,073,076
Total support services 37,666,658
102

Cedar Rapids Community School District
Statement of Revenues, Expenditures and Changes in Fund Balance
Major Fund - General
Year ended June 30, 2005
ActualNon-instructional programs:
Community service: Salaries 1,992,780$ Employee benefits 354,245 Supplies 135 Total non-instructional programs 2,347,160
Other expenditures:AEA flow-through 5,231,164 Total expenditures 136,497,832
Excess of revenues over expenditures 6,937,494
Other financing sources (uses):Transfers in 60,251 Transfers out (336,130)
(275,879)
Excess of revenues and other financing sources overexpenditures and other financing uses 6,661,615
Fund balance beginning of year 10,107,759
Fund balance end of year 16,769,374$
(concluded)
103

104

Cedar Rapids Community School District
Nonmajor Governmental Funds
Special Revenue Funds Special revenue funds are used to account for specific revenues that are legally restricted to expenditures for particular purposes.
Student Activity Fund This fund accounts for the funds raised
by student groups. Under state law the Board retains responsibility for the Student Activity Fund’s ultimate disposition.
Debt Service Funds Debt Service Fund This fund accounts for the resources
accumulated and payments made for principal and interest on long-term general obligation debt.
105

CEDAR RAPIDS COMMUNITY SCHOOL DISTRICT
Combining Balance Sheet
Non-Major Governmental Funds
June 30, 2005
TotalNon-major
Special Revenue - Debt GovernmentalStudent Activity Service Funds
AssetsCash and cash equivalents 1,000,858$ -$ 1,000,858$ Receivables: Property tax - current year delinquent - 61,736 61,736 Property tax - succeeding year - 3,901,000 3,901,000 Other 2,071 - 2,071
Total Assets 1,002,929$ 3,962,736$ 4,965,665$
Liabilities and Fund BalancesLiabilities: Accounts payable and accrued items 47,306$ 35,640$ 82,946$ Due to other funds 9,280 - 9,280 Unearned revenue: Succeeding year property tax - 3,901,000 3,901,000
Total Liabilities 56,586 3,936,640 3,993,226
Fund Balances: Unreserved and undesignated 946,343 26,096 972,439 Total Fund Balances 946,343 26,096 972,439
Total Liabilities and Fund Balances 1,002,929$ 3,962,736$ 4,965,665$
See accompanying independent auditor's report.
106
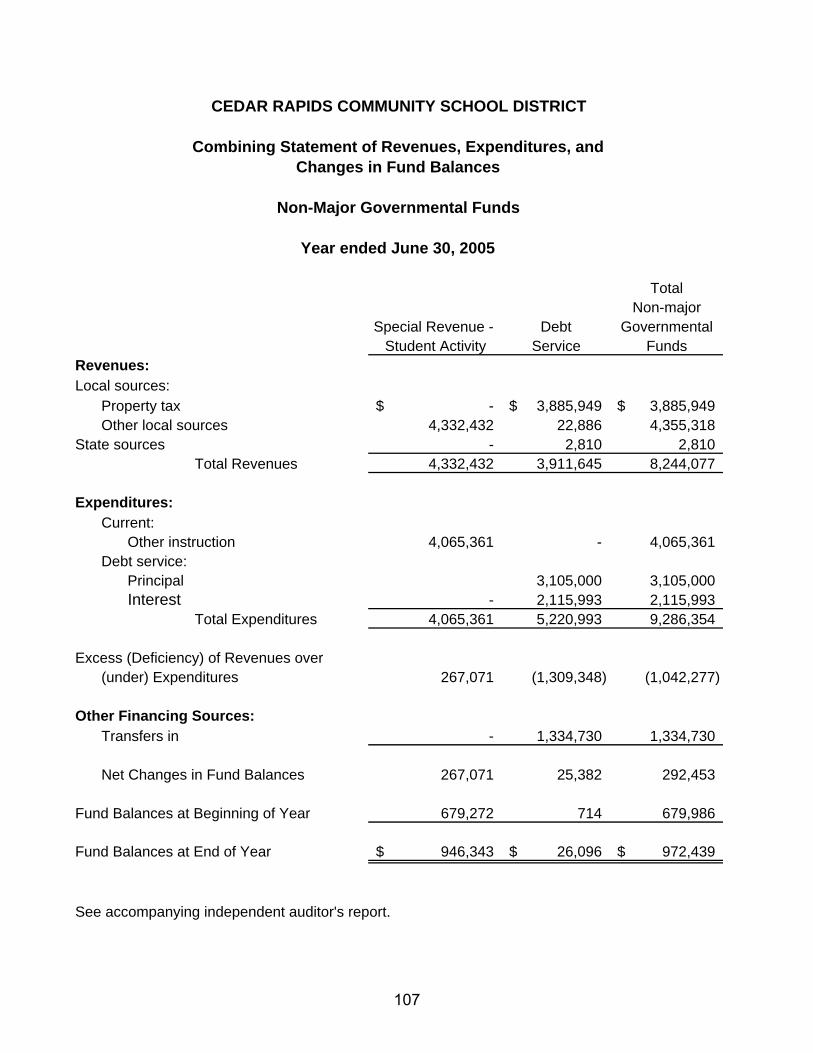
CEDAR RAPIDS COMMUNITY SCHOOL DISTRICT
Combining Statement of Revenues, Expenditures, andChanges in Fund Balances
Non-Major Governmental Funds
Year ended June 30, 2005
TotalNon-major
Special Revenue - Debt GovernmentalStudent Activity Service Funds
Revenues:Local sources:
Property tax -$ 3,885,949$ 3,885,949$ Other local sources 4,332,432 22,886 4,355,318
State sources - 2,810 2,810 Total Revenues 4,332,432 3,911,645 8,244,077
Expenditures:Current:
Other instruction 4,065,361 - 4,065,361 Debt service:
Principal 3,105,000 3,105,000 Interest - 2,115,993 2,115,993
Total Expenditures 4,065,361 5,220,993 9,286,354
Excess (Deficiency) of Revenues over(under) Expenditures 267,071 (1,309,348) (1,042,277)
Other Financing Sources:Transfers in - 1,334,730 1,334,730
Net Changes in Fund Balances 267,071 25,382 292,453
Fund Balances at Beginning of Year 679,272 714 679,986
Fund Balances at End of Year 946,343$ 26,096$ 972,439$
See accompanying independent auditor's report.
107

108

Cedar Rapids Community School District
Schedule of Changes in Fiduciary Assets and Liabilities -Agency Fund
Year ended June 30, 2005
Balance BalanceBeginning End
of Year Additions Deductions of YearAssets:
Cash 36,015$ 52,797 (49,310) 39,502$ Total assets 36,015$ 52,797 (49,310) 39,502$
Liabilities: Accounts payable 36,015$ 52,797 (49,310) 39,502$ Total liabilities 36,015$ 52,797 (49,310) 39,502$
See accompanying independent auditor's report.
109

110
Cedar Rapids Community School District
Capital Assets Used in the Operation
of Governmental Funds Capital assets, which include property, plant and equipment, are reported in the applicable governmental or business-type activities columns in the government-wide financial statements. The following schedules include the information previously reported in the general fixed assets account group.
111

Cedar Rapids Community School District
Schedule of Capital Assets - By Source
June 30, 2005
Capital Assets: Land 8,429,345$ Construction in progress 18,797,828 Buildings and improvements 68,784,478 Equipment 16,151,250 Vehicles 7,769,249
Total capital assets 119,932,150$
Investment in capital assets by source: General fund 12,264,128$ Special revenue funds 12,642,198 Capital projects funds 95,025,824
Total investment in capital assets 119,932,150$
112
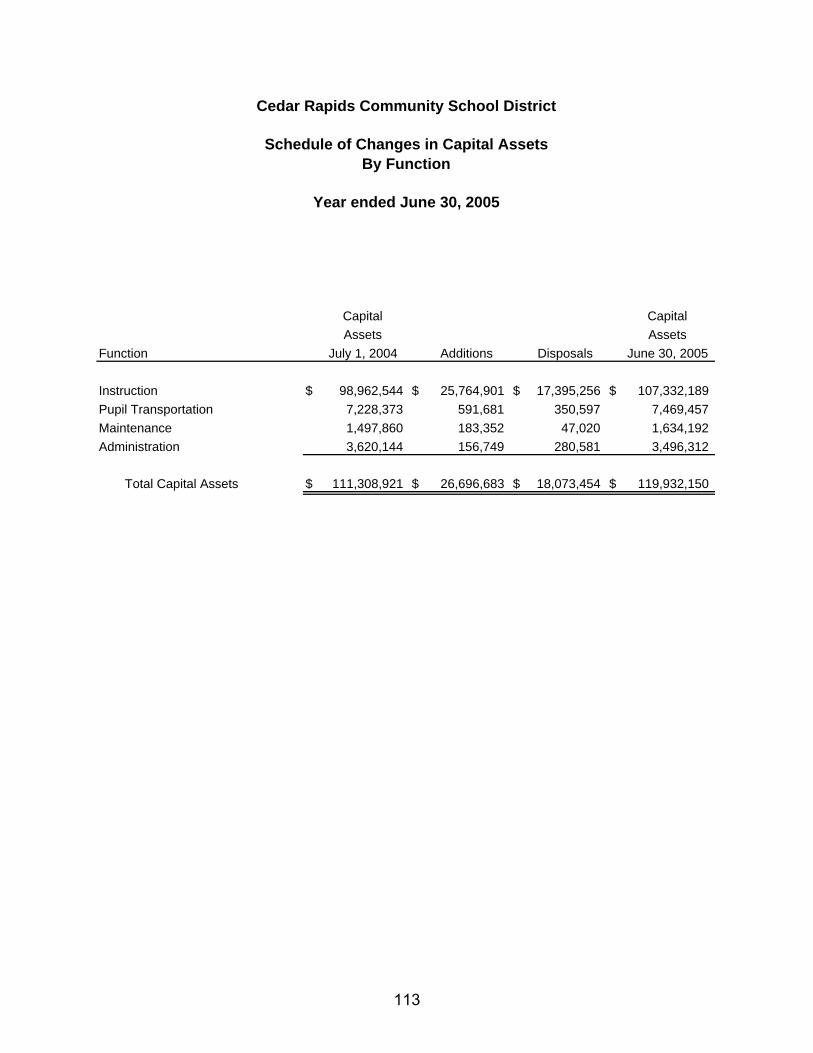
Cedar Rapids Community School District
Schedule of Changes in Capital AssetsBy Function
Year ended June 30, 2005
Capital CapitalAssets Assets
Function July 1, 2004 Additions Disposals June 30, 2005 Instruction $ 98,962,544 $ 25,764,901 $ 17,395,256 $ 107,332,189Pupil Transportation 7,228,373 591,681 350,597 7,469,457Maintenance 1,497,860 183,352 47,020 1,634,192Administration 3,620,144 156,749 280,581 3,496,312
Total Capital Assets $ 111,308,921 $ 26,696,683 $ 18,073,454 $ 119,932,150
113

BuildingsConstruction and
Function Land in Progress Improvements Equipment Vehicles Total Instruction 7,703,781$ 18,797,828$ 68,007,674$ 12,446,356$ 376,550$ 107,332,189$ Pupil Transportation 571,504 0 333,800 231,979 6,332,174 7,469,457Maintenance 96,144 0 83,280 475,282 979,486 1,634,192Administration 57,916 0 359,724 2,997,633 81,039 3,496,312
8,429,345$ 18,797,828$ 68,784,478$ 16,151,250$ 7,769,249$ 119,932,150$
Cedar Rapids Community School District
Schedule of Capital Assets -By Function
June 30, 2005
114
Statistical Section
115

Functions/Programs 2004-2005 2003-2004 2002-2003 2001-2002Governmental activities: Instruction:
Regular instruction 44,819,744$ 44,043,950$ 43,002,781$ 52,772,992$ Special instruction 46,809,075 45,228,653 43,274,213 39,546,723 Vocational instruction 955,000 892,460 976,293 1,292,609 Other instruction 6,501,494 6,946,843 6,195,022 6,390,416 Total Instruction 99,085,313 97,111,906 93,448,309 100,002,740
Support services:Student services 3,310,220 4,632,090 4,488,899 4,412,362 Instructional staff services 9,805,511 7,727,069 7,751,257 10,411,622 General administration services 1,436,593 1,034,397 1,121,162 1,952,978 School administration services 8,142,005 7,672,309 7,816,080 8,138,354 Business services 3,461,843 2,011,643 2,205,315 2,197,315 Operations and maintenance 11,312,146 10,913,085 10,968,971 10,437,019 Student transportation 2,746,897 2,314,212 2,448,558 2,394,106 Central services - 1,596,109 1,400,776 1,756,766 Community services 2,438,130 2,361,262 2,242,229 2,185,561 Other expenditures 1,953,053 3,967,494 (1,753,066) 8,817,447 Interest on long-term debt 2,108,287 2,205,516 2,319,305 1,293,956 AEA flowthrough 5,231,164 5,232,029 5,474,160 5,452,927 Total Support Services 51,945,849 51,667,215 46,483,646 59,450,413
Total governmental activities 151,031,162 148,779,121 139,931,955 159,453,153
Business-type activities:Food services 6,078,235 5,823,143 5,804,394 5,747,692
Total Expenses 157,109,397$ 154,602,264$ 145,736,349$ 165,200,845$
Source: District financial records.
Cedar Rapids Community School District
Government-wide Expenses by Function
Last Four Fiscal Years*
* The Cedar Rapids Community School District began reporting in accordance with GASB 34 beginning with the 2001-2002 fiscal year.
116

2004-2005 2003-2004 2002-2003 2001-2002Program Revenues
Charges for services $17,227,400 $16,874,884 $15,730,113 $15,629,243 Operating Grants & Contributions 20,173,755 19,185,704 18,338,103 18,604,399 Capital Grants & Contributions 560,383 1,207,873 1,904,931 853,180
Total Program Revenues 37,961,538 37,268,461 35,973,147 35,086,822
General Revenues Taxes 66,186,773 63,128,302 62,491,710 51,132,458 State Formula Aid not Restricted 64,003,288 61,534,656 61,187,961 59,253,362 Other 2,077,442 1,421,330 1,915,187 2,078,696
Total General Revenues 132,267,503 126,084,288 125,594,858 112,464,516
Total Revenues $170,229,041 $163,352,749 $161,568,005 $147,551,338
Source: District financial records.
Cedar Rapids Community School District
Government-wide Revenues
Last Four Fiscal Years*
* The Cedar Rapids Community School District began reporting in accordance with GASB 34 beginning with the 2001-2002 fiscal year.
117

Cedar Rapids Community School District
General Fund Expenditures,* by Function
Last Ten Fiscal Years
FiscalYear Co-
Ended General Special Skill Career CurricularJune 30 Education Education Development Education Instruction
2005 46,726,804$ 37,370,377$ 9,148,542$ 950,062$ 2,289,628$ 2004 45,827,892 34,625,674 10,399,923 881,919 2,226,310 2003 46,079,078 33,566,832 9,622,856 981,137 2,195,410 2002 49,804,973 31,190,154 8,258,780 1,233,039 2,119,523 2001 47,209,406 27,933,434 8,911,752 1,258,641 1,959,1272000 45,831,010 25,228,802 5,295,329 1,520,876 1,897,9951999 43,128,767 23,615,145 5,159,491 1,525,807 1,556,8531998 43,663,886 20,549,007 4,633,787 1,405,924 1,546,6431997 40,887,144 18,790,982 4,643,513 1,340,674 1,455,7791996 42,318,386 17,221,050 5,700,524 1,297,140 1,292,862
Source: District financial records.* General Fund expenditures exclude: "Other Financing Uses."
118

InstructionalStudent Support General Operations & CentralServices Services Administration Maintenance Administration Total
3,305,725$ 11,932,705$ 9,653,498$ 12,403,399$ 2,717,092$ 136,497,832$ 4,605,785 10,037,774 9,261,335 11,710,191 2,348,803 131,925,606 4,487,987 9,741,051 9,608,443 12,314,990 2,374,234 130,972,018 4,408,831 11,913,209 9,113,512 12,199,139 2,506,386 132,747,546 4,323,996 11,037,397 8,712,439 12,657,623 2,426,323 126,430,1386,468,644 8,325,442 8,578,129 12,007,948 4,581,461 119,735,6366,048,827 8,134,683 8,236,057 10,917,205 3,963,904 112,286,7395,503,180 6,578,523 7,723,491 11,096,140 3,436,502 106,137,0835,395,126 6,228,442 6,309,563 10,584,096 2,836,026 98,471,3452,741,289 5,331,472 7,014,303 9,581,229 1,345,323 93,843,578
119

FiscalYear
EndedJune 30 Local Tax State Federal Miscellaneous* Total
2005 52,293,616$ 75,227,070$ 5,354,949$ 10,559,691$ 143,435,326$ 2004 47,120,297 72,389,531 5,108,405 12,745,241 137,363,474 2003 45,942,293 72,765,395 4,130,280 12,451,590 135,289,558 2002 40,833,048 71,776,146 3,409,076 12,477,601 128,495,871 2001 38,430,602 70,847,436 3,278,467 12,613,018 125,169,523 2000 37,525,346 66,258,188 2,575,067 12,894,622 119,253,223 1999 37,948,665 61,072,836 2,170,928 11,800,809 112,993,238 1998 36,129,730 58,889,702 2,544,427 7,934,244 105,498,103 1997 35,728,480 55,307,362 2,034,053 7,450,999 100,520,894 1996 35,308,002 49,443,517 2,042,929 7,165,918 93,960,366
* Includes Sale of assets
Cedar Rapids Community School District
Source: District financial records.
General Fund Revenues, By Source
Last Ten Fiscal Years
120

Cedar Rapids Community School District
Property Tax Levies and Collections
Last Ten Fiscal Years
Ratio of Ratio ofFiscal Year Total Total Total Tax Outstanding Delinquent
Ended Tax Tax Collections to Delinquent Taxes To June 30 Levy Collections Total Tax Levy Taxes Total Tax Levy
2005 $63,213,538 $62,096,019 98.2 % $229,617 0.4 %2004 61,416,731 59,554,158 97.0 681,536 1.12003 59,637,988 58,840,329 98.7 601,388 1.02002 47,704,561 47,061,340 98.7 337,525 0.72001 44,274,300 44,605,450 100.7 224,999 0.52000 42,829,427 42,949,653 100.3 270,841 0.61999 43,274,721 43,234,539 99.9 393,714 0.91998 41,843,276 41,316,840 98.7 250,301 0.61997 41,278,839 40,976,174 99.3 484,950 1.21996 41,055,784 40,675,102 99.1 530,493 1.3
Source: District financial records and Linn County Auditor.
121

Cedar Rapids Community School District
Assessed and Taxable Value of Property
Last Ten Fiscal Years
Real PropertyAssessment Collection *Taxable Assessed
Year Year Value Value2003 2004-05 (A) $3,697,536,670 $6,112,429,4022002 2003-04 (B) 3,640,817,375 5,760,602,5892001 2002-03 (C) 3,531,283,866 5,617,276,8122000 2001-02 (D) 3,347,667,113 4,954,894,7441999 2000-01 (E) 3,235,975,666 4,872,528,4931998 1999-00 (F) 3,259,428,326 4,789,498,3181997 1998-99 (G) 3,116,461,999 4,696,467,3991996 1997-98 (H) 2,996,902,962 4,275,909,0211995 1996-97 (I) 2,907,256,049 4,168,361,6991994 1995-96 (J) 2,741,110,322 3,602,619,779
(A) Equalization order applied by County Auditor. Rollback 48.4558% residential, 100% utilities.
(B) Equalization order applied by County Auditor. Rollback 51.3874% residential, 100% utilities.
(C) Equalization order applied by County Auditor. Rollback 51.6676% residential, 100% utilities.
(D) Equalization order applied by County Auditor. Rollback 56.2651% residential, 100% utilities.
(E) Equalization order applied by County Auditor. Rollback 54.8525% residential, 100% utilities.
(F) Equalization order applied by County Auditor. Rollback 56.4789% residential, 100% utilities.
(G) Equalization order applied by County Auditor. Rollback 54.9090% residential, 100% utilities.
(H) Equalization order applied by County Auditor. Rollback 58.8284% residential, 100% utilities.
(I) Equalization order applied by County Auditor. Rollback 59.1380% residential, 100% utilities.
(J) Equalization order applied by County Auditor. Rollback 67.5074% residential, 97.2090 utilities.
* "Taxable Value" excludes Tax Increment Financing, (TIF) valuationSource: Linn County Auditor's Office
122

RatioUtilities Taxable Value
*Taxable Assessed *Taxable Assessed to Value Value Value Value Assessed Value
$290,948,342 $343,619,649 $3,988,485,012 $6,456,049,051 61.8%335,465,814 335,465,814 3,976,283,189 6,096,068,403 65.2%326,994,213 327,129,914 3,858,278,079 5,944,406,726 64.9%324,204,098 324,204,098 3,671,871,211 5,279,098,842 69.6%322,212,752 322,289,275 3,558,188,418 5,194,817,768 68.5%344,568,240 344,568,240 3,603,996,566 5,134,066,558 70.2%347,642,093 347,803,311 3,464,104,092 5,044,270,710 68.7%313,653,297 313,653,297 3,310,556,259 4,589,562,318 72.1%308,792,038 308,980,648 3,216,048,087 4,477,342,347 71.8%319,275,434 328,442,259 3,060,385,756 3,931,062,038 77.9%
Total
123
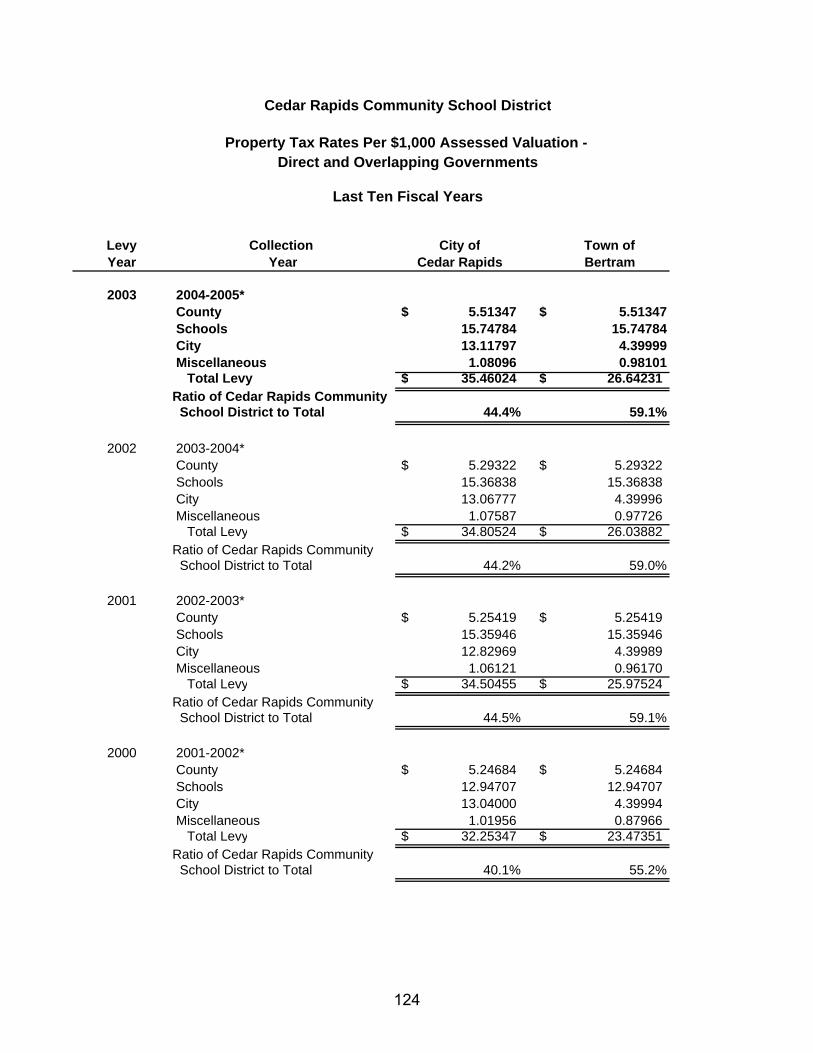
Cedar Rapids Community School District
Property Tax Rates Per $1,000 Assessed Valuation - Direct and Overlapping Governments
Last Ten Fiscal Years
Levy Collection City of Town ofYear Year Cedar Rapids Bertram
2003 2004-2005* County $ 5.51347 $ 5.51347 Schools 15.74784 15.74784 City 13.11797 4.39999 Miscellaneous 1.08096 0.98101 Total Levy $ 35.46024 $ 26.64231Ratio of Cedar Rapids Community School District to Total 44.4% 59.1%
2002 2003-2004* County $ 5.29322 $ 5.29322 Schools 15.36838 15.36838 City 13.06777 4.39996 Miscellaneous 1.07587 0.97726 Total Levy $ 34.80524 $ 26.03882Ratio of Cedar Rapids Community School District to Total 44.2% 59.0%
2001 2002-2003* County $ 5.25419 $ 5.25419 Schools 15.35946 15.35946 City 12.82969 4.39989 Miscellaneous 1.06121 0.96170 Total Levy $ 34.50455 $ 25.97524Ratio of Cedar Rapids Community School District to Total 44.5% 59.1%
2000 2001-2002* County $ 5.24684 $ 5.24684 Schools 12.94707 12.94707 City 13.04000 4.39994 Miscellaneous 1.01956 0.87966 Total Levy $ 32.25347 $ 23.47351Ratio of Cedar Rapids Community School District to Total 40.1% 55.2%
124

City of City of Town of Town ofHiawatha Marion Palo Robins
$ 5.51347 $ 5.51347 $ 5.51347 $ 5.5134715.74784 15.74784 15.74784 15.7478412.01697 13.65104 10.81387 8.542680.98101 0.98101 0.98101 0.98101
$ 34.25929 $ 35.89336 $ 33.05619 $ 30.78500
46.0% 43.9% 47.6% 51.2%
$ 5.29322 $ 5.29322 $ 5.29322 $ 5.2932215.36838 15.36838 15.36838 15.3683811.31981 13.46667 10.68073 8.551260.97726 0.97726 0.97726 0.97726
$ 32.95867 $ 35.10553 $ 32.31959 $ 30.19012
46.6% 43.8% 47.6% 50.9%
$ 5.25419 $ 5.25419 $ 5.25419 $ 5.2541915.35946 15.35946 15.35946 15.3594611.11468 13.25744 10.59898 8.584250.96170 0.96170 0.96170 0.96170
$ 32.69003 $ 34.83279 $ 32.17433 $ 30.15960
47.0% 44.1% 47.7% 50.9%
$ 5.24684 $ 5.24684 $ 5.24684 $ 5.2468412.94707 12.94707 12.94707 12.9470710.93415 12.78971 10.54580 8.614670.87966 0.87966 0.87966 0.87966
$ 30.00772 $ 31.86328 $ 29.61937 $ 27.68824
43.1% 40.6% 43.7% 46.8%
(continued)
125

Cedar Rapids Community School District
Property Tax Rates Per $1,000 Assessed Valuation - Direct and Overlapping Governments (continued)
Last Ten Fiscal Years
Levy Collection City of Town ofYear Year Cedar Rapids Bertram
1999 2000-2001* County $ 5.31110 $ 5.31110 Schools 12.40887 12.40887 City 12.74497 4.39994 Miscellaneous 0.97792 0.87427 Total Levy $ 31.44286 $ 22.99418Ratio of Cedar Rapids Community School District to Total 39.5% 54.0%
1998 1999-2000* County $ 5.31110 $ 5.31110 Schools 11.88387 11.88387 City 12.40000 4.39991 Miscellaneous 0.93054 0.89281 Total Levy $ 30.52551 $ 22.48769Ratio of Cedar Rapids Community School District to Total 38.9% 52.8%
1997 1998-1999* County $ 5.38110 $ 5.38110 Schools 12.48780 12.48780 City 12.32432 4.39987 Miscellaneous 0.84003 0.85972 Total Levy $ 31.03325 $ 23.12849Ratio of Cedar Rapids Community School District to Total 40.2% 54.0%
1996 1997-1998* County $ 5.61839 $ 5.61839 Schools 12.50172 12.50172 City 12.07416 4.39996 Miscellaneous 0.92556 0.92230 Total Levy $ 31.11983 $ 23.44237Ratio of Cedar Rapids Community School District to Total 40.2% 53.3%
126

City of City of Town of Town ofHiawatha Marion Palo Robins
$ 5.31110 $ 5.31110 $ 5.31110 $ 5.3111012.40887 12.40887 12.40887 12.4088710.85444 12.75826 10.01942 9.048280.87427 0.87427 0.87427 0.87427
$ 29.44868 $ 31.35250 $ 28.61366 $ 27.64252
42.1% 39.6% 43.4% 44.9%
$ 5.31110 $ 5.31110 $ 5.31110 $ 5.3111011.88387 11.88387 11.88387 11.8838710.87986 12.39855 9.99010 9.045910.89281 0.89281 0.89281 0.89281
$ 28.96764 $ 30.48633 $ 28.07788 $ 27.13369
41.0% 39.0% 42.3% 43.8%
$ 5.38110 $ 5.38110 $ 5.38110 $ 5.3811012.48780 12.48780 12.48780 12.4878010.34467 12.46129 9.66518 9.009020.85972 0.85972 0.85972 0.85972
$ 29.07329 $ 31.18991 $ 28.39380 $ 27.73764
43.0% 40.0% 44.0% 45.0%
$ 5.61839 $ 5.61839 $ 5.61839 $ 5.6183912.50172 12.50172 12.50172 12.5017210.94417 13.16082 9.65405 8.968450.92230 0.92230 0.92230 0.92230
$ 29.98658 $ 32.20323 $ 28.69646 $ 28.01086
41.7% 38.8% 43.6% 44.6%
(continued)
127
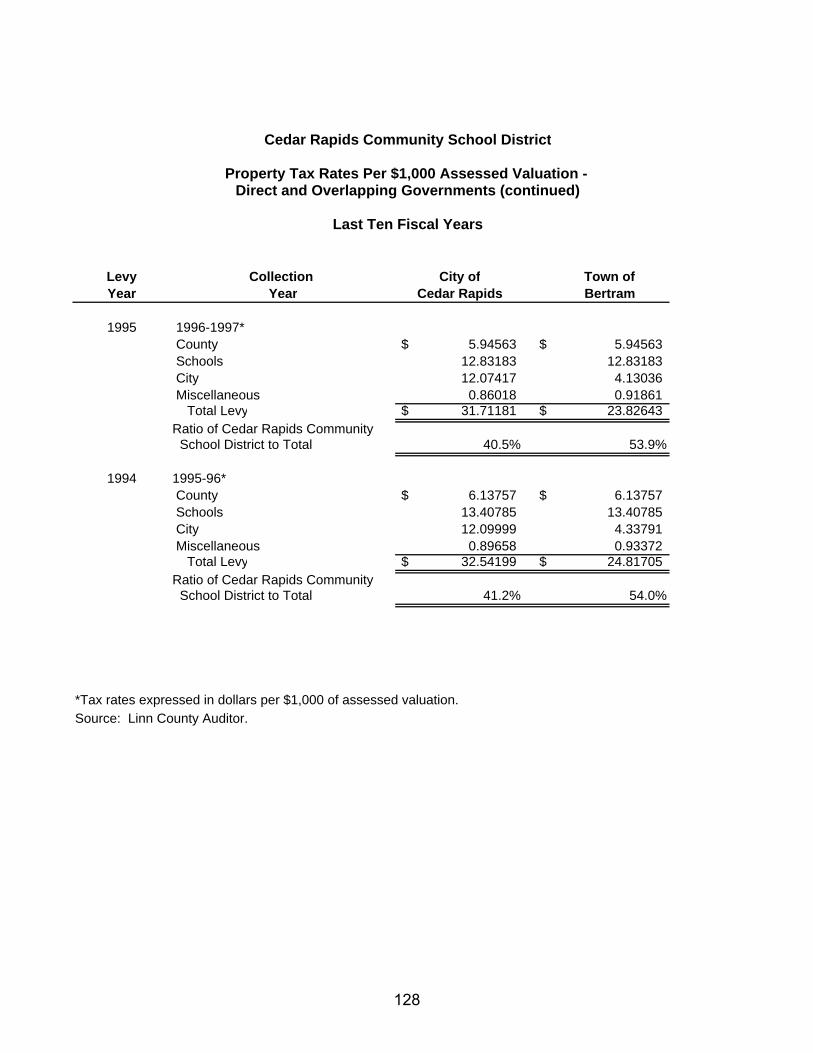
Cedar Rapids Community School District
Property Tax Rates Per $1,000 Assessed Valuation - Direct and Overlapping Governments (continued)
Last Ten Fiscal Years
Levy Collection City of Town ofYear Year Cedar Rapids Bertram
1995 1996-1997* County $ 5.94563 $ 5.94563 Schools 12.83183 12.83183 City 12.07417 4.13036 Miscellaneous 0.86018 0.91861 Total Levy $ 31.71181 $ 23.82643Ratio of Cedar Rapids Community School District to Total 40.5% 53.9%
1994 1995-96* County $ 6.13757 $ 6.13757 Schools 13.40785 13.40785 City 12.09999 4.33791 Miscellaneous 0.89658 0.93372 Total Levy $ 32.54199 $ 24.81705Ratio of Cedar Rapids Community School District to Total 41.2% 54.0%
*Tax rates expressed in dollars per $1,000 of assessed valuation.Source: Linn County Auditor.
128

City of City of Town of Town ofHiawatha Marion Palo Robins
$ 5.94563 $ 5.94563 $ 5.94563 $ 5.9456312.83183 12.83183 12.83183 12.831839.77853 13.10005 10.06695 8.819300.91861 0.91861 0.91861 0.91861
$ 29.47460 $ 32.79612 $ 29.76302 $ 28.51537
43.5% 39.1% 43.1% 45.0%
$ 6.13757 $ 6.13757 $ 6.13757 $ 6.1375713.40785 13.40785 13.40785 13.4078510.95618 12.95790 10.51679 7.667860.93372 0.93372 0.93372 0.93372
$ 31.43532 $ 33.43704 $ 30.99593 $ 28.14700
42.7% 40.1% 43.3% 47.6%
(concluded)
129
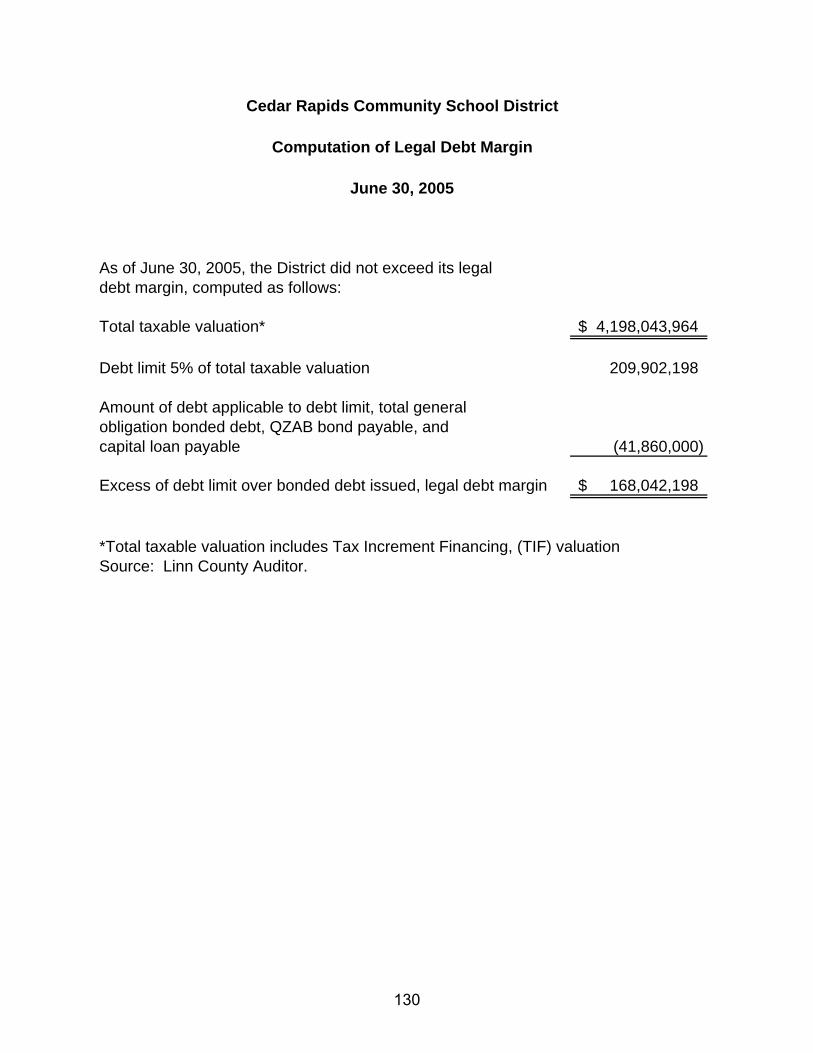
As of June 30, 2005, the District did not exceed its legaldebt margin, computed as follows:
Total taxable valuation* 4,198,043,964$
Debt limit 5% of total taxable valuation 209,902,198
Amount of debt applicable to debt limit, total general obligation bonded debt, QZAB bond payable, and capital loan payable (41,860,000)
Excess of debt limit over bonded debt issued, legal debt margin 168,042,198$
*Total taxable valuation includes Tax Increment Financing, (TIF) valuationSource: Linn County Auditor.
Cedar Rapids Community School District
Computation of Legal Debt Margin
June 30, 2005
130

Ratio ofGeneral General
Obligation ObligationGeneral Bonded Debt Bonded
Fiscal Year Taxable* Obligation to Taxable Debt Per(of Collection) Population Value Bonded Debt Value Capita
2004-05 120,758 3,988,485,012$ 41,225,000$ 1.03 % $341 2003-04 120,758 3,976,283,189 43,025,000 1.08 356 2002-03 120,758 3,858,278,079 44,800,000 1.16 371 2001-02 120,758 3,671,871,211 45,850,000 1.25 380 2000-01 120,758 3,558,188,418 10,000,000 0.28 83 1999-00 113,482 3,603,996,566 - 0.00 0 1998-99 113,482 3,464,104,092 - 0.00 0 1997-98 113,482 3,310,556,259 650,000 0.02 6 1996-97 113,482 3,216,048,087 1,250,000 0.04 11 1995-96 113,482 3,060,385,756 1,825,000 0.06 16
Population - Source: Cedar Rapids Chamber of Commerce.Taxable Value - Source: Linn County Auditor.*Taxable Value excludes Tax Increment Financing, (TIF) valuation
Cedar Rapids Community School District
Ratio of General Obligation Bonded Debt to TaxableValue and General Obligation Bonded Debt Per Capita
Last Ten Fiscal Years
131
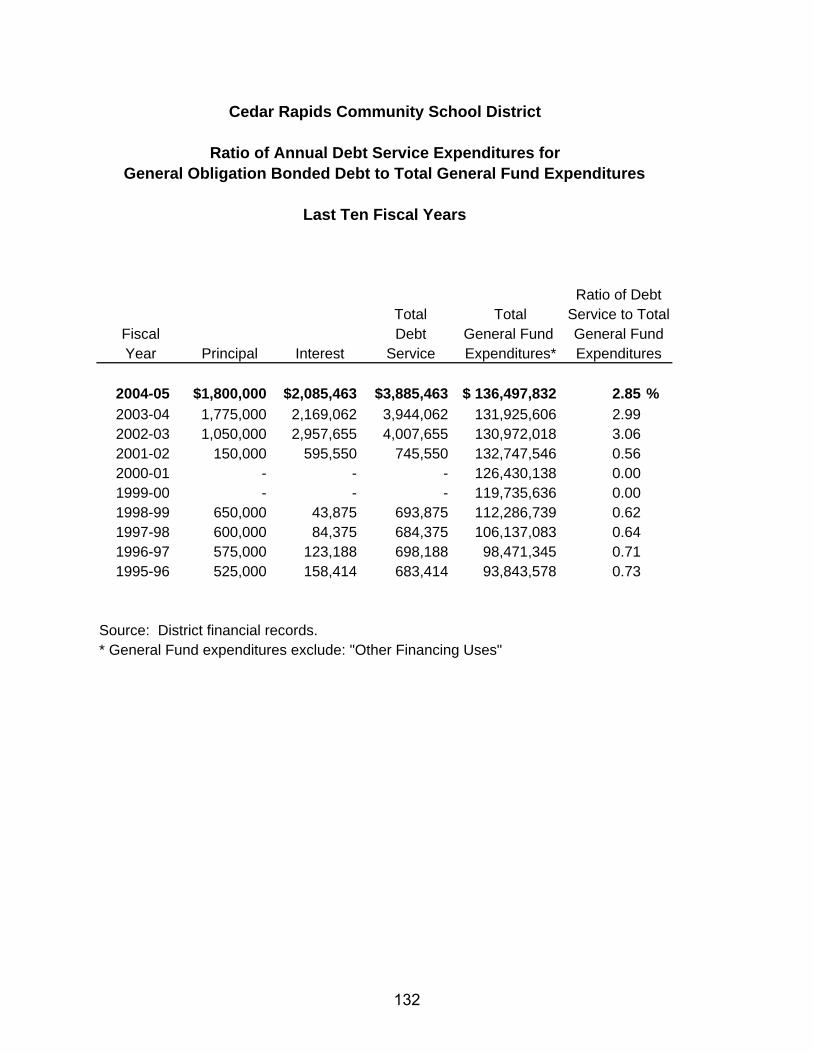
Cedar Rapids Community School District
Ratio of Annual Debt Service Expenditures forGeneral Obligation Bonded Debt to Total General Fund Expenditures
Last Ten Fiscal Years
Ratio of DebtTotal Total Service to Total
Fiscal Debt General Fund General FundYear Principal Interest Service Expenditures* Expenditures
2004-05 1,800,000$ 2,085,463$ 3,885,463$ 136,497,832$ 2.85 % 2003-04 1,775,000 2,169,062 3,944,062 131,925,606 2.99 2002-03 1,050,000 2,957,655 4,007,655 130,972,018 3.06 2001-02 150,000 595,550 745,550 132,747,546 0.56 2000-01 - - - 126,430,138 0.00 1999-00 - - - 119,735,636 0.00 1998-99 650,000 43,875 693,875 112,286,739 0.62 1997-98 600,000 84,375 684,375 106,137,083 0.64 1996-97 575,000 123,188 698,188 98,471,345 0.71 1995-96 525,000 158,414 683,414 93,843,578 0.73
Source: District financial records.* General Fund expenditures exclude: "Other Financing Uses"
132

Cedar Rapids Community School District
Computation of Direct and Overlapping Debt
June 30, 2005
Gross General Percentage Cedar RapidsObligation Applicable to Community
Debt Governmental School DistrictOutstanding Unit Share of Debt
Direct: Cedar Rapids Community School District $41,225,000 100.00 % $41,225,000Overlapping: City of Cedar Rapids 72,880,300 71.58 52,167,719 City of Hiawatha 8,740,000 100.00 8,740,000 City of Marion 10,560,000 1.64 173,184 City of Robins 5,935,000 67.93 4,031,646 Kirkwood Community College 48,865,000 27.13 13,257,075 Linn County 4,500,000 56.33 2,534,850
Total Overlapping 151,480,300 53.41 80,904,474
Total Direct and Overlapping Debt $192,705,300 63.38 % $122,129,474
Source: Linn County Auditor
133

134
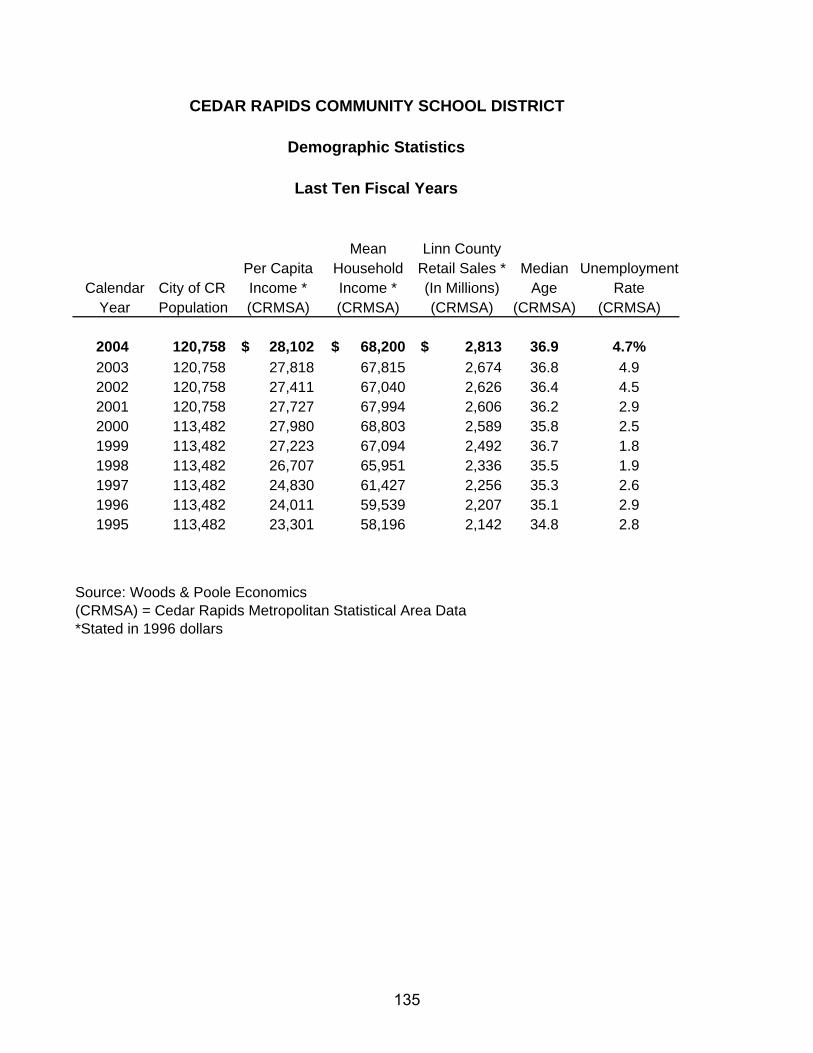
Mean Linn CountyPer Capita Household Retail Sales * Median Unemployment
Calendar City of CR Income * Income * (In Millions) Age RateYear Population (CRMSA) (CRMSA) (CRMSA) (CRMSA) (CRMSA)
2004 120,758 28,102$ 68,200$ 2,813$ 36.9 4.7%2003 120,758 27,818 67,815 2,674 36.8 4.92002 120,758 27,411 67,040 2,626 36.4 4.52001 120,758 27,727 67,994 2,606 36.2 2.92000 113,482 27,980 68,803 2,589 35.8 2.51999 113,482 27,223 67,094 2,492 36.7 1.81998 113,482 26,707 65,951 2,336 35.5 1.91997 113,482 24,830 61,427 2,256 35.3 2.61996 113,482 24,011 59,539 2,207 35.1 2.91995 113,482 23,301 58,196 2,142 34.8 2.8
CEDAR RAPIDS COMMUNITY SCHOOL DISTRICT
Demographic Statistics
Last Ten Fiscal Years
Source: Woods & Poole Economics(CRMSA) = Cedar Rapids Metropolitan Statistical Area Data*Stated in 1996 dollars
135
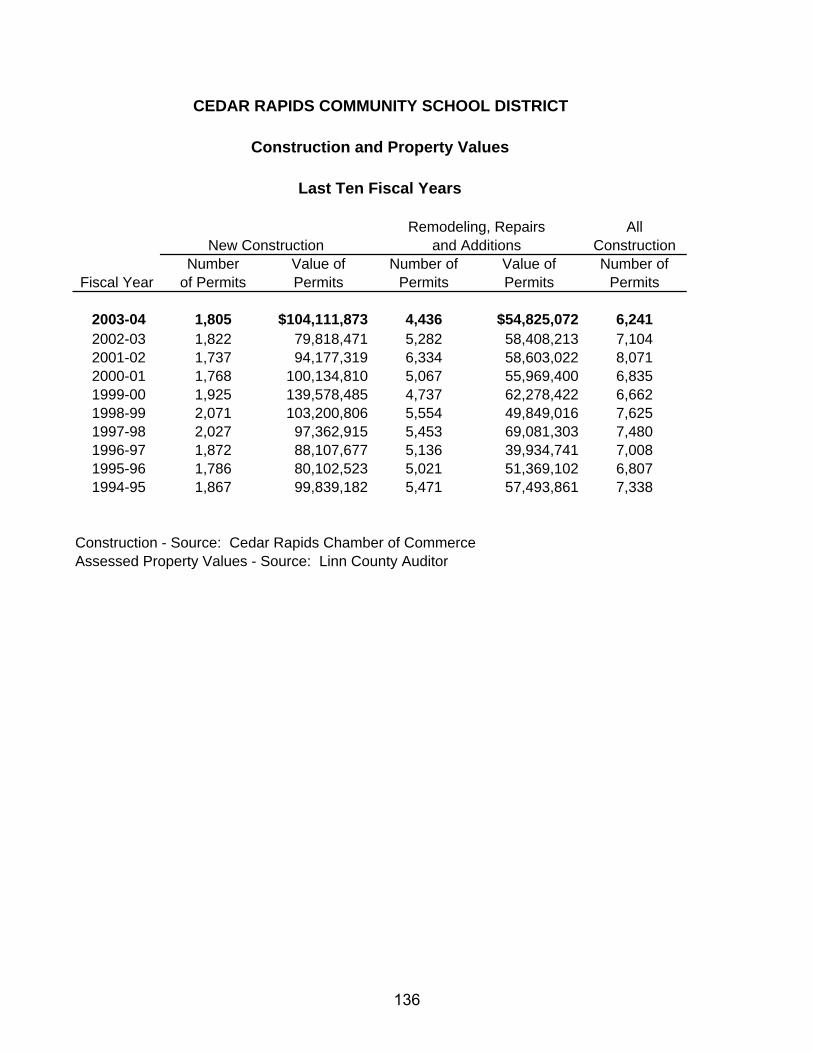
AllNew Construction Construction
Number Value of Number of Value of Number ofFiscal Year of Permits Permits Permits Permits Permits
2003-04 1,805 $104,111,873 4,436 $54,825,072 6,241 2002-03 1,822 79,818,471 5,282 58,408,213 7,104 2001-02 1,737 94,177,319 6,334 58,603,022 8,071 2000-01 1,768 100,134,810 5,067 55,969,400 6,835 1999-00 1,925 139,578,485 4,737 62,278,422 6,662 1998-99 2,071 103,200,806 5,554 49,849,016 7,625 1997-98 2,027 97,362,915 5,453 69,081,303 7,480 1996-97 1,872 88,107,677 5,136 39,934,741 7,008 1995-96 1,786 80,102,523 5,021 51,369,102 6,807 1994-95 1,867 99,839,182 5,471 57,493,861 7,338
Construction - Source: Cedar Rapids Chamber of CommerceAssessed Property Values - Source: Linn County Auditor
and Additions
CEDAR RAPIDS COMMUNITY SCHOOL DISTRICT
Construction and Property Values
Last Ten Fiscal Years
Remodeling, Repairs
136

AllConstruction
Value of AssessmentPermits Year Real Utilities Total
$158,936,945 2003 $6,112,429,402 $343,619,649 $6,456,049,051138,226,684 2002 5,760,602,589 335,465,814 6,096,068,403152,780,341 2001 5,617,276,812 327,129,914 5,944,406,726156,104,210 2000 4,954,894,744 324,204,098 5,279,098,842201,856,907 1999 4,872,528,493 322,289,275 5,194,817,768153,049,822 1998 4,789,498,318 344,568,240 5,134,066,558166,444,218 1997 4,696,467,399 347,803,311 5,044,270,710128,042,418 1996 4,275,909,021 313,653,297 4,589,562,318131,471,625 1995 4,168,361,699 308,980,648 4,477,342,347157,333,043 1994 3,602,619,779 328,442,259 3,931,062,038
Assessed Property Value
137

CEDAR RAPIDS COMMUNITY SCHOOL DISTRICT
Principal Taxpayers
June 30, 2005
Assessed Value 2003 forFY 2005 Revenue
Percentageof Total
Type of AssessedTaxpayer Business Amount Valuation
IES Industries, Inc. Electrical and gas utility $214,800,539 3.3%
AEGON USA, Inc. Insurance 50,443,402 0.8%
H-N-W Associates (Westdale Mall) Real estate developer 33,856,035 0.5%
MidAmerican Energy Electrical and gas utility 25,483,871 0.4%
Individual Real Estate Holdings 22,840,711 0.4%
Qwest Telephone utility 22,483,052 0.3%
Mercy Hospital Hospital 16,719,679 0.3%
Hy Vee Groceries 16,401,253 0.3%
Windsor Joint Venture Residential apartment 15,906,591 0.2%
Cargill Grain Processing 13,639,415 0.2%
Totals $432,574,548 6.7%
Source: Linn County Auditor
138

Cedar Rapids Community School District
General Analysis of Facilities and Staffing
TeachersHead Count ActivelyEnrollment Employed*Third Friday Third Friday Student/
Date in September in September TeacherName of School Constructed Grades Served 2004 2004 Ratio
High Schools (9-12)Jefferson 1959 9-12 and Special Education 1,563 94.0 16.6Kennedy 1967 9-12 and Special Education 1,781 105.9 16.8Metro 1955 9-12 and Special Education 575 33.0 17.4Washington 1958 9-12 and Special Education 1,595 95.6 16.7 Total High Schools 5,514 328.5 16.8Middle Schools (6-8)Franklin 1922 6-8 and Special Education 657 49.2 13.4Harding 1964 6-8 and Special Education 926 65.5 14.1McKinley 1922 6-8 and Special Education 659 56.5 11.7Roosevelt 1924 6-8 and Special Education 646 53.5 12.1Taft 1965 6-8 and Special Education 713 47.7 14.9Taft alternative 1965 6-8 and Special Education 22 5.0 4.4Wilson 1928 6-8 and Special Education 301 24.8 12.1 Total Middle Schools 3,924 302.2 13.0Elementary Schools (K-5)Arthur 1914 K-5 and Special Education 333 21.6 15.4Cleveland 1950 K-5 and Special Education 375 25.6 14.6Coolidge 1967 K-5 and Special Education 420 26.6 15.8Erskine 1955 1-5 and Special Education 356 20.6 17.3Garfield 1930 K-5 and Special Education 309 21.1 14.6Gibson 2002 K-5 and Special Education 503 32.6 15.4Grant 1961 K-1 and Special Education 192 16.2 11.9Grant Wood 1948 1-5 and Special Education 335 24.3 13.8Harrison 1930 K-5 and Special Education 406 31.2 13.0Hiawatha 1956 K-5 and Special Education 412 28.8 14.3Hoover 1954 K-5 and Special Education 291 20.1 14.5Jackson 1970 K-5 and Special Education 286 20.8 13.8Johnson 1955 1-5 and Special Education 353 29.6 11.9Kenwood 1950 K-5 and Special Education 267 20.3 13.2Madison 1961 K-5 and Special Education 279 20.7 13.5Monroe 1961 Kindergarten and Spec. Ed. 237 17.5 13.5Nixon 1970 K-5 and Special Education 351 21.1 16.6Pierce 1965 K-5 and Special Education 459 25.7 17.9Polk 1961 K-5 and Special Education 204 22.6 9.0Taylor 1973 K-5 and Special Education 256 28.4 9.0Truman 1961 K-5 and Special Education 334 21.9 15.3Van Buren 1970 K-5 and Special Education 374 29.2 12.8Wilson 1961 K-5 and Special Education 236 18.6 12.7Wright 1953 K-5 and Special Education 241 26.9 9.0 Total Elementary Schools 7,809 572.2 13.6Pre-school & Homeschool & ESC Facilitators 457 38.0 12.0Off Campus Programs 133 18.8 7.1 Total 17,837 1,259.7 14.2
* All certified staff, including support personnel, such as counselors and media specialists (full-time equivalent).Head Count Enrollment - Source: District Research DepartmentTeachers Actively Employed - Source: District Human Resources Department
139

Grade 2004-05 2003-04 2002-03 2001-02Kindergarten 1,456 1,416 1,392 1,293 1 1,216 1,210 1,138 1,231 2 1,128 1,065 1,174 1,199 3 1,035 1,078 1,122 1,209 4 1,048 1,059 1,131 1,143 5 1,042 1,077 1,069 1,094 6 1,048 1,032 1,040 1,058 7 1,031 1,008 1,027 1,046 8 1,001 1,014 1,043 1,009 9 1,184 1,163 1,068 1,09410 1,130 1,059 1,107 1,16711 1,004 1,062 1,196 1,13012 1,058 1,059 1,111 1,032Special Education 2,999 3,022 2,963 2,881Home School 316 272 243 248Preschool 141 133 134 111
17,837 17,729 17,958 17,945
Changes from Prior YearIncrease (Decrease) 108 (229) 13 (201)
Percent Change 0.61% -1.28% 0.07% -1.11%
* Enrollment as of the third Friday in September.Source: District Research Department
Cedar Rapids Community School District
Enrollment by Grade*
Last Ten Fiscal Years
140
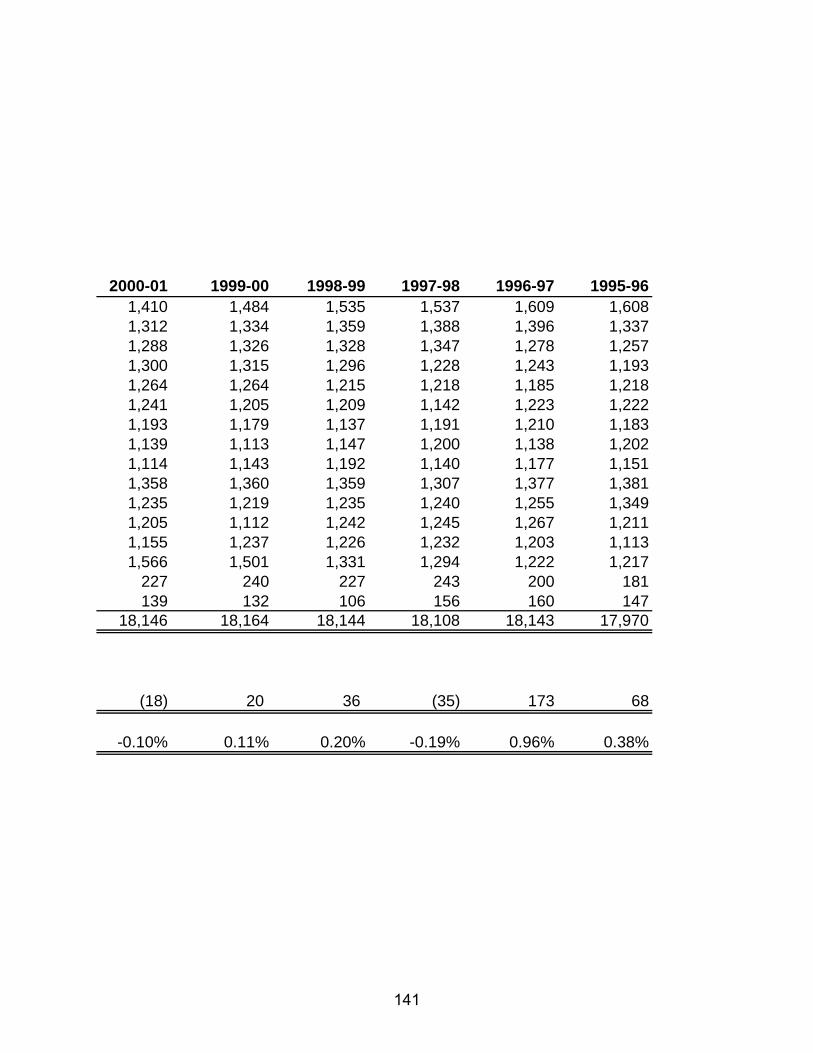
2000-01 1999-00 1998-99 1997-98 1996-97 1995-961,410 1,484 1,535 1,537 1,609 1,6081,312 1,334 1,359 1,388 1,396 1,3371,288 1,326 1,328 1,347 1,278 1,2571,300 1,315 1,296 1,228 1,243 1,1931,264 1,264 1,215 1,218 1,185 1,2181,241 1,205 1,209 1,142 1,223 1,2221,193 1,179 1,137 1,191 1,210 1,1831,139 1,113 1,147 1,200 1,138 1,2021,114 1,143 1,192 1,140 1,177 1,1511,358 1,360 1,359 1,307 1,377 1,3811,235 1,219 1,235 1,240 1,255 1,3491,205 1,112 1,242 1,245 1,267 1,2111,155 1,237 1,226 1,232 1,203 1,1131,566 1,501 1,331 1,294 1,222 1,217
227 240 227 243 200 181139 132 106 156 160 147
18,146 18,164 18,144 18,108 18,143 17,970
(18) 20 36 (35) 173 68
-0.10% 0.11% 0.20% -0.19% 0.96% 0.38%
141

2004-05 2003-04 2002-03 2001-02AdministrationSuperintendent 1.0 1.0 1.0 1.0Deputy/Assistant Superintendent 0.0 1.0 1.0 3.0Principals and Assistants 51.0 50.0 50.0 48.0District Administrators 13.0 15.0 14.0 16.0Supervisors 7.0 7.0 8.0 8.0 Total Administration 72.0 74.0 74.0 76.0TeachersK-12, Music, Physical Education and Art 906.1 921.7 940.0 977.9Special Education 249.5 257.0 253.2 238.7Federal Programs 20.2 19.2 21.0 14.5Media Specialist 24.7 32.4 32.4 32.4Counselors 45.1 45.4 44.4 44.0 Total Teachers 1,245.6 1,275.7 1,291.0 1,307.5Support PersonnelClerical 175.3 180.5 187.3 184.7Teacher aides, Special Education 264.5 258.7 243.1 215.5Teacher aides, regular 84.2 82.2 90.0 98.1Custodial and maintenance 174.4 173.3 179.0 178.8Bus drivers/Attendants 98.2 92.9 93.0 92.8Food service workers 129.4 132.1 130.1 135.3Nurses/Volunteer Coordinator 14.7 14.5 13.3 11.7Crafts and trades 18.4 19.4 20.1 20.4Data processing 3.8 3.8 3.8 3.8Day care 88.0 87.1 85.3 87.7Other 66.4 64.9 67.1 60.5 Total Support Personnel 1,117.3 1,109.4 1,112.1 1,089.3 Total Staff 2,434.9 2,459.1 2,477.1 2,472.8
* FTE (full time equivalent) as of the third Friday in September.Source: District Human Resources Department
Staffing Levels*
Last Ten Fiscal Years
Cedar Rapids Community School District
142

2000-01 1999-00 1998-99 1997-98 1996-97 1995-96
1.0 1.0 1.0 1.0 1.0 1.03.0 3.0 2.0 3.0 3.0 -
48.0 48.0 48.0 49.0 47.0 47.016.0 13.0 13.0 21.0 19.0 20.58.0 8.0 8.0 8.0 8.0 8.0
76.0 73.0 72.0 82.0 78.0 76.5
988.8 967.1 922.6 929.9 895.6 887.4227.9 216.3 203.8 201.3 177.0 177.318.0 15.1 15.8 13.7 18.9 24.432.4 33.4 31.7 31.4 32.3 33.145.0 42.0 43.3 42.7 43.3 41.7
1,312.1 1,273.9 1,217.2 1,219.0 1,167.1 1,163.9
185.5 177.0 175.1 174.0 175.4 173.0186.8 171.4 139.9 135.4 106.6 105.5105.3 113.5 134.0 120.5 109.9 108.5175.0 176.8 174.8 137.8 142.9 140.682.3 82.8 74.7 74.5 71.5 79.8
130.7 129.1 125.8 127.6 133.4 129.811.7 11.8 9.5 8.4 6.7 7.120.4 19.4 41.6 42.0 42.0 43.03.8 3.8 3.6 8.6 4.6 4.6
91.6 100.7 93.6 105.0 128.4 130.056.9 47.7 17.4 40.0 16.2 10.9
1,050.0 1,034.0 990.0 973.8 937.6 932.82,438.1 2,380.9 2,279.2 2,274.8 2,182.7 2,173.2
143

Average Daily OperatingFiscal Year General Fund Costs* Attendance Cost Per Pupil
2004-05 $136,497,832 16,226 $8,412 2003-04 131,925,606 16,149 8,169 2002-03 130,972,018 16,433 7,970 2001-02 132,747,546 16,522 8,035 2000-01 126,430,138 17,043 7,418 1999-00 119,735,636 16,545 7,237 1998-99 112,286,739 17,119 6,559 1997-98 106,137,083 17,248 6,154 1996-97 98,471,345 17,361 5,672 1995-96 93,843,578 16,963 5,532
* General Fund expenditures exclude: "Other Financing Uses."Total Costs - Source: District financial records.Average Daily Attendance - Source: District Research Department
Cedar Rapids Community School District
General Fund Cost Per Pupil
Last Ten Fiscal Years
144

Internal Controls and Compliance Section
145

146

147
148

149

Cedar Rapids Community School DistrictSchedule of Expenditures of Federal Awards
Year ended June 30, 2005
Federal Pass-Through ProgramFederal Grantor/Pass-Through CFDA Grantor's or Award
Grantor/Program Title Number Number AmountIndirect:
U.S. Department of Agriculture:Iowa Department of Education:
National School Lunch Program 10.555 FY 05 2,098,507$ School Breakfast Program 10.553 FY 05 515,381 Fresh Fruit & Vegetable Pilot Program 10.555 FY 05 94,898 Total cash expenditures 2,708,786 Food Distribution-USDA Commodities (non-cash) 10.550 FY 05 329,892 Total cash and non-cash expenditures 3,038,678
U.S. Department of Education:Iowa Department of Education:
Title I 84.010 1053-G-05 2,076,085 Title I - Carryover 84.010 1053-GC-05 214,513 Title I - SINA 84.010 1053-SI-05 165,000
2,455,598
Title IIA - Improving Teacher Quality State Grants 84.367 FY 05 223,215 Title IIA - Class Size Reduction Program 84.367 FY 05 869,208
1,092,423
Title V - State Grants for Innovative Programs 84.298A FY 05 100,576
Special Education Grants to States (IDEA Part B) 84.027 FY 05 978,325
Safe and Drug Free Schools and Communities 84.186 FY 04 88,295 Safe and Drug Free Schools and Communities 84.186 FY 05 90,331
178,626
Perkins Vocational Education Program - Basic Grant 84.048A FY 05 207,291
Title VI A - NCLB Assessment Grant 84.369 FY 05 102,750
Grants for Enhanced Assessment Instruments 84.368 FY 05 2,000
ESETP - Enhancing Education Through Technology 84.318 FY 05 32,150 E2T2 - Enhancing Education Through Technology 84.318 FY 05 129,815
161,965
Refugee Children School Impact Grant 93.576 FY 05 11,006
21st Century Community Learning Centers Grant 84.287 FY 04 - 08 470,475
Fund for the Improvement of Education 84.215 FY 05 345
Success4 Comprehensive School Improvement 84.027 FY 05 44,341
Education for Homeless Children and Youth 84.196 FY 05 25,000
Iowa Demonstration Construction Grants 84.215 FY 05 2,150,000
U.S. Department of Justice:Linn County, Iowa:
Juvenile Justice and Delinquency Prevention 16.540 FY 05 23,105 Enforcing Underage Drinking Laws Program (EUDL) 16.727 FY 05 3,182 Juvenile Accountablity Incentive Block Grant (JAIBG) 16.523 FY 05 33,861
60,148
U.S. Department of Human ServicesLinn County, Iowa:
Medicaid Time Study Program 93.778 FY 05 77,086
Total 11,156,633$
Total cash expendituresTotal non-cash expenditures
Basis of Presentation - The Schedule of Expenditures of Federal Awards includes the federal grant activity of the Cedar Rapids Community SchoolDistrict and is presented in conformity with the accrual or modified accrual basis of accounting. The information on this schedule is presentedin accordance with the requirements of OMB Circular A-133, Audits of States, Local Governments, and Non-Profit Organizations. Therefore, someamounts presented in this schedule may differ from amounts presented in, or used in preparation of, the basic financial statements.
See accompanying independent auditor's report.
150

ProgramGrant Contributions
Balance Revenue and Miscellaneous Program Balance6/30/2004 Receipts Related Receipts Expenditures 6/30/2005
-$ 2,098,507$ -$ 2,098,507$ -$ - 515,381 - 515,381 - - 61,742 - 61,742 - - 2,675,630 - 2,675,630 -
110,659 329,892 - 353,542 87,009 110,659 3,005,522 - 3,029,172 87,009
- 1,822,675 - 1,822,675 - - 214,513 - 214,513 - - 88,415 - 88,415 - - 2,125,603 - 2,125,603 -
543,419 388,281 (543,419) 324,535 63,746 363 325,426 543,419 379,032 490,176
543,782 713,707 - 703,567 553,922
162 100,464 - 100,127 499
- 978,325 - 978,325 -
2,761 - - 2,761 - - 70,792 70,792 -
2,761 70,792 - 73,553 -
- 207,291 - 207,291 -
82,393 102,750 - 185,143 -
- 2,000 - 1,578 422
- 15,322 - 15,322 - - 96,696 - 96,696 - - 112,018 - 112,018 -
11,006 - - 11,006 -
- 110,700 - 110,700 -
- 345 - 166 179
44,341 - - 22,649 21,692
- 25,000 - 25,000 -
- 560,383 - 560,383 -
- 23,105 - 23,105 - - 1,726 - 1,726 - - 37,059 - 37,059 - - 61,890 - 61,890 -
85,565 77,086 - 139,119 23,532
880,669$ 8,253,876$ -$ 8,447,290$ 687,255$
8,093,748$ 353,542
8,447,290$
151

CEDAR RAPIDS COMMUNITY SCHOOL DISTRICT SCHEDULE OF FINDINGS AND QUESTIONED COSTS
Year Ended June 30, 2005 Section I: Summary of Auditor’s Results: Financial Statements Type of auditor’s report issued: unqualified Internal control over financial reporting: • Material weakness(es) identified? yes x no • Reportable condition(s) identified that are not considered to be material weaknesses? yes x none reported • Noncompliance material to financial statements noted? yes x no Federal Awards Internal control over major programs: • Material weakness(es) identified? yes x no • Reportable condition(s) identified that are not considered to be material weakness(es)? yes x none reported Type of auditor’s report issued on compliance for major programs: unqualified Any audit findings disclosed that are required to be reported in accordance with section 510(a) of OMB Circular A-133? yes x no Identification of major programs: CFDA Number(s) Name of Federal Program or Cluster 84.027 Special Education Grants to States IDEA Part B 84.215 Iowa Demonstration Grants 84.367 Title II - Federal Teacher Quality and Class Size Reduction Dollar threshold used to distinguish between type A and type B programs: $ 300,000 Auditee qualified as low-risk auditee? x yes no
152

CEDAR RAPIDS COMMUNITY SCHOOL DISTRICT SCHEDULE OF FINDINGS AND QUESTIONED COSTS
Year Ended June 30, 2005 Section II: Financial Statement Findings: INSTANCES OF NONCOMPLIANCE: None REPORTABLE CONDITIONS: None Section III: Federal Award Findings and Questioned Costs: INSTANCES OF NONCOMPLIANCE: None REPORTABLE CONDITIONS: None Section IV: Other Findings Related to Required Statutory Reporting: IV-A-05 Official Depositories - Official depositories have been approved by the District. The
maximum deposit amounts stated in the resolution not were exceeded during the year ended June 30, 2005.
IV-B-05 Certified Budget - Expenditures during the year ended June 30, 2005, did not
exceed the amount budgeted in any functional area. IV-C-05 Questionable Expenditures - No expenditures that we believe may not meet the
requirements of public purpose as defined in an Attorney General’s opinion dated April 25, 1979, were noted.
IV-D-05 Travel Expense - No expenditures of District money for travel expenses of spouses
of District officials or employees were noted. IV-E-05 Business Transactions - No business transactions between the District and District
officials or employees were noted. IV-F-05 Bond Coverage - Surety bond coverage of District officials and employees is in
accordance with statutory provisions. The amount of coverage should be reviewed annually to ensure that coverage is adequate for current operations.
153

CEDAR RAPIDS COMMUNITY SCHOOL DISTRICT SCHEDULE OF FINDINGS AND QUESTIONED COSTS
Year Ended June 30, 2005 Part IV: Other Findings Related to Required Statutory Reporting: (Continued) IV-G-05 Board Minutes - No transactions requiring Board approval which had not been
approved by the Board were noted. However, we did note the monthly publication of the schedule of bills allowed did not include the bills allowed for the District’s Activity Funds.
Recommendation - The monthly publication of the schedule of bills allowed should
include all funds of the District. Response - Our current Activity Fund software does not allow for a consolidated list
of bills for the 11 separate schools generating checks. We are investigating alternative solutions, and intend to change our current procedures to comply with this requirement.
Conclusion – Response accepted. IV-H-05 Certified Enrollment - No instances of noncompliance were noted in the basic
enrollment data certified to the Department of Education. IV-I-05 Deposits and Investments - No instances of non-compliance with the deposit and
investment provisions of Chapter 12B and 12C of the Code of Iowa and the District’s investment policy were noted.
IV-J-05 Certified Annual Report - The Certified Annual Report was filed with the
Department of Education timely and we noted no significant deficiencies in the amounts reported.
154

CEDAR RAPIDS COMMUNITY SCHOOL DISTRICT SUMMARY SCHEDULE OF PRIOR FEDERAL AUDIT FINDINGS
Year Ended June 30, 2005
N/A
155

CEDAR RAPIDS COMMUNITY SCHOOL DISTRICT CORRECTIVE ACTION PLAN FOR FEDERAL AUDIT FINDINGS
Year Ended June 30, 2005 Contact Person, Anticipated Comment Title Date of Number Comment Title Corrective Action Plan Phone Number Completion
N/A
156