ced (v0.5) and descendants clas 12 software workshop 18 june 2014 david heddle cnu/jlab
TRANSCRIPT
ced (v0.5) and descendants
CLAS 12 Software Workshop18 June 2014
David Heddle CNU/JLAB

Why ced (cLAS eVENT dISPLAY)?
• In a “picture=1K words” sense it is – A graphical debugger, for reconstruction and hardware– a monitor– helps to validate simulation (and vice versa.)
• Useful only to the extent that we have been successful in making ced easy to use and to extend.
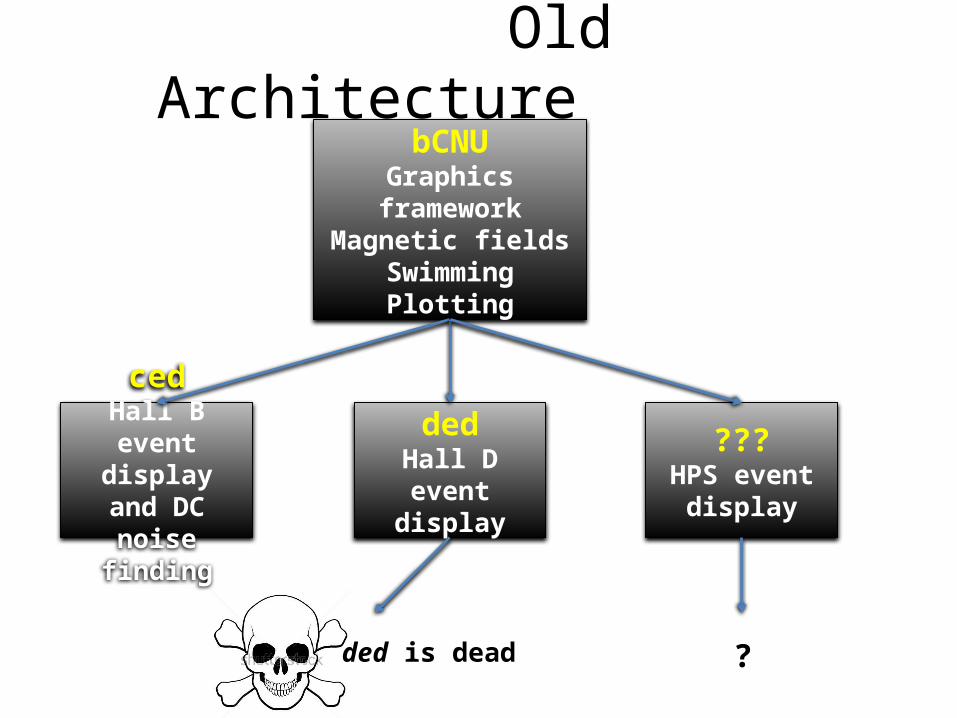
Old ArchitecturebCNU
Graphics frameworkMagnetic fields
SwimmingPlotting
cedHall B event
display and DC noise finding
dedHall D event
display
???HPS event
display
ded is dead ?
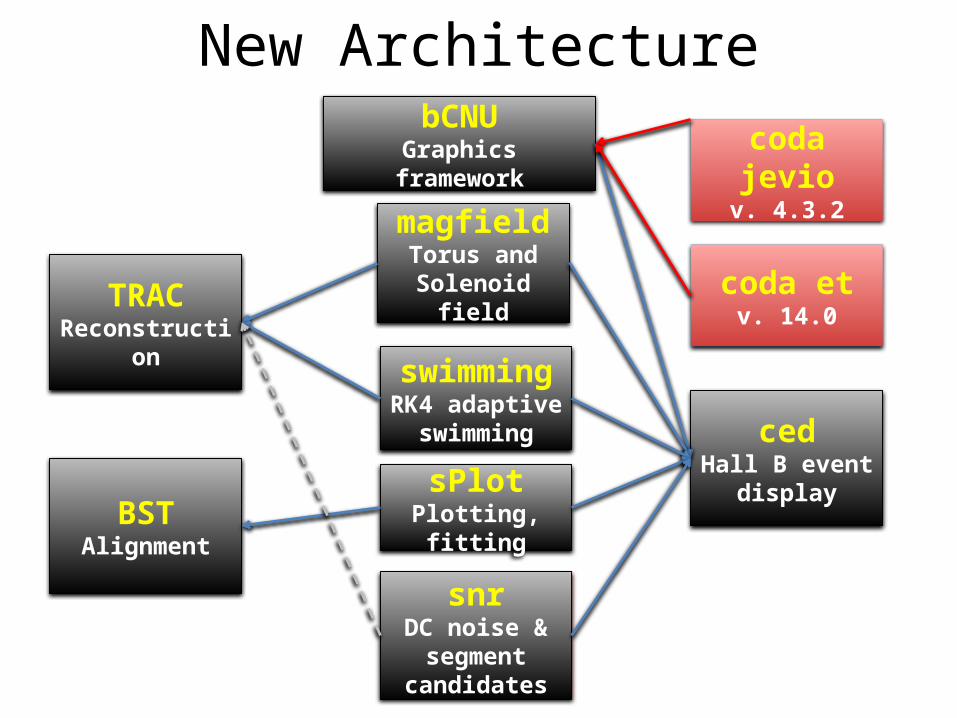
New ArchitecturebCNU
Graphics framework
magfieldTorus and
Solenoid field
swimmingRK4 adaptive
swimming
sPlotPlotting, fitting
cedHall B event
display
TRACReconstruction
BSTAlignment
coda jeviov. 4.3.2
coda etv. 14.0
snrDC noise &
segment candidates

magfield
To use programmatically:
MagneticFields.getMagneticFields()
MagneticFields.field(x,y,z,result)
The first call loads the fields (torus & solenoid) from binary maps
The second call takes an xyz (lab system, cm) and returns Bx, By, Bz (kG) in the result array (trilinear interpolated.)

swimming
Swimmer swimmer = new Swimmer(MagneticFields.getIField(MagneticFields.FieldType.TORUS));double ztarget = 2.75; //where integration should stop (m)double accuracy = 10e-6; //10 micronsdouble stepSize = 5e-4; // initial step size (m)int charge = 1; //e.g., protontry {
SwimTrajectory traj = swimmer.swim(charge, xo, yo, zo, momentum, theta,phi, ztarget, accuracy, rmax, maxPathLength, stepSize, CLAS_Tolerance, hdata);
} catch (RungeKuttaException e) {}}
To use programmatically

sPlotFits:
• Erf• Erfc• Generalized Least
Squares• Polynomial• Sum of Gaussians• Polynomial and sum
of Gaussians
• Cubic spline
• 1D histograms (dynamic binning)

snr
• Black hits are identified as noise and discarded• Red hits are saved• Red hits with yellow frames (look smaller) are saved noise (false alarms)• Shaded -> segment candidates, darker shading -> higher quality factor• Time ~ 10 ms

ced features
• Multiple 2D views of the detectors, some geometrically faithful and some not so much.
• A high degree of interactability, primarily through “mouse overs”
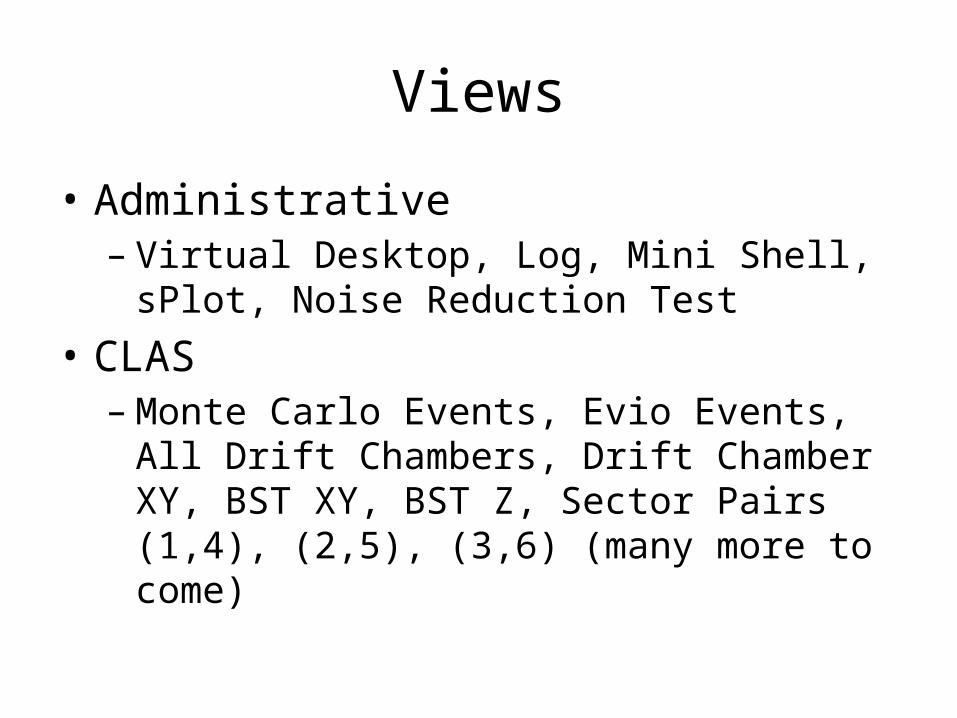
Views
• Administrative– Virtual Desktop, Log, Mini Shell, sPlot, Noise
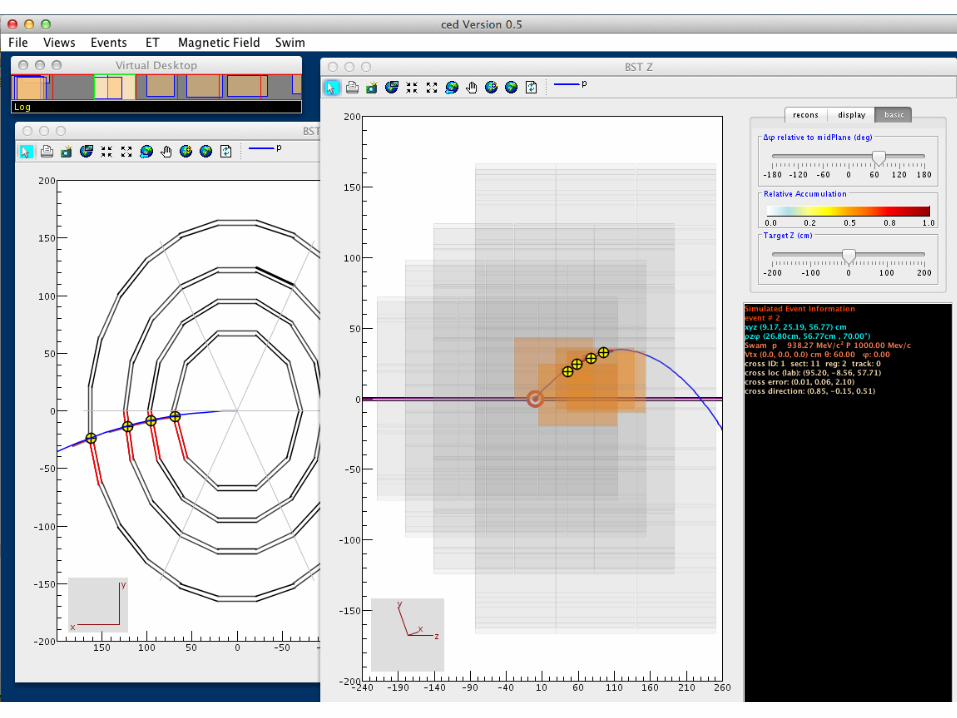
Reduction Test• CLAS– Monte Carlo Events, Evio Events, All Drift
Chambers, Drift Chamber XY, BST XY, BST Z, Sector Pairs (1,4), (2,5), (3,6) (many more to come)

As Appropriate ced displays
• Real, reconstructed and simulated data (with the ability to hide/show truth)
• Swam (swum?) trajectories• Plots (e.g., integral Bdl)• Magnetic field magnitude and components


(Near) Future
• ced infrastructure is complete—its basic architecture is sound and it has all the useful functionality from the 6GeV version (and more)
• It lacks only more detector implementations—but with the recent progress on the geometry service/library we can begin adding the missing detectors
• Will add more “accumulated” displays and user defined plots
• If you would like to use ced now for debugging and it lacks your detector—let me know.