ce 3372 water systems design lecture 003 – design criteria and demand estimation
TRANSCRIPT

CE 3372 Water Systems Design
Lecture 003 – Design Criteria and Demand Estimation

Outline
• Design criteria– Examples
• Estimating System Demand (or Capacity)– Water supply demand; population basis
Design Criteria
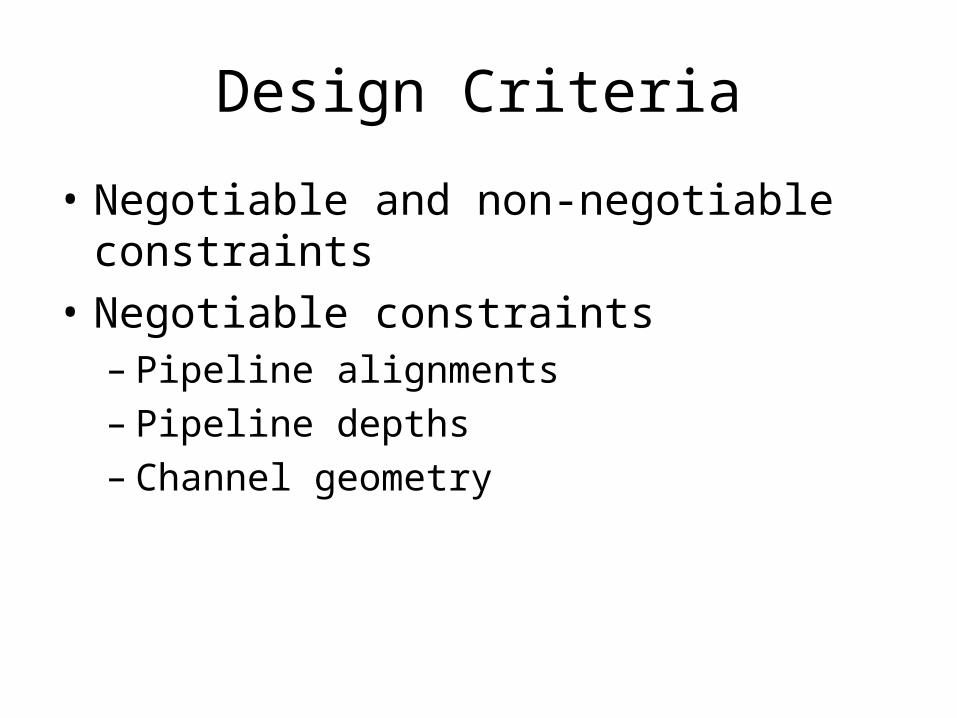
• Negotiable and non-negotiable constraints• Negotiable constraints
– Pipeline alignments– Pipeline depths– Channel geometry

Design Criteria
• Negotiable and non-negotiable constraints• Non-Negotiable constraints
– Continuity, Momentum, Energy• Water flows downhill, unless power and money are
applied
• Semi-Negotiable– Rules
• takes a long time to change• takes a lot of money for a variance

Design Criteria
• Non-negotiable constraints are dictated by laws of physics, chemistry (and to some extent mankind)
• Negotiable constraints are the design variables that can be adjusted to satisfy the non-negotiable constraints.

Design Criteria
• Design manuals• Codes, Guidance Documents, etc.
– These contain many “non-negotiable” constraints, and in essence guide a large part of design.
– Consider the TAC with regards to drinking water supply :
• the minimum spacing of a water line and a sewer line is a “non-negotiable” constraint.
• the pipe size, once above the minimum is negotiable.

Design Manuals
• Where do we get the guidance documents?– Texas Administrative Code

Design Manuals
• Where do we get the guidance documents?– Texas Administrative Code
• Part 1, Chapters 30 and 31 cover nearly all of what we might do as municipal water engineers
• Large diameter pipelines like the Lake Allen Henry to Lubbock are outside the scope of the code and are governed by broader guidance – these kinds of projects are uncommon and likely closely follow the intent of the TAC as appropriate.

Design Manuals
• Where do we get the guidance documents?– Flood Control Districts

Design Manuals
• Where do we get the guidance documents?– Local Jurisdictions

Design Manuals
• Where do we get the guidance documents?– Professional Organizations
Not everything is free – this MOP would be vital to a practicing engineer, but he/she would have to pay for it

Design Manuals
• Where do we get the guidance documents?– Professional Publications
– Often these publications are eventually integrated into jurisdictional design manuals.
– The example shown is the source of minimum sewer velocity criteria in the USA

Design Manuals
• Where do we get the guidance documents?– Vendor/Trade Organization Publications

Design Protocol
• Most design projects are defined by – Geographic location
• Nation, State, County – possibly a city. Get appropriate jurisdictional codes, criteria, etc. that are available.
– Client (who pays)• Might be able to help – esp. if the client is also a
jurisdictional entity.
– Activities• Things that have to get done, includes materials and
construction.

Design Protocol
• Once you define the location– Obtain the relevant manuals, in Texas usually the
TAC, a county manual, and city ordinances will apply.
– For missing items, use professional manuals of practice (there is liability protection for using a MOP – they represent current state-of-practice)
– For obscure items, use professional publications

Protocol
• As you define the activities– Obtain the relevant vendor materials manuals and
guidance documents– Cross-check suggested application with the
jurisdictional codes (and MOPs)– Obtain variances if you think a better solution
exists, but requires a non-certified material or construction process.

Demand/Use
• Agriculture – 50% of water is consumptive use. Seasonal and
may be inversely related to natural water availability
• Navigation • Hydroelectric Power/Steam Electric
Generation • Manufacturing
– Process Waters – Cooling Waters

Demand/Use
• Natural Systems– Instream flow requirements– Lake levels– Protection of fish and wildlife
• Cities and Other Communities – Drinking, cooking, laundry, pooping– Street cleaning– Fire demand– Landscaping– Commercial Use
• Recreation
Demand
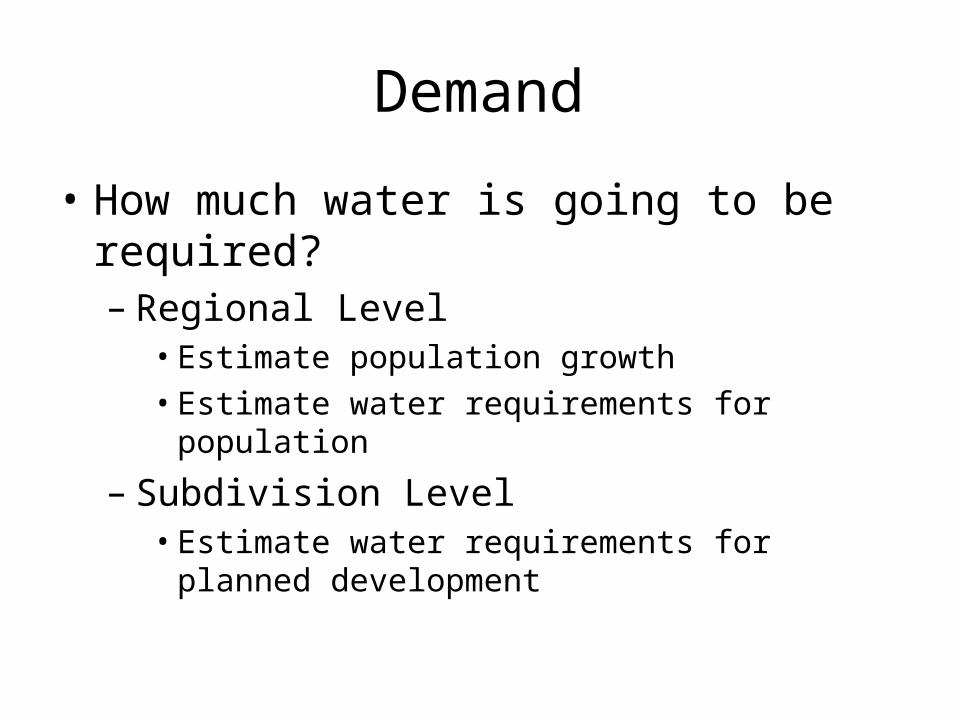
• How much water is going to be required?– Regional Level
• Estimate population growth• Estimate water requirements for population
– Subdivision Level • Estimate water requirements for planned development

Demand/Use
• WWI – American Forces Water Allocations– Army advancing: 0.5 gpd/soldier.– Army static: 1.0 gpd/soldier.– Field Hospital: 5.5 gpd/soldier.– Rear Areas: 10.0 gdp/soldier.– Base Hospital: 25.0 gpd/soldier.From: The Story of Man’s Quest for Water. Jasper
Owen Draffin. The Garrard Press. 1939.

Demand Estimation
• Water demands on a system need to be estimated in advance of design or retrofit.
• Demand depends on the type of customer:– Residential demand: water used in homes and
apartments. Usually estimated by volume/day/person. Usually quite variable, with peak to average ratios approaching 4.
– Commercial demand: water used in motels, restaurants, air conditioning, and similar activities. More predictable than residential.

Demand Estimation
• Water demands on a system need to be estimated in advance of design or retrofit.
• Demand depends on the type of customer:– Industrial demand: water used in industry,
manufacture, and similar activities. Includes “product” water; water bound in the product such as soft-drinks and such. Sometimes supplied separate from municipal system, but not always. Principles of design are the same.
– Agricultural demand — water used in agriculture. Large volumes, not usually part of a municipal system.

Average Demand
• Average demand is estimated based on the types of customers and the demand locations.
• Generally tabulated by various organizations– AWWA, ASCE and WEF would be good starting
places.– For regional scale estimation, USGS Circular 1200
(in Readings). – For commercial buildings and structures of that
nature, an alternative based on the fixture type and fixture count (.i.e. toilets, sinks, restaurant sinks.).

Average Demand
• Regional Estimation– The amount of water used in a locality is directly
related to the size of the population.– Errors in projecting population changes affect water
use projections as well.• Engineers normally do not conduct these analyses, as this
is in the realm of social scientists and economists. • As an example, many smaller suburban communities
actively recruit different types of industries that could have vastly different water demands and impacts on the local population.

Average Demand
• Population Models (Quick Background)– Two Growth Models Typically Used
• Arithmetic – project future using a constant slope line.
• Exponential – project future using exponential curve.
– Check past census data to see which is more appropriate

Average Demand
• Population Models (Quick Background)– Declining growth model.– Curvilinear method.– Area/Ratio method (based on census ratios)

Average Demand
• USGS Circular 1200

Average Demand
• Subdivision Scale– Average flow distribution. What is the median
average flow from this information?

Peak Demand
• Peak demand ranges from 1.5 to as much as 5 times average daily use, excluding fire flow.
• Usually the maximum daily consumption plus fire flow is larger than the maximum hourly demand, but not always. – In the case where the peak hourly exceeds the
maximum daily plus fire flow the peak value should be used for design.

Peak Demand
• Peak flow ratio adjustments by population and reference flow
Peak Demand
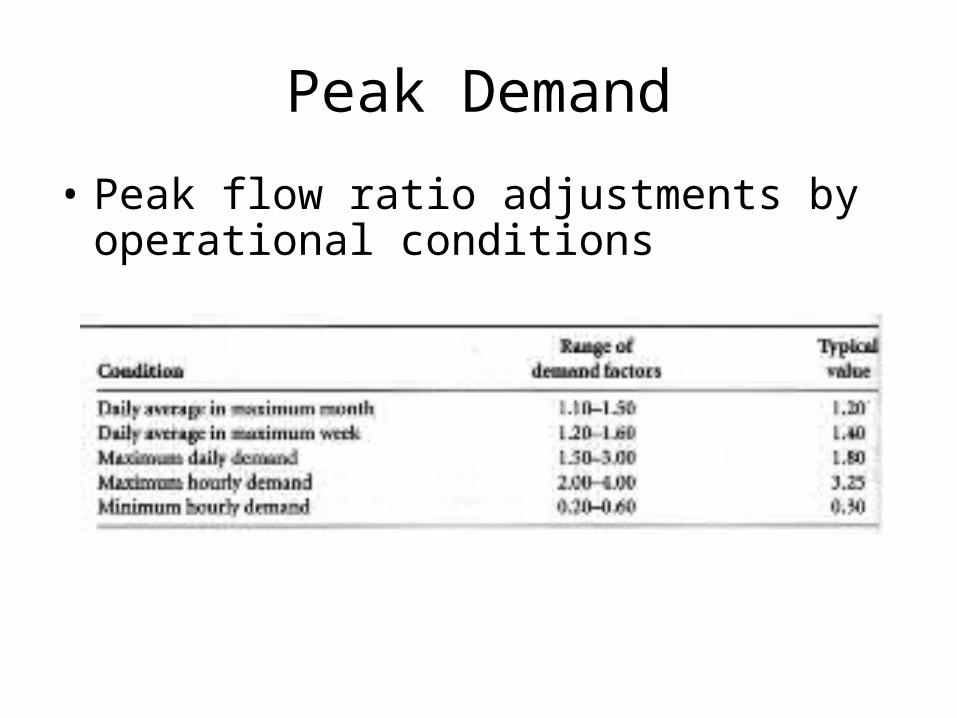
• Peak flow ratio adjustments by operational conditions

Pressure Requirements
• Pressure requirements in the system depend on the combined normal service requirements and fire flow demand.– Pressures must be high enough (at the pump)
to overcome energy losses within the system.– Additionally pressure requirements are a
function of the topography. – Water distribution systems are usually installed
at minimum depth (very close to grade) so that the pipes closely follow the topographic relief of the area.

Pressure Requirements
• System pressures are adapted to such requirements. – In hilly areas booster pumping may be required.– Exact minimum pressures in a system vary from
state to state, and the minimums are usually established by the state’s Health Department or similar agencies.
– The state Fire Marshall may establish additional requirements.

Pressure Requirements
• Typically 20 psi is an absolute minimum pressure in a distribution system when providing the maximum daily demand including fire flow or the peak hourly demand.– The minimum pressure is a safety requirement to
prevent potential back flows from house fixtures, and still have enough energy to push water up three stories.

Pressure Requirements
• Desirable pressure ranges are 40-60 psi in a residential area, with a typical upper limit of about 80 psi.– Above 80 psi, household fixtures are easily
damaged and pressure reducing valves are required.
– In commercial areas, a nominal pressure of 75 psi is desirable (commercial fixtures are built more ruggedly than residential).

Fire Flow Requirements
• Each jurisdiction establishes its own fire flow requirements. – As a guideline the ISO (Insurance Services Office)
has several approaches for fire flow estimation.– Single structure:
– Population based:
Assigning Demand
• The network models usually built at large scale (city-size) contain nodes that represent a multitude of actual connections. – While conceptually possible to model to every
single connection, to date this practice is discouraged, because
• the model is hard to maintain• small errors during development go unnoticed • the operation of any single connection is not well
known.

Assigning Demand• Typically a skeleton
model is used where individual demands are grouped and assigned to an appropriate node.
Cleveland, T.G., Rogers, J. R., Chuang L., Yuan, D, Reddy, B. and Owens, T. 1996. Research into Production Cost Reduction by Energy Management of Houston's Surface and Groundwater System. Final Report to Planning and Operations Support, Department of Public Works and Engineering, City of Houston, Houston, TX, 178p

Assigning Demand
Determine skeleton (pipe sizes to consider)

Assigning Demand
Build Network Model, Nodes and Links

Assigning Demand
Overlay Locations onto Network Simulator
Address Matching (from Billing Records) => Generate Demand Locations
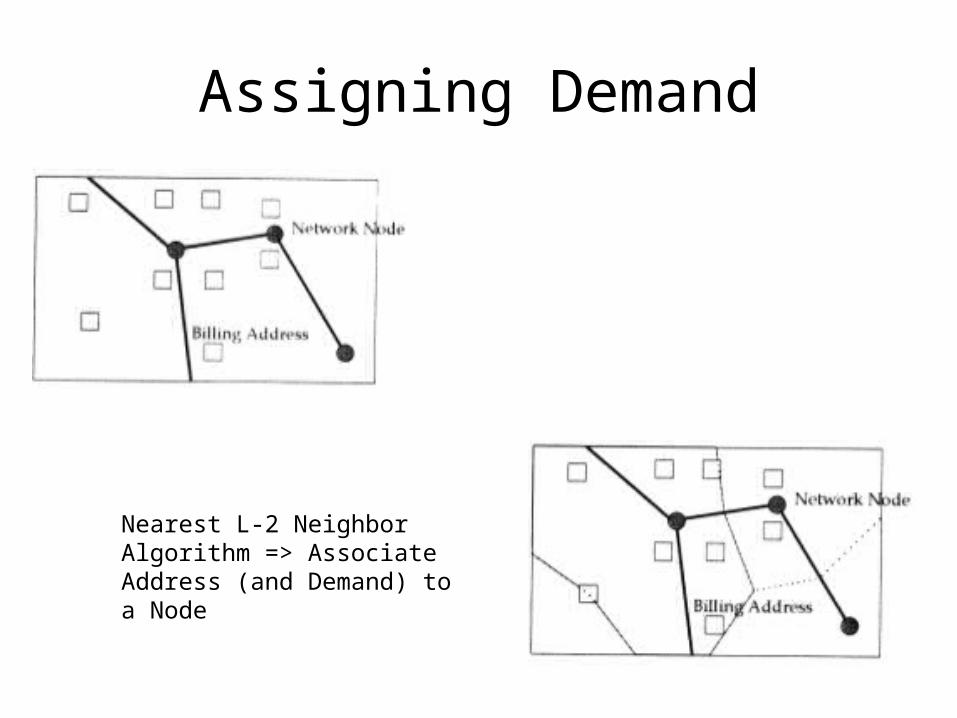
Assigning Demand
Nearest L-2 Neighbor Algorithm => Associate Address (and Demand) to a Node

Assigning Demand
Demand Pattern (Each Node corresponds to particular customers)

Assigning Demand
Now add Supply Locations => Simulate “What-If?”

Assigning Demand
• The challenge is in how to skeletonize– Analysis (as in Houston study), focus on enough
detail for the “what-if”.– Design focus on detail for “what-if” as well as
topology of the network.
Assigning Demand
• Distribution systems– Gravity
• uncommon: Ancient Rome, New York (circa 1800s)
– Pumped with marginal storage.• Houston (circa 1990s)
– Pumped with substantial (several hours) of storage.
• Most other systems in USA.

Gravity System
• Dependable– Source of supply must be located well above the
city– High-pressure demand for fire-fighting may
require pumper trucks
Pumped (Marginal Storage)
• Least Desirable– Pressures vary substantially with variations in flow– Provides no reserve if power failure

Pumped with Storage
• Most common • Water supplied at approximately uniform rate • Flow in excess of consumption stored in elevated tanks • Tank water provides flow and pressure when use is
high – Fire-fighting – High-use hours – Flow during power failure
• Storage volume throughout system and for individual service areas typically 15 –30% of maximum daily rate.

Network Types
• Branch– No circulation– Has terminals and dead-ends.
• Water in dead-ends is stagnant• Disinfection residual• Corrosion

Network Types
• Grid/Loop – Furnishes supply from more than one direction
• Water circulates– Disinfection is more effective.– Water “age” in system is younger (fresher).
• In case of water main break, fewer people are inconvenienced

Network Types
• Loop vs. Branch during network failure. – Every link in a branch system is a single point of
failure that isolates all downstream nodes.– No so with loop, only main supply line is such.

Pipe System
• Primary Mains (Arterial Mains)– Form the basic structure of the system and carry
flow from the pumping station to elevated storage tanks and from elevated storage tanks to the various districts of the city
• Laid out in interlocking loops• Mains not more than 1 km (3000 ft) apart
– Valved at intervals of not more than 1.5 km (1 mile)– Smaller lines connecting to them are valved

Pipe System
• Secondary Lines– Form smaller loops within the primary main
system– Run from one primary line to another
• Spacings of 2 to 4 blocks
– Provide large amounts of water for fire fighting with out excessive pressure loss

Pipe System
• Small distribution lines– Form a grid over the entire service area– Supply water to every user and fire hydrants –
Connected to primary, secondary, or other small mains at both ends
• Valved so the system can be shut down for repairs• Size may be dictated by fire flow except in residential
areas with very large lots

Collection Systems
• Capacity (demand) estimation is for later in the course.– Involves hydrology (usually)– Capacity is usually dependent on area served (in
contrast to population served)
• Wastewater demand can be reasonably estimated as some fraction of the freshwater demand.