ce 3354 engineering hydrology lecture 7: flood frequency (bulletin 17b)
TRANSCRIPT

CE 3354 Engineering HydrologyLecture 7: Flood Frequency (Bulletin 17B)
outline
Probability estimation modeling (continued) Bulletin 17B

Beargrass creek example
Examine concepts using annual peak discharge values for Beargrass Creek
Data are on class server

Beargrass creek example
Take the raw data, and sort small to big
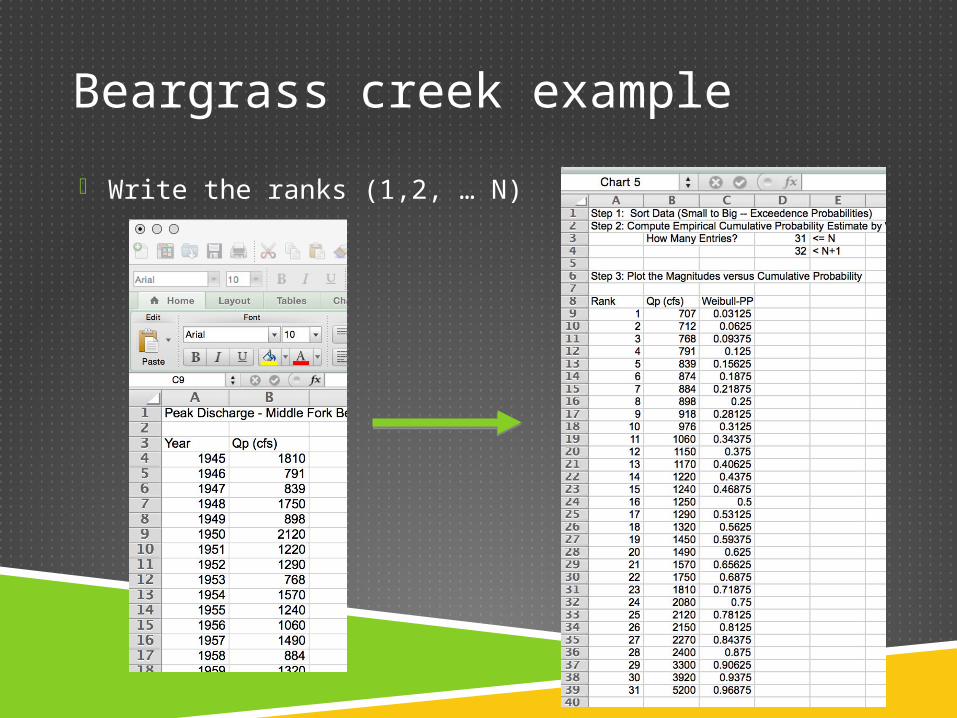
Beargrass creek example
Write the ranks (1,2, … N)
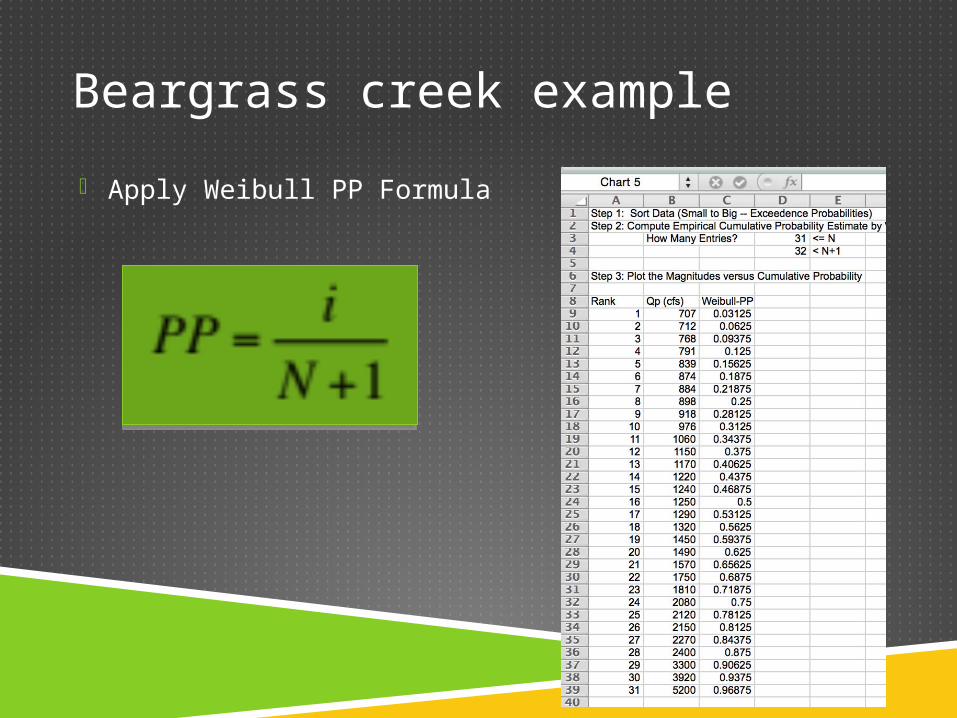
Beargrass creek example
Apply Weibull PP Formula

Beargrass creek example
Build Empirical CDF Plot

Beargrass creek example
At this point, can only evaluate the empirical CDF to infer probability and magnitudes.
The next step is to fit a probability distribution Normal Gumbell Log-Normal

Beargrass creek example
Fit Normal Distribution (conventional MOM) CMM pp. 363-377

Beargrass creek example
Fit Gumbell Distribution (conventional MOM)
CMM pp. 363-377

Beargrass creek example
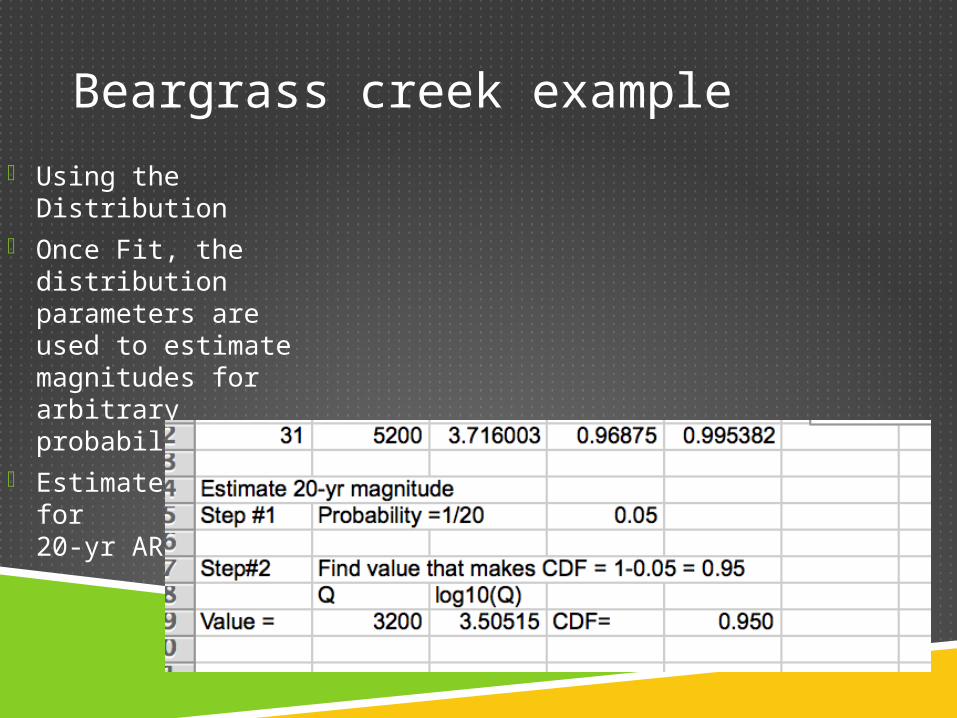
Using the Distribution Once Fit, the
distribution parameters are used to estimate magnitudes for arbitrary probabilities.
Estimate discharge for 20-yr ARI

Beargrass creek example
Using the Distribution Once Fit, the
distribution parameters are used to estimate magnitudes for arbitrary probabilities.
Estimate discharge for100-yr ARI

Beargrass creek example
Fit LogNormal Distribution (conventional MOM)
CMM pp. 363-377
Beargrass creek example
Using the Distribution Once Fit, the
distribution parameters are used to estimate magnitudes for arbitrary probabilities.
Estimate discharge for20-yr ARI

Probability estimation MODELING
Rank observations Compute plotting positions Plot Empirical Cumulative Distribution Select Probability Model (Normal, Gumbell, …) Fit the model to the Empirical Cumulative
Distribution Use the model to infer magnitudes at desired
cumulative probabilities

Bulletin 17B Methods
Bulletin 17B Methods
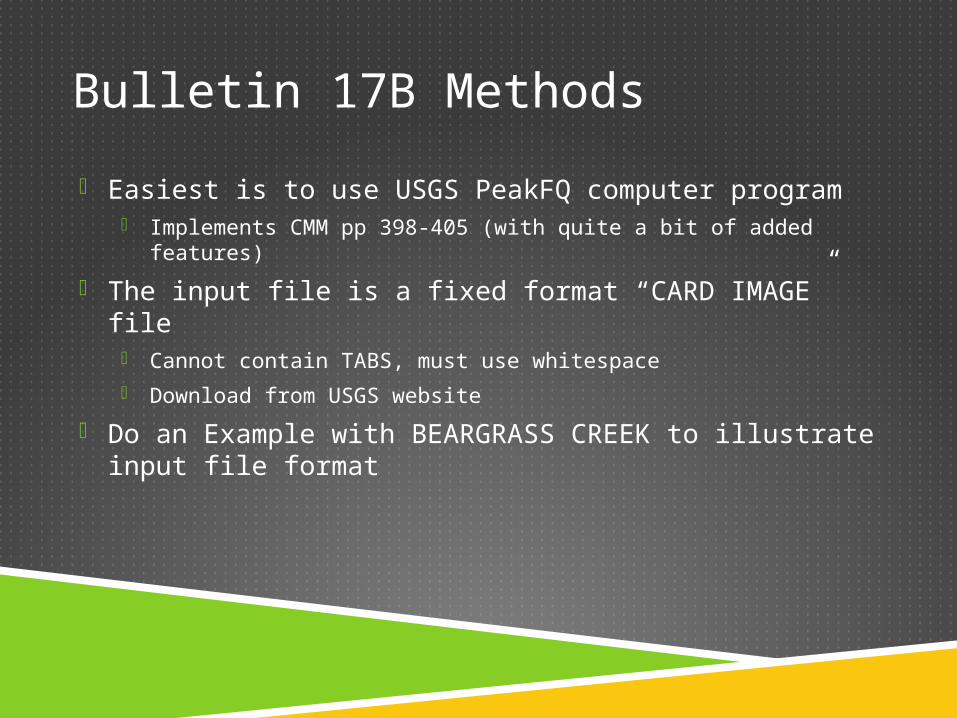
Easiest is to use USGS PeakFQ computer program Implements CMM pp 398-405 (with quite a bit of added features)
The input file is a fixed format “CARD IMAGE” file Cannot contain TABS, must use whitespace Download from USGS website
Do an Example with BEARGRASS CREEK to illustrate input file format

BULLETIN 17B Methods
Bulletin 17B included on server PeakFQ user manual included on server (need to get file
formats correct) Outlier analysis is semi-automated
PeakFQ will report if there are high and low outliers above/below criterion
User must then flag values (use a minus sign to skip a value) and reanalyze
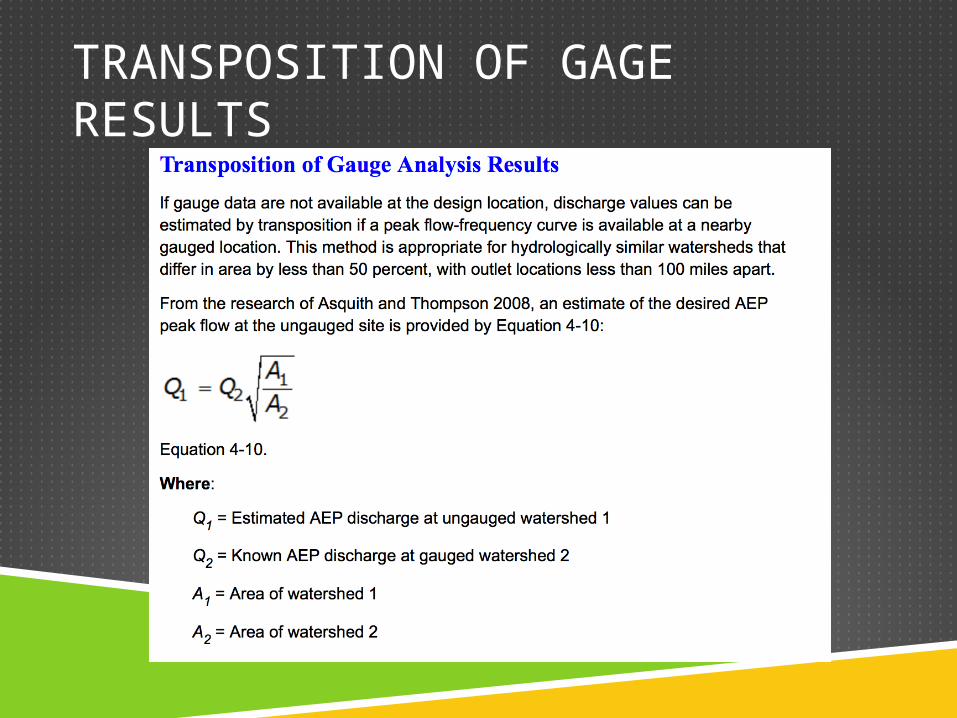
TRANSPOSITION OF GAGE RESULTS

SUMMARY
Probability estimation modeling fits probability distributions to observations
The fitted distributions are used to extrapolate and estimate magnitudes associated with arbitrary probabilities
Examples with Normal, LogNormal, and Gumbell in Excel were presented
Bulletin 17B using PeakFQ was demonstrates as was outlier identification (using the software)
Newer software in next few years to replace PeakFQ

NEXT TIME
Precipitation Design Storms
TP40 HY35
Intensity-Duration-Frequency NOAA Atlas 14 EBDLKUP