cdr pharmacoeconomic review report for ocrevus
TRANSCRIPT
Service Line: CADTH Common Drug Review
Version: Version 1.0
Publication Date: December 2017
Report Length: 37 Pages
CADTH COMMON DRUG REVIEW
Pharmacoeconomic Review Report
OCRELIZUMAB (OCREVUS)
(Hoffmann-La Roche Limited)
Indication: Treatment of adult patients with relapsing-remitting multiple sclerosis (RRMS) with active disease defined by clinical and imaging features.
CADTH COMMON DRUG REVIEW Pharmacoeconomic Review Report for Ocrelizumab 2
Disclaimer: The information in this document is intended to help Canadian health care decision-makers, health care professionals, health systems leaders,
and policy-makers make well-informed decisions and thereby improve the quality of health care services. While patients and others may access this document,
the document is made available for informational purposes only and no representations or warranties are made with respect to its fitness for any particular
purpose. The information in this document should not be used as a substitute for professional medical advice or as a substitute for the application of clinical
judgment in respect of the care of a particular patient or other professional judgment in any decision-making process. The Canadian Agency for Drugs and
Technologies in Health (CADTH) does not endorse any information, drugs, therapies, treatments, products, processes, or services.
While care has been taken to ensure that the information prepared by CADTH in this document is accurate, complete, and up-to-date as at the applicable date
the material was first published by CADTH, CADTH does not make any guarantees to that effect. CADTH does not guarantee and is not responsible for the
quality, currency, propriety, accuracy, or reasonableness of any statements, information, or conclusions contained in any third-party materials used in preparing
this document. The views and opinions of third parties published in this document do not necessarily state or reflect those of CADTH.
CADTH is not responsible for any errors, omissions, injury, loss, or damage arising from or relating to the use (or misuse) of any information, statements, or
conclusions contained in or implied by the contents of this document or any of the source materials.
This document may contain links to third-party websites. CADTH does not have control over the content of such sites. Use of third-party sites is governed by
the third-party website owners’ own terms and conditions set out for such sites. CADTH does not make any guarantee with respect to any information
contained on such third-party sites and CADTH is not responsible for any injury, loss, or damage suffered as a result of using such third-party sites. CADTH
has no responsibility for the collection, use, and disclosure of personal information by third-party sites.
Subject to the aforementioned limitations, the views expressed herein are those of CADTH and do not necessarily represent the views of Canada’s federal,
provincial, or territorial governments or any third party supplier of information.
This document is prepared and intended for use in the context of the Canadian health care system. The use of this document outside of Canada is done so at
the user’s own risk.
This disclaimer and any questions or matters of any nature arising from or relating to the content or use (or misuse) of this document will be governed by and
interpreted in accordance with the laws of the Province of Ontario and the laws of Canada applicable therein, and all proceedings shall be subject to the
exclusive jurisdiction of the courts of the Province of Ontario, Canada.
The copyright and other intellectual property rights in this document are owned by CADTH and its licensors. These rights are protected by the Canadian
Copyright Act and other national and international laws and agreements. Users are permitted to make copies of this document for non-commercial purposes
only, provided it is not modified when reproduced and appropriate credit is given to CADTH and its licensors.
About CADTH: CADTH is an independent, not-for-profit organization responsible for providing Canada’s health care decision-makers with objective evidence
to help make informed decisions about the optimal use of drugs, medical devices, diagnostics, and procedures in our health care system.
Funding: CADTH receives funding from Canada’s federal, provincial, and territorial governments, with the exception of Quebec.
CADTH COMMON DRUG REVIEW Pharmacoeconomic Review Report for Ocrelizumab 3
Table of Contents Abbreviations ............................................................................................................. 5
Executive Summary ................................................................................................... 7
Background ................................................................................................................................... 7
Summary of Identified Limitations and Key Results ...................................................................... 8
Conclusions .................................................................................................................................. 9
Information on the Pharmacoeconomic Submission ................................................ 10
Summary of the Manufacturer’s Pharmacoeconomic Submission .............................................. 10
Manufacturer’s Base Case .......................................................................................................... 12
Summary of Manufacturer’s Sensitivity Analyses ....................................................................... 13
Limitations of Manufacturer’s Submission ................................................................................... 14
CADTH Common Drug Review Reanalyses ............................................................................... 16
Issues for Consideration ............................................................................................................. 18
Patient Input ................................................................................................................................ 19
Conclusions ................................................................................................................................ 19
Appendix 1: Cost Comparison ................................................................................. 20
Appendix 2: Additional Information .......................................................................... 22
Appendix 3: Summary of Other Health Technology Assessment Reviews of Drug ................................................................................................. 23
Appendix 4: Reviewer Worksheets .......................................................................... 24
References ............................................................................................................ 36
CADTH COMMON DRUG REVIEW Pharmacoeconomic Review Report for Ocrelizumab 4
List of Tables
Table 1: Summary of the Manufacturer’s Economic Submission ...................................................... 6
Table 2: Summary of Results of the Manufacturer’s Base Case ..................................................... 12
Table 3: Sequential Incremental Cost-Effectiveness Ratio Analysis Results of the Manufacturer’s Base Case ................................................................................................ 13
Table 4: CADTH Common Drug Review Base Case ....................................................................... 16
Table 5: CADTH Common Drug Review Multi-Way Exploratory Analysis Using Annualized Relapse Rate and Disability Progression Estimates From a Published Network Meta-Analysis .................................................................................................................... 17
Table 6: CADTH Common Drug Review Reanalysis Price-Reduction Scenarios ........................... 18
Table 7: CADTH Common Drug Review Cost-Comparison Table for the Treatment of Relapsing-Remitting Multiple Sclerosis ............................................................................. 20
Table 8: Submission Quality ............................................................................................................ 22
Table 9: Authors Information ........................................................................................................... 22
Table 10: Data Sources ................................................................................................................... 25
Table 11: Manufacturer’s Key Assumptions .................................................................................... 29
Table 12: Sequential Incremental Cost-Effectiveness Ratio Analysis Results of the Manufacturer’s Base Case (Probabilistic)........................................................................ 31
Table 13: CADTH Common Drug Review Probabilistic Analysis Results Assuming 24-Week Confirmation Period for Disability Progression ................................................................ 31
Table 14: CADTH Common Drug Review Probabilistic Analysis Results Assuming Continuation of Treatment Effect and Accrual of Treatment Costs Based on Same Assumptions for All Comparators ............................................................................................................... 32
Table 15: CADTH Common Drug Review Probabilistic Analysis Results Assuming Annual Cost of $27,700 for Daclizumab ...................................................................................... 33
Table 16: CADTH Common Drug Review Probabilistic Analysis Results Assuming London, Ontario, Natural-History Data for All Health-State Transitions ........................... 33
Table 17: CADTH Common Drug Review Probabilistic Analysis Results Assuming Hernandez et al.17 Utilities for EDSS States 8 and 9 ......................................................................... 34
Table 18: Results of CADTH Common Drug Review One-Way Exploratory Analysis of the Manufacturer’s Base Case Assuming Estimates for ARR and Disability Progression from Published NMA ................................................................................................................ 35
List of Figure Figure 1: Manufacturer’s Model Structure ....................................................................................... 25
CADTH COMMON DRUG REVIEW Pharmacoeconomic Review Report for Ocrelizumab 5
Abbreviations AE adverse event
ARR
CDP
CDR
annualized relapse rate
confirmed disability progression
CADTH Common Drug Review
DMT disease-modifying therapy
EDSS Kurtzke Expanded Disability Status Scale
EQ-5D-3L EuroQol 5-Dimensions 3-Level questionnaire
ICER
ICUR
incremental cost-effectiveness ratio
incremental cost-utility ratio
LY life-year
MS
NICE
NMA
multiple sclerosis
National Institute for Health and Clinical Excellence
network-meta-analysis
PSA probabilistic sensitivity analysis
QALY quality-adjusted life-year
RMS
RRMS
relapsing forms of multiple sclerosis
relapsing-remitting multiple sclerosis
SPMS secondary-progressive multiple sclerosis
CADTH COMMON DRUG REVIEW Pharmacoeconomic Review Report for Ocrelizumab 6
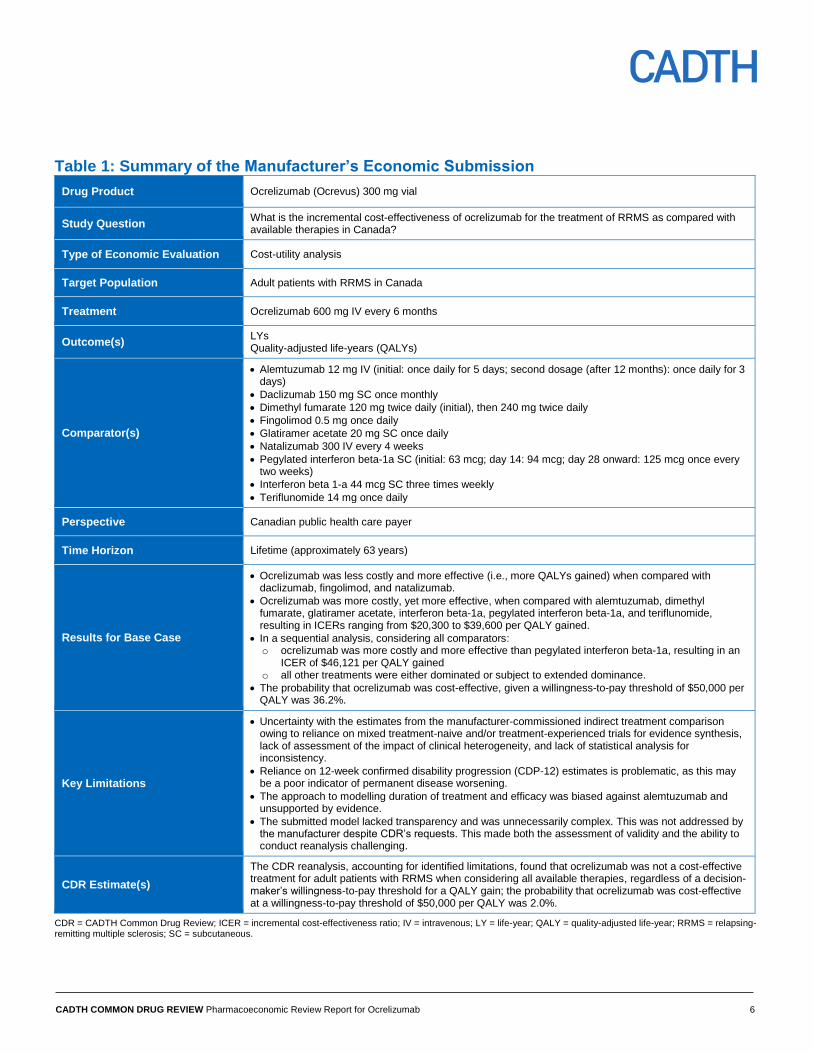
Table 1: Summary of the Manufacturer’s Economic Submission
Drug Product Ocrelizumab (Ocrevus) 300 mg vial
Study Question What is the incremental cost-effectiveness of ocrelizumab for the treatment of RRMS as compared with available therapies in Canada?
Type of Economic Evaluation Cost-utility analysis
Target Population Adult patients with RRMS in Canada
Treatment Ocrelizumab 600 mg IV every 6 months
Outcome(s) LYs Quality-adjusted life-years (QALYs)
Comparator(s)
Alemtuzumab 12 mg IV (initial: once daily for 5 days; second dosage (after 12 months): once daily for 3 days)
Daclizumab 150 mg SC once monthly
Dimethyl fumarate 120 mg twice daily (initial), then 240 mg twice daily
Fingolimod 0.5 mg once daily
Glatiramer acetate 20 mg SC once daily
Natalizumab 300 IV every 4 weeks
Pegylated interferon beta-1a SC (initial: 63 mcg; day 14: 94 mcg; day 28 onward: 125 mcg once every two weeks)
Interferon beta 1-a 44 mcg SC three times weekly
Teriflunomide 14 mg once daily
Perspective Canadian public health care payer
Time Horizon Lifetime (approximately 63 years)
Results for Base Case
Ocrelizumab was less costly and more effective (i.e., more QALYs gained) when compared with daclizumab, fingolimod, and natalizumab.
Ocrelizumab was more costly, yet more effective, when compared with alemtuzumab, dimethyl fumarate, glatiramer acetate, interferon beta-1a, pegylated interferon beta-1a, and teriflunomide, resulting in ICERs ranging from $20,300 to $39,600 per QALY gained.
In a sequential analysis, considering all comparators: o ocrelizumab was more costly and more effective than pegylated interferon beta-1a, resulting in an
ICER of $46,121 per QALY gained o all other treatments were either dominated or subject to extended dominance.
The probability that ocrelizumab was cost-effective, given a willingness-to-pay threshold of $50,000 per QALY was 36.2%.
Key Limitations
Uncertainty with the estimates from the manufacturer-commissioned indirect treatment comparison owing to reliance on mixed treatment-naive and/or treatment-experienced trials for evidence synthesis, lack of assessment of the impact of clinical heterogeneity, and lack of statistical analysis for inconsistency.
Reliance on 12-week confirmed disability progression (CDP-12) estimates is problematic, as this may be a poor indicator of permanent disease worsening.
The approach to modelling duration of treatment and efficacy was biased against alemtuzumab and unsupported by evidence.
The submitted model lacked transparency and was unnecessarily complex. This was not addressed by the manufacturer despite CDR’s requests. This made both the assessment of validity and the ability to conduct reanalysis challenging.
CDR Estimate(s)
The CDR reanalysis, accounting for identified limitations, found that ocrelizumab was not a cost-effective treatment for adult patients with RRMS when considering all available therapies, regardless of a decision-maker’s willingness-to-pay threshold for a QALY gain; the probability that ocrelizumab was cost-effective at a willingness-to-pay threshold of $50,000 per QALY was 2.0%.
CDR = CADTH Common Drug Review; ICER = incremental cost-effectiveness ratio; IV = intravenous; LY = life-year; QALY = quality-adjusted life-year; RRMS = relapsing-remitting multiple sclerosis; SC = subcutaneous.
CADTH COMMON DRUG REVIEW Pharmacoeconomic Review Report for Ocrelizumab 7
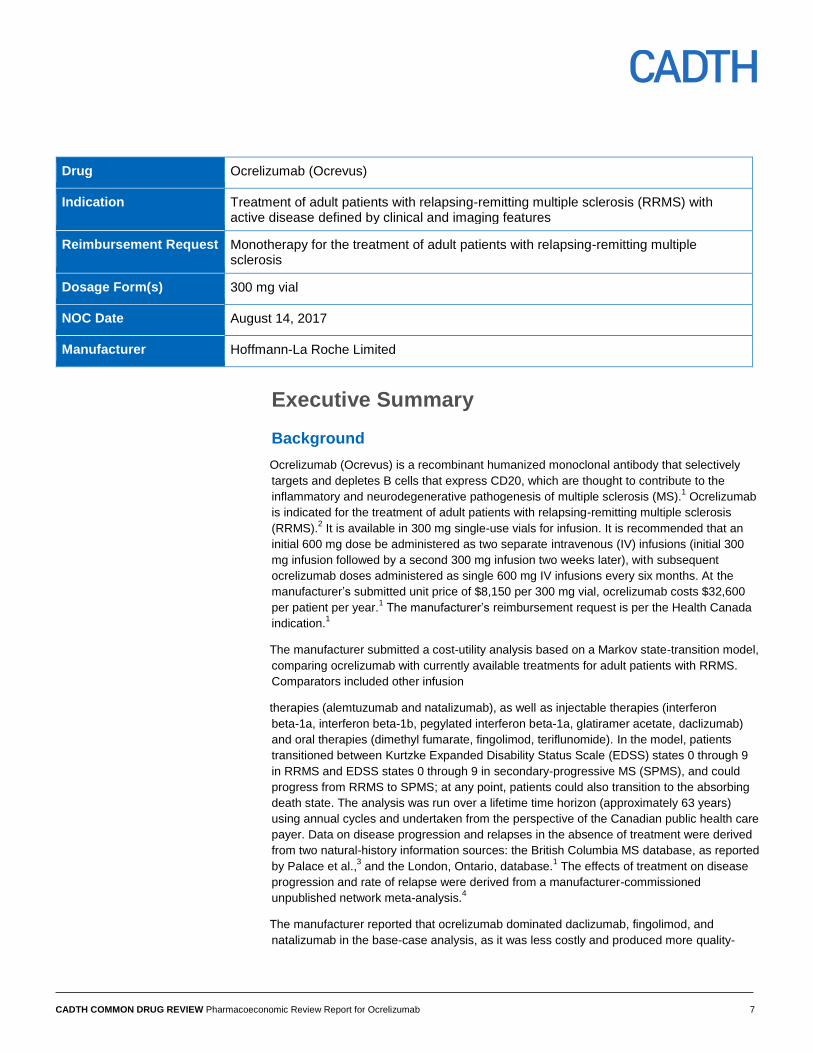
Drug Ocrelizumab (Ocrevus)
Indication Treatment of adult patients with relapsing-remitting multiple sclerosis (RRMS) with active disease defined by clinical and imaging features
Reimbursement Request Monotherapy for the treatment of adult patients with relapsing-remitting multiple sclerosis
Dosage Form(s) 300 mg vial
NOC Date August 14, 2017
Manufacturer Hoffmann-La Roche Limited
Executive Summary
Background
Ocrelizumab (Ocrevus) is a recombinant humanized monoclonal antibody that selectively
targets and depletes B cells that express CD20, which are thought to contribute to the
inflammatory and neurodegenerative pathogenesis of multiple sclerosis (MS).1 Ocrelizumab
is indicated for the treatment of adult patients with relapsing-remitting multiple sclerosis
(RRMS).2 It is available in 300 mg single-use vials for infusion. It is recommended that an
initial 600 mg dose be administered as two separate intravenous (IV) infusions (initial 300
mg infusion followed by a second 300 mg infusion two weeks later), with subsequent
ocrelizumab doses administered as single 600 mg IV infusions every six months. At the
manufacturer’s submitted unit price of $8,150 per 300 mg vial, ocrelizumab costs $32,600
per patient per year.1 The manufacturer’s reimbursement request is per the Health Canada
indication.1
The manufacturer submitted a cost-utility analysis based on a Markov state-transition model,
comparing ocrelizumab with currently available treatments for adult patients with RRMS.
Comparators included other infusion
therapies (alemtuzumab and natalizumab), as well as injectable therapies (interferon
beta-1a, interferon beta-1b, pegylated interferon beta-1a, glatiramer acetate, daclizumab)
and oral therapies (dimethyl fumarate, fingolimod, teriflunomide). In the model, patients
transitioned between Kurtzke Expanded Disability Status Scale (EDSS) states 0 through 9
in RRMS and EDSS states 0 through 9 in secondary-progressive MS (SPMS), and could
progress from RRMS to SPMS; at any point, patients could also transition to the absorbing
death state. The analysis was run over a lifetime time horizon (approximately 63 years)
using annual cycles and undertaken from the perspective of the Canadian public health care
payer. Data on disease progression and relapses in the absence of treatment were derived
from two natural-history information sources: the British Columbia MS database, as reported
by Palace et al.,3 and the London, Ontario, database.
1 The effects of treatment on disease
progression and rate of relapse were derived from a manufacturer-commissioned
unpublished network meta-analysis.4
The manufacturer reported that ocrelizumab dominated daclizumab, fingolimod, and
natalizumab in the base-case analysis, as it was less costly and produced more quality-
CADTH COMMON DRUG REVIEW Pharmacoeconomic Review Report for Ocrelizumab 8
adjusted life-years (QALYs) than these treatments. When compared with alemtuzumab,
dimethyl fumarate, glatiramer acetate, interferon beta-1a, pegylated interferon beta-1a, and
teriflunomide, ocrelizumab was more costly yet more effective than these comparators and
resulted in incremental cost-utility ratios (ICURs) that ranged from $20,328 per QALY
gained (versus dimethyl fumarate) and $39,626 per QALY gained (versus pegylated
interferon beta-1a). No large survival differences were predicted between comparators in
terms of life-years gained. Sequential ICUR analysis of the manufacturer’s base-case
results found that ocrelizumab was the optimal therapy at a willingness-to-pay threshold
greater or equal to $46,121; if a decision-maker’s willingness-to-pay for a QALY gain is less
than $46,122, then pegylated interferon beta-1a is the optimal therapy. All other treatments
were either dominated or subject to extended dominance based on findings from the
manufacturer’s probabilistic analysis.
Summary of Identified Limitations and Key Results
The CADTH Common Drug Review (CDR) identified the following primary limitations relating
to the manufacturer’s economic model:
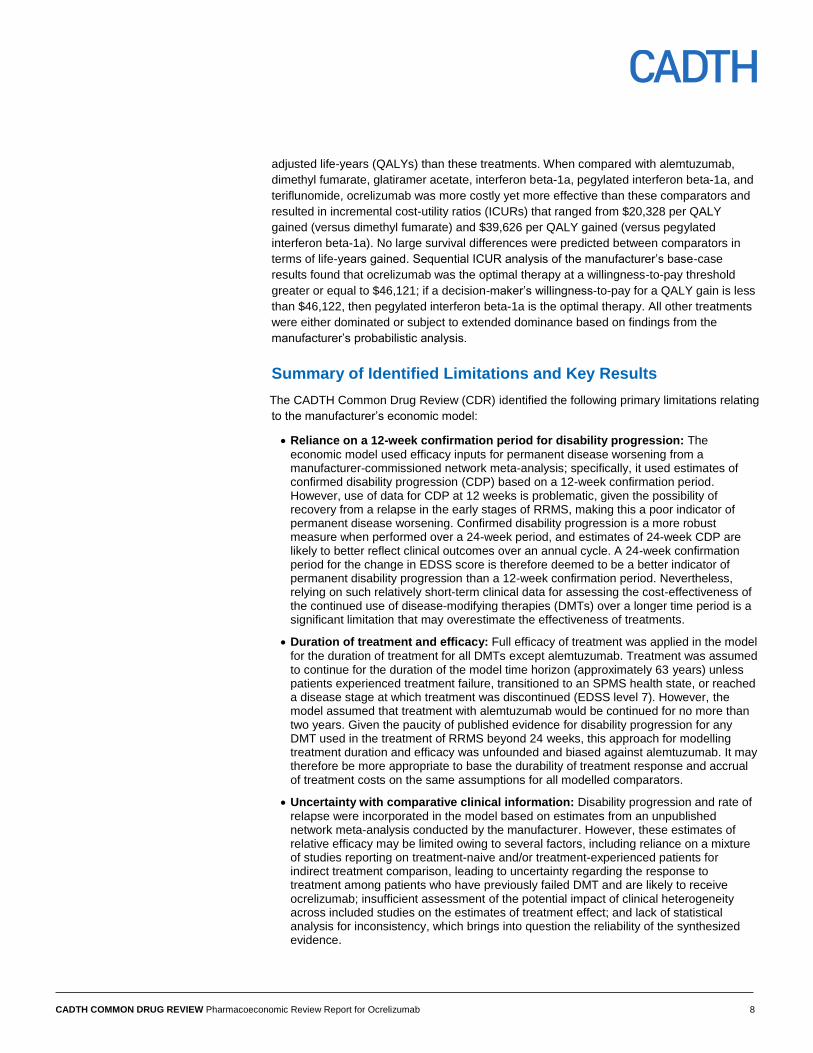
Reliance on a 12-week confirmation period for disability progression: The
economic model used efficacy inputs for permanent disease worsening from a manufacturer-commissioned network meta-analysis; specifically, it used estimates of confirmed disability progression (CDP) based on a 12-week confirmation period. However, use of data for CDP at 12 weeks is problematic, given the possibility of recovery from a relapse in the early stages of RRMS, making this a poor indicator of permanent disease worsening. Confirmed disability progression is a more robust measure when performed over a 24-week period, and estimates of 24-week CDP are likely to better reflect clinical outcomes over an annual cycle. A 24-week confirmation period for the change in EDSS score is therefore deemed to be a better indicator of permanent disability progression than a 12-week confirmation period. Nevertheless, relying on such relatively short-term clinical data for assessing the cost-effectiveness of the continued use of disease-modifying therapies (DMTs) over a longer time period is a significant limitation that may overestimate the effectiveness of treatments.
Duration of treatment and efficacy: Full efficacy of treatment was applied in the model
for the duration of treatment for all DMTs except alemtuzumab. Treatment was assumed to continue for the duration of the model time horizon (approximately 63 years) unless patients experienced treatment failure, transitioned to an SPMS health state, or reached a disease stage at which treatment was discontinued (EDSS level 7). However, the model assumed that treatment with alemtuzumab would be continued for no more than two years. Given the paucity of published evidence for disability progression for any DMT used in the treatment of RRMS beyond 24 weeks, this approach for modelling treatment duration and efficacy was unfounded and biased against alemtuzumab. It may therefore be more appropriate to base the durability of treatment response and accrual of treatment costs on the same assumptions for all modelled comparators.
Uncertainty with comparative clinical information: Disability progression and rate of
relapse were incorporated in the model based on estimates from an unpublished network meta-analysis conducted by the manufacturer. However, these estimates of relative efficacy may be limited owing to several factors, including reliance on a mixture of studies reporting on treatment-naive and/or treatment-experienced patients for indirect treatment comparison, leading to uncertainty regarding the response to treatment among patients who have previously failed DMT and are likely to receive ocrelizumab; insufficient assessment of the potential impact of clinical heterogeneity across included studies on the estimates of treatment effect; and lack of statistical analysis for inconsistency, which brings into question the reliability of the synthesized evidence.
CADTH COMMON DRUG REVIEW Pharmacoeconomic Review Report for Ocrelizumab 9
CDR identified several other parameters of uncertainty, including health-state utility values,
the treatment cost of daclizumab, and natural-history data. These parameters were
considered in combination with key limitations relating to the use of data for CDP at
12 weeks and the assumption regarding treatment duration and efficacy in defining the CDR
base case. CDR reanalysis, accounting for these limitations and considering all available
RRMS treatments, suggested that ocrelizumab was not cost-effective, regardless of a
decision-maker’s willingness-to-pay threshold for a QALY gain. The probability that
ocrelizumab was cost-effective at a willingness-to-pay threshold of $50,000 per QALY was
2.0%, and at a willingness-to-pay threshold of $100,000, it was 12.9%. Sequential ICUR
analysis of the CDR base case found that pegylated interferon beta-1a was the optimal
therapy at a willingness-to-pay threshold of less than $151,610 per QALY gained, while
daclizumab is the optimal therapy if a decision-maker’s willingness to pay for a QALY gain
was greater than $151,610 but less than $258,857. If a decision-maker’s willingness to pay
for one QALY was greater than $258,857, alemtuzumab was the optimal therapy.
Conclusions
When considering all available therapies, CDR found that ocrelizumab was not a cost-
effective treatment for adult patients with RRMS, regardless of a decision-maker’s
willingness to pay for a QALY gain, with a 2.0% probability of being cost-effective at a
willingness-to-pay threshold of $50,000 per QALY, and a 12.9% probability of being cost-
effective at a willingness-to-pay threshold of $100,000 per QALY. At a price reduction of
50% or greater (of the submitted price), the probability that ocrelizumab would be cost-
effective at a willingness-to-pay threshold of $50,000 per QALY is above 80%.
Given the lack of transparency in the manufacturer-submitted model, which made both the
assessment of validity and the ability to conduct reanalysis challenging, results may warrant
careful interpretation.
CADTH COMMON DRUG REVIEW Pharmacoeconomic Review Report for Ocrelizumab 10
Information on the Pharmacoeconomic Submission
Summary of the Manufacturer’s Pharmacoeconomic Submission
The manufacturer submitted an economic model that captured health outcomes in terms of
life-years (LYs) gained and quality-adjusted life-years (QALYs) gained. The model
compared the cost-effectiveness of ocrelizumab and other therapies for relapsing-remitting
multiple sclerosis (RRMS) reimbursed in Canada, including other infusion therapies
(alemtuzumab, natalizumab), injectable therapies (interferon beta-1a, pegylated interferon
beta1a, glatiramer acetate, daclizumab), and oral pharmacotherapies (dimethyl fumarate,
fingolimod, teriflunomide).1 The target population was adult patients with RRMS, as in the
OPERA-I and OPERA-II clinical trials.5,6 The modelled patients were on average assumed
to be 37 years at the time of entry into the model; patients were also predominantly female
(66%) and were distributed across different Kurtzke Expanded Disability Status Scale
(EDSS) scores based on the baseline distribution observed in the OPERA trials. The model
was run using annual cycles over a lifetime time horizon (approximately 63 years) in the
base case. All costs and outcomes were discounted at an annual rate of 1.5%, and the
analysis was conducted from the perspective of the Canadian publicly funded health care
system.
Model Structure
A cohort multi-state Markov model was developed in Microsoft Excel to simulate the disease
course of patients with relapsing multiple sclerosis (RMS) receiving treatment with
ocrelizumab and other relevant comparators based on a progression through EDSS scores.
The model was based on EDSS scores 0 through 9 in RRMS (modelled as RRMS-treated
and RRMS-untreated, separately), EDSS scores 0 through 9 in secondary-progressive
multiple sclerosis (SPMS), and death. Patients with RRMS entered the model at one of the
10 EDSS scores under RRMS-treated (i.e., patients with RRMS treated with either
ocrelizumab or another comparator), as illustrated in Figure 1 of Appendix 4. In each annual
cycle, patients could then: (1) transition between EDSS states within RRMS-treated; (2)
discontinue treatment and transition to RRMS-untreated; (3) progress to SPMS; or (4)
transition to the absorbing death state. The transition from RRMS-treated to RRMS-
untreated in EDSS scores 0 to 6 was based on treatment-specific all-cause discontinuation
rates derived from the manufacturer-submitted network meta-analysis (NMA), while it was
assumed that patients who reached an EDSS of score 7 or greater while receiving
treatment would discontinue treatment. Following discontinuation, patients switched to
RRMS-untreated and transitioned between EDSS states within this category, as informed
by natural-history data.3 The transitions from RRMS-treated and RRMS-untreated to SPMS
and transitions within SPMS were also informed by natural-history data.1,3
At any point,
patients could transition to death, as informed by general population mortality, adjusted by
EDSS state-specific mortality multipliers,7 with no direct treatment effect assumed.
Model Inputs
For patients receiving treatment (i.e., RRMS-treated), transition probabilities between EDSS
states were derived from natural-history information on untreated patients with RMS
reported by Palace et al.,3 adjusted by a treatment effect derived from the manufacturer’s
CADTH COMMON DRUG REVIEW Pharmacoeconomic Review Report for Ocrelizumab 11
NMA.4 After discontinuing treatment (ocrelizumab or other therapy), patients were assumed
to no longer be receiving a disease-modifying therapy (DMT) (i.e., RRMS-untreated), and
that they transitioned between EDSS states within RRMS based on the Palace et al. data,
which were derived from 898 untreated patients with RMS in the British Columbia Multiple
Sclerosis (BCMS) database during the 1980 to 1995 period.3 After entry into the model,
patients with RRMS could progress to a higher or lower EDSS score or remain at the same
EDSS score annually.
The probabilities of transition from RRMS to SPMS were based on natural-history data from
the London, Ontario, data set, which captured at least 16 years of prospective follow-up
data on patients from the London Multiple Sclerosis clinic in London, Ontario.1 Transition
from RRMS to SPMS is dependent on EDSS score and treatment. The treatment indirectly
affects transition to SPMS, as conversion to SPMS increases with EDSS score.
The transition probabilities between EDSS states within SPMS were also based on the data
reported by Palace et al.3 The analyses in Palace et al. were based on a pooled population
of patients with RRMS and SPMS who did not receive treatment. Similar to the application
of Palace et al. data to RRMS, improvement in EDSS score was allowed when these data
were applied to SPMS.
Natural-history annualized relapse rate (ARR) was informed by the United Kingdom (UK)
multiple sclerosis (MS) survey and data from Patzold and Pocklington.8 Treatment effects
on disease progression and relapse rates were informed by the manufacturer’s NMA4 and
assumed to remain constant over the time when patients were receiving treatment, without
considering waning effects. For each treatment, the same relative effects on disability
progression and relapse rates were assumed, regardless of EDSS score, due to limited
data availability. It was assumed that relapses would not require hospitalization. The annual
probability of adverse events (AEs) for ocrelizumab was derived from the OPERA-I and
OPERA-II trial data,5,6
while the annual AE rates for other comparators were obtained from
the recent Biogen daclizumab submission to the UK National Institute for Health and Care
Excellence (NICE).9 Only those AEs with an annual risk of occurrence greater than or equal
to 5% were included in the analysis. Mortality rates were estimated based on all-cause
mortality data for the Canadian general population, adjusted by the female-to-male ratio of
RRMS patients used in the model and by EDSS state-specific mortality multipliers sourced
from Pokorski et al.7
Health-state utilities in the model were based on disease severity (as measured by EDSS)
and disease phase (RRMS or SPMS). The utilities by EDSS in RRMS health states were
elicited using the UK value set10
for the EuroQol 5-Dimensions 3-Level questionnaire (EQ-
5D-3L) values recorded from the OPERA trials; utility values for EDSS scores 8 and 9 were
derived using utility weights from a cross-sectional study by Orme et al.,11
as small sample
sizes from the OPERA trials did not allow direct elicitation of these EDSS-specific utility
values.1 For patients who experienced a relapse without hospitalization or who transitioned
from RRMS to SPMS, a further utility loss was applied in the model. Each relapse was
assumed to last 46 days, as reported in a published University of Sheffield School of Health
and Related Research report of beta interferons and glatiramer acetate.12
Costs included
were those for disease management (excluding costs of DMTs and relapses),
administration and monitoring, and drug acquisition (excluding dispensing fees or mark-
ups), as well as costs for non-hospitalized relapse and AEs; all costs were reported in 2017
Canadian dollars.
CADTH COMMON DRUG REVIEW Pharmacoeconomic Review Report for Ocrelizumab 12
Manufacturer’s Base Case
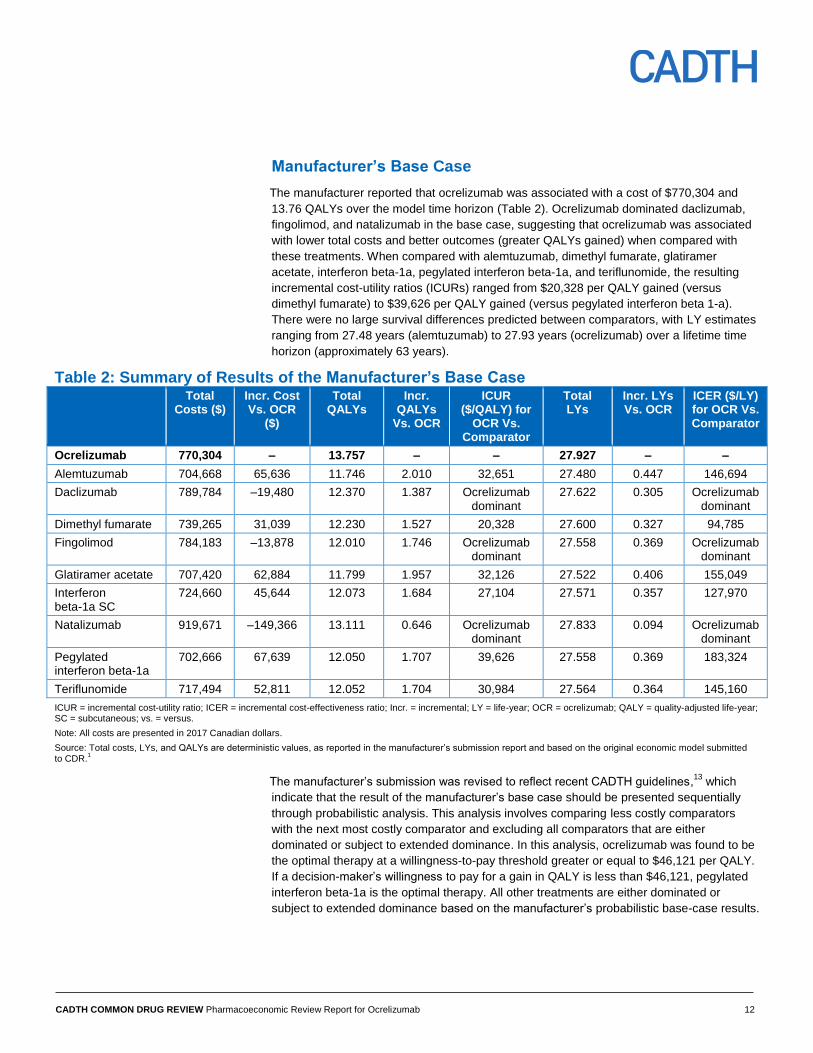
The manufacturer reported that ocrelizumab was associated with a cost of $770,304 and
13.76 QALYs over the model time horizon (Table 2). Ocrelizumab dominated daclizumab,
fingolimod, and natalizumab in the base case, suggesting that ocrelizumab was associated
with lower total costs and better outcomes (greater QALYs gained) when compared with
these treatments. When compared with alemtuzumab, dimethyl fumarate, glatiramer
acetate, interferon beta-1a, pegylated interferon beta-1a, and teriflunomide, the resulting
incremental cost-utility ratios (ICURs) ranged from $20,328 per QALY gained (versus
dimethyl fumarate) to $39,626 per QALY gained (versus pegylated interferon beta 1-a).
There were no large survival differences predicted between comparators, with LY estimates
ranging from 27.48 years (alemtuzumab) to 27.93 years (ocrelizumab) over a lifetime time
horizon (approximately 63 years).
Table 2: Summary of Results of the Manufacturer’s Base Case Total
Costs ($) Incr. Cost Vs. OCR
($)
Total QALYs
Incr. QALYs
Vs. OCR
ICUR ($/QALY) for
OCR Vs. Comparator
Total LYs
Incr. LYs Vs. OCR
ICER ($/LY) for OCR Vs. Comparator
Ocrelizumab 770,304 – 13.757 – – 27.927 – –
Alemtuzumab 704,668 65,636 11.746 2.010 32,651 27.480 0.447 146,694
Daclizumab 789,784 –19,480 12.370 1.387 Ocrelizumab dominant
27.622 0.305 Ocrelizumab dominant
Dimethyl fumarate 739,265 31,039 12.230 1.527 20,328 27.600 0.327 94,785
Fingolimod 784,183 –13,878 12.010 1.746 Ocrelizumab dominant
27.558 0.369 Ocrelizumab dominant
Glatiramer acetate 707,420 62,884 11.799 1.957 32,126 27.522 0.406 155,049
Interferon beta-1a SC
724,660 45,644 12.073 1.684 27,104 27.571 0.357 127,970
Natalizumab 919,671 –149,366 13.111 0.646 Ocrelizumab dominant
27.833 0.094 Ocrelizumab dominant
Pegylated interferon beta-1a
702,666 67,639 12.050 1.707 39,626 27.558 0.369 183,324
Teriflunomide 717,494 52,811 12.052 1.704 30,984 27.564 0.364 145,160
ICUR = incremental cost-utility ratio; ICER = incremental cost-effectiveness ratio; Incr. = incremental; LY = life-year; OCR = ocrelizumab; QALY = quality-adjusted life-year; SC = subcutaneous; vs. = versus.
Note: All costs are presented in 2017 Canadian dollars.
Source: Total costs, LYs, and QALYs are deterministic values, as reported in the manufacturer’s submission report and based on the original economic model submitted to CDR.
1
The manufacturer’s submission was revised to reflect recent CADTH guidelines,13
which
indicate that the result of the manufacturer’s base case should be presented sequentially
through probabilistic analysis. This analysis involves comparing less costly comparators
with the next most costly comparator and excluding all comparators that are either
dominated or subject to extended dominance. In this analysis, ocrelizumab was found to be
the optimal therapy at a willingness-to-pay threshold greater or equal to $46,121 per QALY.
If a decision-maker’s willingness to pay for a gain in QALY is less than $46,121, pegylated
interferon beta-1a is the optimal therapy. All other treatments are either dominated or
subject to extended dominance based on the manufacturer’s probabilistic base-case results.
CADTH COMMON DRUG REVIEW Pharmacoeconomic Review Report for Ocrelizumab 13
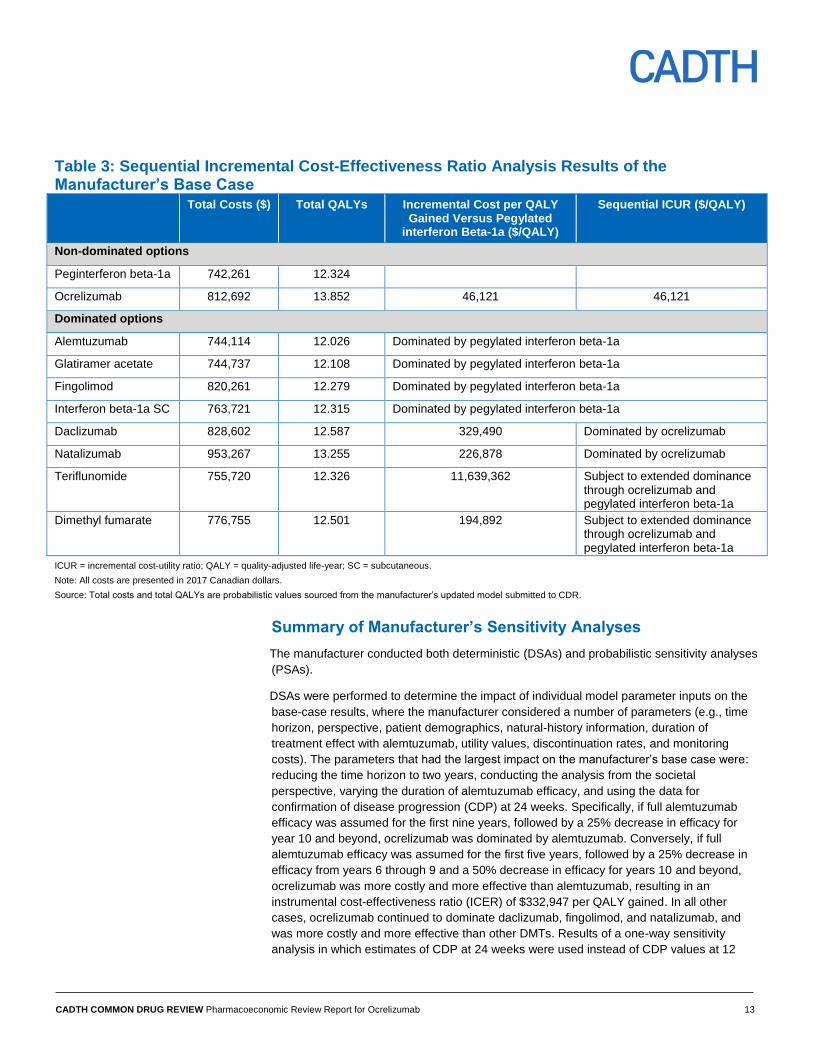
Table 3: Sequential Incremental Cost-Effectiveness Ratio Analysis Results of the Manufacturer’s Base Case Total Costs ($) Total QALYs Incremental Cost per QALY
Gained Versus Pegylated interferon Beta-1a ($/QALY)
Sequential ICUR ($/QALY)
Non-dominated options
Peginterferon beta-1a 742,261 12.324
Ocrelizumab 812,692 13.852 46,121 46,121
Dominated options
Alemtuzumab 744,114 12.026 Dominated by pegylated interferon beta-1a
Glatiramer acetate 744,737 12.108 Dominated by pegylated interferon beta-1a
Fingolimod 820,261 12.279 Dominated by pegylated interferon beta-1a
Interferon beta-1a SC 763,721 12.315 Dominated by pegylated interferon beta-1a
Daclizumab 828,602 12.587 329,490 Dominated by ocrelizumab
Natalizumab 953,267 13.255 226,878 Dominated by ocrelizumab
Teriflunomide 755,720 12.326 11,639,362 Subject to extended dominance through ocrelizumab and pegylated interferon beta-1a
Dimethyl fumarate 776,755 12.501 194,892 Subject to extended dominance through ocrelizumab and pegylated interferon beta-1a
ICUR = incremental cost-utility ratio; QALY = quality-adjusted life-year; SC = subcutaneous.
Note: All costs are presented in 2017 Canadian dollars.
Source: Total costs and total QALYs are probabilistic values sourced from the manufacturer’s updated model submitted to CDR.
Summary of Manufacturer’s Sensitivity Analyses
The manufacturer conducted both deterministic (DSAs) and probabilistic sensitivity analyses
(PSAs).
DSAs were performed to determine the impact of individual model parameter inputs on the
base-case results, where the manufacturer considered a number of parameters (e.g., time
horizon, perspective, patient demographics, natural-history information, duration of
treatment effect with alemtuzumab, utility values, discontinuation rates, and monitoring
costs). The parameters that had the largest impact on the manufacturer’s base case were:
reducing the time horizon to two years, conducting the analysis from the societal
perspective, varying the duration of alemtuzumab efficacy, and using the data for
confirmation of disease progression (CDP) at 24 weeks. Specifically, if full alemtuzumab
efficacy was assumed for the first nine years, followed by a 25% decrease in efficacy for
year 10 and beyond, ocrelizumab was dominated by alemtuzumab. Conversely, if full
alemtuzumab efficacy was assumed for the first five years, followed by a 25% decrease in
efficacy from years 6 through 9 and a 50% decrease in efficacy for years 10 and beyond,
ocrelizumab was more costly and more effective than alemtuzumab, resulting in an
instrumental cost-effectiveness ratio (ICER) of $332,947 per QALY gained. In all other
cases, ocrelizumab continued to dominate daclizumab, fingolimod, and natalizumab, and
was more costly and more effective than other DMTs. Results of a one-way sensitivity
analysis in which estimates of CDP at 24 weeks were used instead of CDP values at 12
CADTH COMMON DRUG REVIEW Pharmacoeconomic Review Report for Ocrelizumab 14
weeks showed that ocrelizumab was dominant over daclizumab and fingolimod, but less
costly and less effective than natalizumab. When compared with all other DMTs,
ocrelizumab led to ICERs ranging from $25,100 per QALY gained (versus interferon
beta-1a) to $109,900 per QALY gained (versus pegylated interferon beta-1a). In addition to
a DSA, key variables used in the model were included as part of a PSA, and the inputs for
these variables were drawn randomly and simultaneously, based on specified distributions,
to calculate a corresponding ICER value. The process was repeated 1,000 times, and the
results of the PSA were expressed by a cost-effectiveness acceptability curve. PSA results
revealed that ocrelizumab continued to be less costly and more effective than daclizumab,
fingolimod, and natalizumab, and resulted in expected ICERs of between $26,600 and
$46,100 per QALY gained for the remaining DMTs. At a willingness-to-pay threshold of
$50,000 per QALY gained, ocrelizumab had the highest probability of being cost-effective,
at 36.2 %.1
Limitations of Manufacturer’s Submission
CDR identified the following key limitations with the manufacturer’s model:
Disability progression based on 12-week confirmation period: The effect of treatment
on disability progression was handled in the model by applying 12-week CDP data related
to permanent disease worsening from the manufacturer’s NMA.4 While the use of CDP data
adequately accounts for patients moving between EDSS states in the model, a 12-week
confirmation period for a change in EDSS score was deemed to be a poor indicator of
permanent disability progression by the clinical expert consulted by CADTH for this review;
instead, use of 24-week CDP estimates is recommended, as 24 weeks (i.e., six months of
sustained accumulation of disability) is likely to better reflect clinical outcomes over a one-
year cycle. In addition, because recovery from a relapse during the early stages of MS is
likely (i.e., the possibility of recovery exists at 12 weeks), CDP is a more robust measure
when performed over a 24-week interval.14,15
It should be noted that assuming the same relative effectiveness for the period beyond 24
weeks is a major assumption, and relying on such relatively short-term clinical data to
assess the cost-effectiveness of continued use for a greater duration is a significant
limitation that is likely to considerably overestimate the effectiveness of therapies.
Duration of treatment and efficacy: For all DMTs except alemtuzumab, it was assumed
the full efficacy of treatment was obtained for a continuous duration of treatment of up to 63
years (i.e., lifetime time horizon), except when EDSS score increased to 7 (disease stage at
which treatment is discontinued), due to all-cause discontinuation or upon conversion to
SPMS. However, for alemtuzumab, the model assumed that treatment would be continued
for no more than two years. As there is no published evidence for disability progression
relating to any of the DMTs beyond 24 weeks, such a biased approach against
alemtuzumab may be unwarranted. The clinical expert consulted by CADTH agreed that
CDR should base the durability of treatment response and accrual of treatment costs on the
same assumptions for all modelled comparators.
Uncertainty with comparative clinical information: Clinical efficacy inputs related to
disability progression (CDP at 12 weeks and at 24 weeks) and ARR were based on an
unpublished NMA conducted by the manufacturer.4 However, CDP and ARR estimates
derived from the manufacturer’s NMA may be limited owing to several factors, which may
render these estimates uncertain (see detailed summary and critical appraisal of the
manufacturer-submitted indirect treatment comparison presented in the CDR Clinical
CADTH COMMON DRUG REVIEW Pharmacoeconomic Review Report for Ocrelizumab 15
Review Report). In particular, the manufacturer’s NMA synthesized evidence from a mixture
of studies reporting on treatment-experienced and/or treatment-naive MS patients, and, as a
result, effect estimates may not be reflective of response to treatment among patients who
have previously failed DMT and are likely to receive ocrelizumab. In addition, the
manufacturer’s NMA did not adequately explore the potential impact of clinical
heterogeneity across included studies on the estimates of treatment effect, and there was a
lack of statistical analysis for inconsistency, which brings into question the reliability of the
synthesized evidence.
Other limitations and parameters of uncertainty identified with the submitted evaluation
include the following:
Health-state utility values for EDSS states 8 and 9 are uncertain: There is uncertainty in
the methods used to elicit utility values for EDSS states 8 and 9 (derived using coefficients
from Orme et al.11
), and these values appear considerably lower than those used in other
previous models for these health states, including the CADTH RRMS Therapeutic Review.16
CDR undertook a reanalysis using utility values from a previously published cost-
effectiveness analysis comparing pegylated interferon beta-1a with interferon beta-1a and
glatiramer acetate.17
Cost of daclizumab may be overestimated: Given that daclizumab is not yet listed on any
provincial formulary, the manufacturer estimated the annual cost of this treatment by
averaging the annual costs of three second-line DMTs (alemtuzumab [year 2 costs],
fingolimod, and natalizumab). However, the CDR submission for daclizumab was recently
completed, and the CADTH Canadian Drug Expert Committee’s (CDEC) recommendations
were issued. Based on the CDR Pharmacoeconomic Review report for daclizumab,18
the
annual cost of this therapy was estimated at $27,700. CDR undertook a reanalysis using
this value instead of the annual cost estimated by the manufacturer.
Natural-history data allowing for disability improvement may not be appropriate:
Natural-history data were applied in the manufacturer’s model using transition probabilities
from Palace et al.,3 which allowed for backward transitions (i.e., disability improvement).
While it may be plausible for patients to experience improvement in their disability status
and therefore transition to a lower EDSS score (i.e., lower level of disability), the clinical
expert consulted by CADTH for this review noted that spontaneous improvement in
disability is seldom observed in clinical practice. Therefore, it may be inappropriate to allow
for backward transition probabilities in modelling the MS progression in the absence of
treatment. CDR undertook a reanalysis using progression-only natural-history data from the
London, Ontario, data set for transitions within RRMS (treated and untreated) and SPMS
states.
Lack of transparency and functionality of the manufacturer’s submitted model: The
submitted model had several issues that made validation and evaluation challenging. In
particular, the model did not allow for all comparators to be run simultaneously, and the
coding used in modelling was overly complicated and lacked transparency. Thus, simple
reanalyses adopting alternative assumptions were complicated to conduct and verify.
Despite a number of requests made by CADTH for the manufacturer to provide the results
for all comparators simultaneously, supplemented by separate Markov trace worksheets for
each comparator, the manufacturer was unable to provide this information.
CADTH COMMON DRUG REVIEW Pharmacoeconomic Review Report for Ocrelizumab 16
CADTH Common Drug Review Reanalyses
As noted in the limitations, CDR identified several important shortcomings related to the
manufacturer’s model. CDR presents a revised probabilistic analysis (CDR base case) in
Table 4, with variations based on these limitations. The modifications made to the
manufacturer-submitted model include the following:
continuation of treatment effect and accrual of treatment costs was based on the same assumptions for all modelled comparators
confirmation period for disability progression was modified to 24 weeks
annual cost of daclizumab was updated to $27,700
the London, Ontario, data set was used for modelling natural history within all model health states
the utility values for EDSS states 8 and 9 was modified to those reported in Hernandez et al.
17
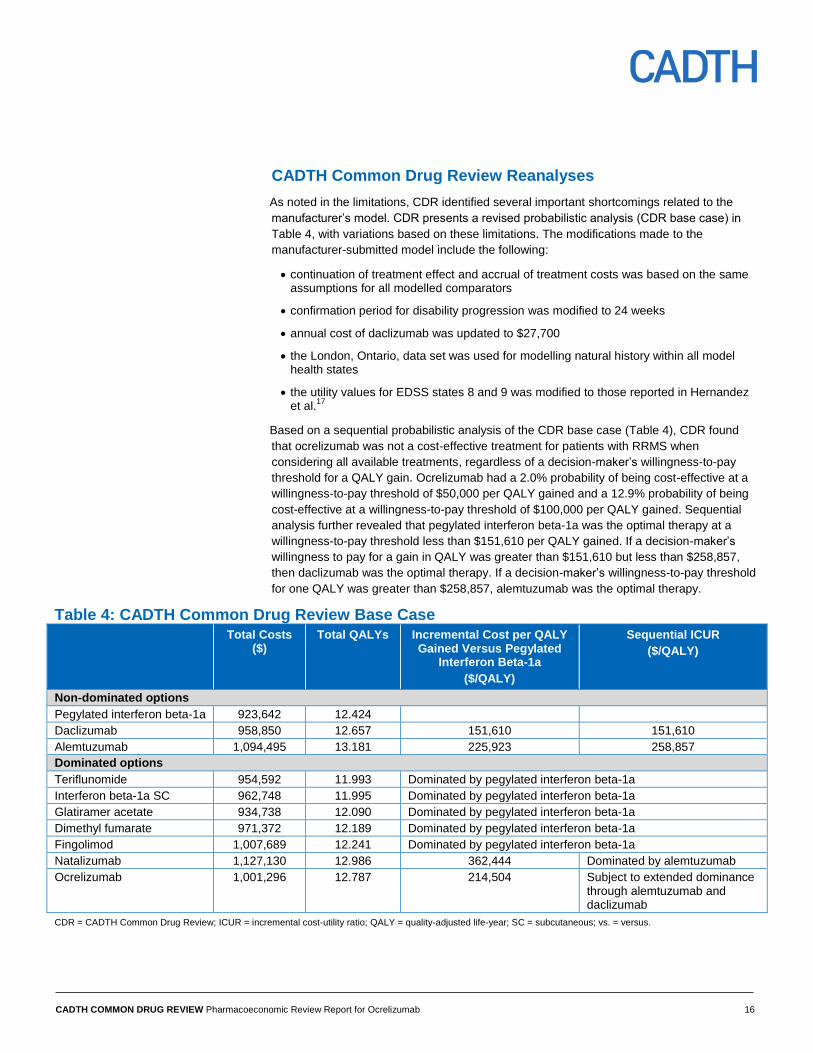
Based on a sequential probabilistic analysis of the CDR base case (Table 4), CDR found
that ocrelizumab was not a cost-effective treatment for patients with RRMS when
considering all available treatments, regardless of a decision-maker’s willingness-to-pay
threshold for a QALY gain. Ocrelizumab had a 2.0% probability of being cost-effective at a
willingness-to-pay threshold of $50,000 per QALY gained and a 12.9% probability of being
cost-effective at a willingness-to-pay threshold of $100,000 per QALY gained. Sequential
analysis further revealed that pegylated interferon beta-1a was the optimal therapy at a
willingness-to-pay threshold less than $151,610 per QALY gained. If a decision-maker’s
willingness to pay for a gain in QALY was greater than $151,610 but less than $258,857,
then daclizumab was the optimal therapy. If a decision-maker’s willingness-to-pay threshold
for one QALY was greater than $258,857, alemtuzumab was the optimal therapy.
Table 4: CADTH Common Drug Review Base Case Total Costs
($) Total QALYs Incremental Cost per QALY
Gained Versus Pegylated Interferon Beta-1a
($/QALY)
Sequential ICUR
($/QALY)
Non-dominated options
Pegylated interferon beta-1a 923,642 12.424
Daclizumab 958,850 12.657 151,610 151,610
Alemtuzumab 1,094,495 13.181 225,923 258,857
Dominated options
Teriflunomide 954,592 11.993 Dominated by pegylated interferon beta-1a
Interferon beta-1a SC 962,748 11.995 Dominated by pegylated interferon beta-1a
Glatiramer acetate 934,738 12.090 Dominated by pegylated interferon beta-1a
Dimethyl fumarate 971,372 12.189 Dominated by pegylated interferon beta-1a
Fingolimod 1,007,689 12.241 Dominated by pegylated interferon beta-1a
Natalizumab 1,127,130 12.986 362,444 Dominated by alemtuzumab
Ocrelizumab 1,001,296 12.787 214,504 Subject to extended dominance through alemtuzumab and daclizumab
CDR = CADTH Common Drug Review; ICUR = incremental cost-utility ratio; QALY = quality-adjusted life-year; SC = subcutaneous; vs. = versus.
CADTH COMMON DRUG REVIEW Pharmacoeconomic Review Report for Ocrelizumab 17
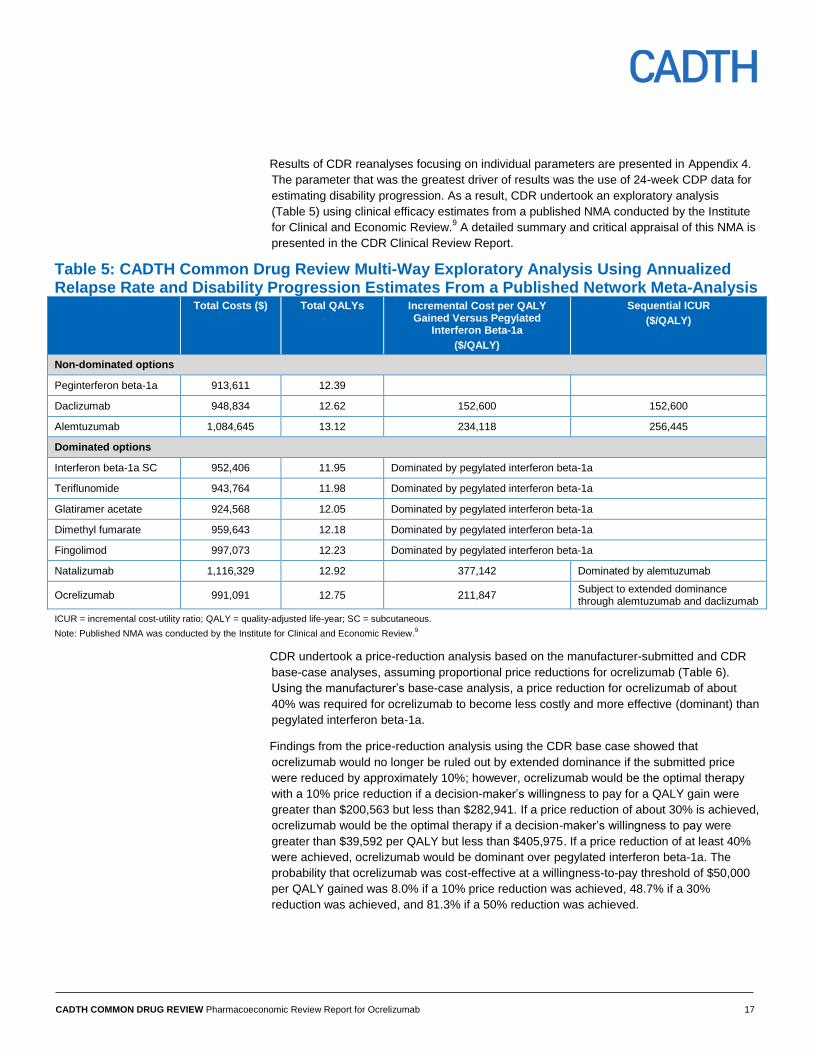
Results of CDR reanalyses focusing on individual parameters are presented in Appendix 4.
The parameter that was the greatest driver of results was the use of 24-week CDP data for
estimating disability progression. As a result, CDR undertook an exploratory analysis
(Table 5) using clinical efficacy estimates from a published NMA conducted by the Institute
for Clinical and Economic Review.9 A detailed summary and critical appraisal of this NMA is
presented in the CDR Clinical Review Report.
Table 5: CADTH Common Drug Review Multi-Way Exploratory Analysis Using Annualized Relapse Rate and Disability Progression Estimates From a Published Network Meta-Analysis Total Costs ($) Total QALYs Incremental Cost per QALY
Gained Versus Pegylated Interferon Beta-1a
($/QALY)
Sequential ICUR
($/QALY)
Non-dominated options
Peginterferon beta-1a 913,611 12.39
Daclizumab 948,834 12.62 152,600 152,600
Alemtuzumab 1,084,645 13.12 234,118 256,445
Dominated options
Interferon beta-1a SC 952,406 11.95 Dominated by pegylated interferon beta-1a
Teriflunomide 943,764 11.98 Dominated by pegylated interferon beta-1a
Glatiramer acetate 924,568 12.05 Dominated by pegylated interferon beta-1a
Dimethyl fumarate 959,643 12.18 Dominated by pegylated interferon beta-1a
Fingolimod 997,073 12.23 Dominated by pegylated interferon beta-1a
Natalizumab 1,116,329 12.92 377,142 Dominated by alemtuzumab
Ocrelizumab 991,091 12.75 211,847 Subject to extended dominance through alemtuzumab and daclizumab
ICUR = incremental cost-utility ratio; QALY = quality-adjusted life-year; SC = subcutaneous.
Note: Published NMA was conducted by the Institute for Clinical and Economic Review.9
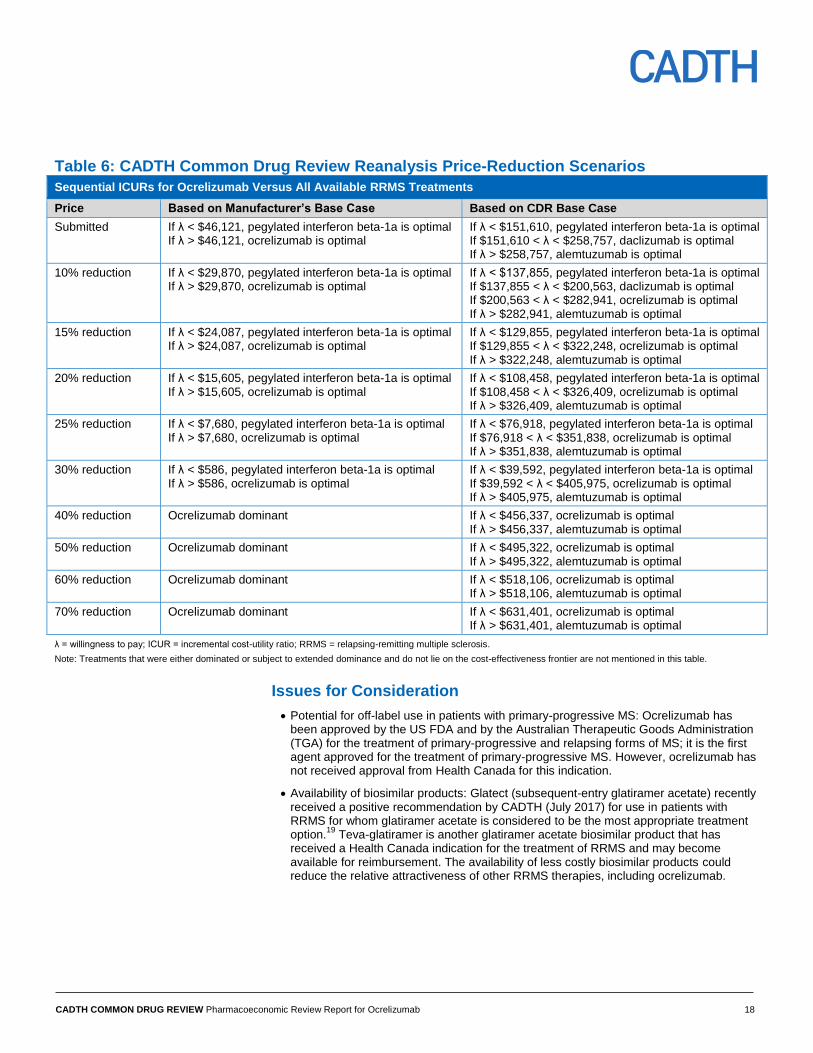
CDR undertook a price-reduction analysis based on the manufacturer-submitted and CDR
base-case analyses, assuming proportional price reductions for ocrelizumab (Table 6).
Using the manufacturer’s base-case analysis, a price reduction for ocrelizumab of about
40% was required for ocrelizumab to become less costly and more effective (dominant) than
pegylated interferon beta-1a.
Findings from the price-reduction analysis using the CDR base case showed that
ocrelizumab would no longer be ruled out by extended dominance if the submitted price
were reduced by approximately 10%; however, ocrelizumab would be the optimal therapy
with a 10% price reduction if a decision-maker’s willingness to pay for a QALY gain were
greater than $200,563 but less than $282,941. If a price reduction of about 30% is achieved,
ocrelizumab would be the optimal therapy if a decision-maker’s willingness to pay were
greater than $39,592 per QALY but less than $405,975. If a price reduction of at least 40%
were achieved, ocrelizumab would be dominant over pegylated interferon beta-1a. The
probability that ocrelizumab was cost-effective at a willingness-to-pay threshold of $50,000
per QALY gained was 8.0% if a 10% price reduction was achieved, 48.7% if a 30%
reduction was achieved, and 81.3% if a 50% reduction was achieved.
CADTH COMMON DRUG REVIEW Pharmacoeconomic Review Report for Ocrelizumab 18
Table 6: CADTH Common Drug Review Reanalysis Price-Reduction Scenarios
Sequential ICURs for Ocrelizumab Versus All Available RRMS Treatments
Price Based on Manufacturer’s Base Case Based on CDR Base Case
Submitted If λ < $46,121, pegylated interferon beta-1a is optimal If λ > $46,121, ocrelizumab is optimal
If λ < $151,610, pegylated interferon beta-1a is optimal If $151,610 < λ < $258,757, daclizumab is optimal If λ > $258,757, alemtuzumab is optimal
10% reduction If λ < $29,870, pegylated interferon beta-1a is optimal If λ > $29,870, ocrelizumab is optimal
If λ < $137,855, pegylated interferon beta-1a is optimal If $137,855 < λ < $200,563, daclizumab is optimal If $200,563 < λ < $282,941, ocrelizumab is optimal If λ > $282,941, alemtuzumab is optimal
15% reduction If λ < $24,087, pegylated interferon beta-1a is optimal If λ > $24,087, ocrelizumab is optimal
If λ < $129,855, pegylated interferon beta-1a is optimal If $129,855 < λ < $322,248, ocrelizumab is optimal If λ > $322,248, alemtuzumab is optimal
20% reduction If λ < $15,605, pegylated interferon beta-1a is optimal If λ > $15,605, ocrelizumab is optimal
If λ < $108,458, pegylated interferon beta-1a is optimal If $108,458 < λ < $326,409, ocrelizumab is optimal If λ > $326,409, alemtuzumab is optimal
25% reduction If λ < $7,680, pegylated interferon beta-1a is optimal If λ > $7,680, ocrelizumab is optimal
If λ < $76,918, pegylated interferon beta-1a is optimal If $76,918 < λ < $351,838, ocrelizumab is optimal If λ > $351,838, alemtuzumab is optimal
30% reduction If λ < $586, pegylated interferon beta-1a is optimal If λ > $586, ocrelizumab is optimal
If λ < $39,592, pegylated interferon beta-1a is optimal If $39,592 < λ < $405,975, ocrelizumab is optimal If λ > $405,975, alemtuzumab is optimal
40% reduction Ocrelizumab dominant If λ < $456,337, ocrelizumab is optimal If λ > $456,337, alemtuzumab is optimal
50% reduction Ocrelizumab dominant If λ < $495,322, ocrelizumab is optimal If λ > $495,322, alemtuzumab is optimal
60% reduction Ocrelizumab dominant If λ < $518,106, ocrelizumab is optimal If λ > $518,106, alemtuzumab is optimal
70% reduction Ocrelizumab dominant If λ < $631,401, ocrelizumab is optimal If λ > $631,401, alemtuzumab is optimal
λ = willingness to pay; ICUR = incremental cost-utility ratio; RRMS = relapsing-remitting multiple sclerosis.
Note: Treatments that were either dominated or subject to extended dominance and do not lie on the cost-effectiveness frontier are not mentioned in this table.
Issues for Consideration
Potential for off-label use in patients with primary-progressive MS: Ocrelizumab has been approved by the US FDA and by the Australian Therapeutic Goods Administration (TGA) for the treatment of primary-progressive and relapsing forms of MS; it is the first agent approved for the treatment of primary-progressive MS. However, ocrelizumab has not received approval from Health Canada for this indication.
Availability of biosimilar products: Glatect (subsequent-entry glatiramer acetate) recently received a positive recommendation by CADTH (July 2017) for use in patients with RRMS for whom glatiramer acetate is considered to be the most appropriate treatment option.
19 Teva-glatiramer is another glatiramer acetate biosimilar product that has
received a Health Canada indication for the treatment of RRMS and may become available for reimbursement. The availability of less costly biosimilar products could reduce the relative attractiveness of other RRMS therapies, including ocrelizumab.
CADTH COMMON DRUG REVIEW Pharmacoeconomic Review Report for Ocrelizumab 19
Patient Input
Input was received from the Multiple Sclerosis Society of Canada. Patients noted that MS is
an unpredictable and frequently disabling condition that affects the central nervous system
and presents with a wide range of symptoms. Given that the onset of disease usually occurs
during peak years for education, career-building, and family-building, MS exerts a significant
impact on all aspects of life including quality of life, psychosocial functioning, and the ability
to maintain employment and undertake activities of daily living. This was accounted for in
the manufacturer’s economic evaluation by including progressively lower utilities with
increasing EDSS level. Patients also noted there is a substantial burden on caregivers
(emotional, physical, and financial support, and time commitment), but that demand for the
caregiver’s role may decrease with increased availability of therapeutic options that can
better control disability progression and decrease the frequency of relapses among patients
with relapsing forms of MS. Caregiver burden was not accounted for in the manufacturer’s
model.
Patients noted that a number of DMTs are available to treat relapsing forms of MS, in
addition to symptomatic therapy and non-pharmacologic options. Adverse effects are
generally well managed with over-the-counter medications and lifestyle changes (e.g., rest).
Nevertheless, patients highlighted the importance of having access to multiple treatments to
ensure their MS is controlled as effectively as possible, given that not all drugs work for all
patients. The majority of patients (97%) providing input indicated they had no experience
with ocrelizumab; however, 30 patients (28%) providing input indicated they would be willing
to take the risk of experiencing adverse effects that may be associated with ocrelizumab in
return for its perceived benefits. Despite the need to administer ocrelizumab by intravenous
infusion at a specialized clinic, one anticipated benefit of this medication is its dosage
schedule, as it requires only one infusion every six months, unlike other monoclonal
antibodies.
Conclusions
Sequential analyses based on a CDR reanalysis of the manufacturer’s base case found that
ocrelizumab was not cost-effective when considering all available treatments for patients
with RRMS, regardless of a decision-maker’s willingness to pay for a QALY gain.
Ocrelizumab had a 2.0% probability of being cost-effective at a willingness-to-pay threshold
of $50,000 per QALY and a 12.9% probability of being cost-effective at a willingness-to-pay
threshold of $100,000 per QALY. Pegylated interferon beta-1a was the optimal therapy if a
decision-maker is unwilling to pay at least $151,610 per QALY gained. If a decision-maker’s
willingness to pay for a gain in QALY is greater than $151,610 but less than $258,857, then
daclizumab is the optimal therapy. If a decision-maker is willing to pay at least $258,857 for
a QALY, alemtuzumab is the optimal therapy.
Given a 30% reduction in its submitted price, ocrelizumab would be considered the optimal
therapy if a decision-maker’s willingness to pay is greater than $39,592 per QALY but less
than $405,975 per QALY. With this reduction, the probability that ocrelizumab is cost-
effective at a willingness-to-pay threshold of $50,000 per QALY is 48.7%.
It should be noted that the economic model submitted by the manufacturer was
unnecessarily complex and lacked transparency, which made both the assessment of
validity and the ability to conduct reanalysis challenging. Thus, interpretation of results is
subject to the identified limitations.
CADTH COMMON DRUG REVIEW Pharmacoeconomic Review Report for Ocrelizumab 20
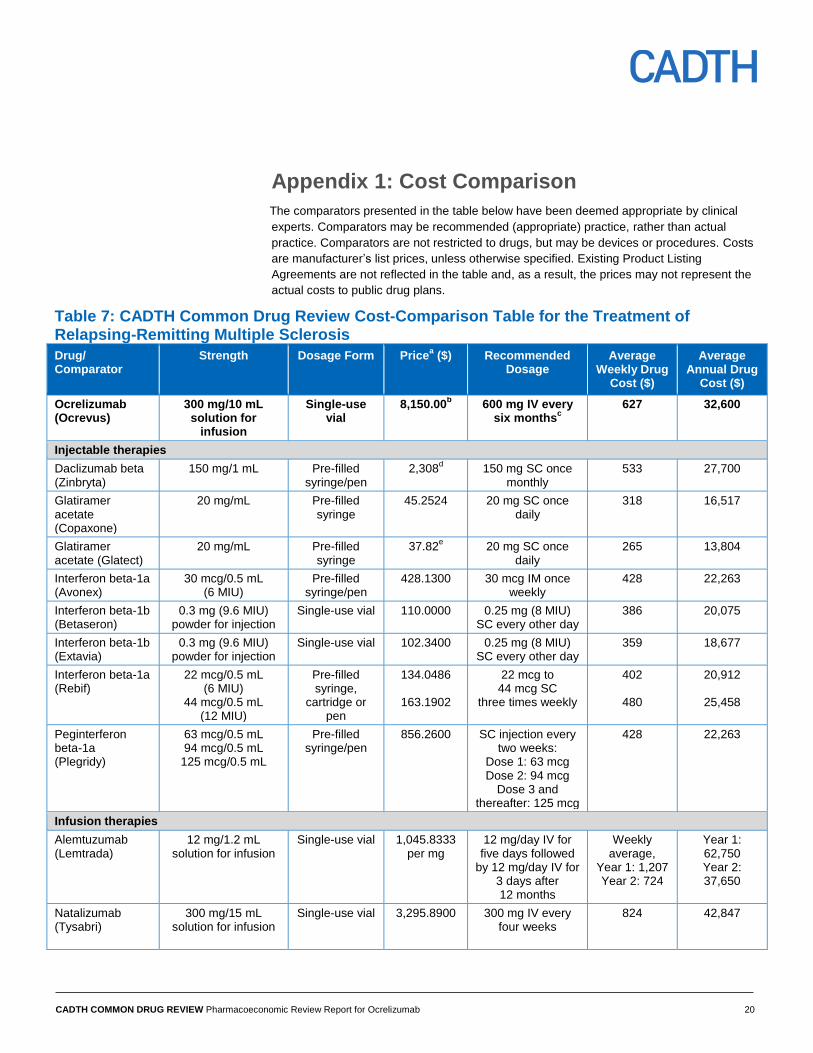
Appendix 1: Cost Comparison
The comparators presented in the table below have been deemed appropriate by clinical
experts. Comparators may be recommended (appropriate) practice, rather than actual
practice. Comparators are not restricted to drugs, but may be devices or procedures. Costs
are manufacturer’s list prices, unless otherwise specified. Existing Product Listing
Agreements are not reflected in the table and, as a result, the prices may not represent the
actual costs to public drug plans.
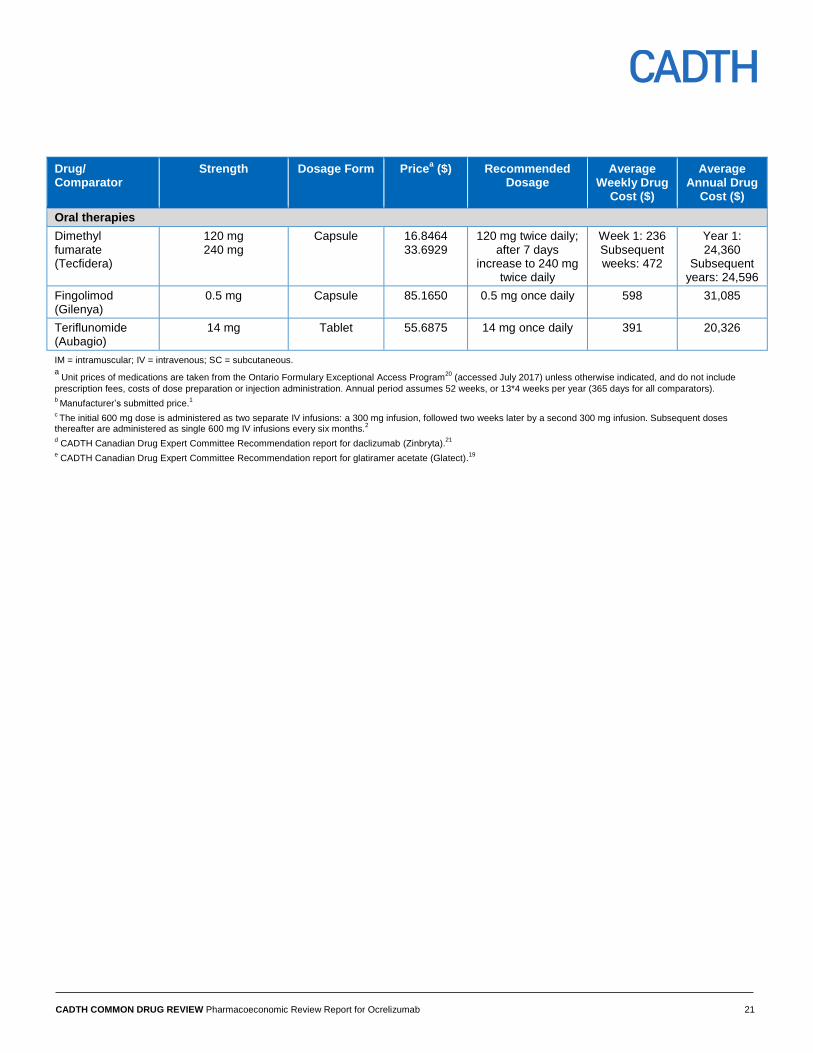
Table 7: CADTH Common Drug Review Cost-Comparison Table for the Treatment of Relapsing-Remitting Multiple Sclerosis
Drug/ Comparator
Strength Dosage Form Pricea ($) Recommended
Dosage Average
Weekly Drug Cost ($)
Average Annual Drug
Cost ($)
Ocrelizumab (Ocrevus)
300 mg/10 mL solution for
infusion
Single-use vial
8,150.00b 600 mg IV every
six monthsc
627 32,600
Injectable therapies
Daclizumab beta (Zinbryta)
150 mg/1 mL Pre-filled syringe/pen
2,308d
150 mg SC once monthly
533 27,700
Glatiramer acetate (Copaxone)
20 mg/mL Pre-filled syringe
45.2524 20 mg SC once daily
318 16,517
Glatiramer acetate (Glatect)
20 mg/mL Pre-filled syringe
37.82e
20 mg SC once daily
265 13,804
Interferon beta-1a
(Avonex) 30 mcg/0.5 mL
(6 MIU) Pre-filled
syringe/pen 428.1300
30 mcg IM once
weekly 428 22,263
Interferon beta-1b (Betaseron)
0.3 mg (9.6 MIU) powder for injection
Single-use vial 110.0000
0.25 mg (8 MIU) SC every other day
386 20,075
Interferon beta-1b (Extavia)
0.3 mg (9.6 MIU) powder for injection
Single-use vial 102.3400
0.25 mg (8 MIU) SC every other day
359 18,677
Interferon beta-1a (Rebif)
22 mcg/0.5 mL (6 MIU)
44 mcg/0.5 mL (12 MIU)
Pre-filled syringe,
cartridge or pen
134.0486
163.1902
22 mcg to 44 mcg SC
three times weekly
402
480
20,912
25,458
Peginterferon beta-1a (Plegridy)
63 mcg/0.5 mL 94 mcg/0.5 mL
125 mcg/0.5 mL
Pre-filled syringe/pen
856.2600 SC injection every two weeks:
Dose 1: 63 mcg Dose 2: 94 mcg
Dose 3 and thereafter: 125 mcg
428 22,263
Infusion therapies
Alemtuzumab (Lemtrada)
12 mg/1.2 mL solution for infusion
Single-use vial 1,045.8333 per mg
12 mg/day IV for five days followed
by 12 mg/day IV for 3 days after 12 months
Weekly average,
Year 1: 1,207 Year 2: 724
Year 1: 62,750 Year 2: 37,650
Natalizumab
(Tysabri)
300 mg/15 mL solution for infusion
Single-use vial 3,295.8900 300 mg IV every four weeks
824 42,847
CADTH COMMON DRUG REVIEW Pharmacoeconomic Review Report for Ocrelizumab 21
Drug/ Comparator
Strength Dosage Form Pricea ($) Recommended
Dosage Average
Weekly Drug Cost ($)
Average Annual Drug
Cost ($)
Oral therapies
Dimethyl fumarate (Tecfidera)
120 mg 240 mg
Capsule 16.8464 33.6929
120 mg twice daily; after 7 days
increase to 240 mg twice daily
Week 1: 236 Subsequent weeks: 472
Year 1: 24,360
Subsequent years: 24,596
Fingolimod
(Gilenya) 0.5 mg Capsule 85.1650 0.5 mg once daily 598 31,085
Teriflunomide (Aubagio)
14 mg Tablet 55.6875 14 mg once daily 391 20,326
IM = intramuscular; IV = intravenous; SC = subcutaneous.
a Unit prices of medications are taken from the Ontario Formulary Exceptional Access Program
20 (accessed July 2017) unless otherwise indicated, and do not include
prescription fees, costs of dose preparation or injection administration. Annual period assumes 52 weeks, or 13*4 weeks per year (365 days for all comparators). b Manufacturer’s submitted price.
1
c The initial 600 mg dose is administered as two separate IV infusions: a 300 mg infusion, followed two weeks later by a second 300 mg infusion. Subsequent doses
thereafter are administered as single 600 mg IV infusions every six months.2
d CADTH Canadian Drug Expert Committee Recommendation report for daclizumab (Zinbryta).
21
e CADTH Canadian Drug Expert Committee Recommendation report for glatiramer acetate (Glatect).
19
CADTH COMMON DRUG REVIEW Pharmacoeconomic Review Report for Ocrelizumab 22
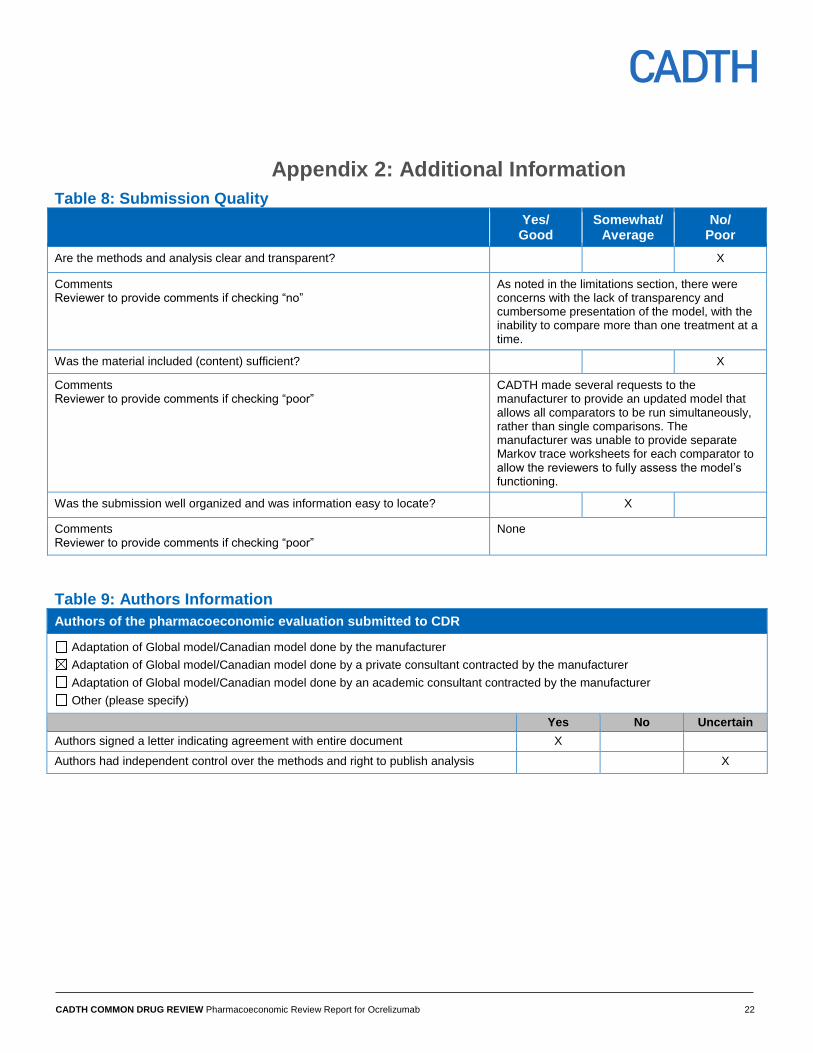
Appendix 2: Additional Information
Table 8: Submission Quality
Yes/ Good
Somewhat/ Average
No/ Poor
Are the methods and analysis clear and transparent? X
Comments Reviewer to provide comments if checking “no”
As noted in the limitations section, there were concerns with the lack of transparency and cumbersome presentation of the model, with the inability to compare more than one treatment at a time.
Was the material included (content) sufficient? X
Comments Reviewer to provide comments if checking “poor”
CADTH made several requests to the manufacturer to provide an updated model that allows all comparators to be run simultaneously, rather than single comparisons. The manufacturer was unable to provide separate Markov trace worksheets for each comparator to allow the reviewers to fully assess the model’s functioning.
Was the submission well organized and was information easy to locate? X
Comments Reviewer to provide comments if checking “poor”
None
Table 9: Authors Information
Authors of the pharmacoeconomic evaluation submitted to CDR
Adaptation of Global model/Canadian model done by the manufacturer
Adaptation of Global model/Canadian model done by a private consultant contracted by the manufacturer
Adaptation of Global model/Canadian model done by an academic consultant contracted by the manufacturer
Other (please specify)
Yes No Uncertain
Authors signed a letter indicating agreement with entire document X
Authors had independent control over the methods and right to publish analysis X
CADTH COMMON DRUG REVIEW Pharmacoeconomic Review Report for Ocrelizumab 23
Appendix 3: Summary of Other Health Technology Assessment Reviews of Drug
Note there are no reviews for ocrelizumab conducted by health technology assessment
organizations available at the time of this review. Ocrelizumab is currently undergoing
review by the United Kingdom’s National Institute for Health and Care Excellence and by
the Australian Government’s Pharmaceutical Benefits Advisory Committee.
CADTH COMMON DRUG REVIEW Pharmacoeconomic Review Report for Ocrelizumab 24
Appendix 4: Reviewer Worksheets
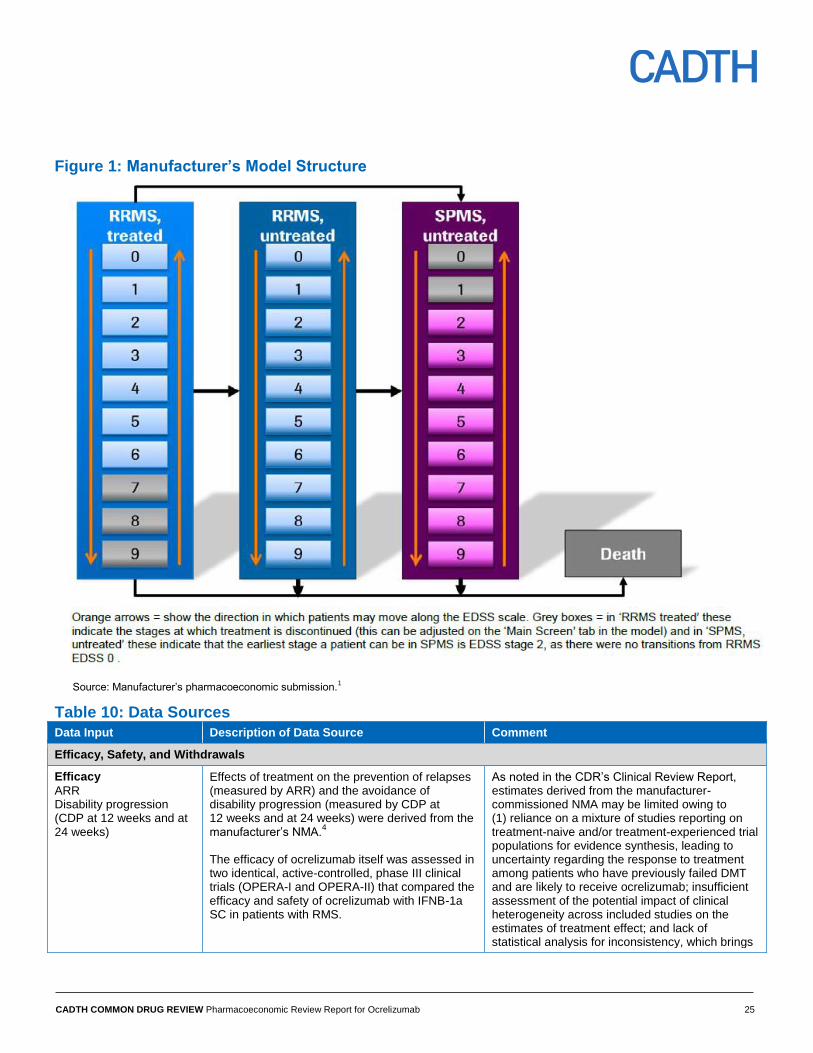
Manufacturer’s Model Structure
The manufacturer submitted a cohort-based Markov health-state transition model that
included 21 health states: 10 for each multiple sclerosis (MS) type (relapsing-remitting MS
[RRMS] and secondary-progressive [SPMS]) and a death state. The MS-specific health
states were grouped according to the Kurtzke Expanded Disability Status Scale (EDSS)
levels, from 0 (normal neurological examination) to 9 (helpless bed patient).22
The
manufacturer’s model structure is presented in Figure 1.
In the submitted model, all patients begin in the RRMS state, and the model prospectively
predicts their movement through different health states based on several factors, including
disability progression, relapses, adverse events, treatment discontinuation, and mortality.
The distribution of patients by EDSS state was defined at the outset based on the proportion
of patients in each EDSS state from the OPERA trials. After each annual cycle in the model,
each patient in the modelled cohort can transition between EDSS states in RRMS, remain in
the same state, or transition to the absorbing state of death. Patients may also transition to
SPMS from RRMS and then move between EDSS states in SPMS. During each cycle,
patients may also relapse or discontinue therapy, which is dependent on their RRMS or
SPMS status and EDSS score. Patients may transition from any health state to the
absorbing death state.
CADTH COMMON DRUG REVIEW Pharmacoeconomic Review Report for Ocrelizumab 25
Figure 1: Manufacturer’s Model Structure
Source: Manufacturer’s pharmacoeconomic submission.1
Table 10: Data Sources
Data Input Description of Data Source Comment
Efficacy, Safety, and Withdrawals
Efficacy
ARR Disability progression (CDP at 12 weeks and at 24 weeks)
Effects of treatment on the prevention of relapses (measured by ARR) and the avoidance of disability progression (measured by CDP at 12 weeks and at 24 weeks) were derived from the manufacturer’s NMA.
4
The efficacy of ocrelizumab itself was assessed in two identical, active-controlled, phase III clinical trials (OPERA-I and OPERA-II) that compared the efficacy and safety of ocrelizumab with IFNB-1a SC in patients with RMS.
As noted in the CDR’s Clinical Review Report, estimates derived from the manufacturer-commissioned NMA may be limited owing to (1) reliance on a mixture of studies reporting on treatment-naive and/or treatment-experienced trial populations for evidence synthesis, leading to uncertainty regarding the response to treatment among patients who have previously failed DMT and are likely to receive ocrelizumab; insufficient assessment of the potential impact of clinical heterogeneity across included studies on the estimates of treatment effect; and lack of statistical analysis for inconsistency, which brings
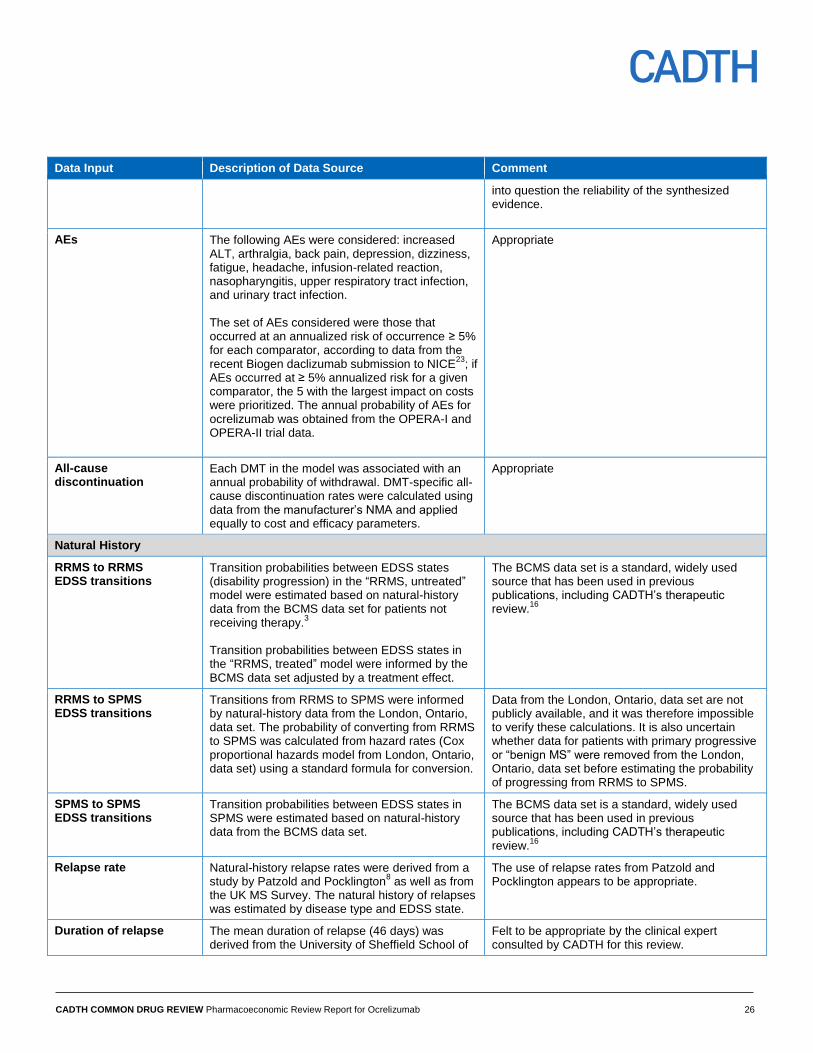
CADTH COMMON DRUG REVIEW Pharmacoeconomic Review Report for Ocrelizumab 26
Data Input Description of Data Source Comment
into question the reliability of the synthesized evidence.
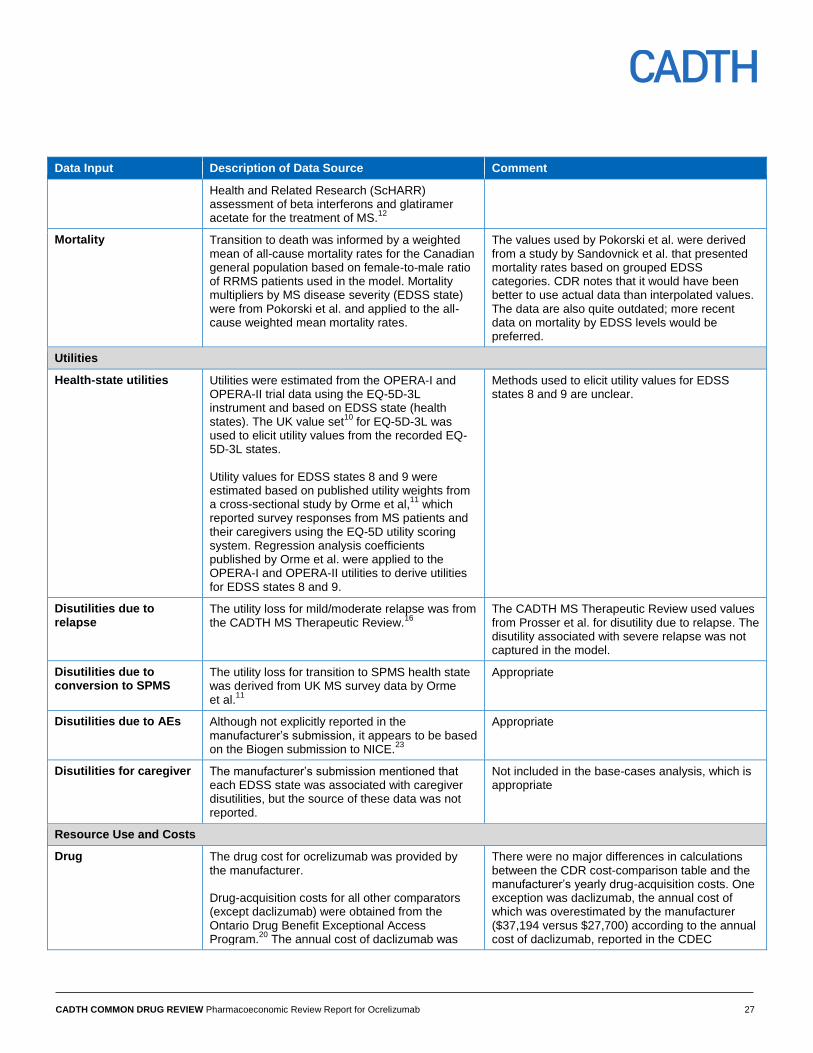
AEs The following AEs were considered: increased ALT, arthralgia, back pain, depression, dizziness, fatigue, headache, infusion-related reaction, nasopharyngitis, upper respiratory tract infection, and urinary tract infection. The set of AEs considered were those that occurred at an annualized risk of occurrence ≥ 5% for each comparator, according to data from the recent Biogen daclizumab submission to NICE
23; if
AEs occurred at ≥ 5% annualized risk for a given comparator, the 5 with the largest impact on costs were prioritized. The annual probability of AEs for ocrelizumab was obtained from the OPERA-I and OPERA-II trial data.
Appropriate
All-cause discontinuation
Each DMT in the model was associated with an annual probability of withdrawal. DMT-specific all-cause discontinuation rates were calculated using data from the manufacturer’s NMA and applied equally to cost and efficacy parameters.
Appropriate
Natural History
RRMS to RRMS EDSS transitions
Transition probabilities between EDSS states (disability progression) in the “RRMS, untreated” model were estimated based on natural-history data from the BCMS data set for patients not receiving therapy.
3
Transition probabilities between EDSS states in the “RRMS, treated” model were informed by the BCMS data set adjusted by a treatment effect.
The BCMS data set is a standard, widely used source that has been used in previous publications, including CADTH’s therapeutic review.
16
RRMS to SPMS EDSS transitions
Transitions from RRMS to SPMS were informed by natural-history data from the London, Ontario, data set. The probability of converting from RRMS to SPMS was calculated from hazard rates (Cox proportional hazards model from London, Ontario, data set) using a standard formula for conversion.
Data from the London, Ontario, data set are not publicly available, and it was therefore impossible to verify these calculations. It is also uncertain whether data for patients with primary progressive or “benign MS” were removed from the London, Ontario, data set before estimating the probability of progressing from RRMS to SPMS.
SPMS to SPMS EDSS transitions
Transition probabilities between EDSS states in SPMS were estimated based on natural-history data from the BCMS data set.
The BCMS data set is a standard, widely used source that has been used in previous publications, including CADTH’s therapeutic review.
16
Relapse rate Natural-history relapse rates were derived from a study by Patzold and Pocklington
8 as well as from
the UK MS Survey. The natural history of relapses was estimated by disease type and EDSS state.
The use of relapse rates from Patzold and Pocklington appears to be appropriate.
Duration of relapse The mean duration of relapse (46 days) was derived from the University of Sheffield School of
Felt to be appropriate by the clinical expert consulted by CADTH for this review.
CADTH COMMON DRUG REVIEW Pharmacoeconomic Review Report for Ocrelizumab 27
Data Input Description of Data Source Comment
Health and Related Research (ScHARR) assessment of beta interferons and glatiramer acetate for the treatment of MS.
12
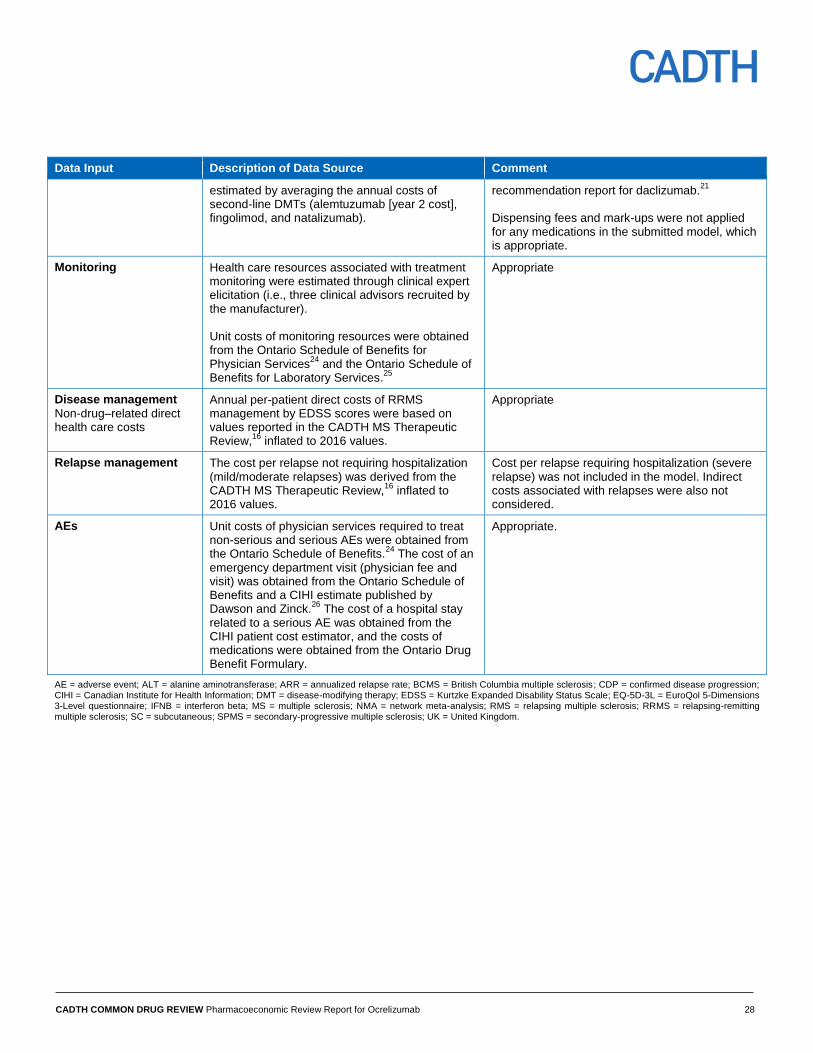
Mortality Transition to death was informed by a weighted mean of all-cause mortality rates for the Canadian general population based on female-to-male ratio of RRMS patients used in the model. Mortality multipliers by MS disease severity (EDSS state) were from Pokorski et al. and applied to the all-cause weighted mean mortality rates.
The values used by Pokorski et al. were derived from a study by Sandovnick et al. that presented mortality rates based on grouped EDSS categories. CDR notes that it would have been better to use actual data than interpolated values. The data are also quite outdated; more recent data on mortality by EDSS levels would be preferred.
Utilities
Health-state utilities Utilities were estimated from the OPERA-I and OPERA-II trial data using the EQ-5D-3L instrument and based on EDSS state (health states). The UK value set
10 for EQ-5D-3L was
used to elicit utility values from the recorded EQ-5D-3L states. Utility values for EDSS states 8 and 9 were estimated based on published utility weights from a cross-sectional study by Orme et al,
11 which
reported survey responses from MS patients and their caregivers using the EQ-5D utility scoring system. Regression analysis coefficients published by Orme et al. were applied to the OPERA-I and OPERA-II utilities to derive utilities for EDSS states 8 and 9.
Methods used to elicit utility values for EDSS states 8 and 9 are unclear.
Disutilities due to relapse
The utility loss for mild/moderate relapse was from the CADTH MS Therapeutic Review.
16
The CADTH MS Therapeutic Review used values from Prosser et al. for disutility due to relapse. The disutility associated with severe relapse was not captured in the model.
Disutilities due to conversion to SPMS
The utility loss for transition to SPMS health state was derived from UK MS survey data by Orme et al.
11
Appropriate
Disutilities due to AEs Although not explicitly reported in the manufacturer’s submission, it appears to be based on the Biogen submission to NICE.
23
Appropriate
Disutilities for caregiver The manufacturer’s submission mentioned that each EDSS state was associated with caregiver disutilities, but the source of these data was not reported.
Not included in the base-cases analysis, which is appropriate
Resource Use and Costs
Drug The drug cost for ocrelizumab was provided by the manufacturer. Drug-acquisition costs for all other comparators (except daclizumab) were obtained from the Ontario Drug Benefit Exceptional Access Program.
20 The annual cost of daclizumab was
There were no major differences in calculations between the CDR cost-comparison table and the manufacturer’s yearly drug-acquisition costs. One exception was daclizumab, the annual cost of which was overestimated by the manufacturer ($37,194 versus $27,700) according to the annual cost of daclizumab, reported in the CDEC
CADTH COMMON DRUG REVIEW Pharmacoeconomic Review Report for Ocrelizumab 28
Data Input Description of Data Source Comment
estimated by averaging the annual costs of second-line DMTs (alemtuzumab [year 2 cost], fingolimod, and natalizumab).
recommendation report for daclizumab.21
Dispensing fees and mark-ups were not applied for any medications in the submitted model, which is appropriate.
Monitoring Health care resources associated with treatment monitoring were estimated through clinical expert elicitation (i.e., three clinical advisors recruited by the manufacturer). Unit costs of monitoring resources were obtained from the Ontario Schedule of Benefits for Physician Services
24 and the Ontario Schedule of
Benefits for Laboratory Services.25
Appropriate
Disease management
Non-drug–related direct health care costs
Annual per-patient direct costs of RRMS management by EDSS scores were based on values reported in the CADTH MS Therapeutic Review,
16 inflated to 2016 values.
Appropriate
Relapse management The cost per relapse not requiring hospitalization (mild/moderate relapses) was derived from the CADTH MS Therapeutic Review,
16 inflated to
2016 values.
Cost per relapse requiring hospitalization (severe relapse) was not included in the model. Indirect costs associated with relapses were also not considered.
AEs Unit costs of physician services required to treat non-serious and serious AEs were obtained from the Ontario Schedule of Benefits.
24 The cost of an
emergency department visit (physician fee and visit) was obtained from the Ontario Schedule of Benefits and a CIHI estimate published by Dawson and Zinck.
26 The cost of a hospital stay
related to a serious AE was obtained from the CIHI patient cost estimator, and the costs of medications were obtained from the Ontario Drug Benefit Formulary.
Appropriate.
AE = adverse event; ALT = alanine aminotransferase; ARR = annualized relapse rate; BCMS = British Columbia multiple sclerosis; CDP = confirmed disease progression; CIHI = Canadian Institute for Health Information; DMT = disease-modifying therapy; EDSS = Kurtzke Expanded Disability Status Scale; EQ-5D-3L = EuroQol 5-Dimensions 3-Level questionnaire; IFNB = interferon beta; MS = multiple sclerosis; NMA = network meta-analysis; RMS = relapsing multiple sclerosis; RRMS = relapsing-remitting multiple sclerosis; SC = subcutaneous; SPMS = secondary-progressive multiple sclerosis; UK = United Kingdom.
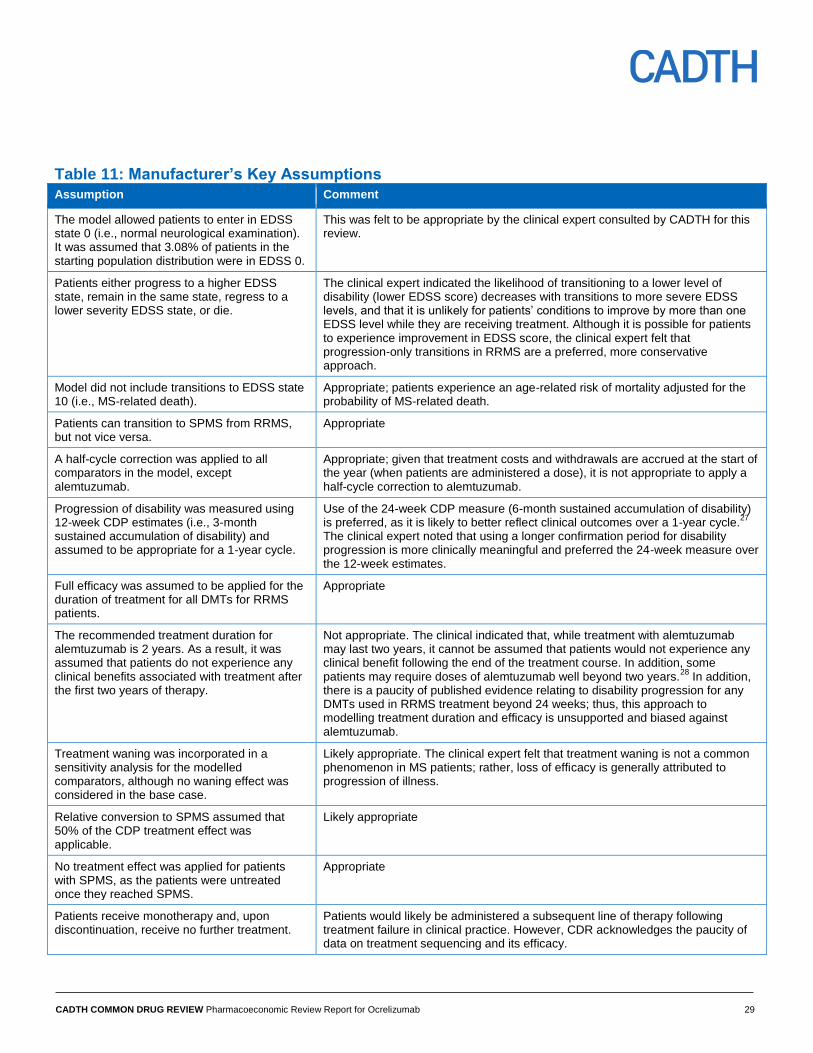
CADTH COMMON DRUG REVIEW Pharmacoeconomic Review Report for Ocrelizumab 29
Table 11: Manufacturer’s Key Assumptions
Assumption Comment
The model allowed patients to enter in EDSS state 0 (i.e., normal neurological examination). It was assumed that 3.08% of patients in the starting population distribution were in EDSS 0.
This was felt to be appropriate by the clinical expert consulted by CADTH for this review.
Patients either progress to a higher EDSS state, remain in the same state, regress to a lower severity EDSS state, or die.
The clinical expert indicated the likelihood of transitioning to a lower level of disability (lower EDSS score) decreases with transitions to more severe EDSS levels, and that it is unlikely for patients’ conditions to improve by more than one EDSS level while they are receiving treatment. Although it is possible for patients to experience improvement in EDSS score, the clinical expert felt that progression-only transitions in RRMS are a preferred, more conservative approach.
Model did not include transitions to EDSS state 10 (i.e., MS-related death).
Appropriate; patients experience an age-related risk of mortality adjusted for the probability of MS-related death.
Patients can transition to SPMS from RRMS, but not vice versa.
Appropriate
A half-cycle correction was applied to all comparators in the model, except alemtuzumab.
Appropriate; given that treatment costs and withdrawals are accrued at the start of the year (when patients are administered a dose), it is not appropriate to apply a half-cycle correction to alemtuzumab.
Progression of disability was measured using 12-week CDP estimates (i.e., 3-month sustained accumulation of disability) and assumed to be appropriate for a 1-year cycle.
Use of the 24-week CDP measure (6-month sustained accumulation of disability) is preferred, as it is likely to better reflect clinical outcomes over a 1-year cycle.
27
The clinical expert noted that using a longer confirmation period for disability progression is more clinically meaningful and preferred the 24-week measure over the 12-week estimates.
Full efficacy was assumed to be applied for the duration of treatment for all DMTs for RRMS patients.
Appropriate
The recommended treatment duration for alemtuzumab is 2 years. As a result, it was assumed that patients do not experience any clinical benefits associated with treatment after the first two years of therapy.
Not appropriate. The clinical indicated that, while treatment with alemtuzumab may last two years, it cannot be assumed that patients would not experience any clinical benefit following the end of the treatment course. In addition, some patients may require doses of alemtuzumab well beyond two years.
28 In addition,
there is a paucity of published evidence relating to disability progression for any DMTs used in RRMS treatment beyond 24 weeks; thus, this approach to modelling treatment duration and efficacy is unsupported and biased against alemtuzumab.
Treatment waning was incorporated in a sensitivity analysis for the modelled comparators, although no waning effect was considered in the base case.
Likely appropriate. The clinical expert felt that treatment waning is not a common phenomenon in MS patients; rather, loss of efficacy is generally attributed to progression of illness.
Relative conversion to SPMS assumed that 50% of the CDP treatment effect was applicable.
Likely appropriate
No treatment effect was applied for patients with SPMS, as the patients were untreated once they reached SPMS.
Appropriate
Patients receive monotherapy and, upon discontinuation, receive no further treatment.
Patients would likely be administered a subsequent line of therapy following treatment failure in clinical practice. However, CDR acknowledges the paucity of data on treatment sequencing and its efficacy.
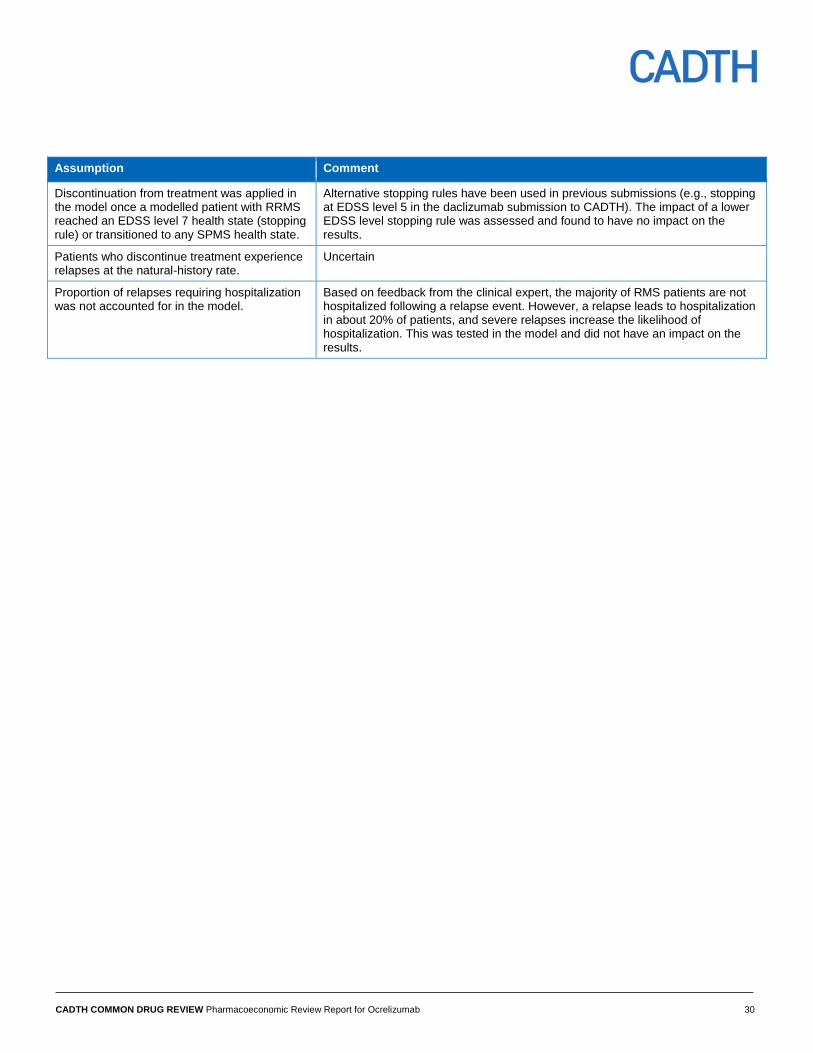
CADTH COMMON DRUG REVIEW Pharmacoeconomic Review Report for Ocrelizumab 30
Assumption Comment
Discontinuation from treatment was applied in the model once a modelled patient with RRMS reached an EDSS level 7 health state (stopping rule) or transitioned to any SPMS health state.
Alternative stopping rules have been used in previous submissions (e.g., stopping at EDSS level 5 in the daclizumab submission to CADTH). The impact of a lower EDSS level stopping rule was assessed and found to have no impact on the results.
Patients who discontinue treatment experience relapses at the natural-history rate.
Uncertain
Proportion of relapses requiring hospitalization was not accounted for in the model.
Based on feedback from the clinical expert, the majority of RMS patients are not hospitalized following a relapse event. However, a relapse leads to hospitalization in about 20% of patients, and severe relapses increase the likelihood of hospitalization. This was tested in the model and did not have an impact on the results.
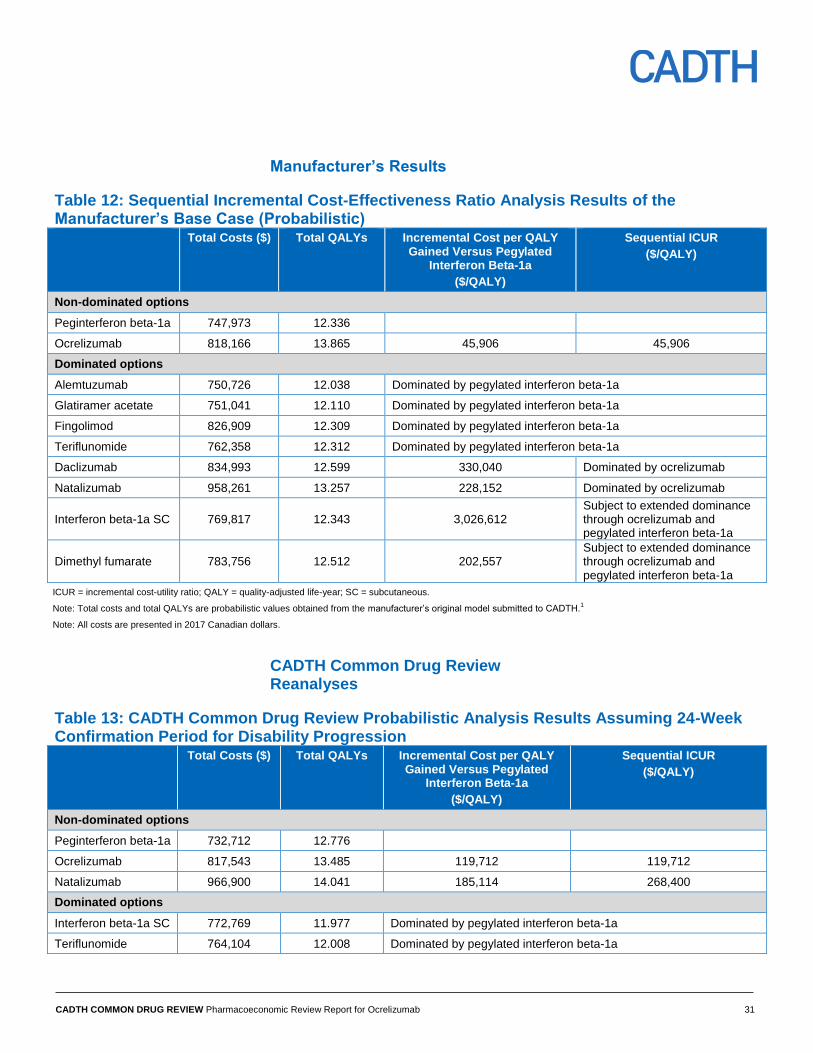
CADTH COMMON DRUG REVIEW Pharmacoeconomic Review Report for Ocrelizumab 31
Manufacturer’s Results
Table 12: Sequential Incremental Cost-Effectiveness Ratio Analysis Results of the Manufacturer’s Base Case (Probabilistic) Total Costs ($) Total QALYs Incremental Cost per QALY
Gained Versus Pegylated Interferon Beta-1a
($/QALY)
Sequential ICUR
($/QALY)
Non-dominated options
Peginterferon beta-1a 747,973 12.336
Ocrelizumab 818,166 13.865 45,906 45,906
Dominated options
Alemtuzumab 750,726 12.038 Dominated by pegylated interferon beta-1a
Glatiramer acetate 751,041 12.110 Dominated by pegylated interferon beta-1a
Fingolimod 826,909 12.309 Dominated by pegylated interferon beta-1a
Teriflunomide 762,358 12.312 Dominated by pegylated interferon beta-1a
Daclizumab 834,993 12.599 330,040 Dominated by ocrelizumab
Natalizumab 958,261 13.257 228,152 Dominated by ocrelizumab
Interferon beta-1a SC 769,817 12.343 3,026,612 Subject to extended dominance through ocrelizumab and pegylated interferon beta-1a
Dimethyl fumarate 783,756 12.512 202,557 Subject to extended dominance through ocrelizumab and pegylated interferon beta-1a
ICUR = incremental cost-utility ratio; QALY = quality-adjusted life-year; SC = subcutaneous.
Note: Total costs and total QALYs are probabilistic values obtained from the manufacturer’s original model submitted to CADTH.1
Note: All costs are presented in 2017 Canadian dollars.
CADTH Common Drug Review Reanalyses
Table 13: CADTH Common Drug Review Probabilistic Analysis Results Assuming 24-Week Confirmation Period for Disability Progression Total Costs ($) Total QALYs Incremental Cost per QALY
Gained Versus Pegylated Interferon Beta-1a
($/QALY)
Sequential ICUR
($/QALY)
Non-dominated options
Peginterferon beta-1a 732,712 12.776
Ocrelizumab 817,543 13.485 119,712 119,712
Natalizumab 966,900 14.041 185,114 268,400
Dominated options
Interferon beta-1a SC 772,769 11.977 Dominated by pegylated interferon beta-1a
Teriflunomide 764,104 12.008 Dominated by pegylated interferon beta-1a
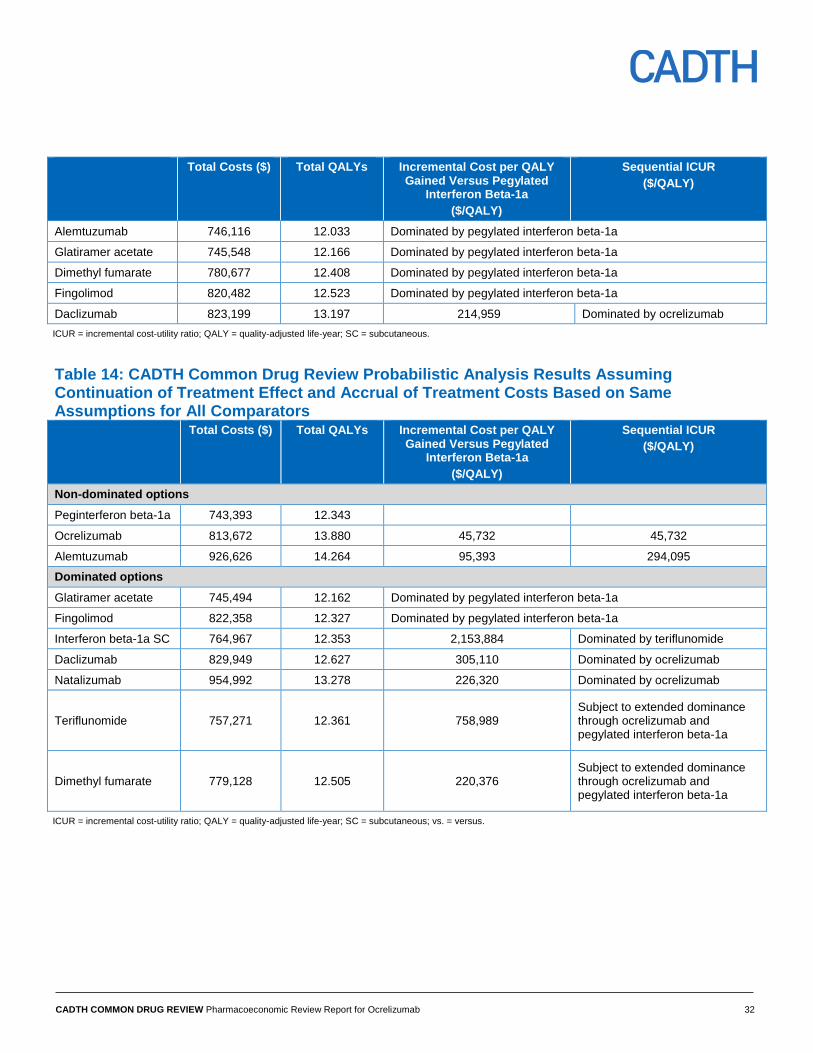
CADTH COMMON DRUG REVIEW Pharmacoeconomic Review Report for Ocrelizumab 32
Total Costs ($) Total QALYs Incremental Cost per QALY Gained Versus Pegylated
Interferon Beta-1a
($/QALY)
Sequential ICUR
($/QALY)
Alemtuzumab 746,116 12.033 Dominated by pegylated interferon beta-1a
Glatiramer acetate 745,548 12.166 Dominated by pegylated interferon beta-1a
Dimethyl fumarate 780,677 12.408 Dominated by pegylated interferon beta-1a
Fingolimod 820,482 12.523 Dominated by pegylated interferon beta-1a
Daclizumab 823,199 13.197 214,959 Dominated by ocrelizumab
ICUR = incremental cost-utility ratio; QALY = quality-adjusted life-year; SC = subcutaneous.
Table 14: CADTH Common Drug Review Probabilistic Analysis Results Assuming Continuation of Treatment Effect and Accrual of Treatment Costs Based on Same Assumptions for All Comparators Total Costs ($) Total QALYs Incremental Cost per QALY
Gained Versus Pegylated Interferon Beta-1a
($/QALY)
Sequential ICUR
($/QALY)
Non-dominated options
Peginterferon beta-1a 743,393 12.343
Ocrelizumab 813,672 13.880 45,732 45,732
Alemtuzumab 926,626 14.264 95,393 294,095
Dominated options
Glatiramer acetate 745,494 12.162 Dominated by pegylated interferon beta-1a
Fingolimod 822,358 12.327 Dominated by pegylated interferon beta-1a
Interferon beta-1a SC 764,967 12.353 2,153,884 Dominated by teriflunomide
Daclizumab 829,949 12.627 305,110 Dominated by ocrelizumab
Natalizumab 954,992 13.278 226,320 Dominated by ocrelizumab
Teriflunomide 757,271 12.361 758,989 Subject to extended dominance through ocrelizumab and pegylated interferon beta-1a
Dimethyl fumarate 779,128 12.505 220,376 Subject to extended dominance through ocrelizumab and pegylated interferon beta-1a
ICUR = incremental cost-utility ratio; QALY = quality-adjusted life-year; SC = subcutaneous; vs. = versus.
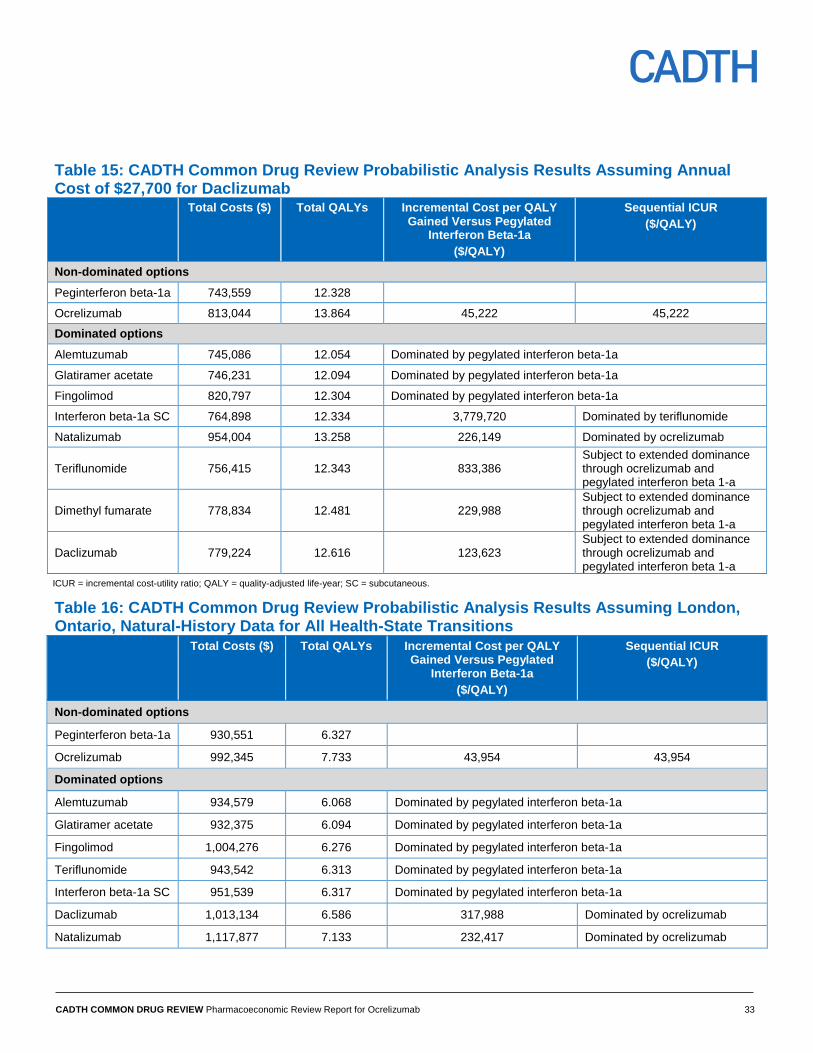
CADTH COMMON DRUG REVIEW Pharmacoeconomic Review Report for Ocrelizumab 33
Table 15: CADTH Common Drug Review Probabilistic Analysis Results Assuming Annual Cost of $27,700 for Daclizumab Total Costs ($) Total QALYs Incremental Cost per QALY
Gained Versus Pegylated Interferon Beta-1a
($/QALY)
Sequential ICUR
($/QALY)
Non-dominated options
Peginterferon beta-1a 743,559 12.328
Ocrelizumab 813,044 13.864 45,222 45,222
Dominated options
Alemtuzumab 745,086 12.054 Dominated by pegylated interferon beta-1a
Glatiramer acetate 746,231 12.094 Dominated by pegylated interferon beta-1a
Fingolimod 820,797 12.304 Dominated by pegylated interferon beta-1a
Interferon beta-1a SC 764,898 12.334 3,779,720 Dominated by teriflunomide
Natalizumab 954,004 13.258 226,149 Dominated by ocrelizumab
Teriflunomide 756,415 12.343 833,386 Subject to extended dominance through ocrelizumab and pegylated interferon beta 1-a
Dimethyl fumarate 778,834 12.481 229,988 Subject to extended dominance through ocrelizumab and pegylated interferon beta 1-a
Daclizumab 779,224 12.616 123,623 Subject to extended dominance through ocrelizumab and pegylated interferon beta 1-a
ICUR = incremental cost-utility ratio; QALY = quality-adjusted life-year; SC = subcutaneous.
Table 16: CADTH Common Drug Review Probabilistic Analysis Results Assuming London, Ontario, Natural-History Data for All Health-State Transitions Total Costs ($) Total QALYs Incremental Cost per QALY
Gained Versus Pegylated Interferon Beta-1a
($/QALY)
Sequential ICUR
($/QALY)
Non-dominated options
Peginterferon beta-1a 930,551 6.327
Ocrelizumab 992,345 7.733 43,954 43,954
Dominated options
Alemtuzumab 934,579 6.068 Dominated by pegylated interferon beta-1a
Glatiramer acetate 932,375 6.094 Dominated by pegylated interferon beta-1a
Fingolimod 1,004,276 6.276 Dominated by pegylated interferon beta-1a
Teriflunomide 943,542 6.313 Dominated by pegylated interferon beta-1a
Interferon beta-1a SC 951,539 6.317 Dominated by pegylated interferon beta-1a
Daclizumab 1,013,134 6.586 317,988 Dominated by ocrelizumab
Natalizumab 1,117,877 7.133 232,417 Dominated by ocrelizumab
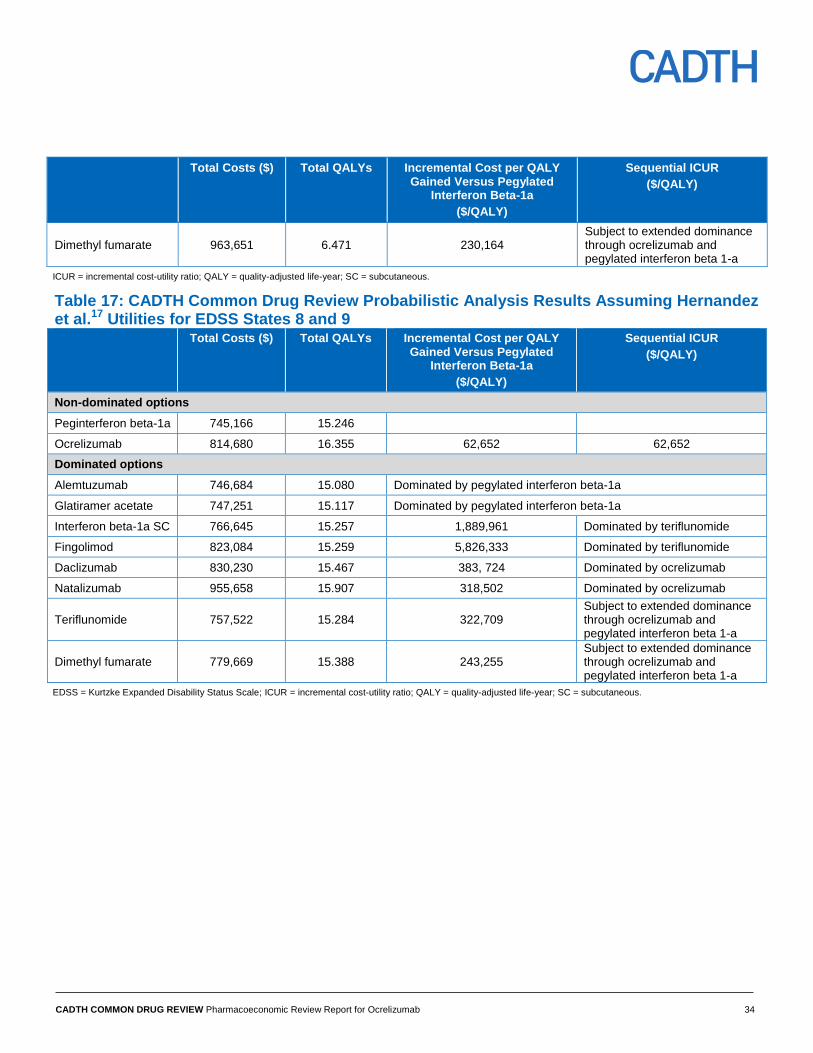
CADTH COMMON DRUG REVIEW Pharmacoeconomic Review Report for Ocrelizumab 34
Total Costs ($) Total QALYs Incremental Cost per QALY Gained Versus Pegylated
Interferon Beta-1a
($/QALY)
Sequential ICUR
($/QALY)
Dimethyl fumarate 963,651 6.471 230,164 Subject to extended dominance through ocrelizumab and pegylated interferon beta 1-a
ICUR = incremental cost-utility ratio; QALY = quality-adjusted life-year; SC = subcutaneous.
Table 17: CADTH Common Drug Review Probabilistic Analysis Results Assuming Hernandez et al.17 Utilities for EDSS States 8 and 9 Total Costs ($) Total QALYs Incremental Cost per QALY
Gained Versus Pegylated Interferon Beta-1a
($/QALY)
Sequential ICUR
($/QALY)
Non-dominated options
Peginterferon beta-1a 745,166 15.246
Ocrelizumab 814,680 16.355 62,652 62,652
Dominated options
Alemtuzumab 746,684 15.080 Dominated by pegylated interferon beta-1a
Glatiramer acetate 747,251 15.117 Dominated by pegylated interferon beta-1a
Interferon beta-1a SC 766,645 15.257 1,889,961 Dominated by teriflunomide
Fingolimod 823,084 15.259 5,826,333 Dominated by teriflunomide
Daclizumab 830,230 15.467 383, 724 Dominated by ocrelizumab
Natalizumab 955,658 15.907 318,502 Dominated by ocrelizumab
Teriflunomide 757,522 15.284 322,709 Subject to extended dominance through ocrelizumab and pegylated interferon beta 1-a
Dimethyl fumarate 779,669 15.388 243,255 Subject to extended dominance through ocrelizumab and pegylated interferon beta 1-a
EDSS = Kurtzke Expanded Disability Status Scale; ICUR = incremental cost-utility ratio; QALY = quality-adjusted life-year; SC = subcutaneous.
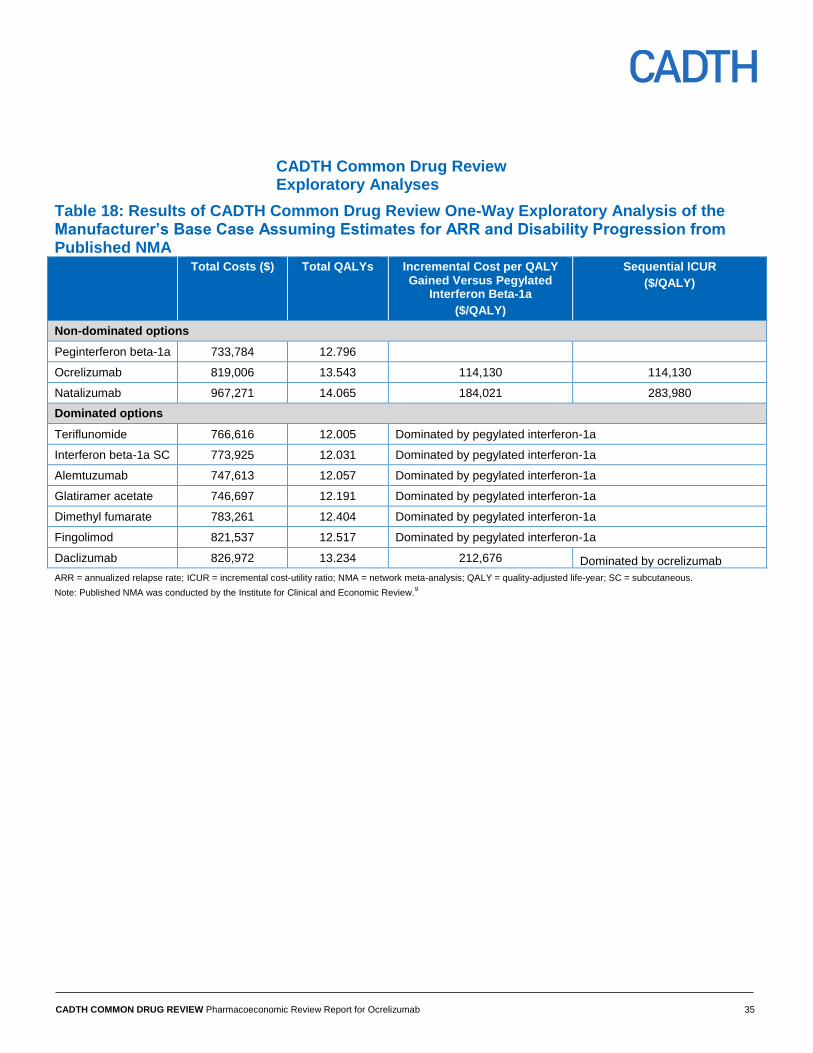
CADTH COMMON DRUG REVIEW Pharmacoeconomic Review Report for Ocrelizumab 35
CADTH Common Drug Review Exploratory Analyses
Table 18: Results of CADTH Common Drug Review One-Way Exploratory Analysis of the Manufacturer’s Base Case Assuming Estimates for ARR and Disability Progression from Published NMA Total Costs ($) Total QALYs Incremental Cost per QALY
Gained Versus Pegylated Interferon Beta-1a
($/QALY)
Sequential ICUR
($/QALY)
Non-dominated options
Peginterferon beta-1a 733,784 12.796
Ocrelizumab 819,006 13.543 114,130 114,130
Natalizumab 967,271 14.065 184,021 283,980
Dominated options
Teriflunomide 766,616 12.005 Dominated by pegylated interferon-1a
Interferon beta-1a SC 773,925 12.031 Dominated by pegylated interferon-1a
Alemtuzumab 747,613 12.057 Dominated by pegylated interferon-1a
Glatiramer acetate 746,697 12.191 Dominated by pegylated interferon-1a
Dimethyl fumarate 783,261 12.404 Dominated by pegylated interferon-1a
Fingolimod 821,537 12.517 Dominated by pegylated interferon-1a
Daclizumab 826,972 13.234 212,676 Dominated by ocrelizumab
ARR = annualized relapse rate; ICUR = incremental cost-utility ratio; NMA = network meta-analysis; QALY = quality-adjusted life-year; SC = subcutaneous.
Note: Published NMA was conducted by the Institute for Clinical and Economic Review.9
CADTH COMMON DRUG REVIEW Pharmacoeconomic Review Report for Ocrelizumab 36
References
1. Cost-effectiveness analysis of OCREVUS™ (Ocrelizumab) in the treatment of patients with relapsing-remitting multiple sclerosis in Canada. Presented to: Hoffmann-La Roche Limited [CONFIDENTIAL manufacturer's information]. Burlington (ON): Optum; 2017.
2. Ocrevus (ocrelizumab): 300 mg/10 mL (30 mg/mL) [product monograph]. Mississauga (ON): Hoffmann-La Roche Limited; 2017 Aug 14.
3. Palace J, Bregenzer T, Tremlett H, Oger J, Zhu F, Boggild M, et al. UK multiple sclerosis risk-sharing scheme: a new natural history dataset and an improved Markov model. BMJ Open [Internet]. 2014 Jan 17 [cited 2017 Aug 16];4(1):e004073. Available from: http://www.ncbi.nlm.nih.gov/pmc/articles/PMC3902459
4. Wilson K, McCool R, Glanville J, et.al. Systematic review and network meta-analysis of treatments for relapsing-remitting multiple sclerosis [CONFIDENTIAL internal report]. Heslington (UK): York Health Economics Consortium (YHEC) and Quantics Consulting Limited in association with F. Hoffmann-La Roche; 2017 Mar.
5. Primary clinical study report: WA21092. A randomized, double-blind, double-dummy, parallel-group study to evaluate the efficacy and safety of ocrelizumab in comparison to interferon beta-1a (Rebif ®) in patients with relapsing multiple sclerosis [CONFIDENTIAL internal manufacturer's report]. Basel (CH): F. Hoffmann-La Roche Ltd; 2016 Mar. Report No.: 1062034
6. Primary clinical study report: WA21093. A randomized, double-blind, double-dummy, parallel-group study to evaluate the efficacy and safety of ocrelizumab in comparison to interferon beta-1a (Rebif ®) in patients with relapsing multiple sclerosis [CONFIDENTIAL internal manufacturer's report]. Basel (CH): F. Hoffmann-La Roche Ltd; 2016 Mar. Report No.: 1062035
7. Pokorski RJ. Long-term survival experience of patients with multiple sclerosis. J Insur Med. 1997;29(2):101-6.
8. Patzold U, Pocklington PR. Course of multiple sclerosis. First results of a prospective study carried out of 102 MS patients from 1976-1980. Acta Neurol Scand. 1982 Apr;65(4):248-66.
9. Disease-modifying therapies for relapsing-remitting and primary-progressive multiple sclerosis: effectiveness and value [Internet]. Boston (MA): Institute for clinical and economic review; 2017 Mar 6. [cited 2017 Aug 16]. Available from: https://icer-review.org/wp-content/uploads/2016/08/CTAF_MS_Final_Report_030617.pdf Prepared for California Technology Assessment Forum.
10. Dolan P, Gudex C, Kind P, Williams A. A social tariff for EuroQol: results from a UK general population survey [Internet]. York (GB): University of York; 1995. [cited 2017 Aug 16]. (Discussion paper; no.138). Available from: https://www.york.ac.uk/che/pdf/DP138.pdf
11. Orme M, Kerrigan J, Tyas D, Russell N, Nixon R. The effect of disease, functional status, and relapses on the utility of people with multiple sclerosis in the UK. Value Health. 2007 Jan;10(1):54-60.
12. Centre for Bayesian Statistics in Health Economics, Tappenden P, Chilcott J, O'Hagan T, McCabe C, Cooper N, et al. Cost effectiveness of beta interferons and glatiramer acetate in the management of multiple sclerosis: final report to the Natonal Institute for Clinical Excellence [Internet]. Sheffield (GB): University of Sheffield, School of Health and Related Research; 2001. [cited 2017 Aug 16]. Available from: https://www.nice.org.uk/guidance/ta32/resources/assessment-report-on-the-use-of-beta-interferon-and-glatiramer-acetate-for-multiple-sclerosis-scharr-report2
13. Guidelines for the economic evaluation of health technologies: Canada [Internet]. 4th ed. Ottawa: CADTH; 2017. [cited 2017 Aug 21]. Available from: https://www.cadth.ca/guidelines-economic-evaluation-health-technologies-canada-4th-edition
14. Dimethyl fumarate for treating relapsing-remitting multiple sclerosis [Internet]. London: National Institute for Health and Care Excellence (NICE); 2014. [cited 2017 Aug 16]. (Technology appraisal guidance; no. TA320). Available from: https://www.nice.org.uk/guidance/ta320/resources/dimethyl-fumarate-for-treating-relapsingremitting-multiple-sclerosis-pdf-82602480191173
15. Wiendl H, Meuth SG. Pharmacological Approaches to Delaying Disability Progression in Patients with Multiple Sclerosis. Drugs [Internet]. 2015 Jun [cited 2017 Aug 16];75(9):947-77. Available from: http://www.ncbi.nlm.nih.gov/pmc/articles/PMC4464731
16. Comparative clinical and cost-effectiveness of drug therapies for relapsing-remitting multiple sclerosis [Internet]. Ottawa: CADTH; 2013 Oct. [cited 2017 Mar 13]. (CADTH therapeutic review; vol. 1, no. 2b). Available from: https://www.cadth.ca/media/pdf/TR0004_RRMS_ScienceReport_e.pdf
17. Hernandez L, Guo S, Kinter E, Fay M. Cost-effectiveness analysis of peginterferon beta-1a compared with interferon beta-1a and glatiramer acetate in the treatment of relapsing-remitting multiple sclerosis in the United States. J Med Econ. 2016 Jul;19(7):684-95.
18. Common Drug Review. Daclizumab (Zinbryta) [Internet]. Ottawa: CADTH; 2016. [cited 2017 Aug 16]. (Pharmacoeconomic review report). Available from: https://www.cadth.ca/sites/default/files/cdr/pharmacoeconomic/SR0508_Zinbryta_PE_Report.pdf
19. CADTH Common Drug Review. CADTH Canadian Drug Expert Committee recommendation (final): Glatiramer acetate (Glatect - Pendopharm). Indication: relapsing-remitting multiple sclerosis [Internet]. Ottawa: CADTH; 2017. [cited 2017 Aug 16]. Available from: https://www.cadth.ca/sites/default/files/cdr/complete/SE0510_complete_Glatect-Jul-27-e.pdf
20. Formulary: Exceptional Access Program (EAP) [Internet]. Toronto: Ontario Ministry of Health and Long-Term Care; 2017 Jan. [cited 2017 Aug 16]. Available from: http://www.health.gov.on.ca/en/pro/programs/drugs/odbf/odbf_except_access.aspx
CADTH COMMON DRUG REVIEW Pharmacoeconomic Review Report for Ocrelizumab 37
21. CADTH Common Drug Review. CADTH Canadian Drug Expert Committee recommendation (final): Daclizumab (Zinbryta - Biogen Canada Inc.). Indication: relapsing-remitting multiple sclerosis [Internet]. Ottawa: CADTH; 2017. [cited 2017 Aug 16]. Available from: https://www.cadth.ca/sites/default/files/cdr/complete/SR0508_compelte_Zinbryta_Jun-22-17_e.pdf
22. Kurtzke JF. Rating neurologic impairment in multiple sclerosis: an expanded disability status scale (EDSS). Neurology. 1983 Nov;33(11):1444-52.
23. Daclizumab for treating relapsing-remitting multiple sclerosis [ID827] [Internet]. London: National Institute for Health and Care Excellence; 2016. [cited 2017 Aug 16]. (Single technology appraisal). Available from: https://www.nice.org.uk/guidance/ta441/documents/committee-papers
24. Schedule of benefits for physician services under the Health Insurance Act: (December 22, 2015 (effective December 21, 2015)) [Internet]. Toronto: Ministry of Health and Long-term Care; 2017. [cited 2017 Aug 16]. Available from: http://www.health.gov.on.ca/en/pro/programs/ohip/sob/physserv/sob_master20160401.pdf
25. Schedule of benefits for laboratory services [Internet]. Toronto: Ministry of Health and Long-term Care; 1999 Apr 1. [cited 2017 Aug 16]. Available from: http://www.health.gov.on.ca/en/pro/programs/ohip/sob/lab/lab_services_sched_01_19990401.pdf
26. Dawson H, Zinck G. CIHI Survey: ED spending in Canada: A focus on the cost of patients waiting for access to an in-patient bed in Ontario. Healthc Q. 2009;12(1):25-8.
27. Committee for Medicinal Products for Human Use (CHMP). Guideline on clinical investigation of medicinal products for the treatment of multiple sclerosis [Internet]. London: European Medicines Agency; 2015 Mar 26. [cited 2017 Apr 3]. Available from: http://www.ema.europa.eu/docs/en_GB/document_library/Scientific_guideline/2015/03/WC500185161.pdf
28. Tuohy O, Costelloe L, Hill-Cawthorne G, Bjornson I, Harding K, Robertson N, et al. Alemtuzumab treatment of multiple sclerosis: long-term safety and efficacy. J Neurol Neurosurg Psychiatry. 2015 Feb;86(2):208-15.