c:\documents and settings\valaee\local settings\application data\mozilla\firefox\profiles
TRANSCRIPT

This article has been accepted for inclusion in a future issue of this journal. Content is final as presented, with the exception of pagination.
IEEE/ACM TRANSACTIONS ON NETWORKING 1
A System-Theoretic Approachto Bandwidth Estimation
Jörg Liebeherr, Fellow, IEEE, Markus Fidler, Senior Member, IEEE, and Shahrokh Valaee, Senior Member, IEEE
Abstract—This paper presents a new foundational approachto reason about available bandwidth estimation as the analysisof a min-plus linear system. The available bandwidth of a linkor complete path is expressed in terms of a service curve, whichis a function that appears in the network calculus to express theservice available to a traffic flow. The service curve is estimatedbased on measurements of a sequence of probing packets orpassive measurements of a sample path of arrivals. It is shownthat existing bandwidth estimation methods can be derived in themin-plus algebra of the network calculus, thus providing furthermathematical justification for these methods. Principal difficultiesof estimating available bandwidth from measurements of networkprobes are related to potential nonlinearities of the underlyingnetwork. When networks are viewed as systems that operateeither in a linear or in a nonlinear regime, it is argued that probingschemes extract the most information at a point when the networkcrosses from a linear to a nonlinear regime. Experiments on theEmulab testbed at the University of Utah, Salt Lake City, evaluatethe robustness of the system-theoretic interpretation of networksin practice. Multinode experiments evaluate how well the convolu-tion operation of the min-plus algebra provides estimates for theavailable bandwidth of a path from estimates of individual links.
Index Terms—Bandwidth estimation, min-plus algebra, networkcalculus.
I. INTRODUCTION
T HE benefits of knowing how much network bandwidth isavailable to an application has motivated the development
of techniques that infer bandwidth availability from traffic mea-surements [6], [11], [15], [17], [20], [28], [32], [34], [39]. Witha large number of methods available and much empirical expe-rience gained, recently an increasing effort has been put towardimproving the theoretic understanding of measurement-basedestimation of available bandwidth, e.g., [5], [26], and [40].
This paper presents a new foundational approach to reasonabout available bandwidth estimation as the analysis of amin-plus linear system. Min-plus linear system theory hasprovided the mathematical underpinning for the deterministicnetwork calculus [8], [23]. Drawing from known relationships
Manuscript received December 31, 2007; revised September 22, 2008 andJune 23, 2009; approved by IEEE/ACM TRANSACTIONS ON NETWORKING Ed-itor N. Duffield. This work was supported in part by the National Science Foun-dation under Grant CNS-0435061, grants from the Natural Sciences and En-gineering Council of Canada (NSERC), and an Emmy Noether grant from theGerman Research Foundation. This is an extended version of a paper that ap-peared in the Proceedings of IEEE INFOCOM 2007.
J. Liebeherr and S. Valaee are with the Department of Electrical and ComputerEngineering, University of Toronto, Toronto, ON M5S 3G4, Canada (e-mail:[email protected]; [email protected]).
M. Fidler is with Leibniz Universität Hannover, Hannover 30167, Germany(e-mail: [email protected]).
Digital Object Identifier 10.1109/TNET.2009.2035115
between linear system theory and the network calculus, wewill use min-plus system theory to explain how bandwidthestimation methods infer information about a network andfind bandwidth estimation methods that can extract the mostinformation from a network. Some key difficulties encounteredwhen measuring available bandwidth become evident in asystem-theoretic view.
We view bandwidth estimation as the problem of determiningunknown functions that describe the available bandwidth basedon measurements of a sequence of probing packets or passivemeasurements of a sample path of arrivals. These functions cor-respond to the service curves that appear in the network cal-culus, where they are used to express the available service at anetwork link or an end-to-end path. Working within the contextof the network calculus, we can apply a result that allows us tocompute the service curve of a network path from service curvesof the links of the path. This is done by applying the convolutionoperator of the min-plus algebra [8], [23]. We explore how wellthe convolution of the available bandwidth of multiple links, ex-pressed as service curves, can describe the available bandwidthof an end-to-end path.
The contribution of this paper is that it offers an alterna-tive interpretation for bandwidth estimation. Our formulationof available bandwidth in min-plus linear system theory revealsthat the underlying estimation problem is intrinsically hard, re-quiring the solution to a maximin optimization problem. Theoptimization problem becomes more tractable when the net-work satisfies the property of “min-plus linearity.” We showthat some existing estimation techniques, in particular those in[17] and [34], can be interpreted as analyzing a network withlinear input–output relationships. Our derivations reveal prop-erties of existing probing schemes presented in [17] and [34],for example, that these techniques derive the available band-width precisely if the network satisfies min-plus linearity. Thediscovery of an implicit assumption of min-plus linearity inthese measurement methods is seemingly at odds with empir-ical evidence that these methods have been successfully appliedin networks that do not satisfy linearity—for example, even asingle FIFO link violates the requirements of min-plus linearity.We resolve this apparent contradiction by showing that somenetworks can be decomposed into disjoint min-plus linear andnonlinear regions. These networks behave as a min-plus linearsystem at low load and become nonlinear if the load exceeds acertain threshold. The crossing of the linear and nonlinear re-gions marks the point where the available bandwidth can be ob-served. A major advantage of formulating the available band-width problem in min-plus algebra is that we can exploit thepowerful min-plus convolution operator to obtain an estimateof the available bandwidth for end-to-end paths from estimatesof constituting links. Additionally, by generalizing the availablebandwidth in terms of service curves, we can express multiple
1063-6692/$26.00 © 2009 IEEE
Authorized licensed use limited to: The University of Toronto. Downloaded on December 23, 2009 at 18:06 from IEEE Xplore. Restrictions apply.
This article has been accepted for inclusion in a future issue of this journal. Content is final as presented, with the exception of pagination.
2 IEEE/ACM TRANSACTIONS ON NETWORKING
data rates at different time scales. This makes it possible to dis-tinguish a short-term reduction of the data rate due to tempo-rary link congestion from the long-term utilization of a link or apath. This paper also provides an answer to the problem of con-structing a best possible passive bandwidth estimation schemefrom the measurement of a traffic trace.
The assumptions in this paper on network and traffic charac-teristics are similar to those in many related works on bandwidthestimation techniques (see Section II). The available bandwidthis represented by a random process, where the source of ran-domness is the variability of network traffic.
The time scale of network measurements is assumed to besmall compared to the time scale at which characteristics ofnetwork traffic or network links change. This assumption is aconsequence of the requirement for time invariance in min-pluslinear system theory. However, it is allowed that the networkchanges its state between repetitions of a measurement. The as-sumption of time-invariance is not justified when properties ofa network link vary on short time scales, e.g., on wireless trans-mission channels with random noise. Consequently, such net-works are not adequately described in our min-plus system-the-oretic formulation.
The remainder of this paper is structured as follows. InSection II, we discuss bandwidth estimation methods and otherrelated work. In Section III, we review the min-plus linearsystem interpretation of the deterministic network calculus. InSection IV, we formulate bandwidth estimation as the solutionto an inversion problem in min-plus algebra. In Section V, wederive solutions to compute the inversion and relate them toprobing schemes from the literature. In Section VI, we justifyhow these probing schemes can be applied in networks that arenot min-plus linear. In Section VII, we present measurementexperiments of probing schemes suggested by the min-plussystem-theoretic concepts from this paper. We present briefconclusions in Section VIII.
II. AVAILABLE BANDWIDTH ESTIMATION TECHNIQUES
The goal of bandwidth estimation is to infer from measure-ments a reliable estimate of the unused capacity at a multiaccesslink, a single switch, or a network path. The available bandwidthof a network link in a time interval can be specifiedas [39]
where and are the capacity and total transmittedtraffic, respectively, on link at time . We note that individualdefinitions of available bandwidth used in the literature may de-viate from the above definition. It is generally assumed that linkcapacities have a constant rate, i.e., . With this, theavailable bandwidth can be interpreted as a random process,where the randomness stems from the variability of networktraffic.
If available bandwidth estimates for single links are available,the available bandwidth of an end-to-end network path withlinks is computed as [18]
(1)
Available bandwidth methods measure the transmission of a se-quence of control (probe) packets and use the measurementsto estimate or bound the available bandwidth. Instead of esti-mating the available bandwidth, other probing schemes seek todetermine the link with the least capacity along a path, givenby , and referred to as the bottleneck capacity. Ifthe time scale of measurements is small compared to the timescale at which characteristics of network traffic changes, net-work traffic can be described by a deterministic function. In thiscase, a single sample of the available bandwidth can be inter-preted as being conditioned on the state of the network. Eval-uating a large number of samples corresponds to computinga conditional average, which is justified as long as the trafficdistribution satisfies stationarity. When network characteristicschange on a short time scale, e.g., a wireless channels withrandom noise, a description of traffic and link by deterministicfunctions is not suitable.
Almost all proposed probing schemes perform measurementsof packet pairs or packet trains. Packet pairs consist of twopackets with a defined spacing, and packet trains consist of morethan two packets. Since it was first suggested in [16] and [21],packet pair probing has evolved significantly and has been usedfor estimating the bottleneck capacity (e.g., Bprobe [6], Cap-Probe [20]), the available bandwidth (e.g., ABwE [31], Spruce[39]), and the distribution of cross traffic [27]. The rationale be-hind these methods builds on the relation of packet dispersionand available bandwidth resources, i.e., packet pairs with a de-fined gap may be spaced out on slow or loaded links and thuscarry information about the network path. Some techniques,e.g., [27] and [39], build on a model of a single link whose ca-pacity is assumed to be known.
The majority of proposed methods employ packet trains forbottleneck capacity estimation (e.g., PBM [32], Cprobe [6],pathrate [11]), and for available bandwidth estimation (e.g.,pathload [17], TOPP [28], PTR/IGI [15], and pathchirp [34]).The general approach is to adaptively vary the rate of probingtraffic to induce congestion in the network. A comprehensivediscussion of all techniques is beyond the scope of this paper.For details and empirical evaluations of packet train and packetpair methods, we refer to [18] and [36]–[39]. Some studieshave found that packet trains provide more reliable bandwidthestimates than packet pairs [18], [25]. The wide spectrum ofbandwidth estimation methods indicates the complexity ofmeasuring available bandwidth in a network. In particular,the comparative evaluations of bandwidth estimation methodssometimes widely disagree in their conclusions on the capabil-ities and limitations of individual methods.
For the purposes of this paper, the two packet train methodspathload and pathchirp are particularly relevant. Pathload usesa sequence of constant rate packet trains, where the transmissionrate of consecutive trains is iteratively varied until it convergesto the available bandwidth. In pathchirp, the rate is varied withina single packet train using geometrically decreasing interpacketgaps. Both methods interpret increasing delays as an indicationof overload, i.e., to detect if the probing rate exceeds the avail-able bandwidth.
Most estimation techniques are designed with an assumptionthat the network as a whole exhibits the behavior of a single linkwith constant rate fluid cross traffic. Often it is assumed that thenetwork behaves as a single FIFO system [15], [24]–[29], [34],
Authorized licensed use limited to: The University of Toronto. Downloaded on December 23, 2009 at 18:06 from IEEE Xplore. Restrictions apply.

This article has been accepted for inclusion in a future issue of this journal. Content is final as presented, with the exception of pagination.
LIEBEHERR et al.: SYSTEM-THEORETIC APPROACH TO BANDWIDTH ESTIMATION 3
[39]. This is justified by the particular packet dispersion of FIFOsystems, which is matched by empirical data [29]. It has beenfound that the best estimates are obtained if the probing trafficincreases the load close to, but not beyond, the capacity of theassumed FIFO system.
Some probing methods suggest that probing traffic shouldfollow a Poisson process [25], [32], [39], [44] since it can benefitfrom the Poisson Arrivals See Time Averages (PASTA) prop-erty. Briefly, the PASTA property states that a Poisson arrivalprocess observes the average state of the system. An empir-ical study [40] found that Poisson probing does not necessarilylead to improved estimates of the available bandwidth. Also, [5]points out that in case of nonintrusive probing, Poisson probingmay not be justified since it does not minimize estimation vari-ance when deriving quantities of interest such as available band-widths.
A set of analytical studies [24]–[26] characterizes the dis-persion of probing traffic over single-hop and multihop pathsin terms of probing-response curves and extracts the availablebandwidth from these curves. Under the assumption of fluid,constant-rate cross traffic, probing-response curves feature asharp bend at the available bandwidth that is used as criterionby some methods, e.g., TOPP [28]. The mode of operationof many other methods, e.g., the detection of overload bypathload, can be related to these curves [25]. Under generalbursty cross traffic, the unique turning point of probing-re-sponse curves diminishes, whereas it can be recovered underidealized conditions, e.g., using packet trains of infinite length,as shown in [24]–[26].
An alternative approach to sending probe packets is to obtainestimates of the available bandwidth through passive measure-ments of user traffic. This is the preferred approach in measure-ment-based admission control (MBAC), which seeks to deter-mine if a network has sufficient resources to support minimalservice requirements for a traffic flow or aggregate [7], [19]. Incomparison to passive measurements, probing schemes have anadditional degree of freedom since they can control the trafficprofile of probing packets.
Finally, we discuss prior works that have employed networkcalculus methodologies in MBAC and bandwidth estimation.Most such works are found in the context of MBAC [7], [19],[41], [43]. Here, it is often assumed, e.g., in [19] and [41], thatnetwork nodes provide explicit support for bandwidth measure-ments. For example, if network nodes support traffic prioriti-zation and transmit probing traffic at the lowest priority, theavailable bandwidth can be simply expressed as the differenceof the node capacity and higher-priority traffic. The authors of[19] and [43] also investigate cross-traffic estimation of wire-less channel conditions. End-to-end measurements without net-work support have been considered in [7]. A major differenceto our work is that [7] analyzes bandwidth estimation within anode busy period. In the context of the network calculus, thisapproach implies the consideration of a specific class of ser-vice curves (called strict service curves in [23]), which do notnaturally extend to a multinode analysis. A broader differencebetween MBAC and bandwidth estimation is that MBAC oper-ates in the context of providing service guarantees. Here, onegenerally seeks to obtain a worst-case description of the avail-able service or traffic in terms of time-invariant envelope func-tions. Worst-case characterizations, even if relaxed to stochastic
Fig. 1. Linear time-invariant system and min-plus linear network.
bounds, tend to be very conservative. In this paper, we do not useenvelopes to describe traffic or service. To our knowledge, theonly study that has considered aspects of a min-plus system-the-oretic interpretation of available bandwidth is [3]. Under theimplicit assumptions of min-plus linearity and convexity of theavailable bandwidth (concepts that are discussed in detail laterin this paper), this study exploits a known relationship betweenthe Legendre transform of a system and its backlog.
III. MIN-PLUS LINEAR SYSTEM THEORY FOR NETWORKS
This section reviews the linear system representation of net-works and introduces needed concepts and notation. We con-sider a continuous-time setting.
Classical linear system theory deals with linear time-invariant(LTI) systems with input signal and output signal (seeFig. 1). Linear means that for any two pairs of input and outputsignals and , any linear combination of inputsignals results in the linear combination ofoutput signals . Time-invariant means thatfor any pair of inputs and outputs , a time-shifted input
results in a shifted output .Let be the impulse response of the system, that is, the
output signal generated by the system if the input signal is aunity (Dirac) impulse at time zero. The basic property of a LTIsystem is that it is completely characterized by its impulse re-sponse in the sense that the output of the system is expressed asthe convolution of the input signal and the impulse response
A. Min-Plus Algebra in the Network Calculus
A significant discovery of networking research from the1990s is that networks can often be viewed as linear systemswhen the usual algebra is replaced by a so-called min-plusalgebra [4], [8], [23]. In a min-plus algebra, addition is replacedby a minimum (we write infimum) and multiplication is re-placed by an addition. Similar to LTI systems, a min-plus linearsystem is a system that is linear under the min-plus algebra. Thismeans that a min-plus linear combination of input functions
results in the corresponding linearcombination of output signals . Inmin-plus system theory, the burst function
ifotherwise
(2)
takes the place of the Dirac impulse.Let be the impulse response, that is, the output when
the input is the burst function . Any time-invariant min-plus
Authorized licensed use limited to: The University of Toronto. Downloaded on December 23, 2009 at 18:06 from IEEE Xplore. Restrictions apply.

This article has been accepted for inclusion in a future issue of this journal. Content is final as presented, with the exception of pagination.
4 IEEE/ACM TRANSACTIONS ON NETWORKING
linear system is completely described by its impulse response,and the output of any min-plus linear system can be expressed asa linear combination of the input and shifted impulse responsesby
In analogy to LTI systems, this operation is referred to as con-volution of the min-plus algebra [8].1 If there exists a function
such that for all pairs , then it fol-lows that the system is min-plus linear.
The min-plus convolution shares many properties with theusual convolution, e.g., it is commutative and associative. Theassociativity of min-plus convolution is of particular importancesince it implies an easy way of concatenating systems in series.Given a tandem of two min-plus linear systems and ,the output can be computed iteratively asand, with associativity, holds. General-izing, a tandem of systems that are characterized by impulseresponses is equivalent to a single system withimpulse response
(3)
The observation that some networks can be adequately mod-eled by a min-plus linear system led to the min-plus formula-tion of the network calculus [8], [23]. Here, a system is a net-work element or entire network, input and output functionsand are arrivals and departures, respectively, and the impulseresponse , called the service curve, represents the service guar-antee by a network element. Network elements that are known tobe min-plus linear include work-conserving constant-rate links( , where is the link capacity), traffic shapers( , where is a burst size and is a rate), andrate-latency servers ( , where is a rate, isa delay, and ), and their concatenations. Asin [8] and [23], we make the convention that functions in themin-plus linear system theory are nondecreasing nonnegativefunctions that pass through the origin.
The relevance of the network calculus as a tool for theanalysis of networks results from an extension of its formalframework to networks that do not satisfy the conditions ofmin-plus linearity. Nonlinear systems implement more complexmappings of arrival to departure functions .In the network calculus, these are replaced by linear map-pings that provide bounds of the form or
[23, p. xviii]. Here, is referred to as a lowerservice curve and is referred to as an upper service curve,indicating that they are bounds on the available service. In amin-plus linear system, the service curve is both an upperand a lower service curve , which is thereforefrequently referred to as exact service curve.
B. Legendre Transform in Min-Plus Linear Systems
In classical linear system theory, the Fourier transform of, denoted by , establishes a dual domain, the fre-
quency domain, for analysis of LTI systems. In the frequencydomain, the Fourier transform turns the convolution to a multi-plication, that is, .
1We reuse the symbol of the operator for notational simplicity. The contextmakes this slight abuse of notation nonambiguous.
In min-plus linear systems, the Legendre transform, also re-ferred to as convex Fenchel conjugate, plays a similar role. TheLegendre transform of a function is defined as
Since can be interpreted as a rate, one may view the domainestablished by the Legendre transform as a rate domain. The Le-gendre transform takes the min-plus convolution to an addition[35], that is2
(4)
Other properties of the Legendre transform that we exploit inthis paper are that, for convex functions , we have
(5)
In other words, a convex function can be recovered fromby reapplying the Legendre transform [35]. In general, we onlyhave
and (6)
where denotes the convex hull of , defined as the largestconvex function smaller than .
Another property that will be used is that the Legendre trans-form reverses the order of an inequality, i.e.,
(7)
The statement is an equivalency when is convex. The potentialof the Legendre transform in the network calculus has been pre-viously studied in [3], [12], [14], and [30], generally focusingon the duality of time domain and rate domain. In this paper,we show how the properties of the Legendre transform can beexploited to phrase bandwidth estimation as a new applicationin the network calculus.
IV. A MIN-PLUS ALGEBRA FORMULATION OF THE BANDWIDTH
ESTIMATION PROBLEM
We view a network as a min-plus linear or nonlinear systemthat converts input signals (arrivals) into output signals (depar-tures) according to a fixed but unknown service curve . Theservice curve of the network expresses the available bandwidth,which can be a constant-rate or a more complex function. Mea-surements of a network probe, defined as a sequence of at leasttwo packets, can be characterized by an arrival functionand a departure function , where the functions representthe cumulative number of bits seen in the interval andtime 0 denotes the beginning of the probe. We assume that thesystem satisfies time-invariance over the duration of a probe.This corresponds to an assumption stated in Section II that net-work characteristics do not change over the duration of a mea-surement. The arrival and departure functions of a probe are con-structed from timestamps of the transmission and reception ofpackets and from knowledge of the packet size. In Fig. 2, weillustrate a network probe consisting of five packets of equalsize with fixed spacing between the transmission of consecutivepackets. The vertical distance between arrivals and departures
2Whenever possible, from now on we use the shorthand notation to mean“ for all ” and to mean “ for all .”
Authorized licensed use limited to: The University of Toronto. Downloaded on December 23, 2009 at 18:06 from IEEE Xplore. Restrictions apply.

This article has been accepted for inclusion in a future issue of this journal. Content is final as presented, with the exception of pagination.
LIEBEHERR et al.: SYSTEM-THEORETIC APPROACH TO BANDWIDTH ESTIMATION 5
Fig. 2. Example arrival and departure function of a probe of five packets.
is defined as the virtual backlog . Thehorizontal distance is defined as the delay .
Representing the network by a min-plus linear system, weinterpret a probing scheme as trying to determine from a spe-cific sample of functions and an estimate of an unknownlower service , such that holds for all pairs
of arrival and departure functions. Ideally, the estimateshould be a maximal , i.e., there is no other lower servicecurve larger than that satisfies the definition.3 The goal ofa probing scheme is to select a probing pattern, i.e., a function
, that reveals a maximal service curve. A maximal lower ser-vice curve computed from and yields a sample of theavailable bandwidth. Thus, can be expressed as the solutionto the following problem:
for all pairs
Since the service curve is defined in terms of an infimum, de-termining a maximal service curve has the flavor of a maximinoptimization, a class of problems which is fundamentally hard.
The bandwidth estimation problem is easier when the net-work can be described by a min-plus linear system. As we willsee in Section VI, some nonlinear networks, such as FIFO sys-tems, are min-plus linear under low load conditions. Recallingthat a system is min-plus linear if it can be described by an exactservice curve, the bandwidth estimation problem is reduced tosolving the inversion of
for all
Hence, if we take a measurement and we can solvefor , then, due to min-plus linearity, we have
a solution for all possible arrival and departure functions. FromSection III, we can infer that a solution is obtained by using theburst function of (2) as probing pattern, i.e., . Thisfollows since the service curve is the impulse response of a min-plus system, that is, . However, sendinga probe as a burst function is not practical since it assumes theinstantaneous transmission of an infinite-sized packet sequence.While a burst function can be approximated by a sufficientlylarge back-to-back packet train, a high-volume transmission ofprobes consumes network resources and interferes with otherpacket traffic. The observation that large packet trains can leadto unreliable estimates has been noted in the literature [11].
3We define a partial ordering of functions such that ifffor all .
In the next section, we present derivations for three bandwidthestimation methods in min-plus linear systems. We are ableto relate two of these methods to previously proposed probingschemes. We will later discuss how these schemes can be ap-plied to certain nonlinear systems.
We conclude this section with remarks on some general as-pects of probing schemes and their representations in min-pluslinear system theory.
• Timestamps and asynchrony of clocks: When clocks atthe sender and receiver of a probing packet are perfectlysynchronized, and the sender includes the transmissiontime into each probing packet, the receiver can accu-rately construct the functions and . In practice,however, clocks are not synchronized. When clocks havea fixed offset (but no drift), the arrival function canbe viewed as being time-shifted by an unknown offset
. In the min-plus algebra a time-shift can be expressedby a convolution, i.e., where
. Here, the convolution of arrival functionand service curve becomes , which due toassociativity and commutativity of the convolution opera-tion, can be rewritten as . Hence, when theoffset is fixed but unknown, even an ideal probing schemecan only compute a service curve that is a time-shiftedversion of the actual service curve of the network. Driftingclocks make the problem harder. Many bandwidth esti-mation schemes circumvent the problem of asynchronousclocks by returning probes to the sender [6] or by onlyrecording time differences of incoming probes [15], [17],[28], [34], [39]. A moment’s consideration shows thatknowledge of the differences between the transmissionand arrival of probing packets has the same limitationsas dealing with an unknown clock offset between thesender and receiver of probing packets.
• Losses: Probe packets that are dropped in the network canbe thought of as incurring an infinite delay. The presen-tation of arrival and departure functions in Fig. 2 is notwell suited for accommodating packet losses. An alter-native presentation, which expresses arrival and departuretimes of probe packets (on the y-axis) as a function ofthe sequence numbers (on the x-axis) can deal with packetlosses more elegantly, but may appear less intuitive. Sucha description of traffic with flipped axes leads to a dualrepresentation of the network calculus that is based on amax-plus algebra [8], [23].
• Packet pairs: The arrival and departure functions of apacket pair have each only three points, i.e., the origin andthe two timestamps related to the packet pair. If it can beassumed that the service curve has a certain shape, e.g., arate-latency curve , the service curvecan be recovered. In the absence of such an assumption,packet pair methods may not be able to recover more com-plex service curves. This is reflected in observations thatbandwidth estimates from packet pairs tend to be less reli-able compared to packet trains if cross traffic is bursty [18],[25].
V. MIN-PLUS THEORY OF NETWORK PROBING METHODS
In this section, we derive bandwidth estimation methods assolutions to finding an unknown service curve for a min-plus
Authorized licensed use limited to: The University of Toronto. Downloaded on December 23, 2009 at 18:06 from IEEE Xplore. Restrictions apply.

This article has been accepted for inclusion in a future issue of this journal. Content is final as presented, with the exception of pagination.
6 IEEE/ACM TRANSACTIONS ON NETWORKING
system. For the derivations, we make a number of idealizing as-sumptions. First, we consider a fluid flow view of traffic andservice. This assumption can be relaxed at the cost of addi-tional notation that accounts for packet sizes of arriving and de-parting traffic and for the fact that packet transmissions cannotbe preempted (see [8] and [23]). Unless stated otherwise, weassume that the network represents a min-plus linear system.This assumption will be relaxed in Section VI. We generally as-sume that accurate timestamps for transmission and arrival ofprobes are feasible. If measurements only record time differ-ences between events or include an unknown clock offset be-tween sender and receiver, the computed service curves need tobe time-shifted by some constant value.
The derivations of the methods presented in Sections V-Band V-C take advantage of the Legendre transform (seeSection III-B). There, we will see that the quality of the estima-tion depends on convexity properties of the underlying servicecurve. In fact, these methods can fully recover convex servicecurves, but only yield the convex hull, i.e., a lower bound, forservice curves that are not convex.
A. Passive Measurements
We first try to answer the question: How much informationabout the available bandwidth can be extracted from passivemeasurements of traffic? We first introduce the deconvolutionoperator of the min-plus algebra, which is defined for two func-tions and by
The deconvolution operation is not an inverse to the convolution. However, it has aspects of such an inverse.
This is expressed in the following duality statement from [23],which states that for functions , and , the following equiv-alency holds:4
(8)
We will exploit this property to formulate the following lemma.Lemma 1: For two functions and , we have
Proof: The proof makes two applications of (8). Let usdefine and . By definition of , we canconclude with (8) that .
By definition of , we see from (8) that . By ourdefinition of , this gives us . From and ,we get .
Combining the two statements about the relationship of andgives us . Now, by inserting our definition
, we obtain . Inserting our seconddefinition yields . Reorderingthe expression using commutativity of the min-plus convolutioncompletes the proof.
The lemma justifies the following passive measurementscheme. Let us denote the arrival and departure functionsmeasured from a traffic trace of one or more flows by and
. By assumption of linearity, we know that
4We use shorthand notation to mean “ for all.”
holds, but the shape of is unknown. Suppose we compute afunction from the trace as the deconvolution of the departuresand the arrivals, i.e., we set
(9)
With this, we can derive as follows:
The first equality holds because of our assumption of linearity,the second equality applies Lemma 1, the third uses again thelinearity assumption, and the fourth equality follows from in-serting (9). We can therefore conclude with Lemma 1 that
(10)
Applying the duality property from (8) to , weobtain . Then, with (9) we have
Hence, by deconvolving and as in (9), the result is alower service curve, i.e., for all pairs of arrival and departurefunctions , we have . Since, from (10), cancompletely reconstruct the departure function from the arrivalfunction, we can conclude that is the best possible estimate ofthe actual service curve that can be justified from measurementsof and , in the sense that it extracts the most informationfrom the measurements. Since the above deconvolution com-putes the largest available bandwidth that can be justified froma given traffic trace, the described method will perform no worsethan any existing MBAC method from the MBAC literature [7].
The main drawback of this method is that it can only be ap-plied to linear networks. For networks that do not satisfy min-plus linearity, i.e., that can only be described by a lower servicecurve or upper service curveonly computes a (not useful) lower bound for an upper servicecurve .
Example: The Dilemma of Passive Measurements: To illus-trate the benefits and limitations of passive measurements forbandwidth estimation, we present an ns-2 simulation [1] of mea-surements at a single node with capacity . There is a propaga-tion delay of 10 ms at the ingress link and a 10-ms delay at theegress link. The packet scheduling algorithm is either FIFO orDeficit Round-Robin (DRR). DRR approximates a fair queuingdiscipline, which can distribute capacity equally among crossand probe traffic. The cross traffic at this link consists of CBRtraffic, which is transmitted in 800-byte packets. The rate ofcross traffic is set to half the link capacity. The traffic source forpassive measurements is a small segment of 2 s of a high-band-width variable bit rate video trace from [10] (the data is fromthe video trace titled From Mars to China.). The frame rate is30 frames per second, the average data rate over the entire seg-ment is 17.1 Mbps, and the peak rate based on the interframespacing is 154 Mbps. We evaluate the bandwidth estimation,when the link capacity is set to Mbps. The re-sulting service curves are shown in Fig. 3. In each figure, theexact service curve (thick solid line) is a latency rate service
Authorized licensed use limited to: The University of Toronto. Downloaded on December 23, 2009 at 18:06 from IEEE Xplore. Restrictions apply.

This article has been accepted for inclusion in a future issue of this journal. Content is final as presented, with the exception of pagination.
LIEBEHERR et al.: SYSTEM-THEORETIC APPROACH TO BANDWIDTH ESTIMATION 7
Fig. 3. Example: Passive measurement simulation with a video source. (a)Mbps. (b) Mbps. (c) Mbps.
curve with delay 20 ms and rate . The computed estimatesare indicated by a dashed line for FIFO and a solid line forDRR scheduling. For Mbps, the available bandwidthis clearly underestimated. The estimates improve forMbps, where the video trace accounts for a larger fraction of theunused bandwidth. For Mbps, the available bandwidthis estimated with high accuracy for the DRR link, but overes-timated for the FIFO link. The overly optimistic estimates at aFIFO link occur when the variable bit rate of the video trafficoverloads the link, thereby preempting cross traffic. An expla-nation for this outcome is given in Section VI, where we dis-cuss nonlinearities observed in overloaded FIFO systems. Thevideo trace example indicates a fundamental dilemma with pas-sive measurements. On the one hand, if the traffic intensity ofthe measured trace is too low, the trace does not extract enoughinformation from the network. On the other hand, if the trafficintensity is too high, the traffic trace may preempt other traffic,thus leading to inaccurate estimates.
B. Rate Scanning
We now consider an active probing scheme that transmitspacket trains at a constant rate, but varies the rate of subse-quent trains, e.g., such as pathload [17]. We provide a justifica-tion for this approach, which we refer to as rate scanning, usingmin-plus system theory.
Given arrival and departure functions and , using the ear-lier definition of backlog, the maximum backlog can be com-puted as
If the arrivals are a constant rate function, that is,and the network satisfies min-plus linearity, we can writeas a function of as follows:
The first line uses that output in min-plus linear systems can becharacterized by . The second line moves the infimumin front of the subtraction, where it becomes a supremum. Thethird line is a substitution.
Recalling the definition of the Legendre transform fromSection III-B, the right-hand side of the last equationcan be written as the Legendre transform of , that is,
. This relation has been observed in [9], [12],and [30]. We now take a further step by applying the relation inthe reverse transform. Due to (5), we have for convex servicecurves that
Thus, every convex service curve can be completely recoveredby measurements of the maximum backlog . For servicecurves that are not convex, we obtain using (6) that
The convex hull is a lower service curve, that is, a lowerbound on the service curve. The quality of the convex hull asa lower bound deteriorates with the distance between the (non-convex) service curve and its convex hull. As long as service el-ements found in practice are reasonably well described by a la-tency-rate function (which is convex), their service curves willbe close to their respective convex hulls. Even for nonconvexservice curves, the convex hull may contain important informa-tion. For example, for a leaky-bucket traffic regulator with rate
and burst size , the convex hull recovers the rate parameters, but not the burst size .
The interpretation of rate scanning is that each constant bitrate stream with rate reveals one point of the servicecurve in the Legendre domain . If we specify a rate incre-ment, which sets the rate increase between packet trains and arate limit, which sets the maximum rate at which the network isscanned, we realize a rate scanning method that computes a ser-vice curve consisting of piecewise linear segments. The choiceof the rate increment determines the length of the segments, and,in this way, the accuracy of the computed service curve. We notethat rate scanning is capable of tracking a convex service curveup to a time where the derivative of the service curve reaches therate limit. The higher the maximum rate, the more informationabout the service curve is recovered. The number of packets in apacket train must be large enough so that the maximum backlogcan be accurately measured.
A criterion for picking the rate limit suggested by our deriva-tions is to stop rate scanning when increasing the scanning ratedoes not yield an improvement of the service curve. This cri-terion, however, may fail when the underlying network is notmin-plus linear. The rate scanning method pathload [17] usesan iterative procedure that varies the rate of consecutive packettrains until measured delays indicate an increasing trend. InSection VI, we will find that similar criteria can be justified todetermine a rate limit in a nonlinear system.
Authorized licensed use limited to: The University of Toronto. Downloaded on December 23, 2009 at 18:06 from IEEE Xplore. Restrictions apply.

This article has been accepted for inclusion in a future issue of this journal. Content is final as presented, with the exception of pagination.
8 IEEE/ACM TRANSACTIONS ON NETWORKING
Fig. 4. Service curve estimation with rate scanning. (a) Maximum backlog. (b) Rate scanning results with different rate limits.
In Fig. 4(a), we present an example of the rate scanningapproach for a fluid-flow service curve with a quadratic form
. In the example, rate scanning is performed atrates Mbps. In Fig. 4(a), we plot the maximumbacklog observed for each scanning rate. The functionis constructed by connecting the measured data points by lines.For rates exceeding the rate limit, we can setto obtain a conservative Legendre transform for all rate values.This follows from and the order-reversingproperty of the Legendre transform in (7). In Fig. 4(b), weshow the service curves that are obtained with different ratelimits. The higher the rate limit, the more accurate the results.Decreasing the increment of the rate will improve the accuracyof the service curve. We point out that both the backlog plot inFig. 4(a) and the service curves in Fig. 4(b) consist of linearsegments.
C. Rate Chirps
The need of rate scanning to measure a possibly large numberof packet trains has motivated the pathchirp method [34], whereavailable bandwidth estimates are based on the measurementof a single packet train, with a geometrically decreasing inter-packet spacing. The approach takes inspiration from chirp sig-nals in signal processing, which are signals whose frequencieschange with time. We refer to this approach as rate chirp, sincethe decreased gap between packets corresponds to an increaseof the transmission rate. We will show that a rate chirp schemecan be justified in min-plus system theory using properties ofthe Legendre transform.
Suppose we have a lower service curve satisfyingfor all pairs . Taking the Legendre transform we
obtain with the order-reversing property of (7) and with (4), that
We can rewrite this as
as long as the difference is defined for all .A sufficient condition is that since it prevents bothtransforms and from becoming infinite at the same valueof . Another application of (7) yields
If the system is min-plus linear, that is, , we get
If is also convex, then by (5), we have .As in rate scanning, if is not convex, due to (6), applying theLegendre transform twice on the service curve only recovers itsconvex hull.
This provides us with a justification for pathchirp [34] as aprobing method. If we depict the transmission of a packet chirpas a fluid flow function, we see that it grows to an infinite rate,thus yielding a Legendre transform that is finite for all rates. Bymeasuring arrivals and departures of the chirp, denoted byand , we can compute a function by
(11)
If the network satisfies for all arrivals, then theright-hand side of (11) computes . With (6), we obtain
, which tells us that is a lower service curve that satisfiesfor any traffic with arrival function and departure
function . If is convex, we have , and we can recoverthe service curve exactly.
In practical probing schemes, a packet chirp that can grow toan infinite rate is idealized since a rate chirp cannot be trans-mitted faster than the data rate at the sender of probe packets.For developing a practically useful probing scheme based onrate chirps, we propose modifications that make rate chirp im-plementable yet comply to the formal requirements of our equa-tions. Suppose a packet chirp is transmitted in a time interval
and is observed over an interval . If we setthe value of the arrival function to past the last measurementat time , we satisfy the requirement that . Forthe departure function, past the last measurement at , welet the function continue at a rate that corresponds to its slope attime . The following equations express the above extrapo-lation to the arrival and departure functions:
ifif
if
if
For convex service curves , we can argue that a service curveconstruction with the above extrapolation yields a lower boundon . Let us denote the departures that correspond to an arrivalfunction by . We will show that , thatis, is a lower bound on the departures that correspond toarrivals . To see this, we first observe that, in a min-pluslinear system, the function must be convex. This followsfrom the convexity of , the relationship thatholds for any pair of arrival and departures , and fromthe fact that the min-plus convolution of two convex functions isagain a convex function [23, Th. 3.1.6, p. 136]. By construction,
defines the smallest convex extrapolation of fortimes and, consequently, .
Now, evaluating (11) once with and once with, the order-inverting property of the Legendre transforms
yields that a service curve estimate computed from (11) usingis a (conservative) lower bound for the exact
service curve of the system.In Fig. 5(a), we show several rate chirps for a network probe.
The rate chirp consists of a step-function that emulates a se-quence of probing packets of 1200 bytes. The packets are trans-
Authorized licensed use limited to: The University of Toronto. Downloaded on December 23, 2009 at 18:06 from IEEE Xplore. Restrictions apply.

This article has been accepted for inclusion in a future issue of this journal. Content is final as presented, with the exception of pagination.
LIEBEHERR et al.: SYSTEM-THEORETIC APPROACH TO BANDWIDTH ESTIMATION 9
Fig. 5. Service curve estimation with rate chirps. (a) Rate chirps. (b) Rate chirpresults with different spread factors.
mitted at an increasing rate, starting at 10 Mbps and growing to200 Mbps. The rate is increased by reducing the elapsed time be-tween the transmission of the first bit of two consecutive packetsby a constant factor , which is called the spread factor in [34].Larger values for lead to shorter chirps that grow faster to themaximum rate. In Fig. 5(b), we show the service curves com-puted from the chirps in Fig. 5(a). The actual service curve is
, indicated as a thick solid line in the figure. A chirpwith a smaller spread factor , which transmits more packetsover a longer time interval, leads to better estimates of the ser-vice curve.
VI. BANDWIDTH ESTIMATION IN NONLINEAR SYSTEMS
Extending bandwidth estimation to systems that are notmin-plus linear, i.e., cannot be described by an exact servicecurve, raises difficult questions. First, the problem formula-tion of bandwidth estimation at the beginning of Section IVhas shown that the problem has the structure of a maximinoptimization. Moreover, in networks with nonlinearities thenetwork service available to a traffic flow may depend on thetraffic transmitted by this flow. If this is the case, knowledge ofthe available bandwidth may not help with predicting networkbehavior.
In this section, we provide solutions for a class of networksthat can be decomposed into disjoint min-plus linear and non-linear regions. These networks behave like a min-plus linearsystem at low load and become nonlinear when the traffic rateis increased beyond a threshold. In such a network, the goal ofbandwidth estimation should be to determine the available band-width of the linear region. The interpretation is that the availablebandwidth denotes the maximum additional load that the net-work can carry without degrading to a nonlinear system. Ourwork is motivated by studying the available bandwidth at a FIFOlink. While we conjecture that most networks can be adequatelydescribed by a system that behaves linearly at low loads, the ac-tual scope of this class of networks remains an open problem.
A. Nonlinearity of FIFO Systems
Consider the FIFO system shown in Fig. 6 with capacity. Assume that we have constant-bit rate traffic that is trans-
mitted in 800-byte packets. The FIFO queue experiences (cross)traffic at a rate of , and probing traffic is sent according to
. Assuming a link capacity of Mbps andcross traffic of Mbps, we consider a probing rate of
Mbps. For an ns-2 simulation of this system,Table I depicts the throughput of the probe packets for differentprobing rates. As seen previously for passive measurements at a
Fig. 6. FIFO system with probe and cross traffic.
TABLE IARRIVAL RATE AND THROUGHPUT OF PROBES IN FIFO
FIFO queue (see Fig. 3), once the probing traffic exceeds the un-used capacity, it preempts cross traffic and results in an overlyoptimistic estimate of the available bandwidth. Empirical ob-servations of FIFO systems with CBR cross and probe traffic in[29] suggested the following departure function:5
ifif (12)
Thus, if the probing rate is above the threshold , the ca-pacity allocated to the probe and cross traffic is proportional totheir respective rates. (Table I illustrates this relationship.) As aresult, probing traffic gets more bandwidth when its rate is in-creased. Note that systems where the allocated rate of a flowincreases with its arrival rate violate min-plus linearity.
We now offer a min-plus system interpretation of bandwidthestimation for the depicted FIFO scenario. Consider the func-tion . From the empirical departure char-acterization of a FIFO system from (12), we can verify thatthe following is satisfied for all :
if
if (13)
Therefore, is an exact service curve for when, and is a lower service curve when the arrivals
exceed the threshold value. In fact, is the largest lower ser-vice curve for a FIFO system and a solution to the maximizationin Section IV. Any function larger than may not be a lowerservice curve for rates , indicating that a FIFO systemis not min-plus linear in this range.
These considerations suggest to view a FIFO network as asystem that is min-plus linear at rates and crossesinto a nonlinear region when the rate exceeds the threshold. Thecrossing of these regions coincides with the point where theavailable bandwidth can be observed.
Probing schemes that vary the rate of probe traffic can some-times be interpreted in terms of searching for the crossover froma linear to a nonlinear regime. In particular, the rules in pathloadand pathchirp to stop measurements when increasing delays areobserved can be justified in terms of crossing the nonlinear re-gion (at least in a FIFO system) since a probing rate aboveis the turning point when the buffer of the FIFO system fills up.
5A proof of this property is found in [13]. We note that closely related modelsare devised for VBR cross traffic in [25]. While the statistical average of thedepartures can deviate from (12), the general effect of preemption of cross trafficas in (12) is recovered.
Authorized licensed use limited to: The University of Toronto. Downloaded on December 23, 2009 at 18:06 from IEEE Xplore. Restrictions apply.

This article has been accepted for inclusion in a future issue of this journal. Content is final as presented, with the exception of pagination.
10 IEEE/ACM TRANSACTIONS ON NETWORKING
In the remainder of this section, we address the problem of lo-cating this crossover point using system-theoretic arguments.
Remark: Per our discussion, a FIFO system becomes non-linear whenever the system is overloaded and a backlog is cre-ated. Now, if we consider a FIFO system where discrete-sizedpackets arrive instantaneously, we can take a position that eachpacket arrival creates a backlog, and, therefore, each packet ar-rival makes the FIFO system nonlinear. If we devised a systemthat detected nonlinearities caused by single packet arrivals, wewould only find that the available bandwidth is zero whenevera packet is in transmission, and equal to the capacity other-wise. The issue at hand is one of time granularity. Availablebandwidth estimation seeks to determine the unused capacityat a time scale larger than that of a single-packet transmission,specifically at the time scale of a packet train. In our system-the-oretic interpretation, we need to be able to observe linearityor nonlinearity at the same time scale, i.e., the duration of apacket train. This adds an implicit assumption that the nonlin-earity caused by a single packet arrival can be safely ignored. Ifthis is not the case, our proposed solutions may not apply.
B. Stopping Criteria
We address the problem of determining the threshold probingrate for a system with disjoint linear and nonlinear regions. Thethreshold probing rate can be interpreted as the maximum rateat which the network can be probed without leaving the linearregion. We refer to a condition that determines the maximumprobing rate as a stopping criterion.
Nonlinearity Criterion: In a min-plus linear system, the ser-vice curve is independent of the traffic intensity of the probetraffic. If we have obtained, under assumption of min-plus lin-earity, a lower service curve from a measurement probe withfunctions , then must be a lower service curve for anyother arbitrary measurement probe , that is,
for all times . A violation of the inequality indicatesthat the assumption of linearity used for the computation ofis false.
A simple nonlinearity test can be devised for systems whereincreased traffic does not result in decreased output. Considera sequence of probes , where the traffic inten-sity of subsequent probes is increased, that is, . Byassumption, we also have . Each probe results in anestimate . If there is a for which violates linearity forsome , that is, for some , then thenetwork is no longer in the linear region for the probe .
The described criterion can be directly applied to a rate scan-ning approach with increasing probing rates wherewith . As an alternative, one could modify the scan-ning rate to perform a search for the maximum scanning rate inthe linear region. This makes the criterion more similar to thescanning pattern in pathload.
Applying the nonlinearity criterion to a rate chirp approach isless straightforward since there is only a single arrival function
. Generating multiple arrival functions from a single ratechirp by truncating the arrival functions merely produces trun-cated versions of the same service curve. Transmitting multiplerate chirps with different spread factors [see Fig. 5(a)] makesthe criterion applicable, yet it loses the main advantage of ratechirps of requiring only a single packet train. Thus, with only a
single packet train, we are unable to justify a stopping criterionfrom min-plus linear systems theory.
Backlog Convexity Criterion: This method is appli-cable to the rate scanning methods, with probing rates
with . Assume that the max-imum backlog measurement is for rate . Recall fromSection V-B that a linear system satisfiesand holds for all . This motivates a testfor linearity that exploits properties of the Legendre transformdiscussed in Section III-B. Under the assumption of linearity,an estimate of the service is obtained from
and holds for all . Using (5) and (6), if thereexists an such that is not convex, i.e.,
for some , we have , and hence, the hypoth-esis of a linear system is dismissed.
For systems that are linear at low probing rates and cross intoa nonlinear region after a threshold is reached, a convexity testcan be easily devised for schemes that incrementally increasethe probing rate. After each rate step, one simply performs atest for equality of and . If
, the system has reached the nonlinear region andthe rate scan is terminated. Otherwise, it is assumed that thesystem is still linear, and the probing rate is increased.
To avoid false positives and negatives in the test for equality,we suggest a heuristic that can account for variability in themeasurements. For each value of , we compute the difference
Note that is nonnegative since. We define a parameter that
expresses the normalized difference. When exceeds athreshold value, we conclude that the system is no longer in thelinear region. We eliminate outliers by running a median filterover before applying the threshold test. The median filter[33] is a noise-reduction technique, which replaces the valueat the center of a sliding window over the data by the medianof the window. The design parameter is used to adjust howquickly nonlinearity is detected in noisy data. A large valueof filters noise effectively but may delay the detection ofnonlinearity, and vice versa. In all our experiments, msproved balanced.
An additional issue is that since packet trains have a certainlength, the maximum backlog may not be attained by atrain. In order to apply the backlog convexity criterion to fi-nite-length packet trains, it must be shown that the backlog thatis created by fixed-length packet trains also violates convexityonce the boundary to the nonlinear region is crossed. As an ex-ample, for FIFO systems, we obtain from (12) that the maximumbacklog generated by a packet train of bits is
if
if
Authorized licensed use limited to: The University of Toronto. Downloaded on December 23, 2009 at 18:06 from IEEE Xplore. Restrictions apply.

This article has been accepted for inclusion in a future issue of this journal. Content is final as presented, with the exception of pagination.
LIEBEHERR et al.: SYSTEM-THEORETIC APPROACH TO BANDWIDTH ESTIMATION 11
For all the second derivative of is negative,and thus is strictly concave, while it is convex for
. Thus, the backlog convexity criterion can be applied forfinite packet trains in this case.
VII. EXPERIMENTAL VALIDATION
In this section, we present measurement experiments on anIP network that provide an empirical evaluation of the proposedsystem-theoretic approach to bandwidth estimation. Specifi-cally, we attempt to provide answers to the following questions:
• How well does the described min-plus system theory thatassumes an idealized fluid-flow characterization of trafficand service translate in a packet-based environment?
• How robust are the available bandwidth methods tochanges of the distribution of the cross traffic?
• How well is a min-plus system-theoretical approach suit-able for finding end-to-end estimates over multiple links?
We conduct a series of measurement experiments on the Em-ulab network testbed at the University of Utah, Salt Lake City[42], where experiments are run on a cluster of PCs that are in-terconnected by a switched Ethernet network. Propagation de-lays are emulated by PCs that buffer packets in transmission.Emulab provides a realistic IP network environment, yet it offersa controlled lab environment where traffic and resource avail-ability can be explicitly configured. The ability to precisely con-trol network resources enables us to evaluate how well availablebandwidth estimates match the configured availability of net-work resources.
In our experiments, we take advantage of the fact that systemclocks in the Emulab testbed are synchronized up to 1 ms. Ac-cording to our discussion in Section IV, if synchronized clocksare not available, then the service curves computed in this sec-tion should be interpreted as being horizontally displaced by anunknown amount.
We have implemented the probing schemes for rate-scanning(Section V-B) and rate chirps (Section V-C) using the rude-crude traffic generator [22]. In addition, in some experimentswe include for benchmark comparison the results of measure-ments using an unmodified version of the pathload software.
We first present measurements on a dumbbell topology asshown in Fig. 7, where each node is realized by a PC of theEmulab network. The figure indicates the capacity and the la-tency of each link. Packet sizes are set to 800 bytes for crosstraffic and 1472 bytes for probing traffic. The average data rateof the cross traffic is set to 25 Mbps. The probing method seeksto determine the unused capacity of the link in the center of thefigure. The measurements do not address losses of probe traffic.In fact, when a probe packet is dropped, the measurement forthis packet is ignored.
A. Experiment 1: Rate Scanning vs. Rate Chirps
We first compare the effectiveness of the Rate Scanning andRate Chirp methods from Sections V-B and V-C in the dumbbelltopology. We assume that CBR cross traffic is sent at a rate of25 Mbps.
For the rate scanning method, each packet train has 400packets, transmitted in increments of 4 Mbps, up to at most 60Mbps. The stopping criterion is the backlog convexity criterionfrom Section VI-B with a threshold of ms and a windowsize of for median filtering.
Fig. 7. Dumbbell topology.
Fig. 8. Experiment 1: Service curve estimates with CBR cross traffic (Each ofthe graphs shows the reference service curve and the results of 100 repeatedestimates of the service curve). (a) Rate Scanning. (b) Rate Chirp.
For the rate chirp method, the initial spacing of probe packetsis set to a rate of 4 Mbps, where the spacing between subsequentpackets is governed by spread factor of . The chirp isstopped once its instantaneous rate reaches 100 Mbps, resultingin 66 packets for each chirp. The reason we let the rate chirps goup to 100 Mbps, whereas the rate scans only go up to 60 Mbps,is that data points at the end of the chirps become quite sparsedue to the geometric increase of the chirp’s rate. For rate chirps,we employ the stopping criterion proposed in [34], which aimsat finding the instantaneous data rate at which one-way packetdelays start growing due to persistent overload. (Note that anapplication of the nonlinearity criterion from Section VI-B tothe rate chirp method would require multiple rate chirps).
In Fig. 8(a) and (b), we present the results of 100 repeatedservice curve estimates in terms of the computed service curvesfor the rate scanning and rate chirp method, respectively. Asnoted in Section II, each sample of the available bandwidth canbe thought of being conditioned on the state of the network. Forreference, plotted in a thick solid line, we depict a rate-latencycurve with the minimal delay (of approximately 21 ms)6 and theaverage available bandwidth (25 Mbps). This curve is referredto as reference service curve and serves as an a priori bound forthe available bandwidth computations.
A comparison of Fig. 8(a) and (b) shows that rate scanningprovides more reliable estimates of the service curve than ratechirps. We note that the pathchirp method from [34] would yieldbetter results since it smooths the available bandwidth over 11estimates to deal with the variability of estimates from singlerate chirps. Rate scanning and rate chirps perform equally in anideal linear time-invariant system, while rate chirps are moresusceptible to random noise.
6The minimal delay consists of 20 ms propagation delay and approximately1 ms transmission delay.
Authorized licensed use limited to: The University of Toronto. Downloaded on December 23, 2009 at 18:06 from IEEE Xplore. Restrictions apply.

This article has been accepted for inclusion in a future issue of this journal. Content is final as presented, with the exception of pagination.
12 IEEE/ACM TRANSACTIONS ON NETWORKING
Fig. 9. Experiment 2: Rate scanning with different cross traffic. (a) Exponentialcross traffic. (b) Pareto cross traffic.
Fig. 10. Results from Experiments 1–2: Derivative of service curves.
In the remaining experiments, we only consider the rate scan-ning method.
B. Experiment 2: Different Cross Traffic Distributions.
In this experiment, we evaluate the rate scanning methodfor different distributions of the cross traffic on the dumbbelltopology. We consider cross traffic where interarrivals followan exponential or Pareto distribution (with shape parameterset to 1.5). All other parameters are as in Experiment 1. Inparticular, the average traffic rate of cross traffic is 25 Mbps.
In Fig. 9(a) and (b), respectively, we show the results for ex-ponential and Pareto cross traffic. The reference service curveis shown as a thick solid line. It is apparent that, compared toCBR cross traffic in Experiment 1, the higher variance of thecross traffic results in a higher variability of the service curveestimates. At the same time, even for Pareto traffic, almost all es-timates of the available bandwidth provide a conservative boundfor the reference service curve.
In Fig. 10, we reconcile the results from Figs. 8(a) and 9(a)and (b) in a single graph. We compute the derivatives of theservice curves and plot the mean value averaged over the 100estimates (with 95% confidence intervals). The graph also in-cludes the derivative of the reference service curve (thick solidline). The plot for the reference service curve shows a suddenincrease at time 21 ms, where the service curve jumps to a rate of25 Mbps. The derivatives of the service estimates for CBR, ex-ponential, and Pareto cross traffic provide lower bounds, whichbecome more pessimistic with increasing variance of the cross-traffic distribution.
Fig. 11. Topology with multiple bottleneck links.
TABLE IIPATHLOAD MEASUREMENTS
As a point of reference, we show in Table II the results ofthe pathload application available from [2] for the same net-work and cross traffic parameters. Pathload is frequently usedas a benchmark to evaluate bandwidth estimation techniques.The pathload application views available bandwidth as a rateand returns a range that is averaged over a time interval thatbounds the observed distribution of the available bandwidth. Foreach cross-traffic type, we ran pathload 100 times and computedthe average values of the lower and upper bounds of the esti-mated available bandwidth range. A comparison with Fig. 10shows that the lower bounds of the min-plus theoretic estima-tion yield service curves, whose long-term average rate is sim-ilar to or above the lower bound of pathload measurements. Asexpected, the variation range increases if the cross traffic has ahigher variability.
C. Experiment 3: Multiple Bottleneck Links
We now present measurements over networks with multiplebottleneck links. Fig. 11 depicts the network setup in Emulabwith two bottleneck links. The bottleneck links have a capacityof 50 Mbps. The interarrival distribution of cross traffic is expo-nential with parameters as discussed earlier in this section. Asprobing scheme, we again use rate scanning with the backlogconvexity stopping criterion.
For each network, we compute the end-to-end service curveusing two methods. In the first method, called End-to-End (E2E)Probing, we send probe traffic end to end over all bottlenecklinks. In the second method, referred to as Convolution, we sendprobe traffic separately over each bottleneck link and constructa service curve for each link. Then, we compute an end-to-endservice curve using the convolution operation following (3). Theconvolution can be done efficiently in the Legendre domain,where the convolution becomes a simple addition.
Note that in our computation of the available bandwidth overmultiple links, the convolution from (3) replaces the minimumin the widely used (1). For the special case that the availablebandwidths of links are constant-rate functions, the convolutionover multiple links is equal to the minimum of the rates. For-mally, if for all , we obtain
Authorized licensed use limited to: The University of Toronto. Downloaded on December 23, 2009 at 18:06 from IEEE Xplore. Restrictions apply.
This article has been accepted for inclusion in a future issue of this journal. Content is final as presented, with the exception of pagination.
LIEBEHERR et al.: SYSTEM-THEORETIC APPROACH TO BANDWIDTH ESTIMATION 13
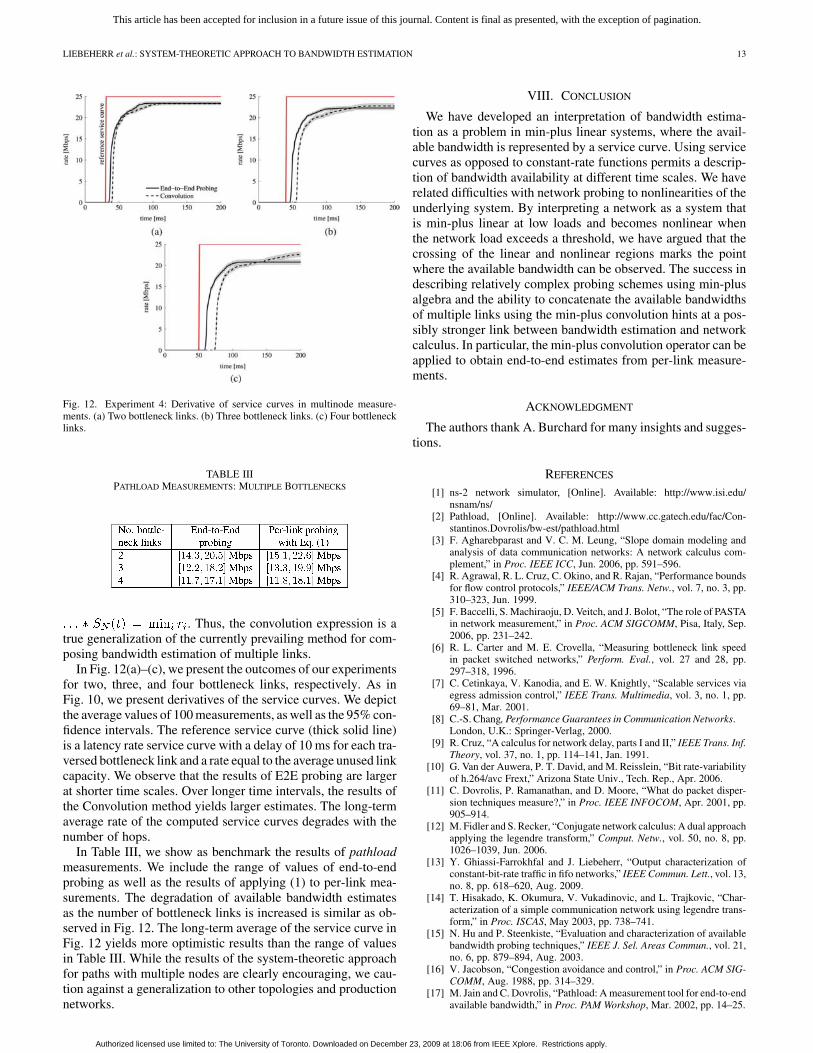
Fig. 12. Experiment 4: Derivative of service curves in multinode measure-ments. (a) Two bottleneck links. (b) Three bottleneck links. (c) Four bottlenecklinks.
TABLE IIIPATHLOAD MEASUREMENTS: MULTIPLE BOTTLENECKS
. Thus, the convolution expression is atrue generalization of the currently prevailing method for com-posing bandwidth estimation of multiple links.
In Fig. 12(a)–(c), we present the outcomes of our experimentsfor two, three, and four bottleneck links, respectively. As inFig. 10, we present derivatives of the service curves. We depictthe average values of 100 measurements, as well as the 95% con-fidence intervals. The reference service curve (thick solid line)is a latency rate service curve with a delay of 10 ms for each tra-versed bottleneck link and a rate equal to the average unused linkcapacity. We observe that the results of E2E probing are largerat shorter time scales. Over longer time intervals, the results ofthe Convolution method yields larger estimates. The long-termaverage rate of the computed service curves degrades with thenumber of hops.
In Table III, we show as benchmark the results of pathloadmeasurements. We include the range of values of end-to-endprobing as well as the results of applying (1) to per-link mea-surements. The degradation of available bandwidth estimatesas the number of bottleneck links is increased is similar as ob-served in Fig. 12. The long-term average of the service curve inFig. 12 yields more optimistic results than the range of valuesin Table III. While the results of the system-theoretic approachfor paths with multiple nodes are clearly encouraging, we cau-tion against a generalization to other topologies and productionnetworks.
VIII. CONCLUSION
We have developed an interpretation of bandwidth estima-tion as a problem in min-plus linear systems, where the avail-able bandwidth is represented by a service curve. Using servicecurves as opposed to constant-rate functions permits a descrip-tion of bandwidth availability at different time scales. We haverelated difficulties with network probing to nonlinearities of theunderlying system. By interpreting a network as a system thatis min-plus linear at low loads and becomes nonlinear whenthe network load exceeds a threshold, we have argued that thecrossing of the linear and nonlinear regions marks the pointwhere the available bandwidth can be observed. The success indescribing relatively complex probing schemes using min-plusalgebra and the ability to concatenate the available bandwidthsof multiple links using the min-plus convolution hints at a pos-sibly stronger link between bandwidth estimation and networkcalculus. In particular, the min-plus convolution operator can beapplied to obtain end-to-end estimates from per-link measure-ments.
ACKNOWLEDGMENT
The authors thank A. Burchard for many insights and sugges-tions.
REFERENCES
[1] ns-2 network simulator, [Online]. Available: http://www.isi.edu/nsnam/ns/
[2] Pathload, [Online]. Available: http://www.cc.gatech.edu/fac/Con-stantinos.Dovrolis/bw-est/pathload.html
[3] F. Agharebparast and V. C. M. Leung, “Slope domain modeling andanalysis of data communication networks: A network calculus com-plement,” in Proc. IEEE ICC, Jun. 2006, pp. 591–596.
[4] R. Agrawal, R. L. Cruz, C. Okino, and R. Rajan, “Performance boundsfor flow control protocols,” IEEE/ACM Trans. Netw., vol. 7, no. 3, pp.310–323, Jun. 1999.
[5] F. Baccelli, S. Machiraoju, D. Veitch, and J. Bolot, “The role of PASTAin network measurement,” in Proc. ACM SIGCOMM, Pisa, Italy, Sep.2006, pp. 231–242.
[6] R. L. Carter and M. E. Crovella, “Measuring bottleneck link speedin packet switched networks,” Perform. Eval., vol. 27 and 28, pp.297–318, 1996.
[7] C. Cetinkaya, V. Kanodia, and E. W. Knightly, “Scalable services viaegress admission control,” IEEE Trans. Multimedia, vol. 3, no. 1, pp.69–81, Mar. 2001.
[8] C.-S. Chang, Performance Guarantees in Communication Networks.London, U.K.: Springer-Verlag, 2000.
[9] R. Cruz, “A calculus for network delay, parts I and II,” IEEE Trans. Inf.Theory, vol. 37, no. 1, pp. 114–141, Jan. 1991.
[10] G. Van der Auwera, P. T. David, and M. Reisslein, “Bit rate-variabilityof h.264/avc Frext,” Arizona State Univ., Tech. Rep., Apr. 2006.
[11] C. Dovrolis, P. Ramanathan, and D. Moore, “What do packet disper-sion techniques measure?,” in Proc. IEEE INFOCOM, Apr. 2001, pp.905–914.
[12] M. Fidler and S. Recker, “Conjugate network calculus: A dual approachapplying the legendre transform,” Comput. Netw., vol. 50, no. 8, pp.1026–1039, Jun. 2006.
[13] Y. Ghiassi-Farrokhfal and J. Liebeherr, “Output characterization ofconstant-bit-rate traffic in fifo networks,” IEEE Commun. Lett., vol. 13,no. 8, pp. 618–620, Aug. 2009.
[14] T. Hisakado, K. Okumura, V. Vukadinovic, and L. Trajkovic, “Char-acterization of a simple communication network using legendre trans-form,” in Proc. ISCAS, May 2003, pp. 738–741.
[15] N. Hu and P. Steenkiste, “Evaluation and characterization of availablebandwidth probing techniques,” IEEE J. Sel. Areas Commun., vol. 21,no. 6, pp. 879–894, Aug. 2003.
[16] V. Jacobson, “Congestion avoidance and control,” in Proc. ACM SIG-COMM, Aug. 1988, pp. 314–329.
[17] M. Jain and C. Dovrolis, “Pathload: A measurement tool for end-to-endavailable bandwidth,” in Proc. PAM Workshop, Mar. 2002, pp. 14–25.
Authorized licensed use limited to: The University of Toronto. Downloaded on December 23, 2009 at 18:06 from IEEE Xplore. Restrictions apply.

This article has been accepted for inclusion in a future issue of this journal. Content is final as presented, with the exception of pagination.
14 IEEE/ACM TRANSACTIONS ON NETWORKING
[18] M. Jain and C. Dovrolis, “Ten fallacies and pitfalls on end-to-end avail-able bandwidth estimation,” in Proc. ACM IMC, 2004, pp. 272–277.
[19] Y. Jiang, P. J. Emstad, A. Nevin, V. Nicola, and M. Fidler, “Measure-ment-based admission control for a flow-aware network,” in Proc. 1stEuroNGI Conf. Next Generation Internet Netw. Traffic Eng., Apr. 2005,pp. 318–325.
[20] R. Kapoor, L.-J. Chen, L. Lao, M. Gerla, and M. Y. Sanadidi, “Cap-Probe a simple and accurate capacity estimation technique,” in Proc.ACM SIGCOMM, Aug./Sep. 2004, pp. 67–78.
[21] S. Keshav, “A control-theoretic approach to flow control,” in Proc.ACM SIGCOMM, Sep. 1991, pp. 3–15.
[22] J. Laine, S. Saaristo, and R. Prior, “Rude/Crude,” [Online]. Available:http://rude.sourceforge.net/
[23] J.-Y. Le Boudec and P. Thiran, Network Calculus a Theory of De-terministic Queuing Systems for the Internet. Berlin, Germany:Springer-Verlag, 2001.
[24] X. Liu, K. Ravindran, and D. Loguinov, “What signals do packet-pair dispersions carry?,” in Proc. IEEE INFOCOM, Mar. 2005, pp.281–292.
[25] X. Liu, K. Ravindran, and D. Loguinov, “A queuing-theoretic foun-dation of available bandwidth estimation: Single-hop analysis,”IEEE/ACM Trans. Netw., vol. 15, no. 4, pp. 918–931, Aug. 2007.
[26] X. Liu, K. Ravindran, and D. Loguinov, “A stochastic foundationof available bandwidth estimation: Multi-hop analysis,” IEEE/ACMTrans. Netw., vol. 16, no. 1, pp. 130–143, Feb. 2008.
[27] S. Machiraju, D. Veitch, F. Baccelli, and J. Bolot, “Adding definitionto active probing,” ACM SIGCOMM Comput. Commun. Rev., vol. 37,no. 2, pp. 19–28, Apr. 2007.
[28] B. Melander, M. Björkman, and P. Gunningberg, “A new end-to-endprobing and analysis method for estimating bandwidth bottlenecks,” inProc. IEEE GLOBECOM, Nov. 2000, pp. 415–420.
[29] B. Melander, M. Björkmann, and P. Gunningberg, “First-come-first-served packet dispersion and implications for TCP,” in Proc. IEEEGLOBECOM, Nov. 2002, pp. 2170–2174.
[30] J. Naudts, “Towards real-time measurement of traffic control parame-ters,” Comput. Netw., vol. 34, no. 1, pp. 157–167, July 2000.
[31] J. Navratil and R. L. Cottrell, “ABwE: A practical approach to availablebandwidth estimation,” in Proc. PAM Workshop, Apr. 2003, pp. 1–11.
[32] V. Paxson, “Measurements and analysis of end-to-end Internet dy-namics,” Ph.D. dissertation, Univ. California, Berkeley, Apr. 1997.
[33] I. Pitas and A. N. Venetsanopoulos, Nonlinear Digital Filters: Princi-ples and Applications. Norwell, MA: Kluwer, 1990.
[34] V. Ribeiro, R. Riedi, R. Baraniuk, J. Navratil, and L. Cottrell,“PathChirp: Efficient available bandwidth estimation for networkpaths,” presented at the PAM Workshop, Apr. 2003.
[35] R. T. Rockafellar, Convex Analysis. Princeton, NJ: Princeton Univ.Press, 1972.
[36] A. Shriram and J. Kaur, “Empirical evaluation of techniques for mea-suring available bandwidth,” in Proc. IEEE INFOCOM, May 2007, pp.2162–2170.
[37] A. Shriram, M. Murray, Y. Hyun, N. Brownlee, A. Broido, M.Fomenkov, and K. C. Claffy, “Comparison of public end-to-end band-width estimation tools on high-speed links,” in Proc. PAM Workshop,Mar. 2005, pp. 306–320.
[38] J. Sommers, P. Barford, and W. Willinger, “Laboratory-based cali-bration of available bandwidth estimation tools,” Microprocess. Mi-crosyst., vol. 31, no. 4, pp. 222–235, Jun. 2007.
[39] J. Strauss, D. Katabi, and F. Kaashoek, “A measurement study of avail-able bandwidth estimation tools,” in Proc. ACM IMC, 2003, pp. 39–44.
[40] M. M. Bin Tariq, A. Dhamdhere, C. Dovrolis, and M. Ammar, “Poissonversus periodic path probing (or, does PASTA matter?),” in Proc. 5thConf. Internet Meas., Oct. 2005, pp. 119–124.
[41] S. Valaee and B. Li, “Distributed call admission control for ad hoc net-works,” in Proc. IEEE 56th VTC, Sep. 2002, pp. 1244–1248.
[42] B. White et al., “An integrated experimental environment for dis-tributed systems and networks,” in Proc. OSDI, Dec. 2002, pp.255–270.
[43] D. Wu and R. Negi, “Effective capacity: A wireless link model for sup-port of quality of service,” IEEE Trans. Wireless Commun., vol. 2, no.4, pp. 630–643, Jul. 2003.
[44] Y. Zhang, N. Duffield, V. Paxson, and S. Shenker, “On the constancyof internet path properties,” in Proc. ACM SIGCOMM Internet Meas.Workshop, Nov. 2001, pp. 197–211.
Jörg Liebeherr (S’88–M’92–SM’03–F’08) re-ceived the Ph.D. degree in computer science fromthe Georgia Institute of Technology, Atlanta, in1991.
He was on the faculty of the Department ofComputer Science at the University of Virginia,Charlottesville, from 1992 to 2005. Since Fall2005, he has been with the University of Toronto,Toronto, ON, Canada, as Professor of electrical andcomputer engineering and Nortel Chair of NetworkArchitecture and Services.
Markus Fidler (M’04–SM’08) received the doctoraldegree in computer engineering from RWTH AachenUniversity, Aachen, Germany, in 2004.
He was a Post-Doctoral Fellow of NTNUTrondheim, Trondheim, Norway, in 2005 and theUniversity of Toronto, Toronto, ON, Canada, in2006. During 2007 and 2008, he was an EmmyNoether Research Group Leader at TechnischeUniversität Darmstadt, Darmstadt, Germany. Since2009, he has been a Professor of information tech-nology at Leibniz Universität Hannover, Hannover,
Germany.
Shahrokh Valaee (S’88–M’00–SM’02) received thePh.D. degree in electrical engineering from McGillUniversity, Montreal, QC, Canada, in 1994.
From 1994 to 1995, he was a Research Associate atINRS Telecom, Montreal, QC, Canada. From 1996 to2001, he was an Assistant Professor of electrical en-gineering with Tarbiat Modares University, Teheran,Iran. Since September 2001, he has been an AssociateProfessor of electrical and computer engineering withthe University of Toronto, Toronto, ON, Canada, andholds the Nortel Institute Junior Chair of Communi-
cation Networks.
Authorized licensed use limited to: The University of Toronto. Downloaded on December 23, 2009 at 18:06 from IEEE Xplore. Restrictions apply.