c:documents and settingstrelby1my documentsmy ... · pdf filesehwan yoo, university of...
TRANSCRIPT

Volume 8, Number 2 2004
Allied AcademiesInternational Conference
Maui, HawaiiOctober 13-16, 2004
Academy of Information andManagement Sciences
PROCEEDINGS
Volume 8, Number 2 2004

page ii Allied Academies International Conference
Maui, 2004 Proceedings of the Academy of Information and Management Sciences, Volume 8, Number 2
Allied Academies International Conference page iii
Proceedings of the Academy of Information and Management Sciences, Volume 8, Number 2 Maui, 2004
Table of ContentsASSIGNING RATIO CODING TO NOMINAL OR
ORDINAL DATA: INFERRING ATTRIBUTESFROM ONE TO THE OTHER . . . . . . . . . . . . . . . . . . . . . . . . . . . . . . . . . . . . . . . . . . . . . 1C. Nathan Adams, Middle Tennessee State University
APPRECIATIVE INQUIRY AS A MODEL FORPOSITIVE CHANGE IN AN UNDERGRADUATEINFORMATION TECHNOLOGY DEGREE PROGRAM . . . . . . . . . . . . . . . . . . . . . . . 3Richard Bush, Walden UniversityRaghu Korrapati, Walden University
MANAGING THE TOTAL COST OF SPAM . . . . . . . . . . . . . . . . . . . . . . . . . . . . . . . . . . . . . . 11Karen L. Hamilton, Columbus State UniversityRobert A. Fleck, Jr., Columbus State University
WHAT THE MANUAL DIDN’T TELL YOUABOUT POWERPOINT . . . . . . . . . . . . . . . . . . . . . . . . . . . . . . . . . . . . . . . . . . . . . . . . . 17Robert A. Fleck, Jr., Columbus State UniversityThomas P. Loughman, Columbus State UniversityTena F. McQueen, Columbus State University
TEACHING MULTIPLE DUMMY VARIABLES: STANDARD ERRORS FOR SHIFTEDINTERPRETIVE FRAMEWORKS . . . . . . . . . . . . . . . . . . . . . . . . . . . . . . . . . . . . . . . . 23R. Wayne Gober, Middle Tennessee State UniversityGordon L. Freeman, Middle Tennessee State University
NEW APPROACHES TO ONLINE PROCUREMENT . . . . . . . . . . . . . . . . . . . . . . . . . . . . . . . 25Dima Ghawi, University of San DiegoGary P. Schneider, University of San Diego
A VALUE CHAIN PERSPECTIVE OF KNOWLEDGEDEFINITIONS AND TRANSFORMATIONS . . . . . . . . . . . . . . . . . . . . . . . . . . . . . . . . 29Richard C. Hicks, Texas A&M International UniversityStuart D. Galup, Florida Atlantic UniversityRonald Dattero, Southwest Missouri State University
page iv Allied Academies International Conference
Maui, 2004 Proceedings of the Academy of Information and Management Sciences, Volume 8, Number 2
A DECISION SUPPORT SYSTEM MODEL FORFORECASTING IN INVENTORY MANAGEMENTUSING PROBABILISTIC MULTIDIMENSIONALDATA MODEL (PMDDM) . . . . . . . . . . . . . . . . . . . . . . . . . . . . . . . . . . . . . . . . . . . . . . 35Bhaskara Reddy Moole, Walden UniversityRaghu Babu Korrapati, Walden University
CONTRASTING WEB-CENTRIC AND PEER-TO-PEERARCHITECTURES FOR CONSUMER-TO-CONSUMERE-COMMERCE . . . . . . . . . . . . . . . . . . . . . . . . . . . . . . . . . . . . . . . . . . . . . . . . . . . . . . . . 41James Otto, Towson UniversityWilliam Wagner, Villanova UniversityVik Pant, Ixos Corporation
A STUDY TO EXAMINE FACTORS THATCONTRIBUTE SOFTWARE PROJECT SUCCESS . . . . . . . . . . . . . . . . . . . . . . . . . . . 47Kathleen O. Simmons, Walden UniversityRaghu Korrapati, Walden University
DRIVERS OF TURNOVER DECISIONS OFINFORMATION SYSTEMS PERSONNEL:JOB SATISFACTION VERSUS JOB FIT WITHQUALITY OF LIFE GOALS . . . . . . . . . . . . . . . . . . . . . . . . . . . . . . . . . . . . . . . . . . . . . 51David S. Taylor, Sam Houston State UniversityWynne W. Chin, University of Houston
OFFSHORE INFORMATION TECHNOLOGYOUTSOURCING-A WISE CHOICE? . . . . . . . . . . . . . . . . . . . . . . . . . . . . . . . . . . . . . . 55Santosh S. Venkatraman, Tennessee State University
EVALUATION OF THE HOME PAGE OF THE TOP 100UNIVERSITY WEBSITES . . . . . . . . . . . . . . . . . . . . . . . . . . . . . . . . . . . . . . . . . . . . . . . 57Sehwan Yoo, University of Maryland Eastern ShoreJongdae Jin, University of Maryland Eastern Shore
AUTOMATIC CONFLICT RESOLVING WEB-BASEDCLASS SCHEDULING SYSTEM . . . . . . . . . . . . . . . . . . . . . . . . . . . . . . . . . . . . . . . . . 61Sehwan Yoo, University of Maryland Eastern ShoreJongdae Jin, University of Maryland Eastern ShoreDae Ryong Kim, Delaware State University
Authors’ Index . . . . . . . . . . . . . . . . . . . . . . . . . . . . . . . . . . . . . . . . . . . . . . . . . . . . . . . . . . . . . . . 65
Allied Academies International Conference page 1
Proceedings of the Academy of Information and Management Sciences, Volume 8, Number 2 Maui, 2004
ASSIGNING RATIO CODING TO NOMINAL ORORDINAL DATA: INFERRING ATTRIBUTES
FROM ONE TO THE OTHER
C. Nathan Adams, Middle Tennessee State [email protected]
ABSTRACT
One of the first things to be done in analyzing data is a determination of data type; that is,what type of numeric scale is being used. This determination drives the kind of description andanalyses to be used. The strength of the numbers being used limit the appropriate measures ofdescription. Nominal values preclude the most basic of arithmetic actions, the numbers are in factvoid of information within themselves. Ordinal values allow scaling, but differences betweencategories are meaningless. Numerical scales (interval and ratio), however, are the highest levelsof measurement, contain the most information, and allow the full hierarchy of arithmetic functions.Thus, one would not calculate the arithmetic mean or standard deviation of nominal or ordinal data,but such measures would most certainly be considered for interval or ratio data.
Variants of the Likert scale are widely used in marketing and attitudinal research. Suchscales are generally coded with a counting variable (1, 2, 3, etc.) which is ratio in type. Perhaps,in part, because counting variables themselves have equal intervals, Likert scales are often treatedas if they were interval data. Assuming the distances between answer alternatives are equal, oneoften sees arithmetic means being used as a descriptive measure for such.
An example of such an application is the student evaluation of faculty performance currentlybeing used at a large Southeastern State University. The "Minimum Academic Currency Standardfor Tenured Faculty" includes a minimum requirement for a 2.0 arithmetic mean for studentresponses to the question:
Considering all factors (Questions 11-12 below, and others you think are relevant), how doyou rate the overall performance of this instructor in this courseA= outstanding; B= above average; C= average; D=- below average; E = poor
The coding for these answers are: A=4, B=3, C=2, D=1, E=0, a counting scale, generallyconsidered to be of ratio type. Although we would know that student X with a response of A("outstanding") thought the instructor to be better than respondent Y with a response of B ("aboveaverage "), we have no idea how much better nor can we even be sure that both respondents havethe same understanding of what constitutes "overall performance" and therefore, whether theyreally differ in their opinion about its quality. The only way one could appropriately use thearithmetic mean would be an assumption that the ordinal data in the students' responses have thesame characteristics as the numbers used to code the data, that is, equal intervals between thealternative answers. This paper discusses the potential consequences of such assumptions.

page 2 Allied Academies International Conference
Maui, 2004 Proceedings of the Academy of Information and Management Sciences, Volume 8, Number 2
Allied Academies International Conference page 3
Proceedings of the Academy of Information and Management Sciences, Volume 8, Number 2 Maui, 2004
APPRECIATIVE INQUIRY AS A MODEL FORPOSITIVE CHANGE IN AN UNDERGRADUATE
INFORMATION TECHNOLOGY DEGREE PROGRAM
Richard Bush, Walden [email protected]
Raghu Korrapati, Walden [email protected]
ABSTRACT
Over the past two years faculty in this department (in a University setting) have updated thecurriculum for its undergraduate information technology degree program, aligning it with needsof employers in the region where university resides, students, and the IS 2002 Curriculum Guide.Previous change initiatives resulted in minor improvements to the program as the developers of theprogram rejected the traditional process for change for a more holistic approach to encouragepositive long-term and continuous change. The potential to improve program quality, studentservices, retention, and other themes is critical to the long-term health of the information technology(IT) degree program. We used appreciative inquiry as a model for positive and continuous changeto improve the undergraduate program. Results have been encouraging and energizing with successin advancing change in an undergraduate program while incorporating stakeholders from aroundthe university to effect change. The model is in continuous process improvement and it has madesignificant progress.
INTRODUCTION
The purpose of this study is to report how faculty reengineered the undergraduate Bachelorof Science in Information Technology (BSIT) program to increase marketability to non-traditionaland transfer students at this University. That desire spawned several initiatives to align the BSITdegree program with the needs of the university, the college, local business and industry, and theIS 2002 Curriculum Guide. Like many organizations, BSIT was stuck in an organizationaldevelopment approach. This approach can and often does ignore the human aspect of change(Passmore, 2003). What was missing was an environment of collaboration, appreciation, andexcitement that built upon great efforts of previous members or positive efforts of those currentlyworking in the program. We used appreciative inquiry (AI) as a model for positive and continuouschange for BSIT reengineering. Appreciative inquiry (AI) “is an organizational tool that focuses onlearning from success” (Johnson & Leavitt, 2001, p. 130). AI offers a sustainable model for changeand growth in organizations connected to learning, sustainable development, and growth of theorganization (Eijnatten, 2002).
Appreciative inquiry, a method of evaluation, has set the stage for a new way of envisioningthe future of groups and organizations. The idea seemed clear and simple: Rather than viewing
page 4 Allied Academies International Conference
Maui, 2004 Proceedings of the Academy of Information and Management Sciences, Volume 8, Number 2
organizations as having problems, the researchers challenged managers and leaders to approachorganizations as containing mysteries. Universities have continued to contribute to the problem-solving mindset versus the human system—the mystery to be embraced. The BSIT degree programwas no different. Since its creation it has taken a more technology-centric approach to dealing withorganizational issues, focusing on solving problems. This study includes an evaluation of theeffectiveness of appreciative inquiry as an intervention methodology to assist in defining andcapitalizing on strengths and past successes the undergraduate degree program; in developing acompelling vision and mission to guide future strategic decisions and actions; and in re-brandingthe program to increase student and faculty recruitment, retention, graduation rates, and programquality.
APPRECIATIVE INQUIRY MODEL
When one understanding the foundations upon which appreciative inquiry is built, one is ableto shift to a more positive change paradigm and plan a positive intervention. By embracing theconstructionist principle organizations are free to create what they seek to create. The power of AIrests in the unconditional positive question where the “notion that organizations are open books,which are continuously in the process of being co-authored and re-authored over time” (Ludema,Cooperrider, & Barrett, 2001, p. 189 ). The first and most critical step in deciding upon the focusof the inquiry is asking:
1. What topics should be studied? 2. What would the organization like to know more about? 3. What areas of discussion will potentially generate intriguing possibilities toward
which the organization can work? (Cooperrider, et al., 2003; Ludema, Whitney,Mohr, & Griffin, 2003)
Topics can encompass anything that affects or influences organization effectiveness.Although one person or the management team of an organization can choose focus areas, topicgeneration is best accomplished through discussions with selected stakeholders at different levelsof an organization. Outcomes are very strong when different individual perspectives of theorganization's current state and potential are incorporated into the selection process. The size of thepre-selected stakeholder group is a matter of preference, although an opportunity for more diverseviewpoints exists within a larger group.
Topics selected for inquiry will provide a starting point for development of formalizedquestions and will ultimately lead subsequent discussions and resulting growth in those directions."AI has demonstrated that human systems grow in the direction of their persistent inquiries, and thispropensity is strongest and most sustainable when the means and ends of inquiry are positivelycorrelated" (Cooperrider et al., 2003, p. 30). Once identified, questions are carefully crafted to elicitfree-flowing discussion from interviewees regarding particular topic areas. In addition to beingtopic-focused, questions should be affirmatively constructed and posed in open-ended formatwhereby the interviewee is asked to "remember a time when…(Cooperrider et al., 2003).” Curran& Work (1998) describe it this way:
Allied Academies International Conference page 5
Proceedings of the Academy of Information and Management Sciences, Volume 8, Number 2 Maui, 2004
As we were all familiar with traditional interviewing methods, we knew that for thisnontraditional process, it would be essential to free interviewees from a state of mindof "answering" our questions; instead, we would encourage them to tell their ownstories. The interview structure was meant to serve as a doorway into the person'smeaningful recollections, not just to provide a means of gathering focused data (p.247).
Effective questions should engage the interviewee on both a personal and organizationallevel, thus defining a parallel between the reasons an individual has joined and continues with thegroup and clarifying the participant's social identity.
Discovery: What Gives Life?The interview process is commonly referred to as the discovery phase—the first of a 4-D
cycle. Its purpose is to find out what works in an organization, rather than to focus on what is ailing.Rediscovering peak experiences, individual values, and strengths upon which to identify futureopportunities and potentials are goals of the discovery phase. Questioning may take place in largeor small group situations or in one-on-one conversations. Regardless of the forum, the interviewershould systematically ask prescribed questions, provide prompts and/or request clarification asneeded, and withhold judgment and opinions that would sway interviewee responses (Cooperrider& Srivastva, 1987; Cooperrider, et al., 2003). The interview takes copious notes keyed to eachquestion.
Dream: What Might Be?The larger group is convened for the second step in the AI process, the dream phase. In this
phase, the project leader presents results of the interviews and allows the group to identify themesor recurrent ideas revealed during the discovery phase (Cooperrider, et al., 2003; Whitney &Trosten-Bloom, 2003). The project leader asks questions to initiate discussion based on the inquirytool. Questions may include:
1. What were the most humorous or surprising things you remember from theinterview?
2. What one word best describes your feelings after the interview was completed? 3. What do you believe is the life-giving force of BSIT degree program? (Whitney &
Trosten-Bloom, 2003).
A particularly effective way of helping to identify themes and simultaneously createenthusiasm for future visioning is to ask willing participants to recount some of the more compellingsuccess stories. Once identified, common themes of organizational strength are used as the basis forcollective discussion. Questions that would further spur a group discussion might include:
1. How can we capitalize on our strengths?
page 6 Allied Academies International Conference
Maui, 2004 Proceedings of the Academy of Information and Management Sciences, Volume 8, Number 2
2. We have identified remarkable success when partnering with other organizations,how might we expand our pool of partners, and with which organizations do wethink we would we be most compatible? Why?
3. Where do we want to see the organization in five years? (Whitney & Trosten-Bloom,2003).
"The dream phase is practical, in that it is grounded in the organization's history. It is alsogenerative, in that it seeks to expand the organization's potential" (Cooperrider et al., 2003, p. 112).The Dream phase provides an overall strategic focus for the organization.
Design: How Can it Be?The third d in the 4-D cycle stands for design. This phase builds on the dream phase and
provides tangible results in the form of provocative propositions, sometimes called possibilitystatements, which are "an ideal state of circumstances that will foster the climate that creates thepossibilities to do more of what works" (Hammond, 1998, p. 39). Provocative propositions challengethe status quo. They are goal statements which bridge the best of what is with what could bepossible. Although challenging and inspiring, these hard and provocative propositions are attainablebecause they are developed from the program’s successful past and identify its current strengths.These discussions should initiate action steps that translate intention into reality, what some havecalled creating the social architecture of the organization (Whitney & Trosten-Bloom, 2003).Through this design of an improved social architecture the organization has the blueprint it neededso that leaders begin to realize the destiny that is within reach.
Destiny: What Will Be?The fourth and final phase of the AI process is the destiny phase. Based on a shared vision
for the future, participants decide together upon a plan and commitments to implement the dreamsthat were refined in the design phase (Johnson & Leavitt, 2001).
It is a time of continuous learning, adjustment, and improvisation—all in the serviceof shared ideals. The momentum and potential for innovation are extremely high bythis stage in the process. Because of the shared positive image of the future, everyoneis invited to align his or her interactions in co-creating the future (Cooperrider et al.,2003, p. 176).
A VARIATION
A variation on AI is the best team approach. Bushe (1998) describes this simplified process,based on the principles of AI, as a means to help teams—groups smaller than the entireorganization—to conduct conversations that generate new, affirming, and generative images for theopportunities they identify. The objective is to create an appreciative space where everyone in thegroup feels comfortable and connects with other members of the group. This appreciative space isoften all a group needs to produce its own positive images (Bushe, 1998), while clearing the wayfor members to establish their identities within the group. This initial state helps minimize the need
Allied Academies International Conference page 7
Proceedings of the Academy of Information and Management Sciences, Volume 8, Number 2 Maui, 2004
for storming, allowing the group to move more efficiently from forming to norming (skipping overstorming) in the group development process.
Bushe’s (1998) simple model works well as a pre-4D cycle set of activities to form or gelthe group quickly:
Through their best team stories, individuals establish their identity in the group andindirectly indicate what role they are willing to play within the group. The groupidentifies qualities from which it will operate, making these qualities explicit. Whengenerated through an appreciative inquiry initiative individuals within the groupinternalize these qualities more effectively.
Throughout the life of the group it is important to recognize and appreciate the contributionsof individual members. Team building retreats should be conducted with a focus on increasingeffective relationships throughout team members’ time together. As described earlier the groupbegins to explore the best of what is through (Cooperrider et al., 2003):
1. Discovering who the stakeholders are;2. Crafting an appreciative question;3. Developing their interview guide;4. Collecting and organizing data;5. Conducting interviews; and6. Making sense of data from the inquiry.
With this information the group presses forward with data in hand to explore what might beof the organization during the dream activity. The success of this activity, Cooperrider et al. (2003)indicate, is that many dream activities share common components: They build upon the discoveryprocess by bringing in original inquiry in very personal and creative ways and they begin withenergizing activity, using a focal question that starts the rich and creative dream dialogues andencourages individuals to create personal dream reflections. Like architects, member oforganizations must consider the many elements that emerge through the discovery and dream phasesof the process when designing how it can be for the organization (Cooperrider & Whitney, 1999).The design stage takes into account four additional steps (Cooperrider et al., 2003):
1. Select design elements.2. Identify internal and external relationships.3. Identify themes and engage in dialogue.4. Write provocative propositions.
The above steps develop the bridge between what is and what might be. They are designed tochallenge the status quo and suggest possibilities for an organization’s future.
The fourth D, destiny, is to ensure that the dream can be realized. “The destiny phaserepresents both the conclusion of the discovery, dream, and design phases and the beginning of anongoing creation of an “appreciative learning culture” (Cooperrider et al., 2003, p. 177). This phase
page 8 Allied Academies International Conference
Maui, 2004 Proceedings of the Academy of Information and Management Sciences, Volume 8, Number 2
outlines implementation and rebirth of the process, an iterative process of continuous change andrenewal.
RESULTS
Using the best teams variation of AI, the program implementers have been able to reactquickly and decisively to adjust curriculum to meet changes in information technology whilemaintaining close alignment with the needs of industry, students, and the IS 2002 curriculum guide.For this program AI has proven to be a very powerful tool for organizational change. Although theprocess is far from complete the program developers continue to explore new ways of recruitingstudents and identify new markets for those efforts, reshaping the program flow to clarify forstudents the requirements of the degree; improving the quality of advising and student/customerservices; and collaborating with faculty and adjuncts to improve the delivery and quality ofindividual courses. Those involved in the change process view AI not as a closed system with abeginning and an end, but one that represents multiple levels of the 4-D cycle where growth andrediscovery can take place continuously.
CONCLUSIONS AND FURTHER RESEARCH
The positive impact on morale, motivation, perception of team members, and results of theefforts of the team contribute to addressing change with enthusiasm and energy. AI sets the stagefor a winning outcome for organizational or program change. Through this study, the investigatorsused appreciative inquiry as a model for positive and continuous change to reengineer an existingundergraduate program. The results have been encouraging and energizing with success inadvancing change in an undergraduate program while incorporating stakeholders from around theuniversity to effect that change. Further research could include continuing to evaluate the results ofthe program and make improvements.
REFERENCES
Bushe, G. (1998). Appreciative Inquiry with Teams. The Organization Development Journal, 16(3), 41-50.
Cooperrider, D., & Srivastva, S. (1987). Appreciative Inquiry in Organizational Life. In D. Cooperrider, D., Whitney,D., & Stavros, J. (2003). Appreciative Inquiry Handbook: The First in a Series of AI Workbooks for Leadersof Change. Bedford Heights, OH: Lakeshore Publishers.
Cooperrider, D., Whitney, D., & Stavros, J. (2003). Appreciative Inquiry Handbook: The First in a Series of AIWorkbooks for Leaders of Change. Bedford Heights, OH: Lakeshore Publishers.
Cooperrider, D. L., & Whitney, D. K. (1999). Appreciative inquiry. Williston, VT: Berrett Koehler Communications.
Curran, M., & Work, G. (1998). Creating Opportunities for Learning: A graduate class experiences AI in order to learnmore about it. In S. Hammond & C. Royal (Eds.), Lessons from the Field: Applying Appreciative Inquiry:Practical Press, Inc.
Allied Academies International Conference page 9
Proceedings of the Academy of Information and Management Sciences, Volume 8, Number 2 Maui, 2004
Eijnatten, F. M. v. (2002, May 9-11, 2002). From Intensive to Sustainable Work Systems: The Quest for a NewParadigm of Work. Paper presented at the Second Meeting of the European Academy of Management,Stockholm.
Hammond, S. A. (1998). The Thin Book of Appreciative Inquiry (2nd ed.). Plano, TX: Thin Book Publishing Co.
Johnson, G., & Leavitt, W. (2001). Building on Success: Transforming Organizations Through an Appreciative Inquiry.Public Personnel Management, 30(1), 129-136.
Ludema, J., Cooperrider, D., & Barrett, F. (2001). Appreciative Inquiry: the power of the unconditional positivequestion. In P. Reason & H. Bradury (Eds.), Handbook of Action Research: Participatory Inquiry and Practice.Thousand Oaks: Sage.
Ludema, J. D., Whitney, D., Mohr, B., & Griffin, T. (2003). The Appreciative Inquiry Summit: A practitioner's guidefor leading large-group change. San Francisco, CA: Berrett-Koehler.
Passmore, J. (2003). Professional standards research: appreciative inquiry. People Management, 9(24), 1.
Whitney, D. K., & Trosten-Bloom, A. (2003). The power of appreciative inquiry: A practical guide to positive change(1st ed.). San Francisco, CA: Berrett-Koehler.

page 10 Allied Academies International Conference
Maui, 2004 Proceedings of the Academy of Information and Management Sciences, Volume 8, Number 2
Allied Academies International Conference page 11
Proceedings of the Academy of Information and Management Sciences, Volume 8, Number 2 Maui, 2004
MANAGING THE TOTAL COST OF SPAM
Karen L. Hamilton, Columbus State [email protected]
Robert A. Fleck, Jr., Columbus State [email protected]
ABSTRACT
Business press has indicated that spam is a major threat to organizations. The amount ofspam has increased dramatically, and has resulted in clogging employees’ email boxes andorganizations’ networks. Organizations without appropriate spam-fighting measures are faced withlost productivity from employees and slower network processing.
The authors conduct interviews with representatives from several non-profit organizationsand review literature to determine the extent of the threat. They then propose a formal process tohelp organizations determine how to best address the spam threat. Comments on the process arealso collected during the interviews.
The conclusions reached by the authors suggest that the claims of the business press aboutthe extent of the spam threat have not been accurate for non-profits. Thus, the formal process maynot be valuable for organizations. However, additional research is necessary to determine whetherfor-profit organizations and other non-profit organizations are represented by results collected fromthe initial round of interview.
INTRODUCTION
Spam (unsolicited email) costs businesses and other organizations lost employee productivityfor time spent to delete spam, additional information technology (IT) costs to fight it, and increasedexpenses to manage its effects. Current estimates of the cost of spam include:1. Ten percent of IT staff time in large companies could be diverted from other priorities to
contain the effects of spam. (Kontzer, p.20)2. By 2007 a 10,000-employee firm without proper spam protection could spend up to $257
per employee on computing resources to handle spam. (Kontzer, p. 20)Supporters of spam claim that it is a legitimate business practice. Because of the support spam stillreceives, it is unlikely that spam will go away any time soon. Therefore, organizations have to findways to manage spam and any costs it adds to the organizations’ operations.
This paper discusses the effects of spam on organizational operations and how to effectivelyand efficiently manage them. Structured interviews were conducted with managers at several non-profit organizations to identify the spam costs, the measures currently in place to address spam, andthe standards used to assess the effectiveness of the spam-fighting measures. These interviews anda review of literature are used to establish a standard process by which organizations can evaluatethe total cost of spam, identify and analyze alternatives for addressing spam, and decide whichspam-fighting measures have the most merit for their operations.
page 12 Allied Academies International Conference
Maui, 2004 Proceedings of the Academy of Information and Management Sciences, Volume 8, Number 2
EFFECTS OF SPAM
According to Ferris Research, 15-20 percent of all incoming email for US computer usersis estimated to be spam and the number is steadily growing. Other sources estimate this figure to beas high as 55 percent. (“Spam Wars’) A CTO Network Survey, conducted in June 2003, found thatonly 3.3% of email, on average, is NOT spam. That means the remaining 96.7 percent, on average,includes some spamming. (Udell, 2003)
Jupiter Research predicts that the amount of spam received by the average consumer willincrease from 2300 emails per year in 2003 to 3600 per year in 2007. (“Still Choking on Spam) Fororganizations, the increase could be felt at much greater rates.
For one of the organizations the authors interviewed, the amount of spam received in August2004 represented 43.43% of the monthly email volume.
Even when organizations have implemented measures to address the effects of spam, theystill incur costs. (Harbaugh, 2004)
The organizations the authors interviewed suggested that once spam-fighting techniqueswere implemented, the benefits outweighed the costs. The filters, however, did identify somelegitimate email as spam. But the costs to correct those problems were not large.
RESPONSES TO SPAM
The articles in the business press indicate that organizations have responded to the effectsof spam by installing software and hardware, hiring additional employees in IT and other areas, andeducating employees about how to minimize spam. Based on the literature, spam-fighting softwareis one of the most popular measures taken by organizations and individuals. Software filters are usedto place email identified as spam in separate files. This can be done at the server gateway or at thedesktop. (Harbaugh and Dennis) Challenge/response software prevents email from unrecognizedemail addresses from being delivered unless the sender correctly responds to a challenge email.(Harbaugh and Dennis) A more recent development involves tracing the spam to its origins. Ifspammers can be readily traced, they may be less likely to continue their spamming activities.(“Who sent the Spam?”)
The organizations the authors interviewed are primarily using filters at the email server level.Another organization that the authors interviewed uses a filter at the email server, but passes on thespam emails after they are identified as spam. They plan to use the employees’ feedback to helpthem move to a filter that will prevent the spam from going any further than the email server.
One of the organizations the authors interviewed had tried Bayesian methods for fightingspam. The literature suggests that Bayesian filters can be very effective in eliminating spam andhelpful in identifying and blocking new spam technologies. (SpamAssassin Documentation)
MANAGEMENT OF SPAM
According to the body of literature, spam is costly and will continue to affect organizations.Thus, the authors suggest that spam and its effects must be effectively and efficiently managed. To

Allied Academies International Conference page 13
Proceedings of the Academy of Information and Management Sciences, Volume 8, Number 2 Maui, 2004
do this, organizations must not only recognize how spam affects their operations, but also mustweigh the costs and benefits associated with available alternatives for fighting the effects of spam.
Following these concepts and using the tools discussed below, could help organizationsminimize the effects of spam and the costs of fighting it, while maximizing the benefits to theorganization. However, our preliminary interviews have indicated that the need for such a processmight not exist—i.e., the non-profit organizations included in our sample did not experience thesignificant effects of spam that the business literature has proclaimed.
IDENTIFYING AND MEASURING THE EFFECTS OF SPAM
The body of literature suggests that many of the effects of spam are easily recognized, suchas lost productivity and slower network speed. However, some effects of spam may not be readilyapparent. Less recognized losses resulting from spam might include the following: (Marsh, 2003)1. Spam containing explicit sexual messages offends an employee. If this occurs frequently,
the employee might have a legitimate lawsuit concerning sexual harassment.2. Spam sent to a list of email addresses that are supposed to be private or otherwise protected
by an organization might result in a privacy violation lawsuit against the organizationmaintaining the list.
3. A large volume of spam might result in the organization's website crashing or the networkbecoming clogged and preventing business from being conducted. .
4. The organizations the authors interviewed identified the following effects spam had on theiroperations:
5. Servers crashed. 6. Employees complained. .The organizations did not recognize any additional problems associated with the volume of spamthey received. While the literature suggests that spam is costly and affects organizations in the waysmentioned above, means for measuring the costs of spam to an organization are not readilyavailable. A metric for identifying and measuring the effects of spam might follow a general riskmanagement survey instrument and contain some of the following components: Networkingprocessing speed reduced, amount of processing time increased, cost of reductions and increases;hardware cost increases; personnel cost changes; productivity and downtime cost estimates.
However, the organizations the authors interviewed did not have explicit methods formeasuring the effects and costs of spam. One organization counts the spam emails it receives, butdoes not convert that to a cost to the organization. Further, they were not sure such analysis wouldbe worth the time and effort. They could easily address the spam issue by implementing low-costor no-cost techniques without explicitly measuring the effects and costs of spam.
IDENTIFYING AND MEASURING THE COSTS AND BENEFITS OF ALTERNATIVES
The most common means of treating spam, as evidenced in the literature and by theorganizations the authors interviewed, is spam filtering software. As mentioned above, these filterscan be applied at the server or desk-top level.
page 14 Allied Academies International Conference
Maui, 2004 Proceedings of the Academy of Information and Management Sciences, Volume 8, Number 2
While software to filter out spam is often the primary treatment used, it may besupplemented by other spam-fighting techniques These include training the employees to reducetheir exposure (and thereby the organization’s exposure) to spam and changing the way in whichemail addresses are released on web pages and other areas where spammers can harvest them.
Additional spam-fighting alternatives include: White lists, Black lists, Challenge/response,and Secure messaging.
The organizations the authors interviewed are using spam filters that are part of a morecomprehensive package of antivirus and security software. The costs and benefits of the responsesto spam can be measured using a metric similar to the one suggested above for analyzing the effectsand costs of spam. For example, an expanded list of the solutions used by the organizationsdiscussed above would help analyze the benefits and costs of techniques available for addressingspam. This list of metrics would include the costs of software alternatives (e.g., filtering), hardware(e.g., routers), and changes to networking capacity.
For the organizations the authors interviewed, a formal process for evaluating spam-fightingalternatives was not in place. The spam filters implemented were included in the antivirus andsecurity packages that had been installed on the email servers. Furthermore, the cost of the spamfilter was minimal (or free, as for one organization). It was included in the cost of the package thatwas being used for antivirus and security protection. The updates for the packages include updatesfor filtering spam. For the organization automatically receiving those updates specifically for thespam filter component of the package, the updates are free.
DETERMINING THE PACKAGE OF MEASURES TO USE
According to the proposed process, once the available alternatives for fighting spam havebeen analyzed for costs and benefits, other tools can be used to determine the combination ofalternatives that would best meet the organization’s needs. A cost-benefit portfolio technique couldbe used for this purpose. Combinations of alternatives could be analyzed for their total costs andbenefits, with the selected combination being the one that minimizes the costs while maximizing thebenefits.
The organizations the authors interviewed did not have a formal process for analyzing thecombination of alternatives they implemented. One organization was using only the spam filter.Another organization was providing informal training about how employees could reduce theamount of spam they received in addition to using the spam filter.
MONITORING THE RESULTS
The monitoring step in the proposed process involves ensuring that the needs of theorganization are being met by the implemented alternatives. The results of the alternatives shouldbe compared to the expected benefits and costs identified in previous steps of the process.
In general, the organizations the authors interviewed were using informal monitoringprocesses.
Allied Academies International Conference page 15
Proceedings of the Academy of Information and Management Sciences, Volume 8, Number 2 Maui, 2004
SUMMARY
For the last few years, the business press has suggested that spam is a major problem fororganizations. It is clogging systems, causing problems with processing speed and employeeproductivity and increasing the IT costs of organizations as they try to address its effects. To helporganizations address this threat, the authors proposed a formal process for responding to the effectsand costs of spam. However, in the preliminary interviews the authors conducted with non-profitorganizations, the authors found that some organizations did not experience these significant effects.One organization had experienced server crashes, but upon moving to a dedicated email server witha spam filter, the problem essentially disappeared. Therefore, the formal process would not behelpful for these organizations.
According to the literature, spam filters are an effective and popular way for organizationsto address the effects of spam. The literature has also suggested that in addition to spam filters,more robust spam fighting techniques, such as secure messaging and challenge/response, are neededto adequately address spam. The organizations the authors interviewed had addressed spam withspam filters because the filters were included in the antivirus and security software packages theywere installing on their email servers. They were not using any additional software to fight spam.
CONCLUSIONS AND FUTURE ISSUES
The data gathered in the initial interviews with non-profit organizations do not support theclaims of the business press that spam is a major threat to organizations. Thus, while the authorspropose a formal process for analyzing the effects of spam and the alternatives for addressing spam,the preliminary results suggest that such a process is not necessary. Further data must be collectedto determine whether the initial interviews are representative of for-profit organizations and othernon-profit organizations. Additional interviews and surveys of organizations will be conducted bythe authors.
Additional research should also be conducted to determine whether the proposed processwould be valuable to organizations if it was generalized to include additional threats, such as pop-ups, instant messaging, viruses, worms, and other security issues. These threats have been identifiedin the literature and were mentioned by the organizations the authors interviewed. Expanding theprocess to include them might better help organizations maximize the benefits and minimize thecosts of addressing these threats.
REFERENCES
Callaghan, Dennis (May 31, 2004). Spam Fight Taps Authentication. eWeek, ,p. 16.
Harbaugh, Logan G.( June 2004). Spam-Proof Your In-Box. www.pcworld.com. p. 87.
Kontzer, Tony (September 1, 2003). Outsmarting Spam. Information Week. p. 20.
Marsh, Inc.( March 2003). Information Risk—Protecting Your Organization in a Networked World. Information RiskVolume II, Issue 2, pp. 10-13.

page 16 Allied Academies International Conference
Maui, 2004 Proceedings of the Academy of Information and Management Sciences, Volume 8, Number 2
SpamAssassin Documentation for Module "sa-learn", subsection "Getting Started", Subsubsection "Build a significantsample of both ham and spam" www.spamassassin.org/doc/sa-learn.html#getting%20started
Still Choking on Spam (March 2003). Communications of the ACM. Vol. 46, No. 3, p. 9.
Udell, Jon (July 21, 2003). Canning Spam. Infoworld. p. 46.
Who Sent the Spam? (June 2004). Mechanical Engineering. p. 14.
Spam Wars (July-Aug. 2003). www.ferris.com/offer/spam.html#report1 Technology Review. vol. 106, no. 6, pp. 32-39.
Allied Academies International Conference page 17
Proceedings of the Academy of Information and Management Sciences, Volume 8, Number 2 Maui, 2004
WHAT THE MANUAL DIDN’T TELL YOUABOUT POWERPOINT
Robert A. Fleck, Jr., Columbus State [email protected]
Thomas P. Loughman, Columbus State [email protected]
Tena F. McQueen, Columbus State [email protected]
ABSTRACT
Ever since students entered into a formal learning arrangement with faculty, faculty haveused a variety of tools to explain and to transmit concepts. These tools have included simple chalkboards to more sophisticated software packages much as IBM’s Storyboard, Asymetrix’s Compel,Harvard Graphics, and more recently Microsoft’s PowerPoint.
Currently, Microsoft’s PowerPoint has market dominance and is often considered the toolof choice for guiding class presentations. PowerPoint is, however, not free from criticism. Some ofthat criticism is directed at the software, specifically at its formulaic approach via templates andwizards to presentations that provide “cookie cutter” presentations to sometimes jaded audiences.Some critics have been bold enough to label this as “death by PowerPoint.”
Users of PowerPoint are not without responsibility in the development of their presentations.The issue is not just the use of templates and wizards and cluttered slides, but also the presentationof three-dimensional data on a two-dimensional medium. Edward Tufte addresses many of theseissues and makes several recommendations that are explored in this paper.
The paper describes in some detail the tricks and tools that have been, or could be, used tocreate both effective and ineffective PowerPoint presentations. The paper then concludes with aseries of recommendations for effective presentations.
INTRODUCTION: A HISTORY OF PRESENTATION TOOLS
A variety of tools and technologies have been developed to assist in student learning and theorganization of materials for presentation in professional, public, and educational settings. Theseinclude chalk boards, whiteboards, flipcharts, transparencies, smart boards, LCD panels, andsoftware tools such as Microsoft’s PowerPoint.
One of the earliest, widely-available, PC authoring tools was IBM’s Storyboard. Thisproduct saw a number of evolutionary steps, but is no longer available. Storyboard appearedsometime in early 1985 or 1984 (Version 1.1 is dated 1985). The product lived up to its name sinceit used the concept of a storyboard long used by script writers and producers.
Storyboard lasted at least into 1993 as “Storyboard Live.” One of the key characteristics (oflater versions) was the “if-then-else” branching capability. One of its strengths adopted by other

page 18 Allied Academies International Conference
Maui, 2004 Proceedings of the Academy of Information and Management Sciences, Volume 8, Number 2
software packages was color, on screen, presentations. These and similar capabilities were used ina well known theatre project, Florimène at the Court of Charles I (http://www.videoccasions-nw.com/history/florimene/flori1.html).
Harvard Graphics (Harvard Graphics, http://www.spco.com/about.asp) appeared on themarket in 1986 in a DOS-based version. The Window’s version appeared in 1991. Harvard Graphicsclaims that it was the “first presentation graphics program to include text, graphs and charts in oneprogram.” The early versions of Harvard Graphics were designed to generate printouts ortransparencies for use with projectors. As computer technology advanced, Harvard Graphicsreleased a version that would allow projection directly from the computer.
In 2001, Serif Incorporated purchased Harvard Graphics, and it now comes in a variety offlavors. The premier version includes the presentation software, a charting system with multipleeffects and data analysis, Web publication, photo editing, animation, import options, and a viewer.The product has won a number of awards in its almost two-decades of use, but has fallen from itspremier position in the market.
Asymetrix’s Compel was an early product that had sophisticated tools very similar to toolsnow available in PowerPoint. Objects, both static and animated, could be moved along a line orbetween slides to give the true appearance of cartoon animation. Compel is no longer available andone of Asymetrix’s other products, Toolbook, is now distributed by SumTotal(http://www.sumtotalsystems.com/). Compel is not mentioned on the SumTotal site.
PowerPoint by Microsoft now holds the market leader position and has incorporated manyof the key features found in Storyboard (presentation on screen), Harvard Graphics (chart tools) andCompel (animation). While some of these products and others such as WordPerfect’s Presentationsand freeware/shareware provide some competition and innovation, it now appears that Microsoftmust rely on itself for innovation. To a certain extent, they have lived up to the demands of themarket place with the introduction of Office 2003.
FEATURES OF POWERPOINT
PowerPoint has incorporated, adopted, or modified and enhanced many of the successfulfeatures of its predecessors and competitors. These include the storyboard concept, the slidemetaphor, and the ability to modify some graphics and to add graphs and charts based on dynamicdata.
The slide metaphor uses the concept of 35mm slides to arrange a presentation. A presentationconsists of a number of “slides” containing combinations of images, text, and charts. If the creatorof the presentation wishes to make a “live” presentation, the slides are presented in sequenceaccording to the order shown in the “slide sorter” view. In the slide-sorter view, the creator canrearrange, and hide slides. In addition, this view can be used to incorporate transition effects andbuild self-running shows.
Another view, the “Normal View,” allows the designer to create slides, add speaker notes,and see the presentation in either outline or sorter view. This view also allows the user to rearrangeslides either by using the outline or sorter. Outlines from Word documents can be ported intoPowerPoint for rapid creation of a companion presentation. Conversely, an outline in PowerPointcan be used for the skeleton of a document in Word.
Allied Academies International Conference page 19
Proceedings of the Academy of Information and Management Sciences, Volume 8, Number 2 Maui, 2004
For those who need a presentation created for them, PowerPoint provides a number ofwizards and templates. For example, the “AutoContent Wizard” provides eighteen options forcreation of a presentation ranging from “generic” to “Product/Services Overview.” Design templatesprovide a variety of colorful layout schemes. Other “useful” tools include grouping, and ungrouping.
Grouping objects is a time-saving strategy. Once the objects have been grouped, they canbe treated as a single object, and attributes can be applied to all objects in the group at one time.Some PowerPoint objects, such as images, can be ungrouped and then used to form new images orspecial animation. A Windows Metafile (.wmf) can be converted into a drawing object, ungroupedand edited. Files in bitmap, .jpg, .gif, or .png format cannot be converted to drawing objects and thenungrouped.
Adding sound and special visual effects such as animation to a presentation can generateinterest, but can take inordinate amounts of time. Time-saving steps include the use of presetanimation schemes and preset motion paths for text, graphics, bullets, and other objects. Numberedtags, corresponding to the effect applied, are quick ways to review which animations are applied towhich slides. It is always a good practice to preview or test the animation once it has been applied.
Animated graphics created using Macromedia Flash® and saved as a Shockwave® file canbe played using a specific ActiveX control and the Macromedia Flash Player. You can address thisin one of two ways: the ActiveX control can be added to the slide then a link can be created to theFlash file or you can embed the Flash file in the slide.
Sound files such as music add appeal to your presentation, but care should be taken withregard to accessing these files. Linked sound files must be stored in a separate source file then linkedto the destination file, your presentation. Making changes to one file will cause changes in the othersince the files are linked. Embedded sound files, on the other hand, are slightly different. Embeddedsound files are also stored in a separate source file, but are inserted in the destination file as part ofthe slide or presentation. You must make changes in both files because changes in the source filewill not be evident in your presentation. A rule-of-thumb is that sound files over 50 MB should belinked. If you are showing your presentation on another computer ensure that the source files thatcontain your linked source files and corresponding folder are saved on the computer you are using.If you are saving your source files to a CD-ROM, be certain that the software used to create the CDis compatible with the computer you will be using for the presentation. You may also use thePackage for CD provided in PowerPoint.
Hyperlinks from a slide to a Web page or Web file can be in the form of text or an objectsuch as a graphic. Hyperlink information for the destination page is either encoded as a URL or iscontained in the Web browser.
DEATH BY POWERPOINT: LIES AND OTHER TRUTHS
With all the power and capabilities inherent in the PowerPoint program and with the greatstrides in making the program easier to use, how can anything go wrong? As with anything else, thepower can be used for good or ill. Lying in PowerPoint, for example, occurs in ways similar to liesin other graphic-intensive media, except it might be easier to construct lies in PowerPoint becauseof the ready availability of clipart and photographic images. In the opinion of Edward Tufte, a lieoccurs when graphics are not “directly proportional to the numerical quantities represented” (1983,
page 20 Allied Academies International Conference
Maui, 2004 Proceedings of the Academy of Information and Management Sciences, Volume 8, Number 2
56). If gasoline prices have doubled within a certain time period, the naïve (or devious) presentermight consider using two gasoline pumps to show a comparison, one for before the price increase,one for after. The problem is, however, that while the price variable increases in only one dimension(height), the image of the pump increases in two dimensions (height, width). With the height andwidth of the pump doubling, the image actually increases fourfold (2 X 2). In addition, if the pumpis given the appearance of having depth, it now has three dimensions (height, width, depth), so itincreases eight-fold (2 X 2 X 2) in size.
Other ways to lie in PowerPoint are familiar to anyone who uses charts to depict numericaldata. One method is to present visual representations of data out of context to “emphasize” trendsor imply cause-and-effect relationships that might not otherwise be apparent. For example, let usassume that, after a certain vaccine has been given to a sample population in New Jersey, during thefollowing year cases of the target disease have gone down considerably. Seems as if the vaccineworked. But what if a more complete presentation of the data shows that cases of the disease haveover the last several years risen and fallen periodically, and the trend suggested for this year wasprobably going to be downward anyway? What if other states that did not introduce the vaccine alsoexperienced a decline in the disease? The neat correlation that appeared to exist between theadministering of the vaccine and the declining disease cases has suddenly become tenuous. The lieoften becomes more difficult to sustain when additional context is supplied.
One might also adjust the scale of bar or column charts, such as adding more data points onthe x axis or not starting with a zero point on the x axis, to create dramatic effects (Fink, 16-17). Bymaking simple (and apparently innocuous) changes to the axis scales, the presenter can make thedata appear to support different conclusions. Because the graphic images can be so large anddramatic in a PowerPoint presentation, it is particularly important for the presenter to be honest intheir creation.
RECOMMENDATIONS FROM THE EXPERTS: REVIVING THE AUDIENCE
Regardless of the presenter’s skill in creating sophisticated, technically dazzlingperformances, the two essential points of purpose and audience still must be addressed for thepresentation to be successful. What is to be accomplished? What does the creator of the presentationexpect the audience members to know or perhaps to do as a result of the presentation? Who are theaudience members? What are their ages, and cultural, religious, and ethnic backgrounds? Mixed orsame gender? Work experiences? What are they expecting from the presentation? If they areexpecting an informal chat session in a small room with an expert, the 40-slide presentation withaudio and video set up for a large auditorium is seriously overdone and out of place.
Once one has established that a PowerPoint (or similar) presentation is appropriate to thepurpose, audience, and setting, several guidelines about the “construction” of the presentation cancontribute to its success. Some of these include emphasizing important ideas by placing them at thebeginning and end of your presentation, and “chunking” ideas by taking many topics andcategorizing them into related “chunks” (Munter, 2002). Other decisions will involve the creationand use of visuals. Visuals enhance the persuasiveness of the material and the audience members’perception of the presenter. They also assist the audience members to pay attention and to recallinformation (Morrison and Vogel, 1988)
Allied Academies International Conference page 21
Proceedings of the Academy of Information and Management Sciences, Volume 8, Number 2 Maui, 2004
A caution about overdoing the visual gimmicks: Data can be obscured by “chartjunk” - datalegends, cross-hatching, clipart – in short, almost all the visual elements amateurs use to create whatthey believe will contribute to a memorable visual experience. However, simplicity is almost alwaysa better approach than complexity when it comes to using what Tufte calls “non-data ink.” Whateverdoes not contribute to the data, or the clear presentation of the data, according to Tufte, should beeliminated.
In more specific criticisms about PowerPoint itself as a presentation medium, Tuftemaintains that it suffers from “extremely low resolution.” This low resolution leads to“impoverished space,” which in turn leads to “over-generalizations, imprecise statements, slogans,lightweight evidence, abrupt and thinly-argued claims.” Because each slide can provide so littleinformation, many slides are needed. Audiences, says Tufte, “consequently endure an endlesssequentiality, one damn slide after another.” “The fans of PowerPoint,” he continues, “arepresenters, rarely audience members” (Tufte, 2003, p. 4).
Regarding color combinations: Often it is too late to change the color combinations of yourslides after you have gotten to the presentation site. The best combinations of colors on the computermonitor, most presenters have discovered to their dismay, rarely look the same on the screen.Sometimes the templates and wizards can be helpful in making choices about which colorcombinations work best together. Black on a white background is usually a safe bet, as are dark red,dark green, or dark blue on a white background. (Sorenson, 2001). Still, however, a test run underactual conditions is the surest way to be confident that the presentation will be both visible andreadable to an audience.
About point size and font families: While different font sizes and effects can effectively beused for emphasis (Sorenson, 2001), beware of the ransom note school of fonts and text effects.Resist the urge to bold everything, because if everything is bold nothing is bold. Resist also the urgeto get in an arms race with yourself by italicizing, bolding, and underlining everything because thatcreates an unreadable mess. Less, as the saying goes, often is more. Take a cue from the televisionad that had all grayscale images except for one spot of color on the screen. How distinct anddramatic that spot appeared!
In spite of the many well-founded criticisms of PowerPoint and its predecessors, thedeveloper is the one finally responsible for its content. While PowerPoint literally does what thedesigner wishes (within the limits of the software), PowerPoint does facilitate a coherentpresentation. The sequentiality of the product, though a potential problem, does require the designerto formally organize thoughts.
REFERENCES
Fink, A. (1995). How to report on surveys. Thousand Oaks, California: Sage Publications.
Florimène http://www.videoccasions-nw.com/history/florimene/flori1.html
Harvard Graphics, http://www.spco.com/about.asp
Morrison, J. & Vogel, D. (1988). The impacts of presentation visuals on persuasion. Information and Management, 33,125-135.

page 22 Allied Academies International Conference
Maui, 2004 Proceedings of the Academy of Information and Management Sciences, Volume 8, Number 2
Munter, M. & Russell, L. (2002). Guide to presentations. Upper Saddle River, New Jersey: Prentice Hall.
Sorenson, R., DeBord, G. & Ramirez, I. (2001). Business and management communication: A guide book (FourthEdition). New Jersey: Prentice Hall.
SumTotal http://www.sumtotalsystems.com/
Tufte, E. (1983). The visual display of quantitative information. Connecticut: Graphics Press.
Tufte, E. (2003). The cognitive style of PowerPoint. Connecticut: Graphics Press
Allied Academies International Conference page 23
Proceedings of the Academy of Information and Management Sciences, Volume 8, Number 2 Maui, 2004
TEACHING MULTIPLE DUMMY VARIABLES: STANDARD ERRORS FOR SHIFTED
INTERPRETIVE FRAMEWORKS
R. Wayne Gober, Middle Tennessee State [email protected]
Gordon L. Freeman, Middle Tennessee State [email protected]
ABSTRACT
When teaching introductory statistics courses some facets of multiple regression are notcovered. One such facet deals with statistical problems using multiple dummy variables. Theconventional coding scheme involves the binary interpretative framework, i.e., the dummy variablewill have a value of 1 or 0, depending on whether a given characteristic is present or absent. Therecommendation is to delete a category from each of the qualitative variables. The interpretationfor each dummy variable category coefficient is then made relative to the omitted category. Theteaching of multiple dummy variables is usually “wrapped” at this point as the interpretationsbecome more complex. Shifted interpretative frameworks, such as Suits and Sweeny-Ulveling, areavailable which allow the teaching of the interpretation of dummy variable coefficients relative to“an average” of the dependent variable The shifted frameworks also provide coefficients for theomitted categories. Another advantage of the shifted coefficients is the predicted value for thedependent variable can be estimated by simply determining to which categories the individual orgroups belong, and then summing the coefficients (positive or negative) associated with thesecategories with an overall average. Since the coefficients show the extent to which a categorydeviates from the dependent variable average, the standard errors of the shifted frameworkscoefficients allow for a significance test of each category’s difference.
The purpose of this paper is to provide a procedure (macro) to generate the Suits andSweeny- Ulveling shifted interpretative coefficients and standard errors. The procedure utilizes thebinary coding framework output obtained from the statistical package, Minitab. The procedures’output will allow for an extension of coverage when teaching multiple dummy variables in the basicstatistics courses.

page 24 Allied Academies International Conference
Maui, 2004 Proceedings of the Academy of Information and Management Sciences, Volume 8, Number 2
Allied Academies International Conference page 25
Proceedings of the Academy of Information and Management Sciences, Volume 8, Number 2 Maui, 2004
NEW APPROACHES TO ONLINE PROCUREMENT
Dima Ghawi, University of San DiegoGary P. Schneider, University of San Diego
ABSTRACT
The dramatic growth of the Internet and the rise of online commerce are providing new hopefor changing many costly, time consuming, and inefficient procurement processes. In recent years,many major industries have begun using Internet technologies to improve negotiation tactics andre-engineer procurement processes in ways that reduce the cost of doing business. A key Internettechnology used to improve negotiations is the electronic reverse auction. This paper outlines thepotential of reverse auctions for procurement negotiations, evaluates the current use of reverseauctions by major companies, and reviews the advantages and disadvantages of reverse auctions.The paper concludes with some specific recommendations about when to use and when not to usereverse auctions in procurement negotiations.
PROCUREMENT ARRANGEMENTS
Buyers and sellers can develop a variety of different procurement arrangements (Heide,1994). At one end of this spectrum of procurement arrangements is the transactional model in whichbuyers and sellers create contracts for specific transactions. The procurement negotiation processis focused on specific transactions. Each party to the transaction views the transaction negotiationof price and other terms in a win-lose framework
At the other end of the spectrum, buyers foster collaborative procurement arrangements inwhich the buyer and suppliers focus on identifying mutual benefits. By sharing knowledge and andcreating implicit understandings in an environment of trust, buyers and sellers negotiate procurementactivities and processes. These collaborative processes often involve more than one product orservice and can develop into relationships that last for many years. Indeed, in strategic sourcingrelationships, the parties make significant mutual financial investments and often search for businessopportunities that they can exploit as partners.
Most purchasing relationships fall between these two extremes. For example, sometransactional relationships involve long-term contracts that are reviewed every few years. In thesecases, buyers can develop considerable experience with suppliers over the term of the relationship.The degree of the continuing relationship between buyers and suppliers can be an important factorin determining whether or not the use of reverse auctions is advisable.
REVERSE AUCTIONS
In a reverse auction (also called a seller-bid auction), multiple sellers submit price bids toan auctioneer that who represents a single buyer. The bids are for a given amount of a specific item
page 26 Allied Academies International Conference
Maui, 2004 Proceedings of the Academy of Information and Management Sciences, Volume 8, Number 2
that the buyer wants to purchase. The prices go down as the bidding continues until no seller iswilling to bid lower. Reverse auctions are sometimes used in business-to-consumer (B2C)transactions, but the vast majority of these auctions (and by far the largest portion of the dollarvolume of these auctions) involves buyers and sellers that are both businesses or not-for-profitorganizations. In many business-to-business (B2B) reverse auctions, the buyer acts as auctioneerand screens sellers before they can participate.
In a typical B2B reverse auction, the buying organization prepares specifications for thegoods or services to be bought, and then decides how to structure the online auction event and whento schedule it. The buying organization then selects bidders, sends them copies of the specifications,clarifies any conditions that will exist in the final purchase agreement, explains bid rules, andarranges for the suppliers’ employees (who will be doing the bidding) to be trained. During theauction event suppliers log on to a Web site created for that specific reverse auction and place bids.
In some reverse auctions, called open-bid auctions, suppliers are provided with a continualview of the prices being entered by their competitors. In sealed-bid reverse auctions, suppliers eitherhave no information about other bids or only see their rankings in relation to the other suppliers’bids. Typically, reverse auction events are scheduled to run for an hour, but many include aprovision that automatically extends the auction if bidding occurs within the last few minutes of theoriginal event period. The main objective of a reverse auction is to obtain the lowest cost possible.Because the reverse auction event is conducted online, the buyer’s procurement staff and executivescan observe the event as it occurs. The results gained from reverse auctions can be made highlyvisible within the buyer organization.
Many businesses are creating various types of electronic marketplaces to conduct B2Btransactions (Eng, 2004). Many of these marketplaces include auctions and reverse auctions. Jap(2003) reports that in 2001, glass and building materials producer Owens Corning held more than200 reverse auctions for a variety of items including chemicals (direct materials), conveyors (fixedassets), and pipe fittings (MRO). Owens Corning even held a reverse auction to buy bottled water.Asking its suppliers to bid has reduced the cost of those items by an average of 10 percent. BecauseOwens Corning buys about $3.4 billion of materials, fixed assets, and MRO items each year, thepotential for future cost savings is significant.
Both the U.S. Navy and the federal government’s General Services Administration areexperimenting with reverse auctions to acquire a small part of the billions of dollars worth ofmaterials and supplies they purchase each year (Hannon, 2003). Companies that use reverse auctionsinclude Agilent, BankOne, Bechtel, Boeing, Raytheon, and Sony (Emiliani, 2003).
Not all companies are enthusiastic about reverse auctions. Some purchasing executives arguethat reverse auctions cause suppliers to compete on price alone, which can lead suppliers to cutcorners on quality or miss scheduled delivery dates. Others argue that reverse auctions can be usefulfor non-strategic commodity items with established quality standards. However, as R. Gene Richternoted in a 2001 interview published in Purchasing, “Everything is strategic to somebody. Talk aboutballpoint pens. A secretary has spots all over her brand new blouse because the pen you bought fora cent and a half is leaking.” Companies that have considered reverse auctions and decided not touse them include Cisco, Cubic, IBM, and Solar Turbines.
Allied Academies International Conference page 27
Proceedings of the Academy of Information and Management Sciences, Volume 8, Number 2 Maui, 2004
CONCLUSIONS
With compelling arguments on both sides (see, for example, Carbone, 2003; Erdmann,2003), the extent to which reverse auctions will be used in the B2B sector is not yet clear; however,some guidelines for deciding whether or not to use reverse auctions are beginning to emerge. Insome industry supply chains, the need for trust and long-term strategic relationships with suppliersmakes reverse auctions less attractive (Dunn, 2003). In fact, the trend in purchasing managementover the last 20 years has been to increase trust-based relationships that endure for many years.Using reverse auctions replaces trusting relationships with a bidding activity that pits suppliersagainst each other and is seen by many purchasing managers as a step backward.
In some industries, suppliers are larger and more powerful than the buyers. In thoseindustries, suppliers simply do not agree to participate in reverse auctions. If enough importantsuppliers refuse to participate, it is impossible to conduct reverse auctions. In industries where thereis a high degree of competition among suppliers, however, reverse auctions can be an efficient wayto conduct and manage the price bidding that would naturally occur in that market (Krizan, 2003;Magstadt, 2003). Supply chain conditions that are favorable for the use of reverse auctions include:
Suppliers are highly competitiveProduct features can be clearly specified before the auction eventSuppliers are willing to reduce the margin they earn on the productSuppliers are willing to participate in reverse auctions
Supply chain conditions that can discourage the use of reverse auctions include:
Product is highly complex or requires regular changes in designProduct has customized featuresLong-term strategic relationships are important to buyers and suppliersSwitching costs are high
Reverse auctions work well for items that are interchangeable; that is, commodities that can beproduced by a variety of suppliers. Specialized or patented products are not good candidates forreverse auctions. Simple items with few parts are good candidates because such products tend to behighly reliable. High reliability helps reduce post-auction costs. Highly interchangeablecommodities are good choices for reverse auctions because they make the events attractive to moresuppliers. The specification for an interchangeable commodity is likely to be better understood bya vareity of suppliers as well. A misunderstanding in specifications can lead to serious problems ,including unfair competition during the auction and a resulting purchase of a product that is notconstructed satisfactorily.
REFERENCES
Carbone, J. (2003) Debate rages over use of e-auctions for components. Purchasing, Chemicals Edition, 132(19),December 11, 48-49.

page 28 Allied Academies International Conference
Maui, 2004 Proceedings of the Academy of Information and Management Sciences, Volume 8, Number 2
Dunn, D. (2003) Reverse auctions fail to deliver on their promise. InformationWeek, September 8, 16.
Emiliani, M. (2003) Sourcing in the global aerospace supply chain using online reverse auctions. Industrial MarketingManagement, 33(1), January, 65-72.
Eng, T-Y. (2004) The role of e-marketplaces in supply chain management, Industrial Marketing Management, 33(2),February, 97-105.
Erdmann, D. (2003) Pros and cons of reverse auctions. Industrial Distribution, 92(10), October, 32.
Hannon, D. (2003) CAPS Research study defines staying power of e-auctions, Purchasing; Metals Edition, 132(12),August 14, 48-49.
Heide, Jan B. (1994) Interorganizational governance in marketing channels, Journal of Marketing, 58(1), January, 71-85.
Jap, S. (2003) An exploratory study of the introduction of online reverse auctions. Journal of Marketing, 67(3), 96-107.
Krizan, W. (2003) New guidelines may take some pain out of reverse auctions. ENR: Engineering News-Record,251(21), November 24, 14-15.
Magstadt, M. (2003) What would you do? Industrial Distribution, 92(12), December, 66.
Supplier Selection & Management Report. (2003) Four essential steps to running effective e-reverse auctions., 3(11),November, 1-3.
Allied Academies International Conference page 29
Proceedings of the Academy of Information and Management Sciences, Volume 8, Number 2 Maui, 2004
A VALUE CHAIN PERSPECTIVE OF KNOWLEDGEDEFINITIONS AND TRANSFORMATIONS
Richard C. Hicks, Texas A&M International [email protected]
Stuart D. Galup, Florida Atlantic [email protected]
Ronald Dattero, Southwest Missouri State [email protected]
ABSTRACT
Knowledge Management exists at the intersection of human and computer-based knowledgesystems, but rigorous research is hindered by the inconsistent and contradictory definitions givento such basic terms as knowledge, information, and data. One major school of thought is inspiredby Polyani, who argues that all knowledge resides in the mind, which implies that knowledge doesnot exist in computer-based form. A second school of thought defines knowledge in terms of a valuechain, and classifies expert systems as explicit knowledge in the Knowledge Hierarchy.
By extending and integrating theories from the value chain theorists, we propose the ValueChain Knowledge Hierarchy. It classifies knowledge into three classes based on its usefulness inperforming a task. Facts are defined as observed values, Influences are defined as processed datain context that assists in making a decision, and Solutions are defined as an unambiguous set ofinstructions to be used in performing a task.
Evaluation of knowledge transformations from different theoretical and practicalperspectives identifies transformations previously unreported in the literature. Facts may betransformed directly into Solutions. Additionally, the data used in Solutions or Influences maybecome Facts if used in a different context.
INTRODUCTION
A major difficulty in the research of Knowledge Management is the lack of a consistentvocabulary. After over 2,400 years of debate, the definition of knowledge is unclear. Withoutconcise, accepted definitions of the key concepts in the domain, rigorous discussion is difficult.When transformations of knowledge are discussed, definitional differences are especially hazardous,as one man’s knowledge is another man’s information.
A common theme in the Knowledge Management (KM) literature is that data is combinedto create information, and information is combined to create knowledge (Alavi 2001). There is aconsensus that data are discrete facts. But after that, consensus is lacking, so we will provide areview of the many definitions for information and knowledge.
Information has been defined as: data in context (Galup et al. 2002, Zack 1999), result ofanalyzing and interpreting data that carries meaning (Bourdreau 1999), raw material (Dreske 1999),
page 30 Allied Academies International Conference
Maui, 2004 Proceedings of the Academy of Information and Management Sciences, Volume 8, Number 2
relating to descriptive and historical fact (Kock and McQueen 1998), interpreted data (Vance 1997),analyzed data (Harris 1996), answers to the questions who, what, where, when, and how many(Ackoff 1996), data with special relevance and purpose (Drucker 1995), organized or structured data(Bohn 1994), data that makes a difference (King 1993), and factual statement (Kogut and Zander1992). The most common component of these definitions is the notion that information is data thathas been processed and / or placed in context (Galup 2002, Bourdreau 1999, Kock and McQueen1998, Vance 1997, Harris 1996, Drucker 1995, Bohn 1994, King 1993).
There is even less consensus about the meaning of knowledge. The two major streams ofresearch into the definition of knowledge are that knowledge is part of a value chain, and thatknowledge is information stored in the mind of individuals. Some common definitions of knowledgefrom value chain researchers are: integrated information in context (Galup et al. 2002), a productionmade from raw material – information (Dretske 1999), the power to act and make decisions (Kantner1999), meaningfully organized accumulation of information (Zack 1999), professional expertiseappropriate for the domain (Bourdreau 1999), things that are held to be true and drive people toaction (Bourdreau 1999), justified personal belief that increases an individual’s capacity to takeeffective action (Alavi 1999), information made actionable in a way that adds value to the enterprise(Vail 1999), information valuable for an organization (Greenwood 1998), new insight or predictiveunderstanding (Kock and McQueen 1998), information in context, together with an understandingof how to use it (Davenport and Prussak, 1998), information that has been authenticated and thoughtto be true (Vance 1997), selected useful information for a job (Knapp 1997), information madeactionable (Mahlitta 1996), and contained in instructions, know-how (Ackoff 1996),
The second school of research about knowledge defines knowledge as a property of thehuman mind. Among others, Tuomi (1999) and Fahey and Prusak (1998) argue that knowledge doesnot exist outside of the human mind, and it is shaped by the individual’s needs and current stock ofknowledge.
One impact of these definitional differences occurs when discussing knowledgetransformations. It is common to consider knowledge as arranged in a Knowledge Hierarchy, wheredata is transformed into information, and information is transposed into knowledge. For example,how do we classify an expert system? From a value chain perspective, the expert system containsknowledge. From the perspective that knowledge is contained only in the human mind, the expertsystem is classified as information and the human input to the expert system would be classified asknowledge.
To further examine these problems, we will now examine the use of these definitions inknowledge transformations. We will then provide a new definitional scheme for knowledge anddiscuss knowledge transformations. We will conclude with some directions for further research.
THE KNOWLEDGE HIERARCHY
The most common paradigm in the KM literature is of a Knowledge Hierarchy (Nissen etal. 2000, Davenport and Prusak 1998), as depicted in Figure 1. The Knowledge Hierarchy depictsthe conventional concept of knowledge transformations, where data is transformed into information,and information is transformed into knowledge.
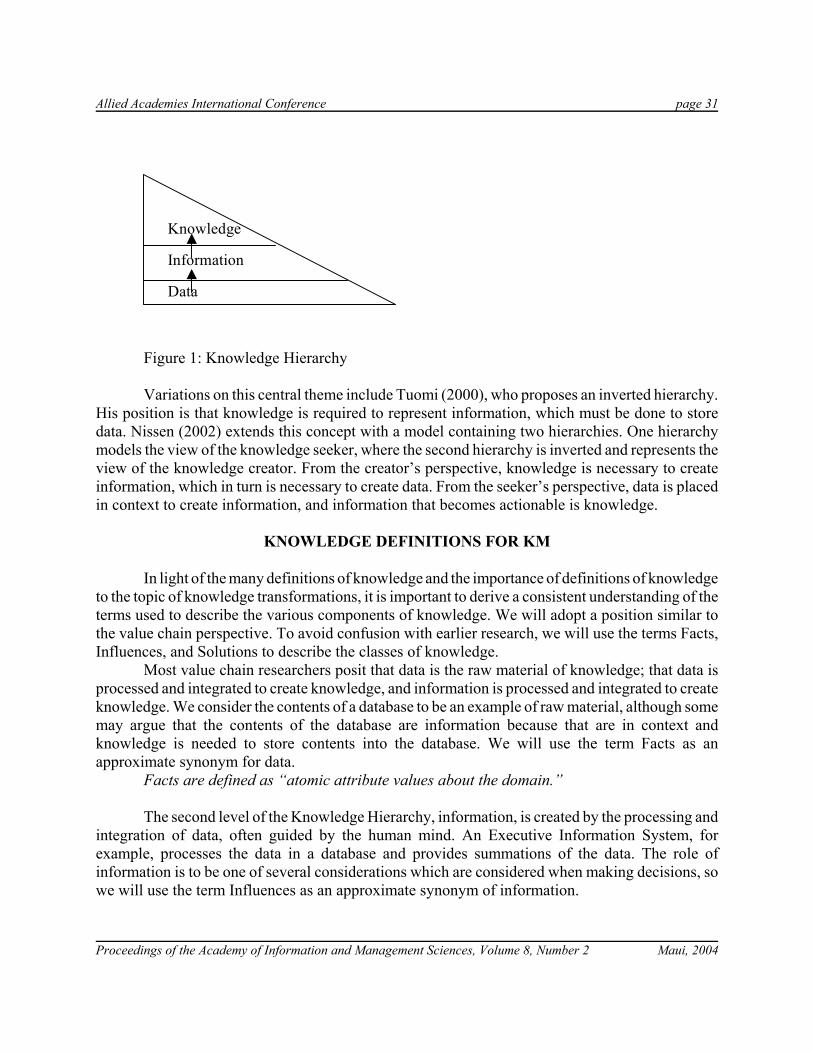
Allied Academies International Conference page 31
Proceedings of the Academy of Information and Management Sciences, Volume 8, Number 2 Maui, 2004
Knowledge
Information
Data
Figure 1: Knowledge Hierarchy
Variations on this central theme include Tuomi (2000), who proposes an inverted hierarchy.His position is that knowledge is required to represent information, which must be done to storedata. Nissen (2002) extends this concept with a model containing two hierarchies. One hierarchymodels the view of the knowledge seeker, where the second hierarchy is inverted and represents theview of the knowledge creator. From the creator’s perspective, knowledge is necessary to createinformation, which in turn is necessary to create data. From the seeker’s perspective, data is placedin context to create information, and information that becomes actionable is knowledge.
KNOWLEDGE DEFINITIONS FOR KM
In light of the many definitions of knowledge and the importance of definitions of knowledgeto the topic of knowledge transformations, it is important to derive a consistent understanding of theterms used to describe the various components of knowledge. We will adopt a position similar tothe value chain perspective. To avoid confusion with earlier research, we will use the terms Facts,Influences, and Solutions to describe the classes of knowledge.
Most value chain researchers posit that data is the raw material of knowledge; that data isprocessed and integrated to create knowledge, and information is processed and integrated to createknowledge. We consider the contents of a database to be an example of raw material, although somemay argue that the contents of the database are information because that are in context andknowledge is needed to store contents into the database. We will use the term Facts as anapproximate synonym for data.
Facts are defined as “atomic attribute values about the domain.”
The second level of the Knowledge Hierarchy, information, is created by the processing andintegration of data, often guided by the human mind. An Executive Information System, forexample, processes the data in a database and provides summations of the data. The role ofinformation is to be one of several considerations which are considered when making decisions, sowe will use the term Influences as an approximate synonym of information.

page 32 Allied Academies International Conference
Maui, 2004 Proceedings of the Academy of Information and Management Sciences, Volume 8, Number 2
Influences are defined as “data in context that has been processed and/or preparedfor presentation.” Many influences may impact upon a decision.
The final level of the knowledge hierarchy, knowledge, is considered to be created by theprocessing and integration of information and data. To distinguish information from knowledge,many of the value chain researcher’s definitions of knowledge reviewed earlier imply or explicitlystate that actionability is an attribute of knowledge. While Facts provide a foundation for thecreation of information and knowledge and Influences provide insight into a decision, knowledgeis seen as a complete solution.
Solutions are defined as “integrated, verified information and data in contextcombined with the ability to use the information.”
Now that we have derived definitions suitable for both tacit and explicit knowledge, let usconsider the transformations of the various classes of knowledge.
KNOWLEDGE TRANSFORMATIONS
While the Knowledge Hierarchy is a well known paradigm in KM, other research indicatesflaws in the paradigm. Not all researchers are in agreement with the one way transformation fromdata to information to knowledge. For example, Tuomi (2000) argues for an inverted tacit hierarchy,where Spiegler (2000) argues for a double hierarchy for explicit systems.
The Knowledge Hierarchy dictates that data is transformed into information and informationis transformed into knowledge. We contend that this is not always an accurate or completedescription of the behavior of knowledge transformations. More specifically, data can betransformed directly into knowledge and knowledge in one domain is transformed into data whenused in another domain. Let us give three short examples.
Neural networks are trained by exposure to raw data. The neural network analyzes the dataand automatically converges on a solution, which can then be tested and deployed. In this example,data is transformed directly into knowledge.
An individual may possess all of the tacit knowledge necessary to solve a problem withouthaving any explicit knowledge. This knowledge could be extracted by a knowledge engineer andused to create an expert system. In this example, tacit knowledge was transformed directly intoexplicit knowledge without any intermediate information stages.
In addition, knowledge in one domain is transformed to data when used in another context.For example, if Shell’s Best Practices knowledge contains solutions for every location of a Shelldrill, that knowledge could be used as data to create a listing of all Shell drilling locations.
Graphically, we can represent the transformations possible in the Value Chain KnowledgeHierarchy in a hierarchy, as shown in Figure 2.
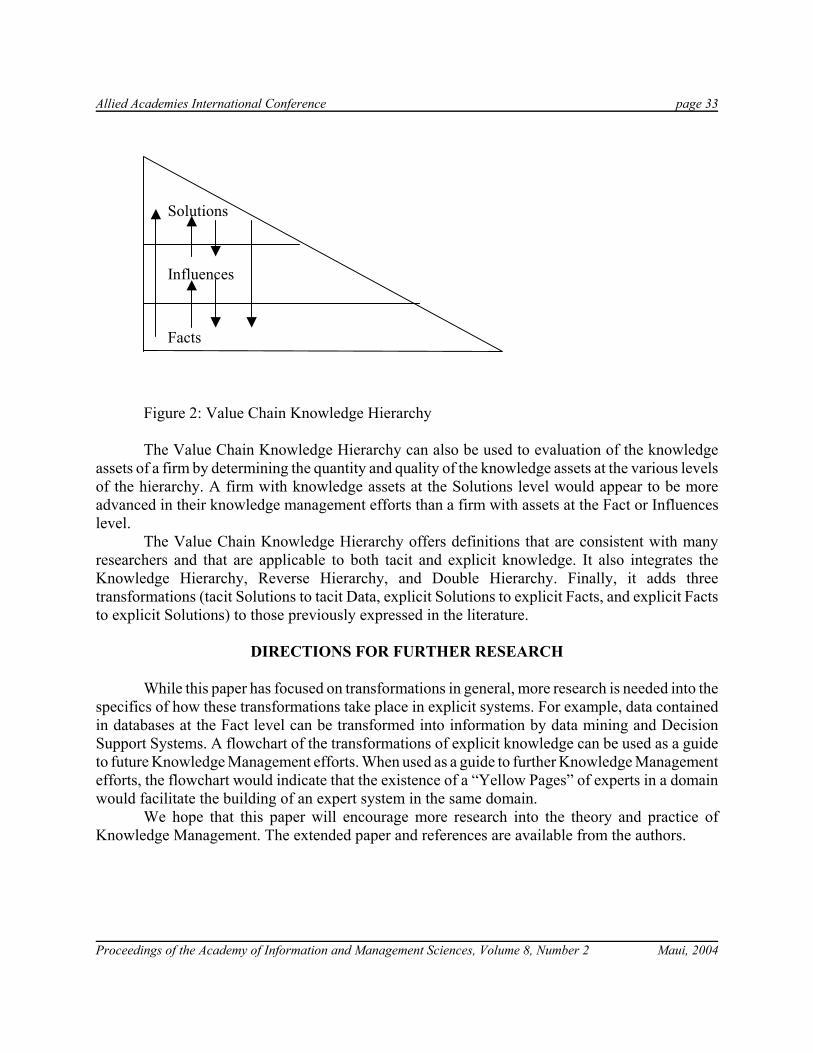
Allied Academies International Conference page 33
Proceedings of the Academy of Information and Management Sciences, Volume 8, Number 2 Maui, 2004
Solutions
Influences
Facts
Figure 2: Value Chain Knowledge Hierarchy
The Value Chain Knowledge Hierarchy can also be used to evaluation of the knowledgeassets of a firm by determining the quantity and quality of the knowledge assets at the various levelsof the hierarchy. A firm with knowledge assets at the Solutions level would appear to be moreadvanced in their knowledge management efforts than a firm with assets at the Fact or Influenceslevel.
The Value Chain Knowledge Hierarchy offers definitions that are consistent with manyresearchers and that are applicable to both tacit and explicit knowledge. It also integrates theKnowledge Hierarchy, Reverse Hierarchy, and Double Hierarchy. Finally, it adds threetransformations (tacit Solutions to tacit Data, explicit Solutions to explicit Facts, and explicit Factsto explicit Solutions) to those previously expressed in the literature.
DIRECTIONS FOR FURTHER RESEARCH
While this paper has focused on transformations in general, more research is needed into thespecifics of how these transformations take place in explicit systems. For example, data containedin databases at the Fact level can be transformed into information by data mining and DecisionSupport Systems. A flowchart of the transformations of explicit knowledge can be used as a guideto future Knowledge Management efforts. When used as a guide to further Knowledge Managementefforts, the flowchart would indicate that the existence of a “Yellow Pages” of experts in a domainwould facilitate the building of an expert system in the same domain.
We hope that this paper will encourage more research into the theory and practice ofKnowledge Management. The extended paper and references are available from the authors.

page 34 Allied Academies International Conference
Maui, 2004 Proceedings of the Academy of Information and Management Sciences, Volume 8, Number 2
Allied Academies International Conference page 35
Proceedings of the Academy of Information and Management Sciences, Volume 8, Number 2 Maui, 2004
A DECISION SUPPORT SYSTEM MODEL FORFORECASTING IN INVENTORY MANAGEMENTUSING PROBABILISTIC MULTIDIMENSIONAL
DATA MODEL (PMDDM)
Bhaskara Reddy Moole, Walden [email protected]
Raghu Babu Korrapati, Walden [email protected]
ABSTRACT
Decision-making in today’s business world requires extensive use of huge volumes of data.Real world data contain uncertainty and change over time. There is a need to have access todecision support systems that efficiently handle voluminous data, uncertainty, and modifications touncertain data. An algorithm using mathematical concept based on set theory, probability axioms,and the Bayesian framework, as well as algebra to manipulate data and a framework to modify data,are developed and a decision support system (DSS) model for business area of InventoryManagement is presented. The DSS model is in continuous process improvement and it has madesignificant progress over prior models.
INTRODUCTION
Businesses today are recording volumes of data reaching terabytes in size. Millions oftransactions among retail chains, utility companies, banks, and insurance companies take place eachday. Representative financial transactions of the International Technology Group (ITG) reportindicate that a telecommunications company receives over 80 million transactions a month, orapproximately 2.6 million transactions per day (ITG, 2000). It would be humanly impossible tointerpret these transactions to find, for example, which class of customers makes more long distancecalls. Similarly, a representative retail chain with 63 supermarkets selling 19,000 products canrecord a staggering 3.6 million transactions per day (SUN-Microsystems, 1999). Even a smallpercentage of waste or fraud will result in a loss of millions of dollars and, consequently, higherprices to customers. At same time, manual inspection of these data is not possible, as they areimprecise and change continuously.
Decision Support Systems (DSS) are used to support managerial decisions. Usually DSSinvolves analyzing many units of data in heuristic fashion (Inmon, 1990). To make optimal decisionsusing large volumes of data, managers of large enterprises need decision support systems thatinterpret huge volumes of uncertain data as well as handle data modifications. For example, amanager assigned to maintaining inventory for a given product category finds that demand forproducts changes continuously based on variables such as popularity, price, discount, advertising,and competition. Many of these variables cannot be measured precisely. In addition, these variables
page 36 Allied Academies International Conference
Maui, 2004 Proceedings of the Academy of Information and Management Sciences, Volume 8, Number 2
by themselves do not identify required quantities of a product precisely, although historicalinformation gathered weekly may be used to forecast demand.
Any forecast is subject to uncertainty; however, a database storing weekly forecasts may begenerated and compared to actual sales data after the fact. When this process is appliedcontinuously, the result is a dynamic database accumulating uncertain data. Once such a databaseis generated, managers may use On Line Analytical Processing (OLAP) and data mining techniquesto make better decisions. Researchers have proposed several data models based on multipledimensions, referred to as multidimensional data models. Most of them are based on a conceptcalled data cube. Data cubes are primary data structures in OLAP and Data Warehousing (DW)products. Thomas and Datta (2001) proposed one such conceptual multidimensional data model.Advantages of this model include its theoretical framework and associated algebra, which isrelationally complete, consistent, and closed. Moole (2003) proposed several enhancements to thismodel. This enhanced model is referred to as Probabilistic Multidimensional Data Model(PMDDM), with its most important enhancement being the addition of a framework based onprobability theory to handle uncertainty—an important category of OLAP functionality requirements(Moole, 2003). Other enhancements include uncertainty-related algebraic operations. The model didnot provide much required data modification framework or any analysis of its efficiencies. Thisrepresented an important area for further research on PMDDM (Moole, 2003).
The purpose of this study is to develop an application for decision support system usingprobabilistic multidimensional data model of Moole (2003) in the area of business in InventoryManagement.
APPLICATION OF MODEL IN BUSINESS MANAGEMENT
In this section, a business management application is used to describe the PMDDMmathematical model. It is described with details similar to general market conditions. Thisapplication is for a grocery retail chain, which has several retail stores throughout the nation.General grocery store inventory management is done by category, referred to as categorymanagement. Category management involves dividing an entire store inventory into differentcategories such as fresh foods, soft drinks, cereals, and snacks. The rationale behind this is thatconsumers are more interested in a category of groceries than in a particular brand name product.For example, consider a consumer shopping for a party. One may be more interested in buying softdrinks than in Coke, Pepsi, or any other brand name product in particular. A primary advantage ofthis method of inventory management is that it does not require forecasting based on individualproducts within the category, therefore eliminating the requirement to capture and process data forindividual products. Categorization of inventory simplifies data collection, storage, and analysis, anddemand forecasting (Mantrala & Raman, 1999; Symbol, 2004). However, this simplification alsoresults in loss of forecast accuracy and prevents inclusion of product specific promotion andcompetition information in forecasting process.
The most common process for inventory management, according to Symbol (2004) is asfollows: The reordering process in use today relies entirely on human estimations. Using a handheldmobile computer with integrated bar code scanner, the department or night crew manager walks thestore isles scanning bar code labels on shelves or products. Most systems enter an order for a single
Allied Academies International Conference page 37
Proceedings of the Academy of Information and Management Sciences, Volume 8, Number 2 Maui, 2004
case of each item scanned unless a larger order quantity is manually entered. When all neededproducts have been ordered, the mobile computer is connected to a phone line and the order is sentto the store's distribution center. The entire process can take 3-4 hours if done correctly. Normally,orders completed and sent to the distribution center by nine o'clock in the morning arrive at the storeby seven o'clock in the evening so the night crew can restock the shelves.
This method of reordering heavily relies on the experience and educated guess of a singleperson. It could lead to inaccurate demand forecasts resulting in either overstocks or out-of-stocks(OOS). Overstocking costs money in terms of capital investment and shelf space. OOSs result indissatisfied customers, leading them to competitors. Demand is dependent on several parameterssuch as category, price, promotion, competition, historic sales, new products, and even weather.Different demand forecast methods use different sets of these parameters in forecasting. Researchersfound that forecast based on even primitive analysis of historical data (e.g. forecast based on averagefor previous week), is generally better than a pure guess (Foote & Krishnamurthi, 2001; Lancaster& Lomas, 1986; Symbol, 2004). Thus, ability to store and analyze historical sales data is a criticalcomponent of all these forecasting methods.
In this situation, a decision support system for inventory management, which can store andanalyze large amounts of data will be useful. Due to this capability to store large amounts of data,historical sales data for each individual product can be maintained. This facilitates data analysis anddemand forecast by product instead of category. The actual category inventory itself simply becomesan aggregation of individual product inventory. Forecasting by individual product also facilitatesincorporation of product specific promotion information. For example, if a super bowl promotionadvertisement for Diet Coke is running, it is possible to use this information in forecasting sales forDiet Coke. Even though overall soft drinks category sales may not increase, it can be assumed thatDiet Coke sales will be higher due to the promotion. This information can be used also to adjust thesales forecast for other products in the soft drinks category (Lancaster & Lomas, 1986).
FORECAST METHOD
The forecast method used for this business application uses historical data, productpromotion data, and competition data. For the purpose of this application, forecast for demand isconsidered forecast for sales, and these two phrases are used interchangeably. The forecast methodutilizes heuristic rules specified below to forecast demand for each product in the category for thenext day.
Average sales for the previous week (seven days): Demand is directly proportional toaverage sales M.
Promotion data for the previous week: Promotional factor, P, multiplies M. P is derived byincorporating total number of promotions.
Competition data (from other retailers in area as reported by agents) for the previous week:Competition, C, decreases sales.
Category sales forecast information: Final category demand, Tf, is equal to average categorydemand within the previous four weeks, Ta. This means, if tentative category demand, Tt (calculatedby aggregating individual product demand in that category), is different from Ta, then the individualproduct demand has to be adjusted to make Tt equal to Ta.
page 38 Allied Academies International Conference
Maui, 2004 Proceedings of the Academy of Information and Management Sciences, Volume 8, Number 2
To forecast demand using the above forecast method, the following information is needed:Sales data for the previous week for the category;Product promotion data for the previous week;Competitor sales information for the previous week, as reported by agents; andDaily category sales forecasts for the previous week.
Assume that this grocery retail store chain has 40 stores selling 19,000 products averaging87,000 transactions per day in each store. That is approximately 3.5 million transactions per day and97.5 million transactions every four weeks, throughout the chain. Assume sales data capturedcontains product, time, location, price, and amount. If 64 bytes are required to store each of theseattributes, the total amount of space required to store the data is 215 MB per day or 6 GB for fourweeks. Researchers and practitioners recommend storing data for at least 65 weeks (Foote &Krishnamurthi, 2001), which would require a capacity of about 100 GB to store sales data. Usingsimilar assumptions and requirements for promotion data and competition data, this fictitious retailchain would require about 605 MB per day or 18 GB to store data for 4 weeks or 300 GB to storedata for 65 weeks. Due to the large size of these data, only a tiny sample of them will be used todemonstrate usefulness of the PMDDM model.
SALES DATA MODEL
The sales data cube (Multidimentional Data Set) CSales is defined as:The characteristic set C = {TIME, PRODUCT, LOCATION, SALES, BELIEF}, (m = 5)The attribute set A = {day, month, year, product_name, city, state, price, quantity, pS}, (t = 9)schema of C:ƒ(TIME) = {day, month, year}ƒ(PRODUCT) = {product_name}ƒ(LOCATION) = {city, state}ƒ(SALES) = {price, quantity}ƒ(BELIEF) = {pS}dimension function d:d (TIME) = 1 i.e., TIME is a dimensiond (PRODUCT) = 1 i.e., PRODUCT is a dimensiond (LOCATION) = 1 i.e., LOCATION is a dimensiond (SALES) = 0 i.e., SALES is a measured (BELIEF) = 0 i.e., BELIEF is a measure
A partial order on the Sales cube is as follows:OTIME = {⟨day, month⟩, ⟨day, year⟩, ⟨month, year⟩}OPRODUCT = {}OLOCATION = {⟨city, state⟩}OSALES = {}OBELIEF = {}
Allied Academies International Conference page 39
Proceedings of the Academy of Information and Management Sciences, Volume 8, Number 2 Maui, 2004
L is as follows:Let us assume the following domains for the attributesA = {year, month, day, product_name, city, state, price, quantity, pS}dom year = {2004, 2003, 2002, 2001}dom product_name = {DIET PEPSI, PEPSI, COKE}dom city = {Boston, New York, Dallas, San Francisco, Chicago}dom state = {MA, NY, TX, CA, IL}dom price = {0, 1, 2, …}dom quantity = {0, 1, 2, …}pS = 1 (Belief strength of all the cells represented is true, making this a deterministic cube)
Sales data for the last 7 days for DIET PEPSI is specified as follows.CSales = {⟨⟨2004,01,01, DIET PEPSI, Boston, MA⟩, ⟨100, 10⟩⟩,⟨⟨2004,01,02, DIET PEPSI, Boston, MA⟩, ⟨125, 10⟩⟩,⟨⟨2004,01,05, DIET PEPSI, Boston, MA⟩, ⟨160, 20⟩⟩,⟨⟨2004,01,06, DIET PEPSI, Boston, MA⟩, ⟨130, 15⟩⟩,⟨⟨2004,01,07, DIET PEPSI, Boston, MA⟩, ⟨180, 30⟩⟩,⟨⟨2004,01,01, DIET PEPSI, New York, NY⟩, ⟨105, 10⟩⟩,⟨⟨2004,01,03, DIET PEPSI, New York, NY⟩, ⟨105, 20⟩⟩,⟨⟨2004,01,04, DIET PEPSI, New York, NY⟩, ⟨140, 5⟩⟩,⟨⟨2004,01,01, DIET PEPSI, Chicago, IL⟩, ⟨200, 10⟩⟩,⟨⟨2004,01,02, DIET PEPSI, Chicago, IL⟩, ⟨105, 10⟩⟩,⟨⟨2004,01,03, DIET PEPSI, Chicago, IL⟩, ⟨110, 25⟩⟩,
This model can capture real world business data more accurately and queries can beformulated with uncertainity measures. Validation of this model with real world data is in progress.We believe Decision Support Systems based on this model will improve forecasting accuracy inInventory Management area of business application.
CONCLUSIONS AND FURTHER RESEARCH
This study focuses on developing a decision support system model in the area of inventorymanagement that can efficiently handle huge volumes of data containing uncertainty and is subjectto frequent changes. A mathematical concept based on set theory, probability axioms, and theBayesian framework, as well as algebra to manipulate data and a framework to modify data, arepresented. The proposed model can be used to build a decision support system to improve businessdecision-making that may improve business performance with potential savings to customers. Thealgorithm in which this application built is in continuous process improvement and it has madesignificant progress over prior models.
page 40 Allied Academies International Conference
Maui, 2004 Proceedings of the Academy of Information and Management Sciences, Volume 8, Number 2
REFERENCES
Foote, P. S., & Krishnamurthi, M. (2001). Forecasting using data warehousing model: Wal- Mart's experience. TheJournal of Business Forecasting Methods & Systems, 20(3), 13-17.
Inmon, W. H. (1990). Using Oracle to Build Decision Support Systems: QED Press.
ITG. (2000). Strategies for E-Financials: Competitive Impact of Financial Systems in e-Business [Web Site].International Technology Group, 885 North San Antonio Road, Suite C, Los Altos, California 94022-1305.Retrieved July 19, 2003, 2003, from the World Wide Web: http:/ /www-1.ibm.com/servers/eserver/zseries/library/whitepapers/pdf/gf225164.pdf
Lancaster, G., & Lomas, R. (1986). A Managerial Guide to Forecasting. International Journal of Physical Distribution& Materials Management, 16(6), 1-37.
Mantrala, M. K., & Raman, K. (1999). Demand uncertainty and supplier's returns policies for a multi-store style-goodretailer. European Journal of Operational Research, 115(2), 270- 275.
Moole, B. R. (2003, April 04-06). A Probabilistic Multidimensional Data Model and Algebra for OLAP in DecisionSupport Systems. Proceedings of the IEEE SoutheastCon'03, Ocho Rios, Jamaica.
SUN-Microsystems. (1999). Sun Enterprise 1000 Scores Big in Informix Red Brick Performance Test for the RetailEnterprise [Web Site]. Sun Microsystems. Retrieved July 19, 2003, 2003, from the World Wide Web:http://www.sun.com/smi/Press/sunflash/9908/sunflash.990809.3.html
Symbol. (2004). Computer Automated Ordering Provides Faster, More Accurate Replenishment: Executive Summary[Web Site]. http://www.symbol.com. Retrieved March 11, 2004, 2004, from the World Wide Web:http://www.symbol.com/solutions/retail/food_drug_whtppr_cao.html
Thomas, H., & Datta, A. (2001). A Conceptual Model and Algebra for On-Line Analytical Processing in DecisionSupport Databases. Information Systems Research, 12(1), 83-102.
Allied Academies International Conference page 41
Proceedings of the Academy of Information and Management Sciences, Volume 8, Number 2 Maui, 2004
CONTRASTING WEB-CENTRIC AND PEER-TO-PEERARCHITECTURES FOR CONSUMER-TO-CONSUMER
E-COMMERCE
James Otto, Towson [email protected]
William Wagner, Villanova [email protected] Pant, Ixos Corporation
ABSTRACT
An exciting area of growth in the world of E-Commerce has been the rapid rise of the Peer-to-Peer (P2P) architecture. While popular, as witnessed by the widespread use of file sharingprograms such as KaZaA and Morpheus, this architecture has not yet been fully leveraged into aprofitable business model. This paper presents a framework that a P2P architecture with thetraditional Web-centric architecture for Consumer-to-Consumer (C2C) e-commerce transactions.
KEYWORDS:Consumer-to-consumerE-businessPeer-to-peerArchitectureE-commerceFile-sharing
INTRODUCTION
This paper analyzes the tradeoffs between a distributed peer-to-peer (P2P) architecture anda web-centric architecture (the dominant e-commerce architecture) for consumer-to-consumer (C2C)online market makers. The analysis is used to compare the relative utility of both P2P and Web-centric architectures to support C2C transactions from information usefulness perspectives.
The analysis of architecture and its fit to business processes is important because thealignment of architecture with user processes is relevant to the success of organizational goals(Carleton, 2002; Eisenmann 2002). Since C2C mercantile interactions are fundamentally thetransfer of information, goods and services, and payments between consumer peers, it makes sensethat P2P based information architectures be considered for C2C interactions and business models.
A good example of this type of C2C market is the traditional newspaper classified consumeradvertisements for well understood products such as cars or appliances. The classified section ofthe newspaper provides a forum for catalog information for sellers for a fee. This same type of
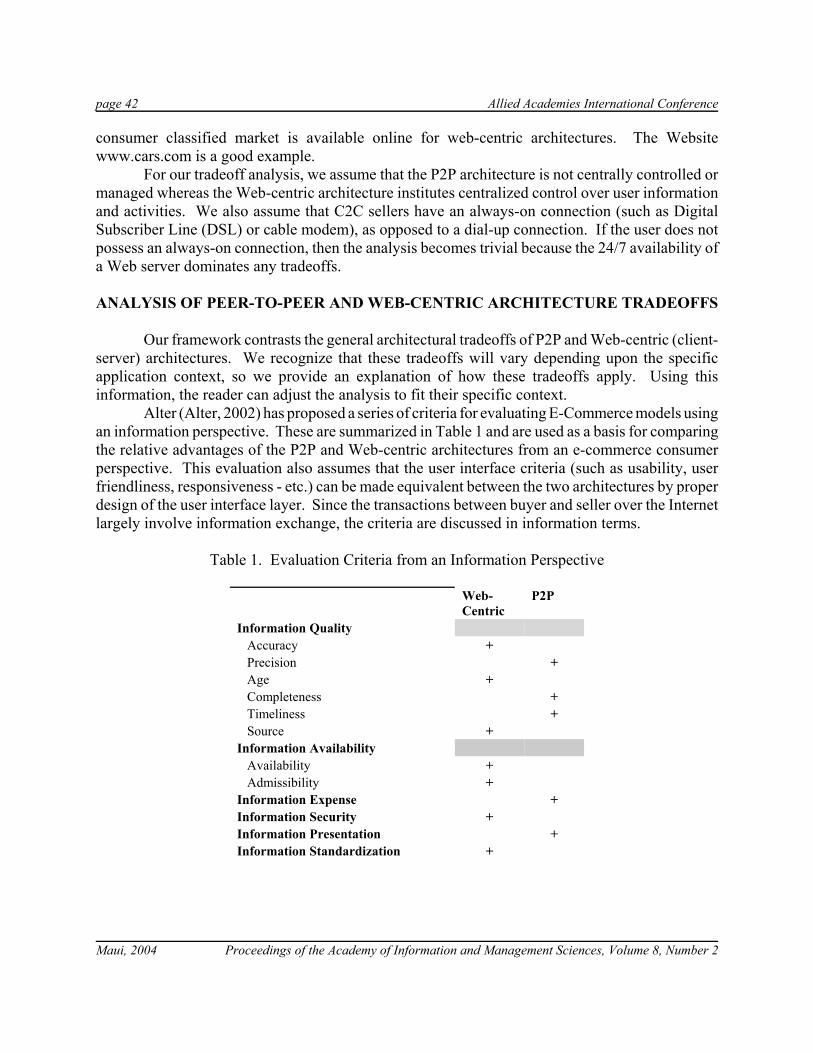
page 42 Allied Academies International Conference
Maui, 2004 Proceedings of the Academy of Information and Management Sciences, Volume 8, Number 2
consumer classified market is available online for web-centric architectures. The Websitewww.cars.com is a good example.
For our tradeoff analysis, we assume that the P2P architecture is not centrally controlled ormanaged whereas the Web-centric architecture institutes centralized control over user informationand activities. We also assume that C2C sellers have an always-on connection (such as DigitalSubscriber Line (DSL) or cable modem), as opposed to a dial-up connection. If the user does notpossess an always-on connection, then the analysis becomes trivial because the 24/7 availability ofa Web server dominates any tradeoffs.
ANALYSIS OF PEER-TO-PEER AND WEB-CENTRIC ARCHITECTURE TRADEOFFS
Our framework contrasts the general architectural tradeoffs of P2P and Web-centric (client-server) architectures. We recognize that these tradeoffs will vary depending upon the specificapplication context, so we provide an explanation of how these tradeoffs apply. Using thisinformation, the reader can adjust the analysis to fit their specific context.
Alter (Alter, 2002) has proposed a series of criteria for evaluating E-Commerce models usingan information perspective. These are summarized in Table 1 and are used as a basis for comparingthe relative advantages of the P2P and Web-centric architectures from an e-commerce consumerperspective. This evaluation also assumes that the user interface criteria (such as usability, userfriendliness, responsiveness - etc.) can be made equivalent between the two architectures by properdesign of the user interface layer. Since the transactions between buyer and seller over the Internetlargely involve information exchange, the criteria are discussed in information terms.
Table 1. Evaluation Criteria from an Information Perspective
Web-Centric
P2P
Information Quality Accuracy + Precision + Age + Completeness + Timeliness + Source +Information Availability Availability + Admissibility +Information Expense +Information Security +Information Presentation +Information Standardization +
Allied Academies International Conference page 43
Proceedings of the Academy of Information and Management Sciences, Volume 8, Number 2 Maui, 2004
Information Accuracy: This criterion measures how well the information represents whatit is supposed to represent. In centralized systems, a single master copy of the data can bemaintained and enforced. Any replication is performed explicitly (usually for backup purposes), sothere is little chance that alternate inconsistent files exist. In a distributed P2P system, the same filecan exist in several different places. For example, P2P users can download a product informationfile from the originator. If that downloaded file is modified, then two different files will exist thatpurportedly refer to the same product – which can breed inconsistencies and errors (Seltzer, 2002;Killdara Corp, 2001). Thus for this measure, the Web-centric architecture has the advantage.Additionally, because information is centrally monitored and controlled in a Web-centric system,inaccurate data can be removed from the system. In a truly distributed system, no such enforcementmechanism exists.
Information Precision: This measure addresses how well the information detail meets userrequirements. In a Web-centric architecture that is centrally controlled, the user is restricted tosupplying information in the format prescribed by the management authority. This may not allowfor the level of information precision desired by the users. For example, a user may wish to providea high resolution image of a product that exceeds the allowed web server file size. On the otherhand, a distributed P2P system allows any desired data to be presented by the user, from videos ofthe product to detailed images with narration. The buyer and seller select the amount of information,along with the associated bandwidth and storage requirements, that best meet their transaction needs.Thus for this measure, the distributed P2P architecture has a relative advantage over the centralizedweb architecture.
Information Age: This criterion concerns how old the information is relative to therequirements of the task. In a Web-centric system, information can be controlled and removed fromthe system by centralized management when it expires (such as when the client sells the product).In a distributed P2P system, the architecture places that responsibility on each user. If users do notremove information from the network, then old, irrelevant information may still be available tousers. Thus, the Web-centric architecture has an advantage for this measure.
Information Completeness: This criterion addresses how adequate the amount ofinformation is for the task at hand. The Web-centric architecture, which is centrally managed, canlimit the amount and format of information provided by the seller or buyer. The P2P architectureonly limits information to that which can be handled by the bandwidth, storage, and formatconstraints of the buyers and sellers. Thus, the P2P architecture can provide better informationcompleteness due to its scalability (Smaros & Framling, 2001). As an example, the amount ofinformation stored and available to users of KaZaA, a popular P2P application is huge. Forexample, at 8pm on 16 March, 2004 the following statistics applied to Kazaa:
Over 2.5 million users onlineOver 1.4 billion filesOver 4 petabytes (4 million gigabytes) of informationInformation formats included audio, video, images, documents, software, and music playlists
Information Timeliness: This measures whether the information is provided quickly enoughto meet user needs. In the P2P architecture, the information is available immediately (Merkow,
page 44 Allied Academies International Conference
Maui, 2004 Proceedings of the Academy of Information and Management Sciences, Volume 8, Number 2
2000) as soon as the user moves the files into the shared folder. For the Web-centric system, theuser must explicitly communicate information to the administrators (Smaros & Framling, 2001) andmay need to wait until the user and/or information is approved for posting, which may reduce thetimeliness of the data. Therefore, the P2P architecture has an advantage for information timeliness.
Information Source: This measure addresses the credentials of the supplier of theinformation. Is the source credible, trustworthy, and free from bias? Web-centric systems, withtheir centralized control, can institute trust mechanisms to verify system users. For example, Ebayprovides various utilities for providing feedback on sellers and also for filing more formalcomplaints. These same types of verification methods are not as robust in a distributed P2P system.Thus, the Web-centric architecture has an advantage for this measure.
Information Availability: This measure addresses the extent to which the necessaryinformation is available to the people that need it when it is required. In practical e-commerceterms, it is expected that data will be available 24 hours per day, 7 days per week (24/7). Web-centric systems can explicitly manage the replication of data and system redundancies to cope witha failure or error. In a P2P system, redundancy can, but does not necessarily, occur. For examplefiles may be copied by prospective buyers, but this may not necessarily happen. Thus, if the file iscopied by many users, it is possible that redundancy could be quite good (at the possible expenseof information consistency). However, since there is no centralized management, replication of filesis not explicitly required. Thus, it is also possible that redundant files may not exist in a P2P system.In a centrally controlled system, redundancy can be enforced. Additionally, 24/7 availabilityrequires that the information source be continuously operating. A centralized web server has peoplededicated to keeping the web server operating. This level of reliability may not be available to youraverage P2P user (Note that this analysis assumes that the P2P users have an always-on internetconnection). For these reasons, the Web-centric approach has an advantage over P2P when it comesto information availability.
Information Admissibility: This criterion focuses on whether the information provided issocially, culturally, or legally appropriate. In a Web-centric system, management can removeobjectionable information, whereas this does not occur in a distributed P2P system. For example,Ebay management removed items by individuals attempting to sell debris from the Space Shuttleaccident. This problem with P2P has also been heightened by the wide press coverage of P2P sitessuch as Napster, that may be involved in intellectual property thefts (Carleton, 2002). Thus, theWeb-centric system has an advantage for this criterion (unless the seller or buyer are specificallyinterested in exchanging inappropriate information).
Information Expense: This measure deals with the cost of executing transactions. In theP2P architecture, client software interacts directly with other client software. The expensesassociated with data storage and bandwidth are borne by the client. With a Web-centric architecture,these expenses are borne by the manager of the Website. It is assumed that these bandwidth andstorage costs, plus any profit, are then passed on to the users as fees (Smaros & Framling, 2001).If one assumes that a significant portion of user bandwidth and storage stands unused and idle, thenthe marginal costs of adding the P2P functionality will be small. Thus, from a user perspective theP2P architecture has an advantage.
Information Security: This measure addresses the level of protection against unauthorizedinformation access or alteration. Centrally managed security can be more attentive and sophisticated
Allied Academies International Conference page 45
Proceedings of the Academy of Information and Management Sciences, Volume 8, Number 2 Maui, 2004
than security that relies on each user. It is well recognized that security is the Achilles heel of P2Papplications because of the average user’s limited awareness of security issues (Kalakota, Susarla,& Parameswaran, 2001). The Web-centric approach has an advantage over P2P which has moreplaces where security can be breached (Killdara Corp, 2001).
Information Presentation: This measure addresses how the information is presented andhow appropriate it is for the desired application. Since P2P allows users to provide information inany format desired (Framling & Holstrom, 2000), it has an advantage of the centrally controlledWeb-centric architecture.
Information Standardization: This criterion measures how consistent information is acrosssimilar files. Standardization can help users because it supports a consistent view of informationand easier information exchange. Since the Web-centric architecture supports the centralizedmanagement of standardization and can also provide translation services between differentinformation formats (Smaros & Framling, 2001), it has an advantage over the P2P architecture.
If one examines the relative advantages and disadvantages of Web-centric and P2Parchitectures in Table 1, it is evident that the architectures have different strengths and weaknesses.Given this, it may make sense to consider a hybrid architecture that can take advantage of therelative strengths of both architectures. This may be a fertile area for future research.
SUMMARY AND CONCLUSIONS
This paper has examined the relative advantages and disadvantages of the P2P and Web-Centric architectures for C2C transactions. Based on this analysis, it is suggested that a hybrid Web-centric and P2P architecture might be a good approach to providing C2C services.
REFERENCES
Alter, S. (2002). Information Systems: The Foundation of E-Business. Prentice Hall: Upper Saddle River, NJ.
Carleton, J. (2002, May). Fast growth forecast for enterprise P2P. Tech Update. Retrieved August 17, 2004, fromhttp://techupdate.zdnet.com/techupdate/stories/main/0,14179,2863979,00.html
Eisenmann, T. (2002). Internet Business Models: Text and Cases, McGraw-Hill: New York, NY.
Framling, K. & J. Holmstrom (2000). A distributed software for collaborative sales forecasting. Second Conferenceon Management and Control of Production and Logistics, July 2000.
Kalakota, R. & A. Whinston (1996). Electronic Commerce-A Managers Guide. Addison-Wesley: Reading, MA.
Kazaa (2004). Statistics accessed from Kazaa peer-to-peer network on August 16, 2004 using the Kazaa client P2Psoftware.
Killdara Corporation (2001). Peer-to-peer: Good, bad and in-between. Retrieved August 11, 2003, fromhttp://www.killdara.com/whitepapers.htm
Merkow, M. (2000, October). What can P2P do for B2B. Insights – EC Outlook. Retrieved Aug 17, 2004 fromhttp://ecommerce.internet.com/news/insights/outlook/article/0,,10535_486031,00.html

page 46 Allied Academies International Conference
Maui, 2004 Proceedings of the Academy of Information and Management Sciences, Volume 8, Number 2
Parameswaran, M., A. Susarla, & A. Whinston (2001). P2P networking: An information-sharing alternative. IEEEComputer, 34(7), 31-38.
Seltzer, L. (2002, January). Peer-to-peer: My favorite stupid fad of 2001. Retrieved August 15, 2004, fromhttp://techupdate.zdnet.com/techupdate/stories/main/0,14179,2837666,00.html
Smaros, J. & K. Framling (2001). Peer-to-peer information systems - an enabler of collaborative planning, forecastingand replenishment. Logistics Research Network 6th Annual Conference, Cardiff, September, 2001.
Allied Academies International Conference page 47
Proceedings of the Academy of Information and Management Sciences, Volume 8, Number 2 Maui, 2004
A STUDY TO EXAMINE FACTORS THATCONTRIBUTE SOFTWARE PROJECT SUCCESS
Kathleen O. Simmons, Walden [email protected]
Raghu Korrapati, Walden [email protected]
ABSTRACT
The purpose of this research is to examine the factors contributing to software projectsuccess as perceived by a select group of project managers and project stakeholders. Specifically,this research aims to investigate the parameters that contribute to software project success andcompare the findings to the Standish Group’s Report that identifies common causes of softwareproject success. A survey instrument is used to collect information on and document the perceptionsof selective project managers and project stakeholders. The conclusions are documented and areasfor future research topics are identified.
INTRODUCTION
The practice of project management has evolved over the past 30+ years and so have theroles and responsibilities of the project manager (Kerzner, 2000). During the period of traditionalproject management, project managers were selected from the technical ranks and expected to havesignificant technical expertise (Kerzner, 2000). Project success was measured by the technical meritof the project with little or no concern for the needs of the business or its customers (Kerzner, 2000).As project management evolved, however, there was an increased focus on the behavioral aspectsof project management and the management skills of project managers (Kerzner, 2000; Kloppenborg& Opfer, 2002; Shenhar & Wideman, 2000). Modern project managers were expected to have basictechnical skills and significant business expertise. Rather than performing the work, they builtteams of subject matter experts that brought the skills needed to fulfill the project requirements(Kerzner, 2000).
Software project success has been a prevalent topic in industry publications and the subjectof study by research analysts over the past several years. In 1994, the Standish Group issued itsChaos Report. The Standish Group surveyed 365 IT executive managers from companies in differentindustries and of different sizes to derive a quantitative analysis of project resolution by type. Theyalso conducted a qualitative study using four focus groups. The purpose of the study was tounderstand the magnitude of software development project failures, the primary factors causingsoftware development failures, and what factors could increase the potential for project success (TheStandish Group International, 1995).
page 48 Allied Academies International Conference
Maui, 2004 Proceedings of the Academy of Information and Management Sciences, Volume 8, Number 2
LITERATURE REVIEW
The classic definition of project success was on time, within budget, and meeting qualityrequirements (Shenhar & Wideman, 2000; Whitten, 2000). The definition has been broadened toinclude customer acceptance as another dimension of successful projects (Kerzner, 2000; Shenhar& Wideman, 2000). Early project management emphasized the use of administrative skills such asplanning, organizing, executing, and controlling over other management skills as the way to ensureproject success (Frame, 1994; Kerzner, 2000). In a follow up to the Chaos Report, the StandishGroup published a research paper that was entitled Chaos: A Recipe for Success. While projectmanagement and the management skills of project managers were not mentioned in their originalreport, they were prominently cited in the current research. Project managers were described asbeing the “linch-pins” or glue that held all projects together (The Standish Group International,1999, p. 6).
Project management was once referred to as the accidental profession. Project managers didnot choose this job. Project managers were chosen from the technical and/or functional ranks(Kerzner, 2000). Today, project management is a recognized profession that is supported by a robustbody of knowledge, several professional organizations, and opportunities for advanced study. Thecredentials that speak to commitment to a professional choice are now available in projectmanagement, affording it both credibility and respect. As a management discipline, managementby projects has replaced traditional functional management structures as a new business modeladopted to help companies accomplish business objectives. As a profession, project managementhas gained prominence in the business world.
The proper use of project management tools and the application of the mechanics of projectmanagement were once thought to be the major factors contributing to software project success. Themanagement skills of project managers have replaced technical skills as the key contributors tosoftware project success.
METHODOLOGY
A descriptive survey was used to collect information on and document the data required forthe study. A descriptive survey is most commonly used when the researcher wants to study a currentday condition or phenomenon (Leedy & Ormrod, 2001). This is as opposed to a historical analysisthat seeks to understand events or conditions of the past (Leedy & Ormrod, 2001). The surveyconsisted of 43 statements. The statements were grouped into four categories. The four categorieswere Project Role, Organization Structure, Project Management Capabilities, and Project SuccessFactors. The survey participant was asked to choose one of six selections that best described theirfeeling or perception about the statement. The selections were “Strongly Agree”, “Agree”,“Neutral”, “Disagree”, “Strongly Disagree”, and “Does Not Apply”. The selections were mutuallyexclusive.
Allied Academies International Conference page 49
Proceedings of the Academy of Information and Management Sciences, Volume 8, Number 2 Maui, 2004
RESULTS
The data collected from the survey questionnaire was analyzed, summarized and thenpresented in the Survey Questionnaire Results. The results included a profile of who responded tothe survey by project role and what percentage each role type represented out of the total populationthat responded. Project success factors were ranked from the one most often chosen to the leastoften chosen overall. The percentage of time a certain success factor was chosen out of all of theresponses was also reported. Analyses of project success factors by project role, by organizationalstructure type, and by project management capabilities were reported on.
CONCLUSIONS AND FURTHER RESEARCH
This study was significant to the project management profession because it revealed currentperceptions of project managers and project stakeholders about what factors contributed to softwareproject success. Project management educators and trainers could benefit from the results of thisresearch by evaluating their offered project management educational programs and ensuring acurriculum that would train project managers in all of the skills needed to successfully deliverprojects. The Standish Group’s Chaos Report was commonly cited as a significant source forstatistics on and information about software project success. Project management, in general, andthe management skills of project managers specifically, were not among the factors identified in thereport as contributing to software project success. This study was intended to understand the currentperceptions from project managers and project stakeholders about what they believed were the mostimportant contributing factors. The results were analyzed and compared to the Chaos report.Conclusions were documented and areas for future research topics were identified.
REFERENCES
Frame, J. D. (1994). The New Project Management. San Francisco, CA: Jossey-Bass Inc.
Kerzner, H. (2000). Applied Project Management: Best Practices on Implementation. New York, NY: John Wiley &Sons, Inc.
Kloppenborg, T. J., & Opfer, W. A. (2002). The Current State of Project Management Research: Trends, Interpretations,and Predictions. Project Management Journal, 33(2), 5-18.
Leedy, P. D., & Ormrod, J. E. (2001). Practical Research: Planning and Design (Seventh ed.). Upper Saddle River, NJ:Prentice-Hall, Inc.
Shenhar, A. J., & Wideman, R. M. (2000) Optimizing Success by matching Management Style to Project Type [WebPage]. URL http://www.maxwideman.com/papers/success/intro.htm [2003, January 15].
The Standish Group International, I. (1995) The Chaos Report (1994) [Web Page]. URLh t t p : / / w w w . p m 2 g o . c o m / s a m p l e _ r e s e a r c h / c h a o s _ 1 9 9 4 _ 1 . p h p ,h t t p : / / w w w . p m 2 g o . c o m / s a m p l e _ r e s e a r c h / c h a o s _ 1 9 9 4 _ 2 . p h p ,h t t p : / / w w w . p m 2 g o . c o m / s a m p l e _ r e s e a r c h / c h a o s _ 1 9 9 4 _ 3 . p h p ,http://www.pm2go.com/sample_research/chaos_1994_4.php [2002, October 21].

page 50 Allied Academies International Conference
Maui, 2004 Proceedings of the Academy of Information and Management Sciences, Volume 8, Number 2
The Standish Group International, I. (1999) Chaos: A Recipe for Success [Web Page]. URLhttp://www.standishgroup.com/sample_research/index.php [2003, January 15].
Whitten, N. (2000). How Technical Must a Project Manager Be? Newton Square, PA: Project Management Institute,Inc.
Allied Academies International Conference page 51
Proceedings of the Academy of Information and Management Sciences, Volume 8, Number 2 Maui, 2004
DRIVERS OF TURNOVER DECISIONS OFINFORMATION SYSTEMS PERSONNEL:
JOB SATISFACTION VERSUS JOB FIT WITHQUALITY OF LIFE GOALS
David S. Taylor, Sam Houston State [email protected]
Wynne W. Chin, University of [email protected]
ABSTRACT
Over 12,000 academic and practitioner studies have been performed relating job satisfactionwith voluntary turnover. However, researchers have been frustrated in explaining more than 20percent of the variance in turnover. This paper presents the notion that traditional measures of jobsatisfaction may not fully capture the reason for staying or quitting. A new construct is presentedthat examines the congruence of fit between the job and the person’s quality of life goals. A studyis proposed that will utilize a sample of Information Systems personnel to be analyzed with PLSGraph structural equation modeling software. It is anticipated that the congruence of fit measureswill be a better predictor of various measures of the turnover decision (i.e., thoughts of quitting,expectation of quitting, and intention to quit) than is job satisfaction.
Key words – Quality of life goals, job satisfaction, voluntary turnover, PLS, structural equationmodeling, Information Systems personnel turnover.
INTRODUCTION
The prominent paradigm in the field of voluntary turnover research is that job satisfactionis related to the decision to leave an organization. The purpose of this study is to evaluate whetheror not job satisfaction is a broad enough measure of a person’s overall feelings about their job orwhether a new construct that measures the congruence of fit between the job and the person’s goalsfor quality of life would be a better predictor of turnover.
Understanding the turnover decision is a relevant topic regardless of where an organizationis in its business cycle. Even in times like the present when the number of Information Systems jobseekers exceeds the number of open positions in the U.S., practitioners are still concerned withattracting the right people and avoiding dysfunctional turnover. Dysfunctional turnover results whenthe organization loses the personnel that it can least afford to lose such as those with specific skillsand/or abilities. Additionally, a recent ComputerWorld job satisfaction survey of InformationSystems workers (ComputerWorld 12/8/2003), determined that 42 percent of IS employees weredissatisfied with their companies. Such a large amount of dissatisfaction potentially results inincreased turnover when the job market improves.
page 52 Allied Academies International Conference
Maui, 2004 Proceedings of the Academy of Information and Management Sciences, Volume 8, Number 2
LITERATURE REVIEW
Most studies of voluntary employee turnover trace the genesis of the field to the work ofMarch and Simon in 1958. March and Simon introduced the notion of voluntary turnover resultingfrom an employee’s perception of ease of movement and desirability of movement. During the lastfour decades, job satisfaction and employee turnover have become one of the most studied topicsin both academic and practitioner research with over 12,400 studies by 1991 (Hom, Griffeth &Sellaro, 1984; Lee, Mitchell, Holtom, McDaniel, & Hill, 1999).
A significant step forward was taken when Mobley (1977) introduced the notion thatturnover was actually a process. “The actual event of quitting is merely the final act following someseries of mechanisms that leads to an intent and decision to resign. Thus, the sequence and durationof these mechanisms become of particular interest for the study of turnover.” Mobley started theturnover process with job dissatisfaction being the catalyst. This catalyst then initiated thoughtsabout quitting and job searching, ultimately leading to an intention to quit and actually quitting.Until Mobley’s work, turnover theory and research had not advanced much beyond the generalframework of March and Simon (Muchinsky & Tuttle, 1979).
Extensive research has followed, refining and expanding Mobley’s model, but has still onlyresulted in explaining less than 20 percent of the variance in turnover. Observed correlationsbetween job dissatisfaction and turnover seldom exceed 0.40 (Hom, Griffeth, & Sellaro, 1984). Infact, in a meta-analysis of 47 studies, Carsten and Spector (1987) revealed a corrected correlationbetween job satisfaction and turnover of -0.26.
Job satisfaction is the extent to which an employee expresses a positive affective orientationtoward his or her job. It has been measured by previous researchers either on a global or facetedbasis. Tett and Meyer (1993) concluded from their meta-analysis of 155 studies “the assessmentof overall satisfaction is not unduly compromised by the use of facet-based scales” (pg. 281). Inother words, there is no difference in the predictive power of models using either the global orfaceted measurement approaches. Thus, this study will employ a global measure of job satisfaction.
Global measures of satisfaction are typically worded as “All in all, how satisfied would yousay you are with your job”. Although the questions ask about the “job”, the position of this paperis that there is room for interpretation as to how the respondent might consider this question. Dorespondents answer it by focusing only on the job itself or are they also thinking of the job fit interms of its’ broader impact on his/her life? Perhaps traditional research focusing on job satisfactionis missing the true beliefs that make an employee begin having thoughts about quitting. Thedefining example is the schoolteacher who dislikes her job but does not intend to quit because thework hours satisfy her family needs. This person would answer a survey saying that they weredissatisfied with their job, but did not intend to quit – a possible anomaly for an empirical researchproject.
To answer this question, a new construct is introduced as an alternative to job satisfactionfor predicting turnover. This construct evaluates the quitting process as a result of a failure of thejob to fit with the quality of life goals the employee has for him or herself. In considering qualityof life, George and Jones (1996) noted that “Well-being in life has three complimentary aspects ofwell being: value attainment (e.g., how one’s life is evaluated relative to one or more standards orvalues such as virtue or success); life satisfaction (the extent to which one is satisfied with one’s life
Allied Academies International Conference page 53
Proceedings of the Academy of Information and Management Sciences, Volume 8, Number 2 Maui, 2004
or has come to evaluate one’s life in positive terms); and the extent to which a person experiencespositive feelings or moods” (pg. 318). Brief (1998) described terminal needs in life as professional,social, and personal. Professional goals include professional growth or advancement and statuswithin the community. Social goals include needs for recreation and social relationships. Personalgoals are financial, work/family life balance, and spiritual/ethical goals. In this research, measureswill be developed to tap into these facets of the congruence of fit of the job to the professional,social, and personal goals as well as to overall quality of life goals. Measures to reflect thisconstruct will have to be developed because no empirically validated measures are currentlyavailable.
In order to evaluate this new construct against the traditional job satisfaction measures, anempirical study will be designed that will gather both job satisfaction and congruence of fit datacoupled with 3 representative turnover decision constructs used in turnover literature. Bytriangulating the predictive power across three different dependent variables, a better understandingof the relative strengths of these antecedents in predicting voluntary turnover can be determined.
While, for many, the preferred dependent variable might be actual turnover behavior, thatdata is not available at this time and therefore surrogate turnover decision variables will be used.Specifically, thoughts about quitting, the expectation of quitting, and the formation of the intentionto quit will be used as surrogates or immediate antecedents to the actual turnover behavior.According to Dalton, Johnson, and Daily (1999), “The key issue with regard to the appropriate useof a surrogate variable, however, is its relationship to the actual variable. The usual assumption isthat the surrogate variable is highly correlated with its actual behavioral counterpart” (p. 1338).
The validity of the relationship between intention and behavior has been established in anumber of different studies. A series of meta-analysis (Steel & Ovalle, 1984; Tett & Meyer, 1993)have reported weighted average correlations between intention to quit and turnover behavior of 0.50,0.36, and 0.52 respectively. The genesis of this well-correlated relationship can be traced back toAjzen and Fishbein’s theory of reasoned action which says “according to the theory of reasonedaction, attitudes follow reasonably from the beliefs people hold about the object of the attitudes, justas intentions and actions follow reasonably from attitudes” (Ajzen, 1988, p.32). A number ofturnover studies have used this approach with success (Dalton, Johnson & Daily, 1999). Moreover,beyond behavioral turnover, these decision constructs can also be argued as potentially predictiveof an employee’s level of productivity, quality of work, or other withdrawal behaviors.
THE STUDY
A questionnaire will be administered to all information systems workers in an independentschool district. The instrument includes measures of congruence of fit along with global measuresof job satisfaction adopted from previous research. Responses will be given on a 7-point Likertscale and analyzed using the structural equation modeling software PLS Graph version 3.0 (build1060). The research model uses both job satisfaction and congruence of fit to predict each of thethree turnover decision constructs of thoughts about quitting, expectation of quitting, and intentionto quit. In addition, model runs will be made where only one exogenous construct (eithercongruence of fit or job satisfaction) is used to predict each turnover decision. These nine analysesusing three dependent variables will provide multiple criterion validity to the research.
page 54 Allied Academies International Conference
Maui, 2004 Proceedings of the Academy of Information and Management Sciences, Volume 8, Number 2
CONCLUSION
A student recently said, “My Dad hated his job, but he worked at it for 20 years so that hecould put my sister and I through college.” The Dad hated the attributes of the job, but stayed withit because it fulfilled a quality of life goal to attain a certain level of financial well being. Inresponse to a job satisfaction survey, the Dad would answer that he was dissatisfied with his job, buthad no intentions of quitting. This dichotomy may represent a statistical confound for the traditionaljob satisfaction-to-turnover models. It was therefore posited that measures of job satisfaction do notnecessarily reflect the congruence of fit with overall quality of life goals and thus a new measurecould improve the prediction power of a voluntary turnover model.
The research question thus becomes: “Do some people look at their jobs in a broader contextthan just the attributes of the job itself?” In other words if a person is asked about their level ofsatisfaction with their job, can they differentiate the job itself from its overall influences on thequality of life? The authors’ belief is that not all people are answering these questions in aconsistent manner. Some respondents see job satisfaction as it relates strictly to the job itself andothers see job satisfaction as the job relates to the quality of life. The lesson for the researcher is thatthis dichotomy may exist and in order to improve the results of models using the job satisfactionconstruct, specific instructions should be given to the respondent as to how that question should beevaluated.
REFERENCES
Ajzen, I. (1988). Attitudes, Personality, and Behavior, Chicago: Dorsey.Brief, A. P. (1998). Attitudes In and Around Organizations, Thousand Oaks, CA: Sage Publications.Carsten, J. M. and Spector, P. E. (1987). “Unemployment, Job Satisfaction, and Employee Turnover: A Meta-analytic
Test of the Muchinsky Model,” Journal of Applied Psychology (76:2), pp. 199-212.Dalton, D. R., Johnson, J. L. and Daily, C. M. (1999). “On the Use of "Intent to . . ." Variables in Organizational
Research: An Empirical and Cautionary Assessment,” Human Relations (52:10), pp. 1337-1350.George, J. M. and Jones, G. R. (1996). “The Experience of Work and Turnover Intentions: Interactive Effects of Value
Attainment, Job Satisfaction, and Positive Mood,” Journal of Applied Psychology (81:3), pp. 318-325.Hom, P. W., Griffeth, R. W. and Sellaro, C. L. (1984). “The Validity of Mobley's (1977) Model of Employee Turnover,”
Organizational Behavior and Human Performance (34), pp. 141-174.Lee, T. W., Mitchell, T. R., Holtom, B. C., McDaniel, L. S. and Hill, J. W. (1999). “The Unfolding Model of Voluntary
Turnover: A Replication and Extension,” Academy of Management Journal (42:4), pp. 450-462.Mobley, W. H. (1977). “Intermediate Linkages in the Relationship Between Job Satisfaction and Employee Turnover,”
Journal of Applied Psychology (62:2), pp. 237-240.Muchinsky, P. and Tuttle, M. (1979). “Employee Turnover: An Empirical and Methodological Assessment,” Journal
of Vocational Behavior (14), pp. 43-77.Steel, R. P. and Ovalle, N. K. (1984). “A Review and Meta-analysis of Research on the Relationship Between
Behavioral Intentions and Employee Turnover,” Journal of Applied Psychology (69), pp. 673-686.Tett, R. P. and Meyer, J. P. (1993). “Job Satisfaction, Organizational Commitment, Turnover Intention, and Turnover:
Path Analyses Based on Meta-Analytic Findings,” Personnel Psychology (46), pp. 259-293.
Allied Academies International Conference page 55
Proceedings of the Academy of Information and Management Sciences, Volume 8, Number 2 Maui, 2004
OFFSHORE INFORMATION TECHNOLOGYOUTSOURCING-A WISE CHOICE?
Santosh S. Venkatraman, Tennessee State [email protected]
ABSTRACT
The prospect of loosing many more Information-Technology (IT) related jobs to overseasmarkets is currently a major opportunity and concern for U.S. businesses. By 2015, the U.S. isexpected to loose about 3.3 million “business-service” jobs to other countries – resulting in aboutUS$136 billion of lost wages. Just as the U.S. got used to loosing jobs in the manufacturing sector,we now have to face the consequences of loosing several jobs in the Information Technology sector -one in which we are the leaders in the world. As the U.S. economy is finally beginning to show somestrength, there is an expectation that there will be a lot more hiring in the IT sector. Recent data,however, suggests that the exodus of IT jobs to countries such as India, Russia, China and thePhilippines shows no sign of waning. This trend might even accelerate as U.S. companies startembracing the “global” economy, and critically evaluate best practices in order to maximize profits.
The purpose of this paper is to study the phenomenon of offshore outsourcing in theInformation Technology sector. It will identify the major advantages and disadvantages of offshoreIT outsourcing, and its impact on the U.S. economy. The paper will be beneficial to businessmanagers, as it will give an unbiased view of the outsourcing phenomenon, thus allowing them tomake better outsourcing decisions. Academic researchers and faculty members in the business orinformation technology discipline will find the paper informative and stimulating – allowing themto be more knowledgeable teachers, and spurring them to develop new research metrics andmethodologies for better studying the IT outsourcing phenomenon.

page 56 Allied Academies International Conference
Maui, 2004 Proceedings of the Academy of Information and Management Sciences, Volume 8, Number 2
Allied Academies International Conference page 57
Proceedings of the Academy of Information and Management Sciences, Volume 8, Number 2 Maui, 2004
EVALUATION OF THE HOME PAGE OF THE TOP 100UNIVERSITY WEBSITES
Sehwan Yoo, University of Maryland Eastern [email protected]
Jongdae Jin, University of Maryland Eastern [email protected]
ABSTRACT
Many Universities provide information through their websites for users. The key to thesuccessful utilization of the University website is to attract users’ attentions and then to provide theusers good impressions of the University through its websites. The home page, the first page of theuniversity website, is vital for that purpose. We have investigated and evaluated home pages of thetop 100 University Websites selected by U.S News and World Reports magazine. In order to evaluatethe home pages, 12 evaluation criteria (i.e., critical features of an ideal website) are selectedthrough literature reviews on the website design. Those are scrolling text, screen length, search box,number of colors, number of images, number of background colors, use of web mail, sequentialappearance of text and then image, use of different fonts, use of capital letters, use of breathingspace, and use of multiple headings.
We found that most universities use scroll text (83%), search box (90%), breathing space(84%), and multi headings (98%) but they use neither more than one font, size, or style (85%) norcapital letters only (97%). They do not use more than four colors per screen (84%). The othercritical features of an ideal home page are used relatively frequently but in less degree. But not asingle university’s website satisfies all 12 evaluation criteria.
Keywords: Home page design, evaluation criteria, and university.
INTRODUCTION
The university homepage is usually the first contact point for anybody who seeksinformation about the university on line. It is inevitable for the university to develop a dynamichomepage that captures its users’ attentions and meets their informational needs. Nonetheless, manyuniversity home pages have inefficiencies, operational difficulties, and even defects that stop theusers from conducting some critical functions. Thus, it may be worthwhile to investigate existinguniversity home pages to find what the common critical features used (or not used) are.
The purpose of this paper is to investigate university home pages and to determine whetheror not they employ selected principles of good home page design, structure, and content. Theseprinciples of good home page have been considered pivotal to the overall success of the website.
page 58 Allied Academies International Conference
Maui, 2004 Proceedings of the Academy of Information and Management Sciences, Volume 8, Number 2
LITERATURE REVIEW
The first look of the home page is so critical that users may decide whether to spend timeexploring the website and/or engaging in other favorable behavior such as book marking the websitebased on their impressions of the home page [16]. Thus, the home page should provide the sufficientinformation content in the right way.
After reviewing a literature on the issue of the home page design [such as articles 1, 2, 3, 10,11, & 23], twelve characteristics of the good home page which are critical evaluation criteria for theacademic home pages are selected. The first 7 criteria are about general characteristics of the goodhome page, while the last five criteria are specifically about the content of the good home page. Thegeneral criteria are as follows.
Scrolling Text. Most users seek complete information satisfaction in the home page, whichinfluences the overall feeling of satisfaction about the website as a whole. [12]. Because of this,scrolling text fields that have much hidden information are deemed to be distractive from the corecontent of the website and to slow down use process of the website [13].
Screen Length. Users want to see all core website content at once in the home page [18].When the home page ventures into more than one screen, most users would not travel beyond thefirst screen [12]. Thus, it is a common agreement among users of websites that the fewer the numberof screens in the home page, the better the home page is.
Search Box. The search box is one of the most important features for the university homepage. Many users can save time in searching information they want by using the search box, becausea search mechanism can take the user directly to wherever the information they need is located. [16]It is better to have this function in the home page.
Web Mail. The web mail, E-mail that is accessible via a standard web browser, is anotherimportant feature of the university home page, because this function may make it easier for usersto access to their university email accounts and hence coerce them to visit the university websitemore frequently. [9]
Number of Color. Van Brakel et al. [18] found that more than four colors per screenexcluding logos and other images are distractive for users. A limited of number of colors rather thantoo many colors in a screen make a home page more focused. [8]
Background Color. Van Brakel et al. [18] also recommended that light blue, white, or graycolor be used for background of the home page, because the light colors such as those than the darkcolors make the home page more conspicuous. It is better to use one of these colors than to use allthree colors for the home page at the same time. [19].
Number of Image. The home page should not use more than three images per page.Excessive number of images causes long loading time and hence distracts rather than attracts theuser from the web site. [5, 21]
The five content criteria are as follows.Sequential Appearance of Text and Then Image. The home page should show the text,
first, and then the image, because the image consists of lot more pixels than the text. In doing so,users can identify the content of the home page while images are being loaded. [21]
Use of Different Fonts. The home page should not use more than one font size or styleexcept for titles to make the layout of the site consistent and user-friendly. [21]
Allied Academies International Conference page 59
Proceedings of the Academy of Information and Management Sciences, Volume 8, Number 2 Maui, 2004
Use of Capital Letters. The home page should not use all capital letters in the home pageunless in page titles, page headings, or acronyms. It is because the home space may be wasted andthe home page may be hard to read [21].
Use of Breathing Space. The home page should use white space, called “breathing space”between page elements, effectively to avoid a crowded home page [14, 15].
Use of Multiple Headings. A proper use of different headings such as title, sub titles, andsub-sub title is always beneficial to the efficient structure of the home page and hence makes it easyfor the user to comprehend the home page. [6, 17].
METHODOLOGY
We investigate home pages of the top 100 university websites selected by the U.S News andWorld Reports magazine. Due to the existence of multiple universities with the same rank, the totalnumber of sample-university websites investigated is 105.
The number of screens in a home page is measured as follows. First, the vertical length ofthe home page is measured. And then it is divided by the height of the viewable monitor screen ofthe computer which is used in this investigation. If the division produces an integer number only,then the integer number is the number of screens in the home page. If the division produces aninteger number and remainder, the number of screens in the home page is one plus the integernumber.
The latest version of Microsoft Internet Explorer, version 6.0, and Microsoft Windows XPoperating System are used to examine all contents of the home page. Some contents of the homepage can not be seen using the old operating system.
The sample university home pages are investigated and evaluated by the twelve afore-mentioned evaluation criteria.
DATA ANALYSES and DISCUSSIONS
The results from these analyses are as follows.Scrolling Text. Only 17% of the top 100 university home pages use scrolling text and hence
the remaining 83% of them do not use it. It may be because scrolling text is relative outdated andimpractical function in the contemporary home pages.
Single Screen. 53% of the home pages surveyed use a single screen to present theircomplete information, while 45% use 2 screens and 2% use 3 screens.
Search Box. 90% of the sample home pages provide search box, while 10% neglect toprovide the box. The linked search file is also available in some sample university home pages.
Number of Colors. We found that 19% of the sample university home pages use 2 colorsin their home page, whereas 38% use 3 colors, 25% provide 4 colors, and 16% use more than 5colors.
Number of Images. 20% of the home pages analyzed have a single image in their homepages, whereas 22% have 2 images, 19% have 3 images, and 37% have more than 3 images. Only2% do not have any image in their home pages.

page 60 Allied Academies International Conference
Maui, 2004 Proceedings of the Academy of Information and Management Sciences, Volume 8, Number 2
Number of Background Colors. 54% of the sample home pages use a single back groundcolor in their home pages, while 39% use 2 back ground colors, and 7% use more than 3 background colors.
Web Mail. Only 18% of the sample home pages provide the web mail function, while 82%neglect to provide the function.
Contents. 7% of the sample home pages analyzed provide texts, first, and then images,while 93% do not show texts and then images, sequentially. 85% of the sample university homepages use more than one font, size, or style, where 15% use only one. It is discovered that 97% ofthe sample home pages do not use capital letters only unless in page title, page heading, oracronyms, while 3% use capital letter only. We find that 84% of the sample home pages have thebreathing space between elements, while 16% do not. 98% of the sample home pages categorizetheir content using at least one of the following headings: topic headings, subtopic headings, orhorizontal lines. None of the sample home pages meet all twelve afore-mentioned criteria.
CONCLUSIONS
We have investigated and evaluated home pages of the top 100 University Websites selectedby U.S News and World Reports magazine. In order to evaluate the home pages, 12 evaluationcriteria (i.e., critical features of an ideal home page) are selected through literature reviews on thewebsite design.
We found that most universities use scroll text (83%), search box (90%),breathing space (84%), and multi headings (98%) but they use neither more than one font, size, orstyle (85%) nor capital letters only (97%). They do not use more than four colors per screen (84%).The other critical features of an ideal home page are used relatively frequently but in less degree.But not a single university’s website satisfies all 12 evaluation criteria.
** Reference will be provided upon requests.
Allied Academies International Conference page 61
Proceedings of the Academy of Information and Management Sciences, Volume 8, Number 2 Maui, 2004
AUTOMATIC CONFLICT RESOLVING WEB-BASEDCLASS SCHEDULING SYSTEM
Sehwan Yoo, University of Maryland Eastern [email protected]
Jongdae Jin, University of Maryland Eastern [email protected]
Dae Ryong Kim, Delaware State [email protected]
ABSTRACT
This paper explores the possibility of an interactive web-based class schedule managementsystem, which includes automatic conflict resolution functions. This system utilizes the automaticconflict resolution capability to solve tardiness and complexity of class scheduling problems andto save time consuming in the scheduling for both instructors and administrators. The system allowsinstructors to enter their class schedules to the system directly and solve most of the conflicts withother classes by the criteria already set in the system. The system finalizes each scheduling whenthe conflicts are solved by the set rules, and administrators intervene to the scheduling process onlywhen the system cannot solve the conflicts even after applying all the criteria. In this case, involvedinstructors and administrators receive a message from the system to have further adjustment.
Through this process, the system provides efficient and powerful means to instructors to setup their class schedule by themselves every semester in timely manner without sacrificing all thestakeholders’ interest. By replacing a primarily paper-based work process and utilizing web-basedon line scheduling system, both instructors and administrators can use all the schedulinginformation saved in database and update it whenever they use the system. This practice may savetime and cost in class scheduling tremendously for all sort of educational institutions.
Keywords: Web-based Class Scheduling, Automatic Conflict Resolution, HTML, PHP, MySQL,and Database
INTRODUCTION
The purpose of this paper is to explore the possibility of an interactive web-based classschedule management system, which includes automatic conflict resolution functions. Toaccomplish this objective, this study provides an essence of the proposed system development toshow how it was developed, what it looks like, how it can be used, and what are the criteria used inthe PHP programming. The study also provides a few captured screens of the user-friendlyinterfaces of the system. The proposed system provides an efficient and user-friendly Web-basedinterface to the instructors, too. It also responds immediately to any course scheduling requests with
page 62 Allied Academies International Conference
Maui, 2004 Proceedings of the Academy of Information and Management Sciences, Volume 8, Number 2
conflicts. The system resolves the conflicts automatically whenever it finds any applicable pre-setcriteria for the conflict.
METHODOLOGY
Three important steps in coding class schedule management systems are: creating tables inMySQL, creating HTML pages, and embedding PHP codes into HTML tags. We download PHP[3, 6, 10] and configure PHP to run on personal computer and test the PHP script, first. Then weinstall and configure MySQL [8, 9], which is followed by a coding of HTML pages. In order topublish the webpage and run it on a web server that supports PHP & MySQL, we gained an accessto a DATAFLAME web server supporting PHP and MySQL. Once we learn how to administer theweb server, we begin to create tables in database and load the tables with data. PHP files for HTMLpages are coded to show that what kind of information instructors can enter into the program andwhat kind of view the program produces in response using PHP coding.
The database for this application is developed using MS Access that is widely used for thesmall database. This database is linked with the web pages in this application. We design nine tablesfor instructors and administrators: Login_info, Courses_Offered, Semester_Description,Room_Assignment, Bldg_Description, Time_Slots, Requested_Schedule, Instruction_Description,and Conflict_Description
Login_info table - It stores the login information such as User ID and password. First name,last name and email address of the user are also stored in this table. Users can be departmentadministrators, facility administrators or instructors who want to register for teachingcourses.
Courses_Offered table - This table has the basic information about the courses beingoffered in a particular semester of a year. Instructors choose from amongst these courses.And his choices are populated in the Requested_Schedule table. It shows courseidentification numbers, credit hours and the semester and the year in which the course willbe offered.
Semester_Description table - It stores the descriptions of the semester codes that are beingused in the Course_info and Requested_Schedule tables.
Room_Assignment table - This table shows the room number, building number and thecapacity of the room.
Bldg_Description Table - This is another description table of the building codes that arebeing used in Room_Assignment and Requested_Schedule table.
Time_Slots table - This table shows the day and time available for the slot.
Allied Academies International Conference page 63
Proceedings of the Academy of Information and Management Sciences, Volume 8, Number 2 Maui, 2004
Requested_Schedule - This table gets populated when the instructor chooses course ID,room No, time and other information related to the class that he/she wants to teach. As therelationship window illustrates, this table is getting values from the others tables.
Instruction_Description - This table shows the descriptions of codes for instructionmethods. For example code 0 means that instruction method is face to face and code 1 meansthat it’s a web course.
Conflict_Description Table - This table shows the description of codes for different classscheduling conflicts.
Considering the above-addressed typical tables of this application, we design the entityrelationship (ER) diagram that is a logical representation of the data as shown on Figure 2. Thedatabase reflects the principal information system of basic functionalities. The tables are accessedby primary key(s), which are bold, and they are interconnected by foreign key(s) from other tables.All tables are linked by the Requested_Schedule table which shows instructors’ offering courses.
RESOLVING CONFLICTS IN THE WEB-BASED CLASS SCHEDULEMANAGEMENT SYSTEM
Conflicts occur when more than one instructors request for the same classroom and the sametime slot or when more than one instructors teaching different required classes request for the sametime slot. These conflicts will be resolved in the web-based class schedule management systemusing the following criteria.
Criterion 1: the required course has a preference over the elective course, which means schedulingrequests for the required course should be granted, first, between the required course and theelective course.
Criterion 2: the upper level course has a preference over the lower level course. The upper levelcourse is a course offered to the upper class students, while the lower level course is to thelower class students. For example, among advanced level course, intermediate level course,and introductory level course, scheduling requests for advanced level courses should begranted, first, then intermediate level courses, and introductory level course, last.
Criterion 3: the course in the core competent area of the instructor has a preference over the coursein the non-core competent area of the instructor. For example, schedule requests for MISclasses by instructors with MIS expertise should be granted before the approval of schedulerequests for MIS classes by instructors without MIS expertise for the benefit of students.
Criteria 4: scheduling requests that cause violations of the institution’s teaching policy, if notgranted, have preferences over the other class scheduling requests that do not. Suppose thatan instructor’s teaching schedule will violate the institution’s teaching policy that prohibitsany instructor from teaching more than 3 days a week, if his or her course scheduling requestis not granted, his or her course scheduling request should be granted, first.
page 64 Allied Academies International Conference
Maui, 2004 Proceedings of the Academy of Information and Management Sciences, Volume 8, Number 2
The above-mentioned 4 criteria should be applied in the same order as they are presented. In otherwords, apply the criteria in the order of criterion 1, 2, 3, and then 4. It is necessary to apply theimmediate subsequent criterion, only if the immediate preceding criterion does not resolve theconflict in the scheduling requests. If all four criteria do not resolve the conflict, the system informsthe requesting instructor that he or she must contact the administrator to resolve the conflict.
CONCLUSIONS
This paper explores the possibility of an interactive web-based class schedule managementsystem, which includes automatic conflict resolution functions. This system utilizes the automaticconflict resolution capability to save time and effort consumed in the scheduling process for bothinstructors and administrators. The system allows instructors to enter their class schedules to thesystem directly and solve most of the conflicts with other classes by the criteria already set in thesystem. The system finalizes each scheduling request when the conflicts are solved by the pre-setcriteria, while administrators intervene to the scheduling process only when the system cannot solvethe conflicts even after the system applies all the criteria. In this case, involving instructors andadministrators receive a message from the system to have further adjustment.
Through this process, the system provides efficient and powerful means to the instructorsto set up their class schedules by themselves every semester in timely manner without sacrificingany stakeholders’ interest. By replacing a primarily paper-based work process with a web-basedscheduling system, both instructors and administrators can use all information saved in database ofthe system and update the database whenever they use the system. This practice may save time andcost in class scheduling tremendously for all sort of educational institutions.
REFERENCE
1. Babb, D., (2000). A Brief History of Registration at at UH Manoa Since The Beginning of Time, Infobits, 6(1).
2. Brown A., (1997). Designing for Learning: What Are the Essential Features of an Effective Online Course?,Australian Journal of Educational Technology, 13 (2).
3. Deitel, H.M., Deitel, P.J., and Nieto, T.R. (2002). Internet &World Wide Web: How to Program, Prentice Hall:Upper Saddle River, NJ.
4. Fredrickson, S., (1999) Untangling a Tangled Web: An Overview of Web-based Instruction Programs, JournalOnline, June.
5. Johnson, J., (2003). The Evolution of Distance Learning In Higher Education, EEE: News & Events, December.6. Moulding, P., (2001). PHP Black Book Comprehensive Problem Solver, Coriolis Technology Press: Scottsdale,
AZ. 7. Thomas N., (2002). Electronic Schedulers for Resource Room and Itinerant Teachers, Odyssey Magazine, Fall.8. Yarger, R.J., Reese, G., and King, T., (1999). MySQL and mSQL, O'Rielly & Associates, Inc.: Cambridge,
MA.9. http://www.mysql.com, A site for downing MySQL and its documentation.10. http://www.php.net, A site for downloading PHP and its documentation.
Allied Academies International Conference page 65
Proceedings of the Academy of Information and Management Sciences, Volume 8, Number 2 Maui, 2004
Authors’ IndexAdams, C.N . . . . . . . . . . . . . . . . . . . . . . . . . . . . . . . . . . . . . . . . . . . . . . . . . . . . . . . . . . . . . . . . . . 1Bush, R . . . . . . . . . . . . . . . . . . . . . . . . . . . . . . . . . . . . . . . . . . . . . . . . . . . . . . . . . . . . . . . . . . . . . . 3Chin, W.W . . . . . . . . . . . . . . . . . . . . . . . . . . . . . . . . . . . . . . . . . . . . . . . . . . . . . . . . . . . . . . . . . . 51Dattero, R . . . . . . . . . . . . . . . . . . . . . . . . . . . . . . . . . . . . . . . . . . . . . . . . . . . . . . . . . . . . . . . . . . . 29Fleck, R.A . . . . . . . . . . . . . . . . . . . . . . . . . . . . . . . . . . . . . . . . . . . . . . . . . . . . . . . . . . . . . . . 11, 17Freeman, G.L . . . . . . . . . . . . . . . . . . . . . . . . . . . . . . . . . . . . . . . . . . . . . . . . . . . . . . . . . . . . . . . . 23Galup, S.D . . . . . . . . . . . . . . . . . . . . . . . . . . . . . . . . . . . . . . . . . . . . . . . . . . . . . . . . . . . . . . . . . . 29Ghawi, D . . . . . . . . . . . . . . . . . . . . . . . . . . . . . . . . . . . . . . . . . . . . . . . . . . . . . . . . . . . . . . . . . . . 25Gober, R.W . . . . . . . . . . . . . . . . . . . . . . . . . . . . . . . . . . . . . . . . . . . . . . . . . . . . . . . . . . . . . . . . . 23Hamilton, K.L . . . . . . . . . . . . . . . . . . . . . . . . . . . . . . . . . . . . . . . . . . . . . . . . . . . . . . . . . . . . . . . 11Hicks, R.C . . . . . . . . . . . . . . . . . . . . . . . . . . . . . . . . . . . . . . . . . . . . . . . . . . . . . . . . . . . . . . . . . . 29Jin, J . . . . . . . . . . . . . . . . . . . . . . . . . . . . . . . . . . . . . . . . . . . . . . . . . . . . . . . . . . . . . . . . . . . . 57, 61Kim, D.R . . . . . . . . . . . . . . . . . . . . . . . . . . . . . . . . . . . . . . . . . . . . . . . . . . . . . . . . . . . . . . . . . . . 61Korrapati, R . . . . . . . . . . . . . . . . . . . . . . . . . . . . . . . . . . . . . . . . . . . . . . . . . . . . . . . . . . . . . . . 3, 47Korrapati, R.B . . . . . . . . . . . . . . . . . . . . . . . . . . . . . . . . . . . . . . . . . . . . . . . . . . . . . . . . . . . . . . . 35Loughman, T.P . . . . . . . . . . . . . . . . . . . . . . . . . . . . . . . . . . . . . . . . . . . . . . . . . . . . . . . . . . . . . . . 17McQueen, T.F . . . . . . . . . . . . . . . . . . . . . . . . . . . . . . . . . . . . . . . . . . . . . . . . . . . . . . . . . . . . . . . 17Moole, B.R . . . . . . . . . . . . . . . . . . . . . . . . . . . . . . . . . . . . . . . . . . . . . . . . . . . . . . . . . . . . . . . . . . 35Otto, J . . . . . . . . . . . . . . . . . . . . . . . . . . . . . . . . . . . . . . . . . . . . . . . . . . . . . . . . . . . . . . . . . . . . . . 41Pant, P . . . . . . . . . . . . . . . . . . . . . . . . . . . . . . . . . . . . . . . . . . . . . . . . . . . . . . . . . . . . . . . . . . . . . 41Schneider, G.P . . . . . . . . . . . . . . . . . . . . . . . . . . . . . . . . . . . . . . . . . . . . . . . . . . . . . . . . . . . . . . . 25Simmons, K.O . . . . . . . . . . . . . . . . . . . . . . . . . . . . . . . . . . . . . . . . . . . . . . . . . . . . . . . . . . . . . . . 47Taylor, D.S . . . . . . . . . . . . . . . . . . . . . . . . . . . . . . . . . . . . . . . . . . . . . . . . . . . . . . . . . . . . . . . . . . 51Venkatraman, S.S . . . . . . . . . . . . . . . . . . . . . . . . . . . . . . . . . . . . . . . . . . . . . . . . . . . . . . . . . . . . . 55Wagner, W . . . . . . . . . . . . . . . . . . . . . . . . . . . . . . . . . . . . . . . . . . . . . . . . . . . . . . . . . . . . . . . . . . 41Yoo, S . . . . . . . . . . . . . . . . . . . . . . . . . . . . . . . . . . . . . . . . . . . . . . . . . . . . . . . . . . . . . . . . . . 57, 61