cdna microarrays as a tool for identification of ...aem.asm.org/content/72/8/5512.full.pdf ·...
TRANSCRIPT

APPLIED AND ENVIRONMENTAL MICROBIOLOGY, Aug. 2006, p. 5512–5526 Vol. 72, No. 80099-2240/06/$08.00�0 doi:10.1128/AEM.00343-06Copyright © 2006, American Society for Microbiology. All Rights Reserved.
cDNA Microarrays as a Tool for Identification of BiomineralizationProteins in the Coccolithophorid Emiliania huxleyi (Haptophyta)
Patrick Quinn,1† Robert M. Bowers,1 Xiaoyu Zhang,2 Thomas M. Wahlund,1Michael A. Fanelli,1 Daniela Olszova,1 and Betsy A. Read1*
Department of Biological Sciences1 and Department of Computer Sciences,2
California State University—San Marcos, San Marcos, California 92078
Received 10 February 2006/Accepted 8 June 2006
Marine unicellular coccolithophore algae produce species-specific calcite scales otherwise known as cocco-liths. While the coccoliths and their elaborate architecture have attracted the attention of investigators fromvarious scientific disciplines, our knowledge of the underpinnings of the process of biomineralization in thisalga is still in its infancy. The processes of calcification and coccolithogenesis are highly regulated and likelyto be complex, requiring coordinated expression of many genes and pathways. In this study, we have employedcDNA microarrays to investigate changes in gene expression associated with biomineralization in the mostabundant coccolithophorid, Emiliania huxleyi. Expression profiling of cultures grown under calcifying andnoncalcifying conditions has been carried out using cDNA microarrays corresponding to approximately 2,300expressed sequence tags. A total of 127 significantly up- or down-regulated transcripts were identified using aP value of 0.01 and a change of >2.0-fold. Real-time reverse transcriptase PCR was used to test the overallvalidity of the microarray data, as well as the relevance of many of the proteins predicted to be associated withbiomineralization, including a novel gamma-class carbonic anhydrase (A. R. Soto, H. Zheng, D. Shoemaker, J.Rodriguez, B. A. Read, and T. M. Wahlund, Appl. Environ. Microbiol. 72:5500–5511, 2006). Differentiallyregulated genes include those related to cellular metabolism, ion channels, transport proteins, vesiculartrafficking, and cell signaling. The putative function of the vast majority of candidate transcripts could not bedefined. Nonetheless, the data described herein represent profiles of the transcription changes associated withbiomineralization-related pathways in E. huxleyi and have identified novel and potentially useful targets formore detailed analysis.
Coccolithophores are a diverse group of calcifying unicellu-lar marine algae, which includes the extremely abundant spe-cies Emiliania huxleyi. This group of phytoplankton has cap-tured the attention of scientists from diverse disciplines,particularly because of the important roles it plays in the cy-cling of carbon and sulfur in the marine environment. Thefixation of CO2 via photosynthesis and the production of CO2
in the calcification process affect global carbon cycling and thuslink coccolithophores with climate and the chemical balancebetween atmosphere, hydrosphere, and geosphere (20). Fur-thermore, the striking morphological diversity of the morethan 200 species of extant coccolithophores (13) and the seem-ingly endless range of fossil coccolith types (40) provide aunique resource with which to study biodiversity and speciationin the marine environment (23, 24). The biomineralized skel-etons or “coccoliths” (Fig. 1A) produced by these microscopicorganisms have also captured the attention of materials scien-tists interested in the microscale and nanoscale fabrication ofthree-dimensional biomineralized structures for novel applica-tions related to telecommunications, optoelectronics, andmedicine (31, 37).
Although hypotheses continue to be debated in the litera-
ture, the function of the calcite skeletons and the role ofbiomineralization in coccolithophores remain unresolved.Knowledge of the mechanisms of calcification in coccolitho-phores is equally poor. Coccolithogenesis takes place withinthe coccolith vesicle, a specialized apparatus derived from theGolgi body, in a highly regulated and reproducible manner.The molecules involved in the acquisition and transport ofcalcium ions and inorganic carbon within the cell and thoseinvolved in the precipitation of calcite and crystal growth havenot been identified or adequately characterized. While acidicpolysaccharides and a single protein, “GPA,” have been impli-cated, the exact roles of these molecules (if any) in calcificationhave not been experimentally demonstrated (6, 7, 15).
The inability to define the function and to resolve the mech-anisms of calcification and coccolithogenesis with previous ex-perimental approaches obviates the need for employing novelmolecular genetic tools to investigate these processes. Molec-ular approaches, however, have been complicated by the ab-sence of a viable transformation system. Further complicatingmatters is the fact that coccolithophores grow as diploid, veg-etative cells whose sexual life cycle has yet to be controlled inculture. Genomic and functional genomic strategies have beenapplied recently and together with proteomics methods offergreat potential for imparting new insight into the fundamentalbiology of coccolithophores and for the development of mo-lecular tools and techniques. Studies describing the sequencingand analysis of expressed sequence tags (ESTs) from themodel coccolithophore species E. huxleyi under calcifying andnoncalcifying conditions were the first reports of gene expres-
* Corresponding author. Mailing address: Department of BiologicalSciences, California State University—San Marcos, 333 S. Twin OaksValley Road, San Marcos, CA 92096-0001. Phone: (760) 750-4129.Fax: (760) 750-3063. E-mail: [email protected].
† Present address: Department of Archaeology, University of Shef-field, Sheffield, United Kingdom.
5512
on Novem
ber 30, 2018 by guesthttp://aem
.asm.org/
Dow
nloaded from

sion in coccolithophores (35, 36). More recently, serial analysisof gene expression (SAGE) and suppressive subtractive hy-bridization, coupled with real-time reverse transcriptase PCR(RT-PCR), have demonstrated the power of genomic ap-proaches for identifying genes involved in phosphate limitationand/or calcification in E. huxleyi (9, 17). With the goal offurther defining genes potentially involved in biomineralizationin E. huxleyi, we have constructed the first coccolithophorecDNA microarrays and tested their capability as a tool forhigh-throughput gene expression analysis of biomineralizationand coccolithogenesis processes.
Microarrays emerged during the dawn of the genome-se-quencing era and are arguably the most promising new labo-ratory technique of this decade. In marine systems, microarrayanalysis has recently been applied to characterize populationsof marine bacterioplankton (22), analyze redox regulation ofgenes in a dinoflagellate (18), evaluate functional gene diver-sity and distribution in microbial communities (38), identifypatterns of differential gene expression associated with hypoxic
stress in fish (12), and study the innate immune response in theliver of Atlantic salmon (34). While microarrays have beenused to address a number of important questions in marinebiology, they have not yet been applied to investigate biomin-eralization in any organism, including the coccolithophorids.This is largely because of the lack of cDNA libraries and/oravailable sequence information from these organisms.
Using a cDNA library constructed from the RNA of calci-fying cells of E. huxleyi strain CCMP 1516 grown in the labo-ratory (35), we printed cDNA microarray slides containingsome 2,298 elements. These microarrays were used to examinedifferential gene expression patterns in calcifying and noncal-cifying E. huxleyi cultures grown in phosphate-limiting andphosphate-replete media, respectively. Among the transcriptsanalyzed, 79 were found to be up-regulated and 48 were foundto be down-regulated in calcifying cells maintained in phos-phate-limiting media relative to noncalcifying cells maintainedin phosphate-replete media. These 127 transcripts were thensubjected to full-length sequencing and subjected to BLASTX
FIG. 1. Scanning electron microscopy (SEM) and light micrographs of E. huxleyi. (a) SEM micrograph of E. huxleyi “coccosphere” in filteredplankton sample. Scale bar, 4 �m. (b) Detail of E. huxleyi coccolith in SEM micrograph. (c) Light micrograph of calcifying E. huxleyi 1516 cellsand isolated coccoliths in phosphate-limiting (f/2) media. Scale bar, 5 �m. (d) Noncalcifying E. huxleyi 1516 cells in phosphate-replete (f/2) media.(e) Calcifying B39 E. huxleyi cells and isolated coccoliths in phosphate-limiting (f/2) media.
VOL. 72, 2006 COCCOLITHOPHORE cDNA MICROARRAY 5513
on Novem
ber 30, 2018 by guesthttp://aem
.asm.org/
Dow
nloaded from

homology searches. To validate microarray analysis results, wealso analyzed the relative gene expression patterns of a smallsubset of differentially expressed transcripts by real-time RT-PCR. In order to distinguish genes involved in biomineraliza-tion from those associated with phosphate limitation, we ana-lyzed the expression of differentially expressed transcripts inanother strain of E. huxleyi (strain MBA B39), which in con-trast to strain 1516 was found to calcify in phosphate-repletemedia. The combined microarray and real-time RT-PCR anal-ysis results enabled us to identify 46 genes that may be directlyor indirectly involved in coccolith biomineralization and 36genes that either were related to phosphate limitation or werefalse positives.
With the completion of the genome sequencing of E. huxleyistrain 1516 (a collaborative effort between our laboratory andthe U.S. Department of Energy), microarrays are likely to playan important role in the functional characterization of newgenes in this important organism. The prospect of printingwhole-genome arrays or genome chips (8, 32) of E. huxleyi willopen up exciting possibilities for the understanding of cocco-lithophore cell biology and physiology at the molecular level.The relatively small cDNA microarrays presented here high-light the potential of this approach as a means of studying geneexpression patterns in coccolithophores.
MATERIALS AND METHODS
Emiliania huxleyi cultures and construction of cDNA library. Cultures of E.huxleyi strain 1516, obtained from the Provasoli Guillard National Center forCulture of Marine Phytoplankton (CCMP), were found to calcify when grown inphosphate-limiting (1.67 �M) f/2 medium and to produce mostly noncalcifyingcells when grown in phosphate-replete (41.7 �M) f/2 medium (Fig. 1) (35). UsingRNA extracted from calcifying cultures of strain 1516, a cDNA library was
constructed by Wahlund et al. (35), from which several thousand clones wererandomly selected.
Experimental design. In this study, two biological replicate experiments wereperformed whereby RNA was extracted from pooled 1-liter batch cultures ofcalcifying and noncalcifying cells grown in phosphate-limiting and phosphate-replete media, respectively (Fig. 2). Each replicate experiment consisted of fivereplicated microarray hybridizations for a total of 10 technical replicates. Tech-nical replicates were hybridized with reciprocally labeled cDNA. In the forwardreaction, the cDNA from calcifying cells was labeled with Cy5 and cDNA fromnoncalcifying cells was labeled with Cy3, whereas in the reverse reaction, cDNAfrom noncalcifying cells was labeled with Cy3 and cDNA from calcifying cells waslabeled with Cy5. Competitive hybridizations were carried out by combining 20�g of extracted and differentially labeled total RNA from calcifying and noncal-cifying samples and applying the mixture to the array printed on a glass slide. Allarray experiments were conducted under the same hybridization and wash con-ditions with the same batch of arrays.
Construction of microarrays. Microarrays were printed using a subset of 2,298clones from the cDNA library derived from calcifying cells grown under phos-phate-limiting conditions (35). A total of 3,000 ESTs from the library weregenerated from the 5� ends. These sequences were assembled into the 2,298unique contigs and singletons that were used to construct the microarray. Apanel of control elements was also printed and included gene sequences fromBacillus (diaminopimelate decarboxylase and dehydrodipicolinate reductasegenes and pheB) and Escherichia coli (biotin synthesis protein gene) as negativecontrols; the multiple cloning site of the parent vector (pMAB58), deoxynucleo-side triphosphates (dNTPs), and poly(A) sequences as blocking controls;genomic DNA from E. huxleyi as a positive control; and a site-specific recombi-nase gene from P1 bacteriophage (cre) as a doping control.
cDNA clones were picked and amplified in triplicate in 96-well plates con-taining the following: 20 ng/ml template DNA, 1 �M forward primer (5�-TATAACCGCTTTGGAATCACT-3�), 1 �M reverse primer (5�-GTAAATTTCTGGCAAGGTAGAC-3�); 200 �M dNTPs (TaKaRa Biomedicals, Tokyo, Japan),Taq polymerase buffer with MgCl2 (Promega Corporation, Madison, Wis.), and2 to 4 U Taq polymerase. The reaction mixture was incubated at 94°C for 3 min;cycled 29 times at 94°C for 45 s, 55°C for 1 min, and 72°C for 3 min; and then heldat 4°C before storage at �20°C. The three PCRs were pooled and purified usingQIAGEN QIAquick 96 PCR purification kit (QIAGEN Inc., Valencia, Calif.).To check the efficiency of the amplification, 3 �l of each PCR product was run
FIG. 2. Experimental design employed in this study. In each case, the starting material consists of RNA samples collected from calcifying andnoncalcifying cultures of E. huxleyi. Samples from experimental replicates 1 and 2 were fluorescently labeled. Reciprocal dye swap experimentswere performed and assayed using 10 microarrays indicated by connecting lines in each diagram.
5514 QUINN ET AL. APPL. ENVIRON. MICROBIOL.
on Novem
ber 30, 2018 by guesthttp://aem
.asm.org/
Dow
nloaded from

on a Ready-To-Run 96-well gel (Amersham Biosciences, Little Chalfont, UnitedKingdom) stained with ethidium bromide. Ten random samples were selectedfrom each plate, and the concentration of amplified DNA was determinedspectrophotometrically at 260 nm. Finally, purified products were dried downand resuspended to a concentration of 500 �g/ml.
Microarrays were printed using poly-lysine-coated slides. Prior to printing, thecDNA samples were diluted to a concentration of 250 �g/ml in 50% dimethylsulfoxide. The 2,298 sequences and the 8 controls (total of 2,306 elements) werethen printed in duplicate on 68 slides using a Roboarrayer (RoboDesign, Carls-bad, Calif.) with a 4-by-4 pin configuration. Array spots were �150 �m indiameter, and the distance between spots was �200 �m. The printed slides werebaked at 80°C for 4 h and blocked for 15 min with a succinic anhydride-NaBO4
solution. This solution was freshly prepared by dissolving 5 g of succinic anhy-dride (Sigma, St. Louis, Mo.) in 315 ml of N-methyl-pyrrolidinone and adding 35ml of 0.2 M NaBO4. After blocking, the DNA was denatured in 95°C double-distilled H2O (ddH2O) for 2 min, dehydrated by immersion in 95% ethanol for1 min, and dried by centrifugation for 5 min at 600 � g. Printed arrays werestored at room temperature in a desiccator until they were used. The quality ofthe printed arrays was assessed by random 9-mer staining using a Cy3-labeledPoly-N 9-mer (QIAGEN).
RNA isolation and microarray hybridization. E. huxleyi strain 1516 was grownat 20°C in phosphate-limiting and phosphate-replete f/2 artificial seawater sup-plemented with kanamycin (100 �g/ml) under a 12-h-light/12-h-dark cycle withcool white florescent light at 660 �mol m�2 s�2. Cells of a second, more robustE. huxleyi strain, B39, which calcifies under both phosphate-replete and phos-phate-limiting conditions (Fig. 1c), were obtained from the Marine BiologicalAssociation (MBA) Marine Algae Culture Collection, Plymouth, United King-dom, and grown in f/2 media as described above. Cells were harvested from allcultures on the seventh day after inoculation, during late log phase. Prior toharvesting, the cultures were observed under the light microscope to check theirdegree of calcification (Fig. 1c to e).
Total RNA extraction was performed using a modified version of the standardguanidinium isothiocyanate procedure (30) with a decalcification step as de-scribed by Wahlund et al. (35). The integrity of the isolated RNA was assessedby denaturing agarose gel electrophoresis, and its concentration was measuredspectrophotometrically. Twenty micrograms of total RNA from the calcifyingand noncalcifying cultures of E. huxleyi 1516 was used to produce fluorescentlylabeled cDNA with the Superscript III indirect labeling system (Invitrogen,Carlsbad, Calif.), whereby amino-modified dNTPs incorporated during first-strand cDNA synthesis are coupled to NHS ester-containing Cy3 or Cy5 dyes(Amersham Pharmacia, Little Chalfont, United Kingdom). Unincorporated dyemolecules were removed using PureLink spin columns, and the purified fluores-cently labeled probes were dried by centrifugation in a SpeedVac. The dyelabeling was reversed in separate experiments to eliminate the possibility of dyeincorporation bias.
Microarray slides were prehybridized in a solution of 5� SSC (1� SSC is 0.15M NaCl plus 0.015 M sodium citrate), 1% bovine serum albumin, and 0.1%sodium dodecyl sulfate (SDS) at 45°C for 30 min. After being rinsed twice indH2O and submersion in isopropanol, the slides were dried by centrifugation(2 min, 697 � g). Labeled cDNA probes from the calcifying and noncalcifying E.huxleyi cells were resuspended and combined in a total of 50 �l hybridizationsolution [25% formamide, 5� SSC, 0.1% SDS, 27.5 �g poly(A), 100 ng Cy5-labeled cre, 5 �g human Cot-1 DNA]. The probe solution was incubated at 95°Cfor 3 min and cooled to room temperature before being applied to a prehybrid-ized microarray under a coverslip. Arrays were hybridized for 18 h at 45°C. Theslides were washed for 5 min each as follows: (i) 1� SSC plus 0.1% SDS at 45°C,(ii) 0.2� SSC plus 0.1% SDS at 30°C, (iii) 0.1� SSC plus 0.1% SDS at 30°C, and(iv) 0.1� SSC at 22°C before being rinsed briefly in dH2O and dried by centrif-ugation (2 min, 697 � g). A total of 10 independent hybridizations were per-formed. The fluorescence of the hybridized microarrays was measured with theGenePix 4000A Scanner (Axon Instruments, Union City, Calif.).
Microarray data analysis. Fluorescent images were captured, and the Cy3 andCy5 fluorescence signal at each target spot was measured using the GenePix Pro4.1 software (Axon). A grid based on the predefined microarray layout wasmanually aligned to spot signals to optimize the subsequent automated spotrecognition and signal quantitation. Poor-quality spots were automatically ex-cluded from the analysis when the spot intensity was not greater than thebackground threshold, was irregular in size, or overlapped an adjacent spot.Images were also inspected manually, and spots from low-quality areas of thearray were flagged and excluded from further analysis. The local median back-ground signal was subtracted from the median hybridization signal of eachseparate spot. After background subtraction, quality spots exhibiting an intensity/background ratio of �3 in either channel were subjected to global robust locally
weighted regression (LOWESS) normalization (5) designed to equalize the flu-orescence ratio of the medians for all quality spots. Prior to statistical analysis,median fluorescence measurements were logarithm transformed (log2). For eachgene, a paired t test (P value of �0.01) was conducted using log2-transformedmedian fluorescent intensity values to assess the significance of the relativetranscript abundance levels. A Bonferroni multiple comparisons procedure wasalso performed, and an adjusted P value of 1.36E�5 was applied to reduce theprobability of a type I error. Transcripts exhibiting a significant P value and anexpression ratio greater than twofold were subjected to full-length sequencing.
Because some of the EST clones printed were similar in sequence and likely torepresent the same gene, full-length sequences generated were assembled usingPhrap for Linux (Codon Code Corporation). After assembly, an attempt toputatively identify the function of transcripts was made using BLASTX homol-ogy searches of GenBank with a probability cutoff of 1 in 1,000 (E value,�1.0E�3).
Real-time RT-PCR. Open reading frames (ORFs) within the full-length se-quences of each of the significantly up- and down-regulated cDNA clones re-vealed by microarray were identified using ORF Finder (NCBI: www.ncbi.nlm.nih.gov/gorf). Real-time RT-PCR primers were designed to ORFs exhibitingsignificant BLASTX homology results or to the longest ORF of transcriptsreturning no significant GenBank hits, using Primer Express Software version 1.0(Applied Biosystems, Foster City, Calif.). Primers were designed to have a G�Ccontent of 50 to 60%, a melting temperature of �50°C, C’s � G’s, �3 identicaldNTPs in a row, and to amplify a target sequence between 75 and 100 bp. Whensuitable primers could not be found using these criteria, the parameters C’s �G’s and having �3 identical dNTPs in a row were relaxed. Forward and reverseprimers were synthesized by San Diego State University Microchemical CoreFacility (SDSU, MCF).
cDNA synthesis was performed with the Omniscript reverse transcriptasekit (QIAGEN, Valencia, Calif.) using total RNA as template from calcifyingand noncalcifying cultures of E. huxleyi 1516 maintained in phosphate-limit-ing and phosphate-replete media, respectively, as well as RNA from calcifyingcultures of B39 maintained in phosphate-replete media. Each 20-�l reactionmixture contained 2 �g template RNA, 1� RT buffer, 0.5 mM deoxynucleo-side triphosphate, 1 �M oligo(dT) primer, 10 U of RNase inhibitor, and 4 Uof Omniscript reverse transcriptase. The reaction mixture was incubated for60 min at 37°C.
Real-time RT-PCR was performed with the iCycler IQ (Bio-Rad, Richmond,Calif.) using SYBR green chemistry. The thermal profile was 95°C for 10 minfollowed by 40 cycles of 60°C for 30 s and 82°C for 30 s. Reactions were carriedout in a 96-well plate in a 25-�l reaction volume containing 7.5 �l SYBR greenSupermix (Bio-Rad), 11.9 �l dH2O, 0.27 �l of each forward and reverse primer(20 nm/ml), and 5 �l of cDNA mixture (1.5 �l cDNA, 148.5 �l dH2O). Eachsample was run in triplicate using cDNA synthesized from E. huxleyi RNA anda negative, no-template control. Because of the absence of established controlgenes for E. huxleyi, normalization of the real-time RT-PCR data was made toaccurately quantified total RNA (33).
Relative gene expression was calculated using the CT method. A mean CT
value for the expression of each gene in the E. huxleyi cultures was obtained fromthe three replicates. Pairwise comparisons were made between the mean CT
value in different E. huxleyi cultures using the following equation: relative ex-pression 2�CT condition 1 � CT condition 2). The relative expression values were convertedto changes (fold [FC]) by taking the additive inverse of all values less than 1 (i.e.,negative FC). As with the cDNA microarray, only results with an FC of 2 or morewere considered significant.
In order to independently test the results of the cDNA microarray, we ran-domly selected a subset of 20 differentially expressed clones for real-time RT-PCR analysis. The relative expression of these transcripts in calcifying versusnoncalcifying E. huxleyi 1516 cultures 7 days postinoculation was analyzed byreal-time RT-PCR and compared to the results of the competitive microarrayhybridization. Those clones for which the direction of real-time RT-PCR FC wasin agreement with the cDNA microarray were considered to be successfullyvalidated.
To distinguish potential biomineralization genes from those associated withphosphate limitation, we ran all working real-time RT-PCR primer sets usingcDNA from the noncalcifying E. huxleyi 1516 cultures and cDNA synthesizedfrom RNA derived from calcifying cultures of E. huxleyi strain B39. Both cultureswere grown in phosphate-replete f/2 media. Real-time RT-PCR results werethen compared to microarray analysis results.
Nucleotide sequence acccession numbers. The sequences of the E. huxleyigenes have been deposited in the GenBank database under accession no.DQ658243 to DQ658369.
VOL. 72, 2006 COCCOLITHOPHORE cDNA MICROARRAY 5515
on Novem
ber 30, 2018 by guesthttp://aem
.asm.org/
Dow
nloaded from

RESULTS
Microarray hybridization. The microarray hybridizationsexhibited a high degree of specificity to the fluorescently la-beled E. huxleyi probe sequences. There was little or no de-tectable signal from the blocking controls or the panel of neg-ative controls representing bacterial gene sequences. Stronghybridization signals were recorded by the positive and dopingcontrols. The high specificity of the E. huxleyi microarrays wasindicated by the considerable variation in signal intensityacross the elements; intensities that spanned 4 orders of mag-nitude (Fig. 3a and b). The correlation of the log ratio expres-sion profiles was considered to be satisfactory across the 10
technical replicates, ranging from 0.55 to 0.98 with mean of0.76. Expression profiles within experimental replicates exhib-ited mean correlation coefficients of 0.87 and 0.86, while cor-relation coefficients across experimental replicates were muchlower. The median coefficient of variation across arrays wasfound to be 31% and also reflects acceptable but less thanoptimal reproducibility. After filtering, however, the mediancoefficient of variation dropped to 14%. Factors influencinghybridization efficiency such as probe sequence complexity,secondary structure of the target, and the relative position ofprobe binding sites to the target interfere with the simplecorrelation of probe signal ratios and relative abundances of
FIG. 3. Images and statistical analysis of competitively hybridized cDNA microarrays. (a) Image of the entire cDNA microarray after dye swapexperiment. Phosphate-limited f/2 1516 cultures are green, and phosphate-replete f/2 1516 cultures are red). (b) Upper right quadrant of themicroarray with standard labeling. Phosphate-replete 1516 cultures are green, and phosphate-limited 1516 cultures are red). (c) Statistical analysisof interrogated genes whereby the P value derived from a paired t test is plotted the microarray FC determined by the ratio of the fluorescencemedians (phosphate limited versus phosphate replete).
5516 QUINN ET AL. APPL. ENVIRON. MICROBIOL.
on Novem
ber 30, 2018 by guesthttp://aem
.asm.org/
Dow
nloaded from
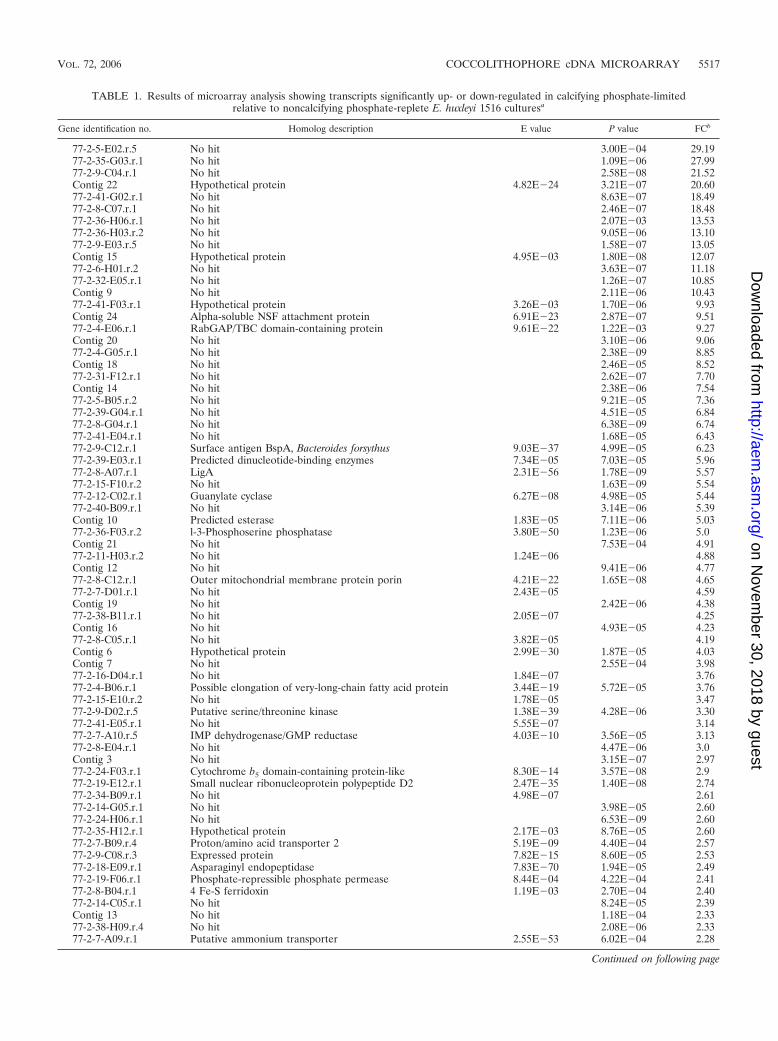
TABLE 1. Results of microarray analysis showing transcripts significantly up- or down-regulated in calcifying phosphate-limitedrelative to noncalcifying phosphate-replete E. huxleyi 1516 culturesa
Gene identification no. Homolog description E value P value FCb
77-2-5-E02.r.5 No hit 3.00E�04 29.1977-2-35-G03.r.1 No hit 1.09E�06 27.9977-2-9-C04.r.1 No hit 2.58E�08 21.52Contig 22 Hypothetical protein 4.82E�24 3.21E�07 20.6077-2-41-G02.r.1 No hit 8.63E�07 18.4977-2-8-C07.r.1 No hit 2.46E�07 18.4877-2-36-H06.r.1 No hit 2.07E�03 13.5377-2-36-H03.r.2 No hit 9.05E�06 13.1077-2-9-E03.r.5 No hit 1.58E�07 13.05Contig 15 Hypothetical protein 4.95E�03 1.80E�08 12.0777-2-6-H01.r.2 No hit 3.63E�07 11.1877-2-32-E05.r.1 No hit 1.26E�07 10.85Contig 9 No hit 2.11E�06 10.4377-2-41-F03.r.1 Hypothetical protein 3.26E�03 1.70E�06 9.93Contig 24 Alpha-soluble NSF attachment protein 6.91E�23 2.87E�07 9.5177-2-4-E06.r.1 RabGAP/TBC domain-containing protein 9.61E�22 1.22E�03 9.27Contig 20 No hit 3.10E�06 9.0677-2-4-G05.r.1 No hit 2.38E�09 8.85Contig 18 No hit 2.46E�05 8.5277-2-31-F12.r.1 No hit 2.62E�07 7.70Contig 14 No hit 2.38E�06 7.5477-2-5-B05.r.2 No hit 9.21E�05 7.3677-2-39-G04.r.1 No hit 4.51E�05 6.8477-2-8-G04.r.1 No hit 6.38E�09 6.7477-2-41-E04.r.1 No hit 1.68E�05 6.4377-2-9-C12.r.1 Surface antigen BspA, Bacteroides forsythus 9.03E�37 4.99E�05 6.2377-2-39-E03.r.1 Predicted dinucleotide-binding enzymes 7.34E�05 7.03E�05 5.9677-2-8-A07.r.1 LigA 2.31E�56 1.78E�09 5.5777-2-15-F10.r.2 No hit 1.63E�09 5.5477-2-12-C02.r.1 Guanylate cyclase 6.27E�08 4.98E�05 5.4477-2-40-B09.r.1 No hit 3.14E�06 5.39Contig 10 Predicted esterase 1.83E�05 7.11E�06 5.0377-2-36-F03.r.2 l-3-Phosphoserine phosphatase 3.80E�50 1.23E�06 5.0Contig 21 No hit 7.53E�04 4.9177-2-11-H03.r.2 No hit 1.24E�06 4.88Contig 12 No hit 9.41E�06 4.7777-2-8-C12.r.1 Outer mitochondrial membrane protein porin 4.21E�22 1.65E�08 4.6577-2-7-D01.r.1 No hit 2.43E�05 4.59Contig 19 No hit 2.42E�06 4.3877-2-38-B11.r.1 No hit 2.05E�07 4.25Contig 16 No hit 4.93E�05 4.2377-2-8-C05.r.1 No hit 3.82E�05 4.19Contig 6 Hypothetical protein 2.99E�30 1.87E�05 4.03Contig 7 No hit 2.55E�04 3.9877-2-16-D04.r.1 No hit 1.84E�07 3.7677-2-4-B06.r.1 Possible elongation of very-long-chain fatty acid protein 3.44E�19 5.72E�05 3.7677-2-15-E10.r.2 No hit 1.78E�05 3.4777-2-9-D02.r.5 Putative serine/threonine kinase 1.38E�39 4.28E�06 3.3077-2-41-E05.r.1 No hit 5.55E�07 3.1477-2-7-A10.r.5 IMP dehydrogenase/GMP reductase 4.03E�10 3.56E�05 3.1377-2-8-E04.r.1 No hit 4.47E�06 3.0Contig 3 No hit 3.15E�07 2.9777-2-24-F03.r.1 Cytochrome b5 domain-containing protein-like 8.30E�14 3.57E�08 2.977-2-19-E12.r.1 Small nuclear ribonucleoprotein polypeptide D2 2.47E�35 1.40E�08 2.7477-2-34-B09.r.1 No hit 4.98E�07 2.6177-2-14-G05.r.1 No hit 3.98E�05 2.6077-2-24-H06.r.1 No hit 6.53E�09 2.6077-2-35-H12.r.1 Hypothetical protein 2.17E�03 8.76E�05 2.6077-2-7-B09.r.4 Proton/amino acid transporter 2 5.19E�09 4.40E�04 2.5777-2-9-C08.r.3 Expressed protein 7.82E�15 8.60E�05 2.5377-2-18-E09.r.1 Asparaginyl endopeptidase 7.83E�70 1.94E�05 2.4977-2-19-F06.r.1 Phosphate-repressible phosphate permease 8.44E�04 4.22E�04 2.4177-2-8-B04.r.1 4 Fe-S ferridoxin 1.19E�03 2.70E�04 2.4077-2-14-C05.r.1 No hit 8.24E�05 2.39Contig 13 No hit 1.18E�04 2.3377-2-38-H09.r.4 No hit 2.08E�06 2.3377-2-7-A09.r.1 Putative ammonium transporter 2.55E�53 6.02E�04 2.28
Continued on following page
VOL. 72, 2006 COCCOLITHOPHORE cDNA MICROARRAY 5517
on Novem
ber 30, 2018 by guesthttp://aem
.asm.org/
Dow
nloaded from

the corresponding target molecules. For these reasons, at-tempts were made herein to independently validate microarrayresults using real-time RT-PCR.
Of the 2,298 EST sequences analyzed by microarray analysis,
62% of the elements registered a signal that was significantlygreater than that of the background in one of the two channels.Differential expression of greater than twofold in the calcifyingcells grown in low phosphate, relative to noncalcifying cells
TABLE 1—Continued
Gene identification no. Homolog description E value P value FCb
77-2-41-E09.r.1 Arachidonate 15-lipoxygenase, second type 5.34E�05 4.29E�03 2.2677-2-40-E03.r.1 No hit 2.14E�06 2.2277-2-7-H02.r.2 4-Aminobutyrate aminotransferase 9.05E�103 1.45E�04 2.1377-2-19-C01.r.1 Putative gamma-carbonic anhydrase 1.73E�48 3.31E�05 2.1077-2-16-F04.r.1 Hypothetical protein 8.29E�14 4.17E�04 2.0977-2-1-A06.r.1 Hypothetical protein 8.30E�13 4.00E�04 2.0677-2-7-B11.r.5 Hypothetical protein 1.85E�14 2.73E�04 2.0677-2-35-D05.r.1 No hit 3.70E�04 2.05Contig 17 No hit 2.10E�04 2.0477-2-7-G03.r.2 Similar to ankyrin 2 1.44E�18 1.38E�03 2.0477-2-30-H04.r.1 Aspartate aminotransferase 5.02E�95 6.91E�05 2.0277-2-15-F09.r.2 No hit 2.46E�04 2.0177-2-11-H04.r.3 No hit 4.24E�04 �2.0277-2-11-G02.r.1 No hit 4.05E�03 �2.0377-2-11-A09.r.1 No hit 1.04E�04 �2.0577-2-11-A05.r.1 No hit 9.82E�03 �2.0777-2-19-H01.r.1 N-Acetylneuraminic acid phosphate synthase 3.92E�17 5.36E�04 �2.1177-2-33-C08.r.1 Hypothetical protein 1.59E�03 3.28E�05 �2.1377-2-11-C12.r.5 No hit 2.39E�04 �2.1477-2-19-B04.r.1 Conserved hypothetical protein 7.24E�09 7.55E�07 �2.2077-2-10-C04.r.2 No hit 3.64E�05 �2.2677-2-19-G10.r.1 No hit 6.05E�04 �2.27Contig 5 Fucoxanthin-chlorophyll a to c binding protein F 6.58E�09 1.02E�03 �2.3177-2-11-A12.r.1 No hit 2.39E�04 �2.4577-2-10-D09.r.3 No hit 2.85E�05 �2.5777-2-14-F02.r.1 No hit 5.35E�07 �2.6477-2-14-B10.r.1 No hit 2.78E�06 �2.7277-2-16-A09.r.1 No hit 1.20E�03 �2.7477-2-12-F03.r.2 Proteophosphoglycan 2.35E�03 2.19E�03 �2.8077-2-5-F11.r.4 Proteasome alpha subunit 4.13E�77 3.90E�06 �2.8477-2-5-H09.r.3 No hit 1.16E�03 �2.8777-2-33-D03.r.1 No hit 1.76E�05 �2.9177-2-24-F09.r.1 No hit 3.73E�03 �2.97Contig 23 Ac1147 4.34E�25 5.13E�05 �3.0477-2-30-E06.r.1 No hit 2.28E�03 �3.3277-2-38-F06.r.1 No hit 7.67E�05 �3.4077-2-39-H02.r.2 GA12046-PA 7.51E�13 9.79E�04 �3.5777-2-3-B03.r.2 Cysteine protease 1.01E�60 4.77E�04 �3.8277-2-30-E07.r.1 Hypothetical protein 2.12E�149 3.79E�03 �3.8377-2-12-D03.r.1 Novel protein 2.00E�10 1.24E�03 �3.9377-2-30-G06.r.1 Phosphoglycerate/bisphosphoglycerate mutase family protein 4.60E�18 7.24E�04 �3.9477-2-12-E01.r.2 No hit 5.87E�03 �3.9477-2-24-E01.r.1 No hit 5.20E�04 �4.0377-2-4-H01.r.2 No hit 4.71E�05 �4.30Contig 4 Fucoxanthin chlorophyll a/c protein 5.65E�24 5.90E�08 �4.3477-2-12-F04.r.1 Predicted permeases 2.93E�39 7.18E�03 �4.43Contig 25 No hit 2.12E�05 �4.5877-2-12-B04.r.1 No hit 3.34E�03 �4.5977-2-24-D02.r.1 Sulfatase 1 precursor 8.29E�71 8.16E�04 �4.6677-2-24-H08.r.1 Peptidyl-prolyl cis-trans-isomerase 1.23E�19 4.09E�03 �4.8077-2-24-E02.r.1 No hit 1.14E�04 �4.8077-2-11-A10.r.5 Trypsin 5.78E�31 6.48E�04 �4.8277-2-31-F09.r.1 No hit 5.47E�07 �5.2377-2-31-C11.r.1 No hit 1.92E�05 �5.3877-2-29-H11.r.1 No hit 1.09E�06 �5.7677-2-12-C05.r.1 Proteophosphoglycan 6.16E�04 6.84E�03 �5.9377-2-2-B09.r.1 Similar to kinesin light chain 1.93E�03 �6.2977-2-19-E11.r.1 No hit 3.02E�04 �6.3277-2-7-A05.r.1 Unnamed protein product 1.88E�12 9.02E�08 �6.6677-2-16-G05.r.1 No hit 2.08E�04 �10.59
a The results of a translated query to the NCBI peptide database are shown, including homologues with an E value of �10�2.b Relative gene expression is expressed as FC with the corresponding P value. For assembled contigs, a mean FC value is given.
5518 QUINN ET AL. APPL. ENVIRON. MICROBIOL.
on Novem
ber 30, 2018 by guesthttp://aem
.asm.org/
Dow
nloaded from

grown in phosphate-replete media, was exhibited by 187 tran-scripts at the 95% confidence level; a total of 133 of thesetranscripts exhibited a P value below the Bonferroni value (P �1.366 � 10�5). A plot of P value against FC of the genesincluded in the statistical analysis is shown in Fig. 3c. Amongthe differentially expressed transcripts, 26 exhibited a changeof greater than 10-fold, with the maximum change being 30-fold. The full-length sequences for all but six of the corre-sponding differentially-expressed cDNA clones were obtained.Because several of the clones shared a high degree of sequencesimilarity, sequences were assembled using Phrap. Sixty of thesequences were found to be redundant, bringing the total num-ber of unique differentially expressed sequences to 127. Ofthese sequences, 79 were found to be up-regulated in calcifyingcells grown in low-phosphate media and 48 were found to bedown-regulated under these same conditions (Tables 1 and 2).An attempt to putatively identify the function of each of the127 transcripts was made using BLASTX homology searchesagainst known proteins in GenBank (Table 1). The cellularfunction of the 45 transcripts returning significant hits variedand included vesicular trafficking, cell signaling, lipid biosyn-thesis, transport, and general metabolism. The function of themajority (a total of 82) of the transcripts, however, could not bepredicted.
Real-time RT-PCR validation. Working real-time RT-PCRprimer sets were designed for a total of 82 of the 127 differ-entially expressed transcripts identified by microarray analysis.Primer sets designed to 25 additional transcripts either failedto yield an amplification signal or did not elicit a single ampli-fication product; viable primer sets could not be found for theremaining 20 transcripts. Twenty differentially expressed tran-scripts were randomly selected from the 82 working primer
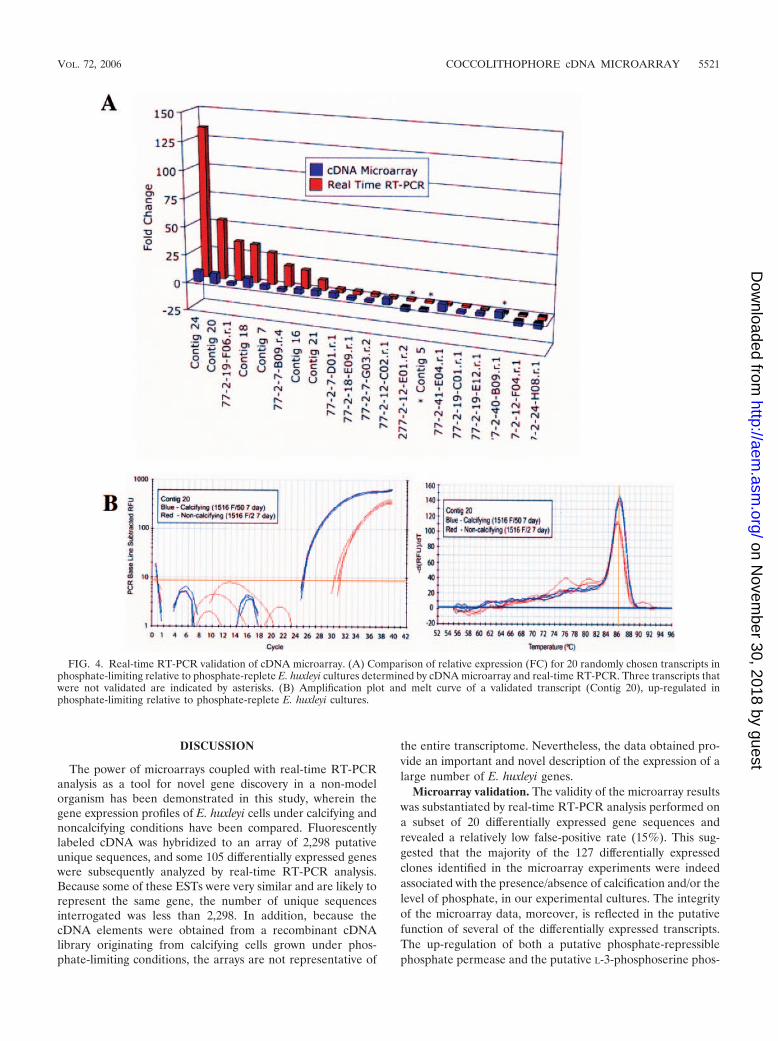
sets. Their relative gene expression in calcifying and noncalci-fying E. huxleyi 1516 cultures was determined by real-timeRT-PCR and compared to cDNA microarray analysis results.Of this subset, a total of 17 (85%) were successfully validated(Table 3 and Fig. 4). The real-time RT-PCR FC of these 17transcripts, calculated using the CT method (Fig. 4B) was inthe same direction recorded in the cDNA microarray (Fig.4A). FCs for individual transcripts, however, differed in mag-nitude, highlighting differences in the sensitivity and specificityof the two techniques (Fig. 4A). The FC recorded by real-timeRT-PCR was higher for 10 of the transcripts, reflecting thegreater sensitivity of real-time RT-PCR analysis. For example,the relative expression of contig 20 was measured and found tobe 53-fold higher in calcifying versus noncalcifying cells byreal-time RT-PCR (Fig. 4B) and only 9-fold higher when mea-sured by microarray analysis (Fig. 4A). The relative FC waslower in eight cases when measured by real-time RT-PCR ascompared to microarray analysis, which may in part be due tothe greater specificity afforded by real-time RT-PCR.
Calcification versus phosphate limitation. Among the 82differentially expressed sequences for which we could designworking primer sets yielding a single real-time RT-PCR am-plification product, 46 exhibited concordant microarray andreal-time RT-PCR analysis results in terms of the direction ofdifferential expression. These transcripts, of which 38 weresignificantly up-regulated and eight were significantly down-regulated, are likely to be involved in some aspect of calcifi-cation and coccolithogenesis in E. huxleyi (Table 3 and Fig.5A). Figure 5C shows the real-time RT-PCR amplification plotand corresponding melt curve of a transcript whose functionremains to be determined (77-2-2-E05) that yielded concor-dant up-regulation in calcifying cells over noncalcifying cells.This particular transcript was found to be up-regulated 28.2-fold in calcifying 1516 cells as determined by microarray anal-ysis and was up-regulated 48.5-fold in calcifying B39 cells overnoncalcifying 1516 cells by real-time RT-PCR analysis. Theamplification plot and corresponding melt curve of a transcriptexhibiting concordant down-regulation in calcifying cells (77-2-29-H11) is shown in Fig. 5B. While the function of 77-2-29-H11 alsoremains to be defined, it was found to be down-regulated5.8-fold by microarray analysis and 25-fold by real-time RT-PCR analysis in calcifying cells.
A total of 19 transcripts appear to be involved in phosphatelimitation. These transcripts were found to be significantly up-or down-regulated by microarray analysis when comparing cal-cifying and noncalcifying 1516 cultures in phosphate-limitedand phosphate-replete media, respectively, but were not “sig-nificantly” different in terms of a twofold threshold when com-paring their expression in calcifying B39 and noncalcifyingcultures of 1516 under identical phosphate-replete growthconditions. This suggests that the differential expression ob-served when comparing calcifying and noncalcifying cellsunder phosphate-limiting and phosphate-replete conditions,respectively, is a function of phosphate levels rather thancalcification. Transcripts encoding transport proteins, pre-dicted permeases, and proteins involved in intermediarymetabolism were among those whose expression appears tobe regulated to some degree by phosphate availability. Theremaining 17 sequences exhibited discordant microarrayand real-time RT-PCR results and most likely represent
TABLE 2. Real-time RT-PCR validation of cDNA microarrayrelative gene expression
Gene identification no.aFC byb:
Microarray Real-time RT-PCR
Contig 24 9.51 134.05Contig 20 9.06 53.2077-2-19-F06.r.1 2.41 35.10Contig 18 8.52 34.30Contig 7 3.98 28.5177-2-7-B09.r.4 2.57 18.38Contig 16 4.23 16.37Contig 21 4.91 9.4077-2-7-D01.r.1 4.59 3.1777-2-18-E09.r.1 2.49 3.1777-2-7-G03.r.2 2.04 2.6477-2-12-C02.r.1 5.44 2.0577-2-12-E01.r.2 �3.94 1.87*Contig 5 �2.31 1.74*77-2-41-E04.r.1 6.43 1.6677-2-19-C01.r.1 2.10 1.6677-2-19-E12.r.1 2.74 1.6677-2-40-B09.r.1 5.39 1.0277-2-12-F04.r.1 �4.43 �1.23*77-2-24-H08.r.1 �4.80 �3.03
a Twenty transcripts up- and down-regulated in cDNA microarray randomlyselected for real-time RT-PCR analysis.
b Relative gene expression in phosphate-limiting relative to phosphate-repleteE. huxleyi cultures expressed as FC. Asterisks indicate transcripts that were notvalidated by real-time RT-PCR.
VOL. 72, 2006 COCCOLITHOPHORE cDNA MICROARRAY 5519
on Novem
ber 30, 2018 by guesthttp://aem
.asm.org/
Dow
nloaded from

either false positives or strain-specific expression differencesthat have little to do with calcification. These transcripts arelisted along with those likely to be involved in phosphatelimitation in Table 4.
In a recent study, Dyhram and colleagues (9) applied longSAGE to identify E. huxleyi transcripts responsive to nitrogen orphosphate starvation. Upon sequencing 11,578 tags, Dyhram andcoinvestigators identified 74 unique or differentially expressedsequences from their phosphate-starved library. While 69 ofour differentially expressed transcripts (59%) were representedby one or more of their sequence tags, only 8 of these se-quences were identified as being uniquely present or up-regu-lated twofold or greater in their phosphate-starved library. Fiveof these gene sequences appear to be more likely associated
with calcification as opposed to phosphate limitation or star-vation. Transcripts identified in using both microarray andSAGE analysis included a phosphate-repressible phosphatepermease, two different fucoxanthin chlorophyll a/c bindingproteins, a probable 18S rRNA transcript, and four other se-quences with no meaningful BLASTX hits. Of these tran-scripts, the phosphate-repressible permease, one of the fuco-xanthin chlorophyll a/c binding proteins, and three transcriptsof unknown function appear to be expressed in response tocalcification rather than phosphate starvation. The similaritiesand differences noted when comparing SAGE and microarrayanalysis highlight the importance of employing complementaryapproaches to address and help resolve complex metabolicprocesses.
TABLE 3. Transcripts most likely to be involved in biomineralization based upon microarray and real-time RT-PCR analyses
Gene identification no.a Homolog descriptionbFC by:
Microarray Real-time RT PCR
77-2-14-G05.r.1 No hit 2.60 64.0077-2-5-E02.r.5 No hit 29.19 48.50Contig 16 No hit 4.23 42.2277-2-15-F09.r.2 No hit 2.01 32.75Contig 7 No hit 3.98 30.5577-2-7-G03.r.2 Similar to ankyrin 2 2.04 28.5177-2-35-D05.r.1 No hit 2.05 24.8277-2-19-C01.r.1 Gamma-carbonic anhydrase 24.25 2.10Contig 20 No hit 9.06 19.7077-2-1-A06.r.1 Hypothetical protein 2.06 18.3877-2-6-H01.r.2 No hit 11.18 16.76Contig 3 No hit 2.97 16.7677-2-7-A10.r.5 IMP dehydrogenas/GMP reductase e 3.13 16.37Contig 14 No hit 7.54 16.0077-2-32-E05.r.1 No hit 10.85 12.41Contig 18 No hit 8.52 12.1377-2-41-E04.r.1 No hit 6.43 11.8577-2-8-C05.r.1 No hit 4.19 11.31Contig 17 No hit 2.04 9.8577-2-40-E03.r.1 No hit 2.22 8.98Contig 10 Predicted esterase 5.03 8.67Contig 24 Alpha-soluble NSF attachment protein 9.51 7.4677-2-39-G04.r.1 No hit 6.84 7.4677-2-24-F03.r.1 Cytochrome b5 domain-containing protein like 2.90 6.96Contig 22 Hypothetical protein 20.6 6.8177-2-9-C12.r.1 Surface antigen BspA, Bacteroides forsythus 6.23 5.6677-2-36-F03.r.2 L-3-phosphoserine phosphatase 5.00 5.53Contig 21 No hit 4.91 4.1977-2-4-B06.r.1 Possible elongation of very-long-chain fatty acid protein 3.76 3.8277-2-41-E09.r.1 Arachidonate 15-lipoxygenase, second type 2.26 3.2577-2-19-F06.r.1 Phosphate-repressible phosphate permease 2.41 3.1777-2-24-H06.r.1 No hit 2.60 3.17Contig 15 Hypothetical protein 12.07 2.7677-2-4-G05.r.1 No hit 8.85 2.2477-2-19-E12.r.1 Small nuclear ribonucleoprotein polypeptide D2 2.74 2.1977-2-8-B04.r.1 4 Fe-S ferridoxin 2.40 2.1977-2-7-B11.r.5 Hypothetical protein 2.06 2.0577-2-3-B03.r.2 Cysteine protease �3.82 �2.2777-2-5-H09.r.3 No hit �2.87 �5.2677-2-10-C04.r.2 No hit �2.26 �5.2677-2-14-F02.r.1 No hit �2.64 �6.25Contig 4 Fucoxanthin chlorophyll a/c protein �4.34 �10.00Contig 23 Ac1147 �3.04 �20.0077-2-29-H11.r.1 No hit �5.76 �25.0077-2-30-E06.r.1 No hit �3.32 �33.30
a Transcript identification number based upon differential expression in calcifying B39 relative to noncalcifying E. huxleyi 1516 cultures grown in phosphate-repletemedia and their differential relative gene expression profiles in calcifying versus noncalcifying 1516 cultures as determined by microarray analysis.
b The results of a translated query to the NCBI peptide database are shown (E value, �10�2).
5520 QUINN ET AL. APPL. ENVIRON. MICROBIOL.
on Novem
ber 30, 2018 by guesthttp://aem
.asm.org/
Dow
nloaded from
DISCUSSION
The power of microarrays coupled with real-time RT-PCRanalysis as a tool for novel gene discovery in a non-modelorganism has been demonstrated in this study, wherein thegene expression profiles of E. huxleyi cells under calcifying andnoncalcifying conditions have been compared. Fluorescentlylabeled cDNA was hybridized to an array of 2,298 putativeunique sequences, and some 105 differentially expressed geneswere subsequently analyzed by real-time RT-PCR analysis.Because some of these ESTs were very similar and are likely torepresent the same gene, the number of unique sequencesinterrogated was less than 2,298. In addition, because thecDNA elements were obtained from a recombinant cDNAlibrary originating from calcifying cells grown under phos-phate-limiting conditions, the arrays are not representative of
the entire transcriptome. Nevertheless, the data obtained pro-vide an important and novel description of the expression of alarge number of E. huxleyi genes.
Microarray validation. The validity of the microarray resultswas substantiated by real-time RT-PCR analysis performed ona subset of 20 differentially expressed gene sequences andrevealed a relatively low false-positive rate (15%). This sug-gested that the majority of the 127 differentially expressedclones identified in the microarray experiments were indeedassociated with the presence/absence of calcification and/or thelevel of phosphate, in our experimental cultures. The integrityof the microarray data, moreover, is reflected in the putativefunction of several of the differentially expressed transcripts.The up-regulation of both a putative phosphate-repressiblephosphate permease and the putative L-3-phosphoserine phos-
FIG. 4. Real-time RT-PCR validation of cDNA microarray. (A) Comparison of relative expression (FC) for 20 randomly chosen transcripts inphosphate-limiting relative to phosphate-replete E. huxleyi cultures determined by cDNA microarray and real-time RT-PCR. Three transcripts thatwere not validated are indicated by asterisks. (B) Amplification plot and melt curve of a validated transcript (Contig 20), up-regulated inphosphate-limiting relative to phosphate-replete E. huxleyi cultures.
VOL. 72, 2006 COCCOLITHOPHORE cDNA MICROARRAY 5521
on Novem
ber 30, 2018 by guesthttp://aem
.asm.org/
Dow
nloaded from

FIG. 5. Real-time RT-PCR relative gene expression for 63 transcripts significantly up- or down-regulated in calcifying B39 relative tononcalcifying E. huxleyi 1516 cultures grown in phosphate-replete media (red bars). The corresponding cDNA microarray FC data are includedfor comparison (blue bars). Shown are real-time RT-PCR amplification plots (A) and corresponding melt curves of candidate biomineralizationtranscripts showing the differential expression of transcripts that are highly down-regulated, 77-2-29-H11 (B), and highly up-regulated, 77-2-5-E02(C), in calcifying cells. RFU, relative fluorescence units.
5522 QUINN ET AL. APPL. ENVIRON. MICROBIOL.
on Novem
ber 30, 2018 by guesthttp://aem
.asm.org/
Dow
nloaded from

phatase evidenced herein represents a logical adaptive re-sponse to cope with growth under conditions of limited phos-phate availability. The induction of these gene sequences incalcifying E. huxleyi cells is also consistent with the overwhelm-ing body of literature linking phosphate limitation with theprocesses of calcification and coccolith formation in E. huxleyi(2, 9, 21, 29). The reliability of the microarray data is furthersubstantiated by the increased expression of the gene tran-script encoding the calcium binding protein in strain 1516under calcifying conditions. This particular protein was origi-nally isolated from an E. huxleyi cDNA library by screeningwith antibody raised to intracellular polysaccharide fractionsisolated from cells harboring B-type coccoliths (7). Furtherimmunolocalization of the protein (otherwise known as “GPA”because of its high constituent percentage of glutamic acid,proline, and alanine) revealed high concentrations on the sur-face of calcifying and noncalcifying cells. While its function hasyet to be determined, researchers have hypothesized that itmay in conjunction with coccolith polysaccharides be involved
in either the nucleation and growth of CaCO3 crystals or thetransport of Ca2� from the cell exterior to the coccolith-form-ing vesicle.
Phosphate limitation versus calcification. Our microarrayanalysis did not allow us to unambiguously differentiate be-tween changes in gene expression due to biomineralization andchanges due to phosphate limitation. The physiological rele-vance of phosphate limitation and the specificity of microarrayresults in narrowing the search for biomineralization tran-scripts were demonstrated by further analysis performed usingreal-time RT-PCR to compare differentially expressed tran-scripts in strain 1516 and strain B39. Strain B39 calcifies inphosphate-replete media, while strain 1516 does not, andhence comparisons of transcripts across strains were madeunder phosphate-replete conditions and results obtained wereweighed against initial microarray results. A total of 46 differ-entially expressed transcripts identified by microarray analysiswere also significantly differentially expressed when comparingabundance in strains 1516 and B39 under phosphate-replete
TABLE 4. Transcripts most likely to be involved in phosphate limitation and/or microarray false positivesa
Gene identification no. Homolog descriptionb
FC by:
Microarray for1516 P� vs 1516 P�
Real-time RT-PCR forB39 P� vs 1516 P�
77-2-24-D02.r.1 Sulfatase 1 precursor �4.66 106.4077-2-11-H04.r.3 No hit �2.02 23.1677-2-24-E02.r.1 No hit �4.80 18.3877-2-11-C12.r.5 No hit �2.14 18.3877-2-12-E01.r.2 No hit �3.94 10.08Contig 25 No hit �4.58 7.2977-2-12-F03.r.2 Proteophosphoglycan �2.80 6.5077-2-11-A12.r.1 No hit �2.45 2.8377-2-30-E07.r.1 EH domain protein �3.83 1.8777-2-19-G10.r.1 No hit �2.27 1.59Contig 5 Fucoxanthin-chlorophyll A-to-C binding protein F �2.31 1.5277-2-14-C05.r.1 No hit 2.39 1.3577-2-24-E01.r.1 No hit �4.03 1.1877-2-11-A10.r.5 Similar to transmembrane serine protease 9 �4.82 1.1577-2-11-H03.r.2 No hit 4.88 1.0777-2-30-G06.r.1 Phosphoglycerate/bisphosphoglycerate mutase �3.94 1.0277-2-12-C02.r.1 Adenylate cyclase, family 3 5.44 1.0077-2-24-H07.r.1 Peptidyl-prolyl cis-trans-isomerase �4.08 �1.0577-2-24-F09.r.1 No hit �2.97 �1.0877-2-7-B09.r.4 Proton/amino acid transporter 2.57 �1.1277-2-16-A09.r.1 No hit �2.74 �1.12Contig 12 No hit 4.77 �1.1577-2-7-A09.r.1 Putative ammonium transporter 2.28 �1.2377-2-12-F04.r.1 Predicted permeases �4.43 �1.2377-2-33-C08.r.1 hypothetical protein �2.13 �1.2877-2-31-F12.r.1 No hit 7.7077-2-8-A07.r.1. Putative calcium binding protein 5.57 �1.9677-2-8-C12.r.1 Outer mitochondrial membrane protein porin 4.65 �2.5077-2-40-B09.r.1 No hit 5.39 �2.5677-2-16-D04.r.1 No hit 3.76 �2.7877-2-8-E04.r.1 No hit 3.00 �5.26Contig 9 No hit 10.43 �7.1477-2-7-D01.r.1 No hit 4.59 �14.2977-2-18-E09.r.1 Asparaginyl endopeptidase 2.49 �14.2977-2-41-F03.r.1 Hypothetical protein 9.93 �20.0077-2-36-H06.r1 No hit 13.53 �25.00
a Shown are results for transcripts that exhibited differential expression in calcifying 1516 cultures relative to noncalcifying 1516 E. huxleyi cultures grown inphosphate-limited media (P�) relative to noncalcifying cultures of 1516 grown in phosphate-replete media (P�). These transcripts also showed no differential expressionor discordant relative expression in calcifying B39 cultures compared to noncalcifying 1516 cultures when grown in identical phosphate-replete media as determinedby real-time PCR analysis.
b The results of a translated query to the NCBI peptide database are shown (E value of �10�2).
VOL. 72, 2006 COCCOLITHOPHORE cDNA MICROARRAY 5523
on Novem
ber 30, 2018 by guesthttp://aem
.asm.org/
Dow
nloaded from

conditions. These transcripts are most likely involved in bio-mineralization. Another 19 transcripts were differentially ex-pressed in microarray experiments but showed no differentialexpression when transcripts were compared in strains 1516 andB39 under phosphate-replete conditions, and hence the logicalconclusion is that these sequences are more likely to have arole in phosphate limitation. The 17 sequences exhibiting op-posing relative expression levels may represent false positivesor strain-specific differences in gene expression. Unfortunately,we were unable to probe 45 transcripts by real-time RT-PCR,either because suitable primer sets could not be designed orprimers failed to elicit product during real-time RT-PCR anal-ysis or yielded multiple amplification products. Suitable primersets could not be designed for 20 of these sequences, and theother 25 either failed to elicit a signal when subjected to real-time RT-PCR analysis or yielded multiple amplification prod-ucts. The high G�C content of E. huxleyi gene sequencesmakes primer design and the amplification of sequences usingreal-time RT-PCR problematic.
Calcification. The transcripts identified herein as importantto calcification and coccolithogenesis were dominated by se-quences with no GenBank equivalents, and as expected, thosewhose function could be predicted were linked to a variety ofcellular processes. Calcification and coccolithogenesis in cocco-lithophores occur intracellularly and as such are expected toinvolve proteins controlling the nucleation and growth of cal-cium carbonate crystals and crystalline templating as well asproteins responsible for carbon acquisition and ion transport,coccolithosome biogenesis, vesicle-mediated secretory processes,and protein sorting. Hence, the presence of transcripts showingsignificant homology to proteins such as carbonic anhydrase,the phosphate-repressible phosphate permease, an �-solubleN-ethylmaleimide-sensitive attachment protein (SNAP) amongcandidate sequences makes biological sense and is of particularinterest.
A carbonic anhydrase identified in both our microarray andreal-time RT-PCR screens was identified as a candidate bio-mineralization transcript. Carbonic anhydrase is in fact knownto be associated with biomineralization in other organisms.While the protein plays an important role in many physiolog-ical processes, facilitating the transport of inorganic carbonand catalyzing carboxylation/decarboxylation reactions essen-tial to photosynthesis and/or respiration, a gamma carbonicanhydrase from E. huxleyi was found to be linked to biomin-eralization in E. huxleyi by both microarray and real-time RT-PCR analysis. Microarray analysis showed the transcript to beup-regulated twofold in calcifying 1516 cells under phosphate-limiting conditions, while real-time RT-PCR results revealedup-regulation of 25-fold in calcifying B39 cells under phos-phate-replete conditions as compared to the noncalcifying cellsof strain 1516. Carbonic anhydrase-like proteins are involvedin calcium carbonate biomineralization in mollusks (25) as wellas avian eggshell formation (10). In the latter study, research-ers found that carbonic anhydrase increases the rate of crystalgrowth in avian eggshells and works together with two sulfatedextracellular matrix proteins. While its role in the process ofcalcification is hypothesized to be related to carbonate avail-ability rather than nucleation or the regulation of crystalgrowth (25), its importance is underscored by the presence offunctional domains from carbonic anhydrase that have been
identified in the two prominent organic matrix proteins of themollusk shell, Nacrein and N66 (14, 26). This gamma classcarbonic anhydrase cDNA has been expressed in E. coli, andthe recombinant protein has been purified to generate antiserafor localization experiments (29a).
As described above, the up-regulation of the phosphate-repressible phosphate permease in calcifying cells of bothstrain 1516 and B39 is also in accord with much of the litera-ture. Increases in both coccolith production and calcium con-tent have been observed under phosphate limitation in batchand chemostat-maintained cultures of E. huxleyi (21, 29). Ac-cording to the study by Shiraiwa (29), when nutrients such asphosphate and nitrate are adequate, photosynthesis and cellgrowth is enhanced, cell volume is decreased and calcificationis suppressed. When nutrients are restricted, photosynthesisand cell growth are suppressed, resulting in increases in cellvolume and calcification. Details describing the functional sig-nificance and mechanism governing enhanced coccolith pro-duction as a consequence of nutrient limitation and, in par-ticular, phosphate depletion have not been elucidated. Theoverexpression of the phosphate-repressible phosphate per-mease in calcifying cells of strain B39 under phosphate-repleteconditions, however, is somewhat puzzling but nonetheless in-triguing. Perhaps the phosphate permease serves as a sym-porter driving the transport of ions critical to biomineraliza-tion. Alternatively, strain B39 may be genotypically aberrant inthis regard.
The down-regulation of the GPA-encoding transcript seenin the present investigation when comparing by real-time RT-PCR analysis levels in calcifying cells of B39 relative to non-calcifying cells of 1516 was also unexpected and seems tocontradict the notion that GPA plays a central role in biomin-eralization. While GPA may participate in some aspect ofbiomineralization in E. huxleyi, compelling evidence for itsdirect involvement in calcification has not been substantiatedin this study. More detailed time-scale experiments comparingboth transcript and protein levels in calcifying and noncalcify-ing cells may help to clarify this issue. It is important to note,however, that microarrays are only a first approximation ofprotein abundance and as such may not always accurately re-flect the functional significance of particular proteins.
It is tempting to speculate on the role that some of the othercandidate transcripts may play in biomineralization and cocco-lithogenesis. Of particular interest was the induction of a cou-ple of genes that code for protein components of the vesicletrafficking machinery; a putative �-soluble N-ethylmaleimide-sensitive factor attachment protein (SNAP), and a RabGAP/TBC-containing protein. The fusion of vesicles in the secretorypathway in most eucaryotes is mediated by the interaction oft-soluble N-ethylmaleimide-sensitive factor attachment proteinreceptors (t-SNAREs) on the target membrane and v-SNAREson the vesicle membrane (27, 28). While Rab proteins contrib-ute to the specificity of vesicular transport controlling the rateof vesicle docking and matching v-SNAREs and t-SNARES formembrane fusion, SNAP and NSF disassemble the complexafter fusion. In coccolithophores, coccolith formation is knownto occur within a “calcifying vesicle” that is initially juxtaposedto the Golgi apparatus but later moves to cell membrane,where it fuses to extrude the completed coccolith (4). Theenhanced level of expression shown here for putative SNAP
5524 QUINN ET AL. APPL. ENVIRON. MICROBIOL.
on Novem
ber 30, 2018 by guesthttp://aem
.asm.org/
Dow
nloaded from

and RabGAP transcripts in E. huxleyi cells under calcifyingconditions when secretion of coccoliths is increased suggestsSNAREs could potentially govern coccolith vesicle transferand docking processes.
That the 29 transcripts that we have identified herein asbeing candidate biomineralization transcripts in E. huxleyishowed no significant homology to proteins in GenBank orshowed hits to hypothetical proteins or proteins of unknownfunction is not surprising, given the proportionately small num-ber of phytoplankton sequences in GenBank and the lack ofknowledge about proteins involved in processes of biominer-alization across species. Further complicating the situation isthe fact that of the biomineralization proteins described so farfrom marine organisms, few show any sequence similarity toone another (16); prominent biomineralization domains and/ormotifs have yet to emerge. Many of our candidate transcriptsencode proteins that share some of the biochemical and bio-physical properties that are characteristic of biomineralizationproteins such as being small acidic proteins or glycoproteinsthat are elastomeric, rich in Asp and Glu, and contain repeatsequences (1, 11, 39), but these characteristics are not mutuallyexclusive. More detailed cellular localization studies coupledwith in vitro mineralization assays or gene knockouts are re-quired if we are to better define their role in biomineralizationprocesses. We are particularly interested in one of the mostprominent up-regulated transcripts, 77-2-5-E02.r.5, which wasexpressed at levels of 48-fold and 29-fold in calcifying relativeto noncalcifying E. huxleyi cultures as determined by real-timeRT-PCR analysis and microarray analysis, respectively (Table4 and Fig. 5C). The longest open reading frame of this partic-ular transcript encodes a protein of 168 amino acids in lengthand is estimated to be 20,315 Da. It is an alkaline (9.24 pI)protein and is rich in Ala (15.5%) and Gly (10%) residues, buthas no obvious sequence motifs or domains. This particulartranscript has also been successfully cloned and expressed in E.coli (data not shown) for more detailed cellular localizationstudies.
Three transcripts implicated in coccolith biomineralizationmay encode glycoproteins. Although full-length transcripts of77-2-32-E05, 77-2-39-G04, and 77-2-14-G05 returned no sig-nificant BLASTX hits, individual open reading frames identi-fied by ORFinder within these transcripts returned significantBLAST hits to glycoproteins. Many research scientists havefocused their attention on the properties of polysaccharidesfrom coccolithophores and their potential role in biomineral-ization and coccolithogenesis (15, 20). Indeed, acidic polysac-charides (APSs) have been isolated from calcifying strains of E.huxleyi, Gephyrocapsa oceanica, and Pleurochriysis caterae thatcannot be recovered from noncalcifying strains (3, 19). Exper-iments in vitro further show the APSs have high affinity forcalcium and can inhibit the deposition of calcium carbonatecrystals in solution. Although the relationship between theability of APSs to inhibit calcification in solution in vitro andthe function of coccolith formation in vivo is unclear, West-broek et al. (37a) suggest polysaccharides anchored to theinner membrane of the coccolithosome form a meshwork thatfills the vesicle and governs the orientation and growth of thecrystalline units once nucleation has been promoted. Thus,further characterization of the putative glycoprotein tran-
scripts identified herein and determination of their cellularlocation may be warranted.
It is also unclear whether APSs, proteins, and/or both governbiomineralization processes in coccolithophores. To date mostof the studies aimed at identifying macromolecules involved incoccolith formation have attempted to extract and purify com-pounds by dissolving coccoliths (15). While soluble compo-nents of E. huxleyi coccoliths have been analyzed in this man-ner, the insoluble organic fractions have not. In addition, theorganic macromolecules that are responsible for tight controlof crystal growth may be varied and present only in minuteamounts. Biochemical extraction procedures are prejudicedand favor the recovery of only the most abundant macro-molecular species: hence, the need for alternative techniquessuch as microarray analysis and real-time RT-PCR, which to-gether enable gene transcripts to be interrogated in a compre-hensive and quantitative manner.
Conclusions. The results from this investigation representpreliminary information that will be invaluable in future func-tional genomics work aimed at defining the role of the manytranscripts present on the array whose identity and functionare unknown. For example, the existence of a large number ofgenes responsive to phosphate starvation, a subset of whichappear to be biomineralization specific, suggests that E. huxleyiis endowed with a phosphate starvation regulon and possibly abiomineralization regulon as well. Genes specific to phosphatelimitation and/or biomineralization can be further analyzed bystudying the promoter regions. Gene sequences of this naturehave not been previously available for this type of analysis. Thedata set described here also includes genes whose expressionlevels vary significantly. Bioinformatics analysis of several hun-dred such promoters may offer insights into cis-activation ele-ments responsible for regulating the expression of genes in-volved in biomineralization. Promoters can be used to identifyand clone corresponding trans-activating elements using yeastone-hybrid screening or other similar approaches.
Coccolithogenesis in E. huxleyi is a complicated process thatis regulated both temporally and spatially. Our knowledge ofthe molecular and cellular underpinnings of this importantbiological process has been limited. However, tremendous ef-forts have been made to understand the molecular basis ofbiomineralization on a genome-wide scale, and significantprogress has been made (9, 17, 35, 36). This microarray-basedstudy represents an important first step in understanding themechanisms governing biomineralization in coccolithophoresand establishing microarray analysis methods for E. huxleyi. Aspecific set of differentially expressed genes under growth con-ditions of phosphate deficiency and enhanced calcification hasbeen identified and further partitioned into subsets of tran-scripts: (i) those likely to be involved in phosphate limitationand (ii) those likely to be involved in biomineralization. Whilethe putative function of the majority of candidate biomineral-ization transcripts we identified herein is unknown, this wasnot surprising given the low number of genes identified inother biomineralizing organisms. However, the data presentedherein will allow for cellular localization and in vitro biomin-eralization analysis of some of these genes and will thus pro-vide clues to key aspects governing coccolithogenesis in E.huxleyi.
VOL. 72, 2006 COCCOLITHOPHORE cDNA MICROARRAY 5525
on Novem
ber 30, 2018 by guesthttp://aem
.asm.org/
Dow
nloaded from

ACKNOWLEDGMENT
This work has been supported by MBRS-SCORE grant GM 05983from the National Institutes of Health.
REFERENCES
1. Addadi, L., and S. Weiner. 1985. Interactions between acidic proteins andcrystals: stereochemical requirements in biomineralization. Proc. Natl. Acad.Sci. USA 82:4110–4114.
2. Andersen, O. K. 1981. Coccolith formation and calcification in an N-cellculture of Emiliania huxleyi during phosphorus-limited growth in batch andchemostat cultures. Ph.D. thesis. University of Oslo, Oslo, Norway.
3. Borman, A. H., E. W. de Vrind de Jong, P. W. R. Thierry, and L. Bosch.1987. Coccolith-associated polysaccharides from cells of Emiliania huxleyi(Haptophyceae). J. Phycol. 23:118–134.
4. Brownlee, C. W., and A. Taylor. 2004. Calcification in coccolithophores: acellular perspective. Springer Verlag, Berlin, Germany.
5. Cleveland, H. C., J. Quackenbush, and A. Brazma. 2003. Microarray geneexpression data analysis: a beginner’s guide. Blackwell Science Ltd., Oxford,United Kingdom.
6. Corstjens, P. L. A. M., Y. Araki, and E. L. Gonzalez. 2001. A coccolithophoridcalcifying vesicle with a vacuolar-type ATPase proton pump: cloning and im-munolocalization of the V0 subunit c. J. Phycol. 37:71–78.
7. Corstjens, P. L. A. M., A. van der Kooij, C. Linschooten, G.-J. Brouwers, P.Westbroek, and E. W. de Vrind-de Jong. 1998. GPA, a calcium-binding proteinin the coccolithophorid Emiliania huxleyi (Prymnesiophyceae). J. Phycol. 34:622–630.
8. DeRisi, J. L., V. R. Iyer, and P. O. Brown. 1997. Exploring the metabolic andgenetic control of gene expression on a genomic scale. Science 278:680–686.
9. Dyhrman, S. T., S. T. Haley, S. R. Birkeland, L. L. Wurch, M. J. Cipriano,and A. G. McArthur. 2006. Long serial analysis of gene expression for genediscovery and transcriptome profiling in the widespread marine coccolitho-phore Emiliania huxleyi. Appl. Environ. Microbiol. 72:252–260.
10. Fernandez, M. S., K. Passalacqua, J. I. Arias, and J. L. Arias. 2004. Partialbiomimetic reconstruction of avian eggshell formation. J. Struct. Biol. 148:1–10.
11. Gotliv, B.-A., L. Addadi, and S. Weiner. 2003. Mollusk shell acidic proteins:in search of individual functions. Chem. Bio. Chem. 4:522–529.
12. Gracey, A. Y., J. V. Troll, and G. N. Somero. 2001. Hypoxia-induced geneexpression profiling in the euryoxic fish Gillichthys mirabilis. Proc. Natl.Acad. Sci. USA 98:1993–1998.
13. Jordon, R. W., L. Cros, and J. R. Young. 2004. A revised classificationscheme for living haptophytes. Micropaleontology 50:55–79.
14. Kono, M., N. Hayashi, and T. Samata. 2000. Molecular mechanism of thenacreous layer formation in Pinctada maxima. Biochem. Biophys. Res. Com-mun. 269:213–218.
15. Marsh, M. E. 2003. Regulation of CaCO3 formation in coccolithophores.Comp. Biochem. Physiol. 136:743–754.
16. Nagasawa, H. 2004. Macromolecules in biominerals of aquatic organisms.Thalassas 20:15–24.
17. Nguyen, B., R. M. Bowers, T. M. Wahlund, and B. A. Read. 2005. Suppressivesubtractive hybridization of and differences in gene expression content ofcalcifying and noncalcifying cultures of Emiliania huxleyi strain 1516. Appl.Environ. Microbiol. 71:2564–2575.
18. Okamoto, O. K., and J. W. Hastings. 2003. Genome-wide analysis of redox-regulated genes in a dinoflagellate. Gene 4:73–81.
19. Ozaki, N., S. Sakuda, and H. Nagasawa. 2001. Isolation and some charac-terization of an acidic polysaccharide with anti-calcification activity fromcoccoliths of a marine alga, Pleurochrysis carterae. Biosci. Biotechnol. Bio-chem. 65:2330–2333.
20. Paasche, E. 2002. A review of the coccolithophorid Emiliania huxleyi(Prymnesiophyceae), with particular reference to growth, coccolith formation,and calcification-photosynthesis interactions. Phycol. Rev. 40:503–529.
21. Paasche, E. 1998. Roles of nitrogen and phosphorus in coccolith formationin Emiliania huxleyi (Prymnesiophyceae). Eur. J. Phycol. 33:33–42.
22. Peplies, J., S. C. Lau, J. Pernthaler, R. Amann, and F. O. Glockner. 2004.
Application and validation of DNA microarrays for the 16S rRNA-basedanalysis of marine bacterioplankton. Environ. Microbiol. 6:638–645.
23. Quinn, P. S., A. G. Saez, K-H. Baumann, B. A. Steel, C. Sprengel, and L. K.Medlin. 2004. Coccolithophorid biodiversity: evidence from the cosmopoli-tan species Calcidiscus leptoporus, p. 299–326. In H. R. Thierstein and J. R.Young (ed.), Coccolithophores: from molecular processes to global impact.Springer, Berlin, Germany.
24. Saez, A. G., I. Probert, M. Geisen, P. Quinn, and L. K. Medlin. 2003.Pseudo-cryptic speciation in coccolithophores. Proc. Natl. Acad. Sci. USA100:7163–7168.
25. Samata, T. 2004. Recent advances in studies on nacreous layer biomineral-ization. Molecular and cellular aspects. Thalassas 20:25–44.
26. Samata, T., and M. Kono. 2000. Relationship between the structure ofprotein in shells and aragonite formation. Kaiyo Monthly 32:373–378.
27. Sanderfoot, A. A., F. F. Assaad, and N. V. Raikhel. 2000. The Arabidopsisgenome. An abundance of soluble N-ethylmaleimide-sensitive factor adaptorprotein receptors. Plant Physiol. 124:1558–1569.
28. Sanderfoot, A. A., and N. V. Raikhel. 1999. The specificity of vesicle traf-ficking: coat proteins and SNAREs. Plant Cell 11:629–642.
29. Shiraiwa, Y. 2003. Physiological regulation of carbon fixation in the photo-synthesis and calcification of coccolithophorids. Comp. Biochem. Physiol. BBiochem. Mol. Biol. 136:775–783.
29a.Soto, A. R., H. Zheng, D. Shoemaker, J. Rodriguez, B. A. Read, and T. M.Wahlund. 2006. Identification and preliminary characterization of twocDNAs encoding unique carbonic anhydrases from the marine alga Emil-iania huxleyi. Appl. Environ. Microbiol. 72:5500–5511.
30. Strommer, J., R. Gregerson, and M. Vayda. 1993. Isolation and character-ization of plant mRNA, p. 49–66. In B. R. Glick and J. E. Thompson (ed.),Methods in plant molecular biology and biotechnology. CRC Press, BocaRaton, Fla.
31. Stupp, S. I., and P. V. Braun. 1997. Molecular manipulation of microstruc-tures: biomaterials, ceramics, semiconductors. Science 277:1242–1248.
32. Sudarsanam, P., V. R. Iyer, V. R. Brown, and F. Winston. 2000. Whole-genome expression analysis of snf/swi mutants of Saccharomyces cerevisiae.Proc. Natl. Acad. Sci. USA 97:3364–3369.
33. Tricarico, C., P. Pinzani, S. Bianchi, M. Paglierani, V. Distante, M. Pazzagli,S. S. Bustin, and C. Orlando. 2002. Quantitative real-time reverse transcrip-tion polymerase chain reaction: normalization to rRNA or single housekeep-ing genes is inappropriate for human biopsies. Anal. Biochem. 309:293–300.
34. Tsoi, S. C. M., J. M. Cale, I. M. Bird, K. V. Ewart, L. L. Brown, and S. E.Douglas. 2003. Use of human cDNA arrays for the identification of differ-entially expressed genes in Atlantic salmon liver during Aeromonas salmo-nicida infection. Mar. Biotechnol. 5:545–554.
35. Wahlund, T. M., A. R. Hadaegh, R. Clark, B. Nguyen, M. Fanelli, and B. A.Read. 2004. Analysis of expressed sequence tags from calcifying cells of themarine coccolithophorid, Emiliania huxleyi. Mar. Biotechnol. 6:278–290.
36. Wahlund, T. M., X. Zhang, and B. A. Read. 2005. EST expression profilesfrom calcifying and non-calcifying cultures of Emiliania huxleyi. J. Micro-paleontol. 51(Suppl. 1):145–155.
37. Weiner, S., and L. Addadi. 1997. Design strategies in mineralized biologicalmaterials. J. Mater. Chem. 7:689–702.
37a.Westbroek, P., E. W. de Jong, P. van der Wal, A. H. Borman, J. P. M. deVrind, D. Kok, W. C. de Bruijin, and S. B. Parker. 1984. Mechanism ofcalcification in the marine alga Emiliania huxleyi. Philos. Trans. R. Soc.Lond. B 304:435–444.
38. Wu, L., D. K. Thompson, G. Li, R. A. Hurt, J. M. Tiedje, and J. Zhou. 2001.Development and evaluation of functional gene arrays for detection of se-lected genes in the environment. Appl. Environ. Microbiol. 67:5780–5790.
39. Wustman, B. A., R. Santos, B. Zhang, and J. S. Evans. 2002. Identificationof a “glycine-loop”-like coiled structure in the 34 AA Pro, Gly, Met repeatdomain of the biomineral-associated protein, PM27. Biopolymers 65:362–372.
40. Young, J. R., and K. Henriksen. 2003. Biomineralization within vesicles: thecalcite of coccoliths, p 189–215. In P. M. Dove, J. J. De Yoreo, and S. Weiner(ed.), Biomineralization, vol. 54. Mineralogical Society of America, Wash-ington, D.C.
5526 QUINN ET AL. APPL. ENVIRON. MICROBIOL.
on Novem
ber 30, 2018 by guesthttp://aem
.asm.org/
Dow
nloaded from