cdm potential for the commercialization of the integrated
TRANSCRIPT

CDM Potential for the Commercialization of the Integrated Biogas System
Dr. Jason Yapp, Caleb Management Services Ltd. The Old Daiary, Woodend Farm,
Wooton-under-Edge, Bristol, UK. GL12 8AA.
Dr. Adrianus Rijk, Director, UN-APCAEM, Beijing.
Abstract This paper discusses the main findings of research conducted by Caleb Management on the potential of CDM for the commercialization of the small- to large- scale Integrated Biogas System (IBS). Despite of the multitude of socio-economic and environmental benefits offered by the IBS, their scaling up as intervention for sustainable livelihood and poverty alleviation program around the world has been rather disappointing, except for a few East Asian countries (China, India, Bangladesh and Nepal). Barriers to the ‘mainstreaming’ of the pilot biogas projects have been associated with the lack of institutional, enabling policy framework, technical and human capacity. Whether CDM could provide a timely opportunity for leveraging and strengthening of the institutional, policy, technical and human capacity is the subject of this research. IBS offers a clean low carbon technology for the efficient management and conversion of agro-industrial wastes into clean renewable biogas and fertilizer source. CDM IBS project has the potential as intervention for leveraging sustainable livelihood development (protein source, clean biogas, organic fertilizer for food production) as well as for tackling local (land, air and water) and global pollution (reduce methane and nitrous oxide emission). It reviews all the CDM projects that have been registered under the UNFCCC’s Executive Board (EB) (large- and medium-scale) as well as those in the pipeline (small-scale). The first section briefly introduces the background of the research and highlights the main challenges and hot spots in the commercialization (lack of institutional, technical and human capacity) and financing of IBS for poverty alleviation. The subsequent section highlights the methodological, institutional and enabling policy within a legal framework for the preparation and implementation of the CDM project. This section also identifies and suggests measures for the: i) management of risks (Ratification, Validation, Registration, Implementation, ERPA transaction, CER price negotiation, Verification, Certification, Replication) and ii) reduction of transaction cost through organizational (Bundling, Simplified methodology) and financial technologies (terms loan; leasing or equity finance (Cooperative and Corporative instrument). Scaling up investment in biogas system within the renewable energy portfolios will require transitioning from donor-paternalistic driven to market-based approach to leverage a significant increase in financial resources for RE and in ensuring the creation of long-term wealth and health for the local stakeholders. The final section estimates the potential number of biogas digesters that could be developed based on livestock units per household and their impact on GHG reduction and potential revenues sources and social impact. It also highlights the crucial role of international carbon credit buyers in supporting the CDM facility and their clients to expand the financial frontier for term finance in rural area, and highlights some avenues for support. 1. INTRODUCTION THE QUEST FOR ZERO EMSISISON AGRICULTURE The agricultural sector is responsible for feeding a world population of 6 billion individuals. Despite of hotspots of famine and starvation (e.g. Sub-Saharan), national food security programs have overall been achieved through the deployment of ‘green’ and ‘gene’

revolution technology for the efficient conversion of solar radiation into food crop and livestock products. This has been accomplished through the improvement in soil fertility, availability of pesticides, herbicides, irrigation and farm mechanization, which rely heavily on the availability of cheap fossil fuel. At what environmental cost has this been achieved? Given the current high fossil fuel of US$ 60 per barrel, how sustainable and viable are these practices? With rising disposal income and urbanization for the citizen in the Asia Pacific region, demand for meat protein and processed food continues to increase at a average rate of 5.9% (3.6 for India and 8.6 % for China) from 1982 to 1994 (Gerber et al, 2005). This exerts pressure on the production system to maximize returns on land and labour by capitalizing on economies of scale and production. The intensification of such production and processing systems has generated large concentration of agro-industrial wastes that requires efficient management in order to avoid polluting the local resources (air, land and water). Furthermore these untreated wastes when left in open aerobic and anaerobic conditions, tends to emit large volume of fugitive methane (21 times) and nitrous oxide (310 times), which are potent greenhouse gases (GHG). Worldwide, the agriculture sector accounts for approximately 20% of the global GHG pool in 1990 (Figure 1). In 2000, 4% of the global anthropogenic methane budget comes from livestock manure whilst agro-industrial wastewater accounted for 10% (Figure 2). Figure 1. Global GHG emission. Figure 2. Global anthropogenic CH4 budget.
Figure 3 shows the distribution of the agriculture sector GHGs emission for the 9 Asian countries in 2000 as reported in ADB’s ALGAS study, which accounts for 24% of the overall emission. Methane accounts for 87% whilst N2O accounts for 13% and 4% comes from manure (Figure 4). Figure 3. Agriculture sector GHGc emission. Figure 4. CH4 budget by source in 2000.
The major effects of livestock waste mismanagement on the environment have been

summarized by Menzi (2001):
• Eutrophication of surface water (deteriorating water quality, algal growth, damage to fish) due to input of organic substances and nutrient if excreta or wastewater from livestock production get into streams through discharged, runoff or overflow of lagoons.
• Leaching of nitrate and phosphate (Gerber et al, 2005) and possible pathogens transfer to ground water
• Accumulation of excess nutrients and caused imbalance in the soil if high doses of manure are applied.
• Natural areas of wetlands and mangrove swamps are directly impacted by water pollution, often leading to biodiversity losses.
In addition to the lakes and rivers of mounting agro-industrial wastes, the rising population in the Asia Pacific regions also posed serious human waste problem upon the environment. Due to inefficient and poor waste management and sanitation system, new pandemic livestock (Streptococcus suis, Avian bird flu) diseases are constantly threatening human health (zoonotic diseases). Hence, given the current high oil prices, large environmental and ecological footprint coupled with high human health risk, there is an urgency to develop sustainable agriculture practices that emit zero or minimum pollutant and GHG emission. Under this system, all the waste will be treated as residues where under-utilised resources will be recycled and reused and using the following mitigation strategies to ‘close the loop’:
1. Methane captured and utilization for renewable energy generation from agro-industrial wastes e.g. livestock, brewery, using anaerobic processes.
2. Production of bio-diesel using bio-energy crop e.g. Jathropha plantation
3. Promotion of conservation agriculture to reduce reliance on fossil fuel and expensive
inputs, reduce vehicle traffic, recyling of crop residues, mixed cropping and crop rotation.
How CDM could be used to leverage financial, technical, institutional capacity to mitigate GHG emission from the agricultural sector will form the core of this research program. A. Integrated Biogas System There is renewed interest in the use of anaerobic digestion (AD) processes for the efficient management and conversion of agro-industrial wastes (livestock, paper and pulp, food processing, brewery and distillery) into clean renewable energy and organic fertilizer source. The biogas captured will not only mitigate the potential local and global pollution but could either be combusted for electricity generation using Combined Heat and Power generator (CHP) in large to medium enterprises or use for cooking and lighting and heating of hot water for small households. Despite of these multitudes of benefits (Appendix XX and Box 1), the widespread adoption of IBS around the world has been rather disappointing. Except for some East Asian countries (China, India, Nepal and Bangladesh), many small and large scale biogas projects have not been able to move beyond the pilot phase and the barriers to their scaling up and ‘mainstreaming’ has been recognized to be: (A) Technical (biogas and animal husbandry) competence:

(i) Lack of competent technicians and fund to mend repairs (ii) Poor materials used leading to corrosion, breakdown and leakages (iii) Lack of equipment supplies and spare parts (iv) Insufficient and poor quality feedstock for the digester and low temperature
leading to low biogas yield (v) Poor animal husbandry due to poor feed quality and animal health and high
emission of enteric methane and (B) Institutional and policy Barriers:
(i) Sectoral, top down, compartmentalized approach in the delivery mechanism leading to lack of follow-up support services and ownership of projects (Figure x)
(ii) Lack of governmental, institutional and local support to promote biogas program focusing on ‘technology fix’ rather than on integrated system approach (hence Integrated Biogas System)
(iii) Lack of sound fiscal policy to provide incentive (taxation, capital allowance) to attract investment in biogas technology
(C) Social and entrepreneur barriers:
(i) Lack of public awareness and gender bias against women and marginalized participants
(ii) Lack of success entrepreneurial business model for scaling up biogas system (iii) Cultural taboos prevent the use of animal and human as feedstock for clean
biogas and fertilizer (iv) Wrong focus on dissemination rather than on market-based
commercialization modality for the ‘mainstream’ of the pilot project (v) Failure breed failure and disappointed with loss of confidence in the biogas
technology (C) Financial barriers:
(i) Lack of access to affordable credits due to continual under-funding within the agriculture sector
(ii) Lack of means of paying back loans due to under employment (vi) Lack of a creative financial modality for the mainstreaming of the pilot
biogas project (pros and cons of term loan, leasing and equity financing) Figure X. Old vs. new paradigm of system approach to sustainable livelihood intervention.
Old paradigm – sectoral top down approach focusing on energy problem
Farmers
Energy Problem
Resource Poor
Women Marginalised
Private Sector
Ministry of Energy
Extensionists
Ministry of Agriculture, Energy,
Science & Technology,
ODA
New paradigm – multi-sectoral top bottom/bottom up approach focusing on livelihood and poverty alleviation
Livelihood –Poverty
AlleviationCarbon Fund
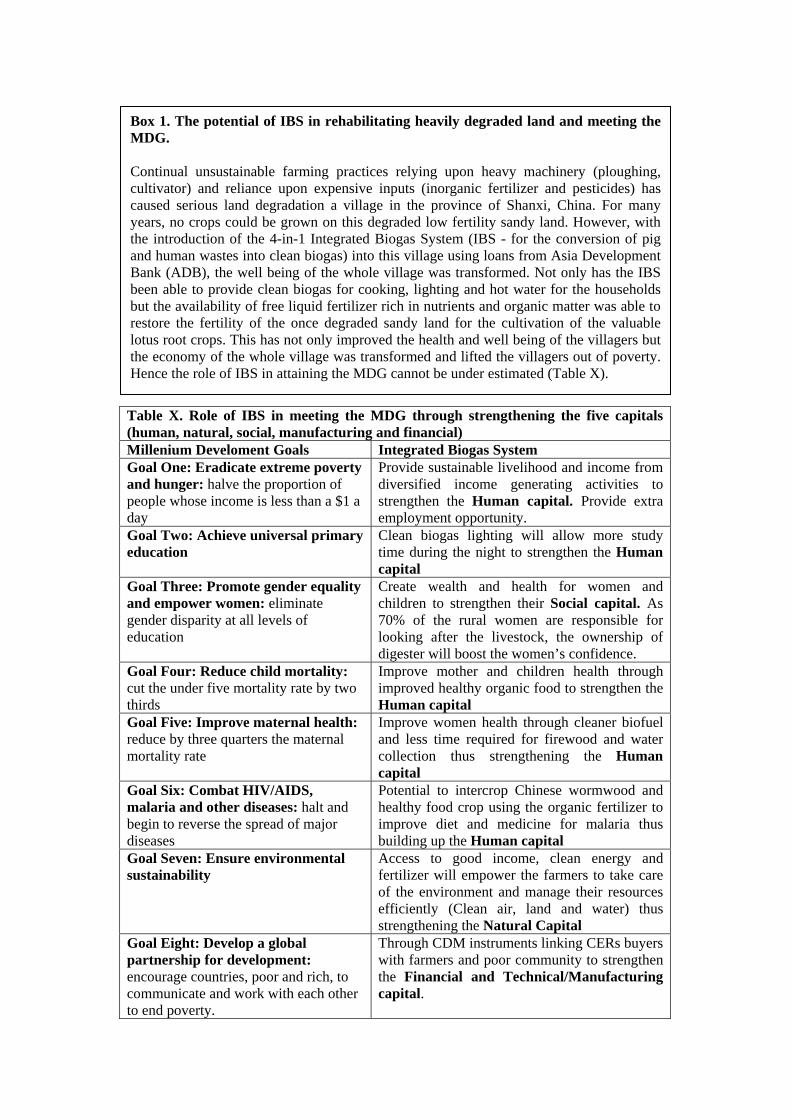
Table X. Role of IBS in meeting the MDG through strengthening the five capitals (human, natural, social, manufacturing and financial) Millenium Develoment Goals Integrated Biogas System Goal One: Eradicate extreme poverty and hunger: halve the proportion of people whose income is less than a $1 a day
Provide sustainable livelihood and income from diversified income generating activities to strengthen the Human capital. Provide extra employment opportunity.
Goal Two: Achieve universal primary education
Clean biogas lighting will allow more study time during the night to strengthen the Human capital
Goal Three: Promote gender equality and empower women: eliminate gender disparity at all levels of education
Create wealth and health for women and children to strengthen their Social capital. As 70% of the rural women are responsible for looking after the livestock, the ownership of digester will boost the women’s confidence.
Goal Four: Reduce child mortality: cut the under five mortality rate by two thirds
Improve mother and children health through improved healthy organic food to strengthen the Human capital
Goal Five: Improve maternal health: reduce by three quarters the maternal mortality rate
Improve women health through cleaner biofuel and less time required for firewood and water collection thus strengthening the Human capital
Goal Six: Combat HIV/AIDS, malaria and other diseases: halt and begin to reverse the spread of major diseases
Potential to intercrop Chinese wormwood and healthy food crop using the organic fertilizer to improve diet and medicine for malaria thus building up the Human capital
Goal Seven: Ensure environmental sustainability
Access to good income, clean energy and fertilizer will empower the farmers to take care of the environment and manage their resources efficiently (Clean air, land and water) thus strengthening the Natural Capital
Goal Eight: Develop a global partnership for development: encourage countries, poor and rich, to communicate and work with each other to end poverty.
Through CDM instruments linking CERs buyers with farmers and poor community to strengthen the Financial and Technical/Manufacturing capital.
Box 1. The potential of IBS in rehabilitating heavily degraded land and meeting the MDG. Continual unsustainable farming practices relying upon heavy machinery (ploughing, cultivator) and reliance upon expensive inputs (inorganic fertilizer and pesticides) has caused serious land degradation a village in the province of Shanxi, China. For many years, no crops could be grown on this degraded low fertility sandy land. However, with the introduction of the 4-in-1 Integrated Biogas System (IBS - for the conversion of pig and human wastes into clean biogas) into this village using loans from Asia Development Bank (ADB), the well being of the whole village was transformed. Not only has the IBS been able to provide clean biogas for cooking, lighting and hot water for the households but the availability of free liquid fertilizer rich in nutrients and organic matter was able to restore the fertility of the once degraded sandy land for the cultivation of the valuable lotus root crops. This has not only improved the health and well being of the villagers but the economy of the whole village was transformed and lifted the villagers out of poverty. Hence the role of IBS in attaining the MDG cannot be under estimated (Table X).

B. Clean Development Mechanism Kyoto Protocol became effective on the 16 Feb 2005, which binds Annex1 country to reduce GHG emission by 5.2% to that of the 1990 levels. Market-based mechanisms were developed for the realization of these national commitments. Figure 1 shows the transaction between annex 1 countries and non-annex 1 where the flow of finance, clean technology and capacity building from developed countries into developing countries in exchange for carbon credits. Host country approval will ensure that the project contributes to national sustainable development program. Clean Development Mechanism (CDM) as one of three flexible strategies enshrined under the Kyoto Protocol could offers a timely opportunity to overcome the above barriers by strengthening the institutional, technical and human capacity in the host country. This report seeks to understand how CDM could be used effectively for leveraging the mainstreaming of the IBS as development tools for sustainable livelihood and poverty alleviation for achieving the Millennium Development Goal (MDG). C. Objectives of the Report The report will focus on how the host countries in Asia Pacific regions could take advantage of the CDM protocol for the scaling up of the IBS as intervention for sustainable livelihood and poverty alleviation program. What policy and institutional and technical capacity should be in place? Could CDM biogas project provide a new paradigm to allow the poor to access and own clean technology using market based approach to eliminate trade-distorting agriculture subsidies? How to reduce the risks and transaction costs? Could CDM revenues be used to channel fund to provide a first step rung for the dollar poor to own and engage in IBS. How to leverage CDM for the expansion of IBS? This paper seeks to explore how CDM could help to overcome some of the above barriers and in leveraging institutional, technical and human capacity for the wider adoption of the AD system. The paper will review current CDM biogas project and highlights lessons learnt so far in order to map out future intervention for developing high quality CDM biogas project. Means for reducing the transaction cost and how risks could be managed will be discussed. Impact of the CDM project in creating additional revenues, global GHG reduction and poverty alleviation and women will be discussed. The potential areas where carbon integrity could be realized and maximized will be explored. The paper will end with recommendation for charting the way forward for developing high quality CDM Biogas project. Since developing large scale biogas project are relatively more straight forward, focus will be given in addressing some of the issues pertinent in developing small scale biogas project.

2. LESSONS LEARNT FROM CURRENT CDM BIOGAS PROJECTS The CDM project cycle activities in comparison to conventional project development are shown in Figure 1. It is clear that preparing and developing CDM is much more complex and can be confusing. The challenges are in ensuring the smooth flow through the cycle. Hindrances to this flow will add time and resource to the project and transaction costing. Figure 1: CDM Project cycle compare to conventional project development (Source: EcoSecurities).
Since the coming of the Kyoto Protocol into force on the 16 Feb 2005, there has been an increase in the number of CDM projects submitted for validation. To date there are 263 CDM projects with more than half (54%) submitted by the large HFC and N2O projects which has low Sustainable Development component (Table x). Agriculture projects with high SD component only accounts for 5% comprising of 32 projects with an annual CER of 2.5 MtCO2e and a cumulative 19.8 MtCO2e to 2012 (Figure x). The current CDM agriculture landscape is dominated by large scale project for treating swine waste in Latin America. AgCert International PLC who has developed the AM16 methodology has submitted 20 projects for validation with a cumulative CER of 13.7 M tCO2e for the treatment of swine wastes in Brazil and Mexico (Appendix 1). In order to reduce risk for the farmers, and to maintain control over CER monitoring and verification, AgCert’s business model involves Build, Operate and Transfer (BOT) for 10 years. Agrosuper using the AM6 methodology has focus in Chile and submitted 6 Project Design Documents (PDD) with a cumulative CER of 5.8 MtCO2e. PriceWaterhouseCoopers is developing a CDM project in Mexico worth cumulative 127,000 tCO2eto 2012. In order to reduce transaction cost (See Table x), EB has allowed small scale project to use their simplified methodology for fast tracking baseline, validation, registration, verification and monitoring procedures. So far three CDM biogas project has make use of this provision. There are two medium scale pig CDM projects submitted for validation, one in Philippines submitted by 2E Carbon Access and one for Mexico by AgCert for a bundled project worth 21,000 tCO2e per year. The CDM in the Philippines are 6 individual PDDs for each farm with no bundling at all whilst those of the AgCert are bundled into 1 PDD. Currently there is only one CDM project submitted for validation for small scale project by Women For Sustainable Development to develop 5,500 digesters for households with an average of 4 cows for supplying average of 3 hours of biogas for daily cooking in India.

CDM Projects Table 1: Number of CDM
project with total CER generated (Joergen, RISEO, Sept 2005)
number CERs/yr (000) Accumul. 2012
CERs (000) Biomass energy 73 28% 3,531 7% 31,032 8%Hydro 58 22% 3,202 6% 24,679 7%Landfill gas 32 12% 8,574 17% 69,901 19%Agriculture 32 12% 2,554 5% 19,770 5%Wind 17 6% 1,872 4% 13,611 4%EE Industry 15 6% 418 1% 3,543 1%Biogas 7 3% 471 1% 4,125 1%Fossil fuel switch 9 3% 370 1% 3,061 1%HFCs 4 2% 12,375 24% 97,425 26%Geothermal 3 1% 772 2% 5,979 2%EE Household 3 1% 42 0% 215 0%Solar 3 1% 44 0% 269 0%N2O 2 1% 15,108 30% 90,667 24%Fugitive 2 1% 912 2% 9,396 3%Tidal 1 0% 311 1% 1,087 0%Transport 1 0% 7 0% 59 0%Energy distribution 1 0% 15 0% 213 0%Total 263 100% 50,577 100% 375,032 100%Renewables 162 62% 10,203 20% 80,782 22%EE 20 8% 481 1% 4,030 1%Fuel switch 9 3% 370 1% 3,061 1%CH4 reduction 66 25% 12,040 24% 99,067 26%HFC & N2O reduction 6 2% 27,483 54% 188,092 50%
Figure X. Annual CERs from CDM projects.
Annual CERs from CDM projectsJørgen Fenhann, UNEP Risø Centre,
16-09-2005
Biomass energy
Hydro
Landfill gas
Agriculture
Wind
EE Industry
Biogas
Fossil fuel switch
HFCsGeothermal
EE Household
Solar
N2O
Fugitive
Tidal
Transport
Energy distrib.

Table X. Large scale Agriculture CDM projects Approved PDD
Host country
PDD Developer
AD Techno- logy
ktCO2e/yr
Crediting period
(yrs)
Total cumulative ktCO2e
till 201219PDDs (AM16)
Brazil, Mexico
AgCert Ambient Temperature Covered lagoon
1,862 10 13,755
6 PDDs (AM6) Chile Agrosuper
Temperature controlled AD
673 7 5,837
1 PDD (AM6) Brazil PriceWaterhouseCoopers
Covered lagoon
24 10 218
Contribution to Sustainable Development
• Mitigate GHG emission • Clean air and water • Clean energy • Create new employment
Main issues: • Call for a consolidated methodology using mass balance rather than animal population for simpler and cheaper monitoring and verification methodology
• Existing monitoring system required sound and efficient data management system
• Solid separation in some baseline e.g. China may lead to low Vs and hence low CERs
• Temperature controlled AD for colder climate • Feedstuff quality and genetic stocks may affect CER generated • Bundling criteria – how many sites could be bundled into 1 PDD • Project developer must be local entity e.g. in China local entity
hold 51% majority share • Verification of submitted data (30% down on what was submitted) • CERs price and taxation on CER • Uncertainty for Post 2012 negotiation
Additionality test:
• Low IRR without CER • Anaerobic lagoon – cheap to use and maintain • No need to capture methane
A. MAIN ISSUES FOR LARGE SCALE BIOGAS PROJECT Overall there is less problems encounter in developing large scale biogas project given their high viability through bundling of 6 to 15 project sites into 1 PDD to reduce transaction cost. The baseline and monitoring methodologies (AM6 and 16) are quite straight forward and well tested. For large scale project, the main challenge is generate large enough CER and the verification of the measured data with that of the submitted data. In China’s case, the main issues will be lower potential CER that could be generated from pig farms due to lower Vs in the wastewater caused by solid separation. The solids are collected by farmers for use as organic fertilizer. The high quality feedstuff and the superior genetic stock used in the Chinese farms could also lead to lower CER. The insistence that the project developer must be a local entity with 51% majority share and possible taxation on CER mark China out to be different from the CDM policy in Latin America.

Temperature regime will detect the type of AD that could be used as colder clime with lower winter will required some degree of heating to maintaining the temperature at 37’C. This will increase the project equity cost. For warmer clime, ambient covered lagoon will be the cheapest AD technology. Additionality Test The additionality test tool for the developing large scale biogas for pig farms is summarized in Figure X. For the large scale project, additionality is based on investment additionality where the BAU scenarios without the CERs will not take place because of low IRR/NPV. Most PDDs argues that without CERs many of the AD technology will not be implemented because of low NPV/IRR. Figure x: Flowchart for testing the additionality of large scale CDM biogas project
Step 0: Preliminary screening based on the starting date of the project activities. Project started before 2005 could claim for early crediting if it is registered before Dec 2005.
Step 1: Identification of alternative scenarios to the project
activity consistent with national laws and regulations. For example: • Plausible scenarios: Daily Spread; Dry storage;
Anaerobic lagoons; Anaerobic Processes (AP). How reliable are the data?
• Unlikely scenarios: Deep litter; Dry lot; Liquid/slurry; Pit storage below animal confinements; Composting; Poultry
Step 2: Investment Analysis Step 3: Barriers Analysis – present a
case why IBS is not used widely • Calculate capital cost
• Technical: ‘first of it’; ‘wait and see’; problem of scaling up; poor materials and equipment; gas leakages and corrosion
• Construction/labour cost • What are the potential revenues?
• If there is cash flow (fro sale of fertilizer, biogas or electricity) then use IRR for comparison
• Financial: lack of capital and cash
flow; lack of affordable credit; lack of collateral; short term loan; lack of creative modality; capital supply risks (exchange rate, taxation)
• Compare IRR/NPV of alternative scenarios with IBS
• If the IRR/NPV of the project activity is higher than the baseline activity; then the project is deemed additional. Without the CERs the project will not go ahead. What is the accepted
• Legal: no need to capture
methane; no need to line lagoon; problem in the enforcement of discharge standard
Step 4: Common practice – present the case that baseline
is the business as usual scenarios • National practice: risk averse farmers will not invest in
new technology; • Non-essential asset: farmers view waste management system as expensive cost center and liability; asset to be added on after cash flow become positive;
Step 5: Impact of the CDM registration
• Will there be changes in policy and environmental codes
and standards due to change in politic climate during the crediting periods?
• Will there be changes in the tax and CER ownership
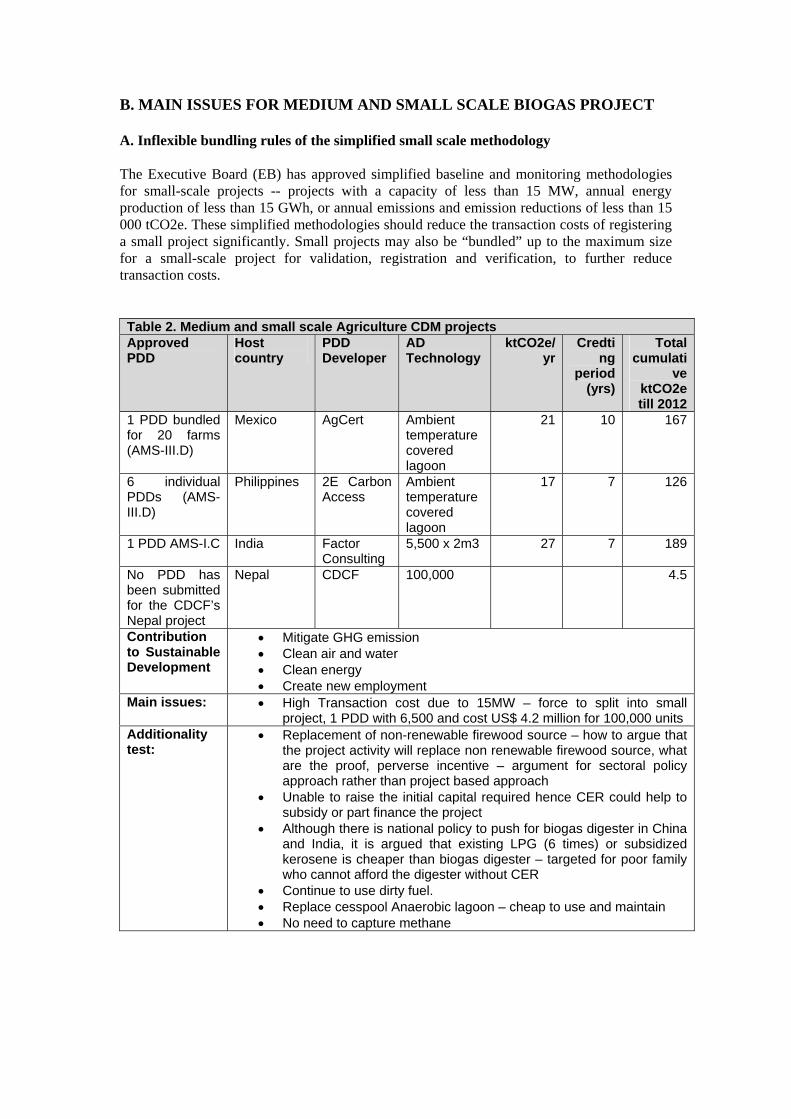
B. MAIN ISSUES FOR MEDIUM AND SMALL SCALE BIOGAS PROJECT A. Inflexible bundling rules of the simplified small scale methodology The Executive Board (EB) has approved simplified baseline and monitoring methodologies for small-scale projects -- projects with a capacity of less than 15 MW, annual energy production of less than 15 GWh, or annual emissions and emission reductions of less than 15 000 tCO2e. These simplified methodologies should reduce the transaction costs of registering a small project significantly. Small projects may also be “bundled” up to the maximum size for a small-scale project for validation, registration and verification, to further reduce transaction costs. Table 2. Medium and small scale Agriculture CDM projects Approved PDD
Host country
PDD Developer
AD Technology
ktCO2e/yr
Credting
period (yrs)
Total cumulati
ve ktCO2e till 2012
1 PDD bundled for 20 farms (AMS-III.D)
Mexico AgCert Ambient temperature covered lagoon
21 10 167
6 individual PDDs (AMS-III.D)
Philippines 2E Carbon Access
Ambient temperature covered lagoon
17 7 126
1 PDD AMS-I.C India Factor Consulting
5,500 x 2m3 27 7 189
No PDD has been submitted for the CDCF’s Nepal project
Nepal CDCF 100,000 4.5
Contribution to Sustainable Development
• Mitigate GHG emission • Clean air and water • Clean energy • Create new employment
Main issues: • High Transaction cost due to 15MW – force to split into small project, 1 PDD with 6,500 and cost US$ 4.2 million for 100,000 units
Additionality test:
• Replacement of non-renewable firewood source – how to argue that the project activity will replace non renewable firewood source, what are the proof, perverse incentive – argument for sectoral policy approach rather than project based approach
• Unable to raise the initial capital required hence CER could help to subsidy or part finance the project
• Although there is national policy to push for biogas digester in China and India, it is argued that existing LPG (6 times) or subsidized kerosene is cheaper than biogas digester – targeted for poor family who cannot afford the digester without CER
• Continue to use dirty fuel. • Replace cesspool Anaerobic lagoon – cheap to use and maintain • No need to capture methane

The viability of any small scale CDM projects relies heavily upon the creativity of the project developer to reduce the high transaction cost by capitalizing on the economy of scale. Unfortunately the rules governing the ability to bundle projects are not yet clear. Instead of making the rules more flexible so that the poor host country could reap the benefits of CDM projects, EB seems to further restrict the bundling rules. As of July 2005, EB release the latest rulings1:
• Project activities wishing to be bundled shall indicate as of the request for registration that they will be bundled
• Once a project activity becomes part of a bundle it shall not be de-bundled i.e. project activities that are bundled at the registration should remain part of the bundle
• Composition of bundles shall not change over time (i.e. the submission of projects to be used in a bundle shall be made at the same time i.e. project activities cannot be substituted for one another later on.
• All project activities in the bundle shall have the same crediting period. Moreover, although the EB did not take an explicit decision, it seems quite clear that the total size of a bundle of project activities cannot exceed the limits set for small-scale CDM projects2. If formally agreed, this would mean that the size of a bundle should comply with the following rules:
(i) Renewable energy project activities with a maximum output capacity equivalent of up to 15 megawatts (or an appropriate equivalent);
(ii) Energy efficiency improvement project activities which reduce energy consumption, on the supply and/or demand side, by up to the equivalent of 15 gigawatt/hours per year;
(iii) Other project activities that both reduce anthropogenic emissions by sources and directly emit less than 15 kilotonnes of carbon dioxide equivalent annually.
The ability to aggregate various small scale projects into a single PDD will help to reduce transaction cost and improve the management and monitoring strategies. There will be a need for the creation of an Intermediary Agent (IA) for the management of the whole IBS program where new participants can be added as and when required. The role of the IA will be:
• To work as project developer in project preparation, implementation and monitoring and evaluation
• To register new participants • To provide good practices strategies • To provide training, support and marketing services • To promote the IBS program to new stakeholders • To manage the CER fund • To negotiate the CER price
1 These rules build upon recommendations from the recent second meeting of the small-scale working group (16-17 May 2005) – www.cdn.unfccc.int/Panel/ssc_wg/sscwg_meetings/SSCWG02_rep_ext.pdf 2 Report of the Conference of the Parties on Its Seventh Session, Held at Marrakesh from 29 October to 10 November 2001. http://unfccc.int/resource/docs/cop7/13a02.pdf

Table XX. Transaction costs for normal and small scale CDM project (US$) (Bhardwaj et al, 2004)
Normal-scale
(average) Small-scale (average)
Cost reduction
[%] 31 PDDs Upfront 71,000 28,400 -60 880,4001. Project preparation and review 9,000 4,800 -47 148,8002. Project Design Document 24,000 10,800 -55 334,8003. Validation 12,000 6,000 -50 186,0004. Appraisal phase 20,000 3,800 -81 117,8005. Initial verification (start-up) 6,000 3,000 -50 93,000 Operation 132,000 30,000 -77 930,0006. Periodic monitoring 72,000 12,000 -83 372,0007. Verification and certification (yearly) 60,000 18,000 -70 558,000 Total transaction costs 203,000 58,400 -71 3,620,800
Biogas Sector Partnership (BSP)-Nepal seeks to install 162,000 IBS (2m3) across Nepal with a capacity of 2kW each. If the simplified methodology is to follow, then each PDD must be less than 15MW. Hence the BSP-Nepal program would need to split into 31 PDDs of 6,500 IBS. It would mean the transaction cost would cost an extra over US$ 3 million for the submission of 31 PDDs compare to only submitting 1 PDD at US$ 58,500 (Table xx). Given the above rulings, it is likely that the development of the 31 PDDs would take times and loss of potential credits. Recruitment of new participants would lead to loss of previous crediting period. This inflexibility will place unnecessary heavy burden upon the host country already scarce resources and deprive the poor of the multifaceted benefits offered by IBS. Hence there is need to call the EB to task by making the small scale methodology more flexible so that aggregation can be based on district baseline or regional baseline as means to reduce transaction cost further. Non-sustainable forestry The main issues in developing small scale CDM will be the definition of harvesting firewood from non sustainable forestry. If the host country has already a deforestation policy in place, then it would be hard to argue for emission coming from non sustainable source. Hence the calculation of the proportion of non sustainable forestry source remains a challenge. Biogas Development Program as a Common practice If the host country has already a vibrant biogas development program (e.g. Nepal, India, China) how could one still argue for additionality? If this is already a common practice for the host country, where additionality is the CDM project bringing to the host country? Sectoral Policy based Approach In order to overcome the above project-based baseline problems associated with perverse incentive, it is propose that a sectoral approach be developed for the agriculture sector for mitigating GHG emission. Each host country could be allocated a national baseline targets for

the agriculture sector which could be sub-divided into smaller regional or district baseline according to geography. The CER price could then be negotiated with potential buyer. There has been much criticism in the type of CDM projects being registered, which tends to be biased towards project with low abatement cost but has low SD integrity. IBS present CDM project with high SD integrity with large local benefits. Hence IBS CDM would fit the sectoral and policy-based approach for overcoming the additionality and perverse incentive problem faced by current CDM procedure as argued by Sterk and Witten (2005). A policy-based CDM in the agriculture sector would entail project activities undertaken under this policy rather than having to avoid designing policy that favour cleaner technology. The CER awarded to the host country could then distribute the CERs either as tax incentive, subsidies or other fiscal instrument. Hence the government policy (capture and utilization of methane and nitrous oxide, deforestation policy, clean water act) would become the project itself which will turn additionality on its head. This policy based project will prevent host country from shying away from climate protection strategies for fear of CDM ineligibility. On the contrary the host country should be rewarded for creative and innovative climate change strategies to bring multi-benefits to the local stakeholders. Technical capacity would be easier to focus and built up. National Biogas Working Group could be set up to develop agricultural sectoral policy based CDM for maximize SD integrity. Annex 1 could help to build up capacity in exchange for CERs. The baseline targets could be allocated on the basis of per GDP or capita to address equity issues. This is a follow up activity that merits further investigation with possible presentation at the COP11 in Montreal for lobbying international support. This is being tested for the CDM transport in Chile and CDM energy efficiency project in Ghana.

Monitoring In order to reduce on transaction cost, most of the monitoring plan shown in Table X involved the using the sale service contract as the main contact point. The monitoring plan entails recording the numbers of digester that has been installed and those are still in operation on a six monthly basis. In China’s case the District Energy Bureau in collaboration with the Biogas Association served as coordinator for the gathering of biogas digester data. Sample size should cover 1% of the overall sapling size to give a standard error of 5%. Table X. Small scale CDM biogas project Project India China Nepal Livestock per HH 4 cows 3 pigs 4 cows Digester number 5,500 10,000 162,000 Digester size 2 m3 8 m3 4-10 m3 kW/digester 1.81 ?? ?? CER/digester/yr 4.93 1.797 7.76 for Terai
5.38 for Hills 5.48 for Mountain Average = 4.6
CER (tCO2e /yr) 27,111 17,967 530,000 Cumulative CERs 189,905 179,670 5.3 MtCO2e for 10
years 1. Baseline - Replace firewood
from non-sustainable sources - Replace inefficient wood stove - Replace 46 l/yr/HH kerosene with biogas
- Replacement of firewood from non-sustainable sources - Replace inefficient wood stove with biogas - Replace kerosene
- Replace firewood from non-sustainable sources - Replace kerosene with biogas - Claim N2O offset from replacement of inorganic fertilizer - Claim fugitive CH4 and N2O emission from manure left or stored in the field
2. Monitoring plan - Rely on support service contractor to monitor on the number of digester installed and in operation
- Rely on Provincial Energy Bureau to carry monitoring along with Village Biogas Association
- Rely on contractor to monitor installed and operational digester
3. Issues - High transaction cost - Inflexible Bundling
- Ownership of CERs - Upfront capital
- Definition of non-sustainable forestry - Sustainability of Government subsidy
3. COMMUNITY DEVELOPMENT CARBON FUND (CDCF) AND EMISSION REDUCTION PURCHASE AGREEMENT(ERPA) As of April 2003 the World Bank's CDCF, which will concentrate on small-scale projects, had received about 30 project ideas representing projects between 0.6 and 1.2 MtCO2e of total reductions. Finland is expected to sign contracts to purchase about 500,000 tCO2e of CERs from three or four small-scale projects at prices from €2.70 to €6.30/tCO2e. Those prices are comparable to the prices for CERs from larger CDM projects, suggesting that the simplified methodologies reduce the transaction costs enough to keep small-scale projects competitive in the market. Included in the CDCF portfolio is the biogas project to develop 162,000 digesters to generate biogas to replace kerosene and firewood in Nepal. It is expected to generate 5.3 mtCO2e for 10 years with delivery starting in 2005 and CDCF has committed to purchase 1 MtCO2e (Table x). This project hopes to generate 15,000 new employees per year. For any projects to be eligible for CDM transaction, the following due diligence checklists must be applied:
A. HOST COUNTRY ELIGIBILITY
The proposed CDM project activity has to be implemented in a host country that:
a. is a Party to the United Nations Framework Convention on Climate Change (UNFCCC);
b. has ratified the Kyoto Protocol; c. has established a Designated National Authority (DNA) or a Focal Point that is
delegated to coordinate and approve local CDM project proposals d. has clear Sustainable Development criteria in place. e. has clear legal framework on CER ownership, project developer status f. ha clear fiscal policy on taxation and ownership of CER and bankability of CER g. has easy access these information e.g. website.
B. CDM PROJECT ELIGIBILITY All proposed CDM Project activities must:
a. have the potential to comply with the UNFCCC CDM project activities’ validation, registration and verification guidelines (see http://cdm.unfccc.int/ for more details);
b. generate CERs at least during the 2008-2012 commitment period; c. have baseline and monitoring methodologies that are being reviewed or have already
been approved by the CDM Executive Board.
C. PROJECT SPONSOR/DEVELOPER ELIGIBILITY The project sponsor and/or the project developer of the CDM project:
a. must have a proven track record in the development of similar project activities; b. must have the financial capability and competence to realize the project activity as
outlined in the project documents; c. must be an accredited business organization in the host country and hold good legal
standing.
D. TYPES OF FINANCIAL OPTIONS

The price of the CER will be determined by the appetite for risk shown by the project developer and owner. Higher price will be allocated to projects that have been registered whereas those with validation risk will fetch the lowest price. The issues involved in the negotiation of the ERPA may consider the following type of financing options for the purchase of CERs:
1. Payment on Delivery: CERs buyer would consider a “Payment on Delivery” ERPA for the direct purchase of CERS from a project activity whereby the buyer would pay on the delivery of CERs. A payment on delivery purchase contract is defined by which the buyer and its counter-party would agree on the pre-negotiated price, volume, and delivery schedule of Certified Emission Reductions (CERs) to be delivered into a dedicated buyer’s account upon the issuance of the CERs by the CDM Executive Board. Selling of registered CERs will fetch the highest price as the project developer and owner is absorbing all the upfront project risks.
2. Pre-paid Purchase Contract: The CERs buyer would be willing to advance funds incrementally into a CDM project activity based upon the completion of specific, pre-negotiated project milestones such as achieving CDM project validation, host country approval, registration and CERs issuance. The exact terms and conditions of the advanced payments for the purchase of CERs would be documented in an ERPA. In order to qualify for a pre-paid structure, the CDM project has to meet the following criteria:
a. the counter-party must provide satisfactory performance guarantees and demonstrate satisfactory credit quality or credit enhancement (such as a performance letter of credit) to support their delivery obligation;
b. the buyer will receive the first right of creation on any CERs generated by the project activity.
3. Debt Financing CDM Projects: The CERs buyer would consider debt financing CDM project activities in the form of either senior or subordinated debt under the following conditions:
c. at least a portion of project debt service would be paid in kind in CERs; d. the seller must provide liquidated damages (with related credit support) for
debt service obligations which are paid in kind (CERs); e. the debt financing must be secured by a security interest in the project or
supported by other collateral, such as an acceptable surety or equivalent guarantee in the amount of buyer’s financing.
f. the project must conform to customary project finance credit criteria, such as sponsor representations, conditions, precedents, covenants, and pledges.

4. BARRIERS AND RISK MANAGEMENT IN DEVELOPING CDM POJECT INTRODUCTION This section highlights the barriers involved in developing large and small scale biogas project and how risks could be minimized in order to reduce transaction cost and so that there is strong carbon integrity. In order to attract premium CDM investors the host country must exhibit strong political leadership in the setting up of functional and effective CDM institutions within a clear and transparent policy framework. Strengthening this capacity will not only reduce approval time and transaction cost but help to minimize the country, project and implementation risks for project owner, developer and investors. A. COUNTRY COMMITMENT There is still some uncertainty and reluctance by Asian countries to take advantage of the CDM instruments. This lack of commitment by national government has caused regional imbalance in the number of projects submitted which are dominated by Brazil and India. Lack of competent national staff and clear guidelines does not only delay project approval process but also increase transaction cost and often deter and discourage potential investor. There is also a need to strengthen the communication between national and local CDM entity in order to ensure smooth CDM transaction and implementation. B. INSTITUTIONAL BARRIERS
In order to be eligible for CDM project, the host country must:
• be a Party to the United Nations Framework Convention on Climate Change (UNFCCC)
• has ratified the Kyoto Protocol • has established a Designated National Authority (DNA) or a Focal Point that is
delegated to coordinate and approve local CDM project proposals.
Brardwaj et al (2004) define institutional barriers as ‘barriers that are embedded in the institutional structure of the government or of the international agreement that governs the CDM.’ The host country must spell out clearly their taxation laws, property and CER ownership rules and who should be the upfront project developer. For example, the DNA in China stipulates that local company with 51% majority must be the project developer. China also used fiscal taxation laws to deter project that does not contribute highly to national sustainable development. National staff must be well trained to handle biogas project that will attract potential investors. A high tax on CER will deter investor from coming. Given the high SD component, it is proposed that biogas should not be taxed at all. There must be clear CER ownership rules. NGO capacity building: In order to encourage full participation by local stakeholders, local NGO could be provided with training on CDM concepts particularly for less CDM literate countries.

C. FINANCIAL BARRIERS Transaction cost: High transaction cost has been the main deterrence for developing small scale project. Table x. illustrate the difference in transaction cost between normal and small scale CDM project. Upfront Cost: Lack of upfront capital for project preparation has hindered the successful implementation of any CDM project. Furthermore the lack of Subsidy: China and Nepal has relies on governmental subsidy of up to 30% of capital cost to spearhead the biogas project. But it is important that subsidy does not distort market forces which could lead to unhealthy competition. Incentive: Providing attractive fiscal incentive could be provide means to attract the private sector and local financial institution to be involved in CDM project. Providing favorable or guaranteed feed-in tariff for selling to on-grid electricity generated from biogas could provide an attractive incentive for investors. Capacity building for financial institution: In order to develop create financial modality to support CDM development, national financial institution must be well trained in assessing CDM upfront or equity loan application efficiently. D. TECHNICAL AND MANAGERIAL BARRIERS Competence technician: The lack of competent technicians in providing timely and cost effective repair will put project at risk and not meet project CER targets. Strong Support services: The ability to strengthen the host country technical and managerial and entrepreneurial capacity to reduce project risk so that the CER could be delivered as contracted. Building materials, equipment ad spare parts must of high quality and certified in order to ensure minimum breakdown and down time. Marketing strategies: Marketing to recruit new participants and screen out weak participant early in the selection process. Campaign must be effective to penetrate a wide audience on the benefit of CDM and biogas system. E. SOCIAL BARRIERS Cultural Taboos: In some cultures, the use and handling of animal and human waste as energy and fertilizer source can be regarded as offensive. Education and training and study tour could help to explain and win community over to partake in biogas project. Women participation: Special effort must be made to ensure that women are able to partake in CDM projects.

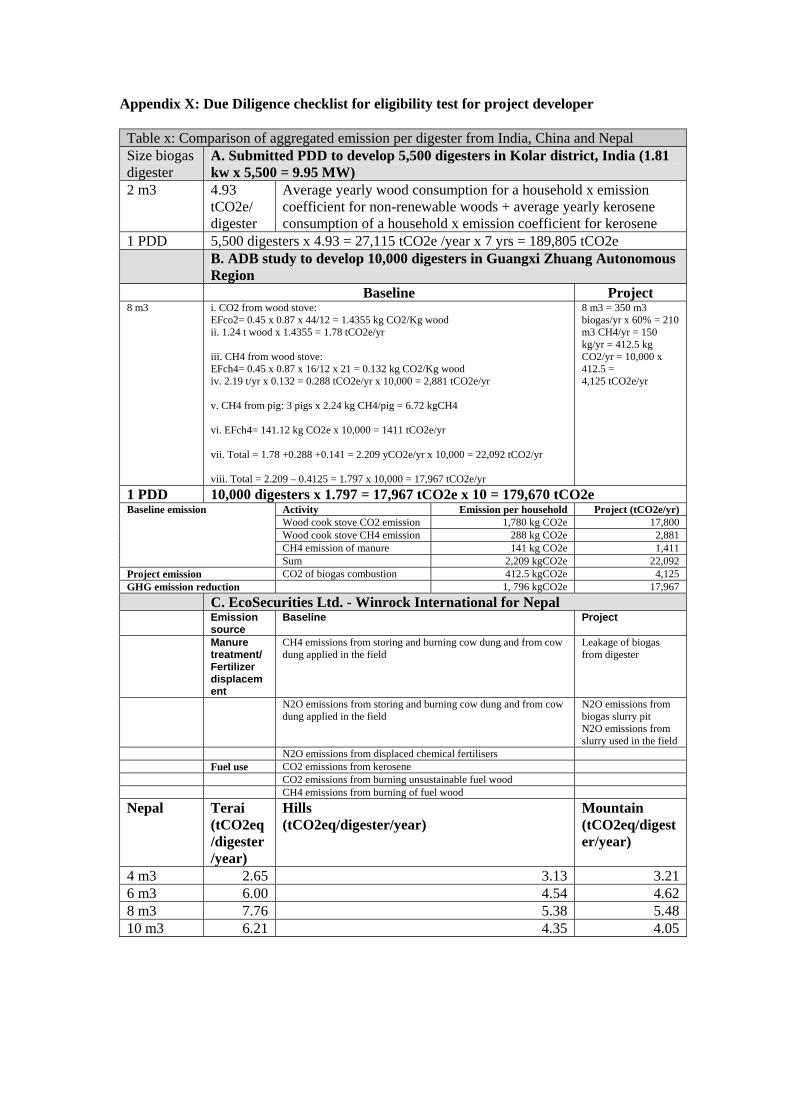
Table x: Comparison of aggregated emission per digester from India, China and Nepal Size biogas digester
A. Submitted PDD to develop 5,500 digesters in Kolar district, India (1.81 kw x 5,500 = 9.95 MW)
2 m3 4.93 tCO2e/ digester
Average yearly wood consumption for a household x emission coefficient for non-renewable woods + average yearly kerosene consumption of a household x emission coefficient for kerosene
1 PDD 5,500 digesters x 4.93 = 27,115 tCO2e /year x 7 yrs = 189,805 tCO2e B. ADB study to develop 10,000 digesters in Guangxi Zhuang Autonomous
Region Baseline Project 8 m3 i. CO2 from wood stove:
EFco2= 0.45 x 0.87 x 44/12 = 1.4355 kg CO2/Kg wood ii. 1.24 t wood x 1.4355 = 1.78 tCO2e/yr iii. CH4 from wood stove: EFch4= 0.45 x 0.87 x 16/12 x 21 = 0.132 kg CO2/Kg wood iv. 2.19 t/yr x 0.132 = 0.288 tCO2e/yr x 10,000 = 2,881 tCO2e/yr v. CH4 from pig: 3 pigs x 2.24 kg CH4/pig = 6.72 kgCH4 vi. EFch4= 141.12 kg CO2e x 10,000 = 1411 tCO2e/yr vii. Total = 1.78 +0.288 +0.141 = 2.209 yCO2e/yr x 10,000 = 22,092 tCO2/yr viii. Total = 2.209 – 0.4125 = 1.797 x 10,000 = 17,967 tCO2e/yr
8 m3 = 350 m3 biogas/yr x 60% = 210 m3 CH4/yr = 150 kg/yr = 412.5 kg CO2/yr = 10,000 x 412.5 = 4,125 tCO2e/yr
1 PDD 10,000 digesters x 1.797 = 17,967 tCO2e x 10 = 179,670 tCO2e Activity Emission per household Project (tCO2e/yr)Wood cook stove CO2 emission 1,780 kg CO2e 17,800Wood cook stove CH4 emission 288 kg CO2e 2,881 CH4 emission of manure 141 kg CO2e 1,411
Baseline emission
Sum 2,209 kgCO2e 22,092Project emission CO2 of biogas combustion 412.5 kgCO2e 4,125 GHG emission reduction 1, 796 kgCO2e 17,967 C. EcoSecurities Ltd. - Winrock International for Nepal Emission
source Baseline Project
Manure treatment/ Fertilizer displacement
CH4 emissions from storing and burning cow dung and from cow dung applied in the field
Leakage of biogas from digester
N2O emissions from storing and burning cow dung and from cow dung applied in the field
N2O emissions from biogas slurry pit N2O emissions from slurry used in the field
N2O emissions from displaced chemical fertilisers Fuel use CO2 emissions from kerosene CO2 emissions from burning unsustainable fuel wood CH4 emissions from burning of fuel wood Nepal Terai
(tCO2eq/digester/year)
Hills (tCO2eq/digester/year)
Mountain (tCO2eq/digester/year)
4 m3 2.65 3.13 3.216 m3 6.00 4.54 4.628 m3 7.76 5.38 5.4810 m3 6.21 4.35 4.05

5. POTENTIAL IMPACT OF CDM BIOGAS PROJECT The potential impact of the CDM biogas project in selected Far East Asian countries is shown in Table x for ruminant and Table X for monogastric livestock.
Table XX. Potential CDM IBS digester, CER and Revenues estimated for the ruminant (cattle, dairy, buffalo and goat) livestock units in Far East Asia.
Country (2002)
Total Ruminant Livestock Units
(LU)
Rural Population
(1,000)
Rural Households
(HH) fo 5 LU/ HH
LU suitable for Digester (2LU/
digester)
Potential HH biogas digester
(45%)*
Total kWh at 2kWh per digester
Transaction cost** (US$100
0)
CER @4.7tCO
2e/ digester (ktCO2e/
yr)
Yearly Revenues @ US$4/
tCO2e (US$)
Bangladesh 16,384,400 106,176,000 21,235,200 0.77 8,192,200 3,686,490 7,372,980 33,122 17,327 69,305
Bhutan 184,018 2,023,100 404,620 0.45 92,009 41,404 82,808 372 195 778
Cambodia 2,339,036 11,303,100 2,260,620 1.03 1,169,518 526,283 1,052,566 4,728 2,474 9,894
China 103,904,296 806,657,100 161,331,420 0.64 51,952,148 23,378,467 46,756,933 210,047 109,879 439,515
India 176,780,000 754,819,000 150,963,800 1.17 88,390,000 39,775,500 79,551,000 357,368 186,945 747,779
Indonesia 11,046,588 123,473,000 24,694,600 0.45 5,523,294 2,485,482 4,970,965 22,331 11,682 46,727
Laos PDR 1,560,335 4,414,000 882,800 1.77 780,168 351,075 702,151 3,154 1,650 6,600
Malaysia 630,468 9,871,000 1,974,200 0.32 315,234 141,855 283,711 1,275 667 2,667
Myanmar 9,491,884 34,877,000 6,975,400 1.36 4,745,942 2,135,674 4,271,348 19,188 10,038 40,151
Nepal 6,084,477 21,526,000 4,305,200 1.41 3,042,239 1,369,007 2,738,015 12,300 6,434 25,737
Pakistan 30,958,300 99,381,000 19,876,200 1.56 15,479,150 6,965,618 13,931,235 62,583 32,738 130,954
Philippines 4,469,501 31,279,000 6,255,800 0.71 2,234,751 1,005,638 2,011,275 9,035 4,726 18,906
Sri Lanka 924,145 14,485,000 2,897,000 0.32 462,073 207,933 415,865 1,868 977 3,909
Vietnam 4,530,440 58,527,780 11,705,556 0.39 2,265,220 1,019,349 2,038,698 9,158 4,791 19,164
Total 369,287,888 2,078,812,080 415,762,416 0.77 184,643,944 83,089,775 166,179,550 746,530 390,522 1,562,088
Table X. Potential number of IBS and CER and revenues from the monogastic (pig, poultry, ducks) livestock unit in the Far East Asia.
Country (2002)
Total Monogastric
Livestock* Units (LU)
Rural Population
Rural Households (HH)
for 5 LU/ HH
LU suitable for IBS Digester
(2LU/digester)
Potential HH digester **
(45%)
Total kWh @ 2kWh per
digester
Transaction cost***
(US$1000)
CER @4.7tCO2e/
digester (ktCO2e/yr)
Yearly Revenues
@US$4/tCO2e (US$1000)
Bangladesh 1,515,000 106,176,000 21,235,200 0.07 757,500 484,800 969,600 4,356 2,279 9,114
Bhutan 10,590 2,023,100 404,620 0.03 5,295 3,389 6,778 30 16 64
Cambodia 756,139 11,303,100 2,260,620 0.33 378,070 241,964 483,929 2,174 1,137 4,549
China 140,371,056 806,657,100 161,331,420 0.87 70,185,528 44,918,738 89,837,476 403,578 211,118 844,472
India 11,970,000 754,819,000 150,963,800 0.08 5,985,000 3,830,400 7,660,800 34,415 18,003 72,012
Indonesia 14,125,802 123,473,000 24,694,600 0.57 7,062,901 4,520,257 9,040,513 40,613 21,245 84,981Lao People's Democratic Republic 524,790 4,414,000 882,800 0.59 262,395 167,933 335,866 1,509 789 3,157
Malaysia 2,194,480 9,871,000 1,974,200 1.11 1,097,240 702,234 1,404,467 6,309 3,300 13,202
Myanmar 1,761,970 34,877,000 6,975,400 0.25 880,985 563,830 1,127,661 5,066 2,650 10,600
Nepal 404,682 21,526,000 4,305,200 0.09 202,341 129,498 258,996 1,163 609 2,435
Pakistan 1,565,000 99,381,000 19,876,200 0.08 782,500 500,800 1,001,600 4,499 2,354 9,415
Philippines 4,304,775 31,279,000 6,255,800 0.69 2,152,388 1,377,528 2,755,056 12,377 6,474 25,898
Sri Lanka 132,968 14,485,000 2,897,000 0.05 66,484 42,550 85,100 382 200 800
Vietnam 5,713,525 58,527,780 11,705,556 0.49 2,856,763 1,828,328 3,656,656 16,427 8,593 34,373
Total 188,689,778 2,079,623,080 415,924,616 1.69 94,344,889 60,380,729 120,761,458 42,498 283,789 1,135,158
* 1 LU = 500 kg live weight. ** Assume 45% of the LUs are suitable for IBS digester development. *** Based on 6,500 digesters per PDD for simplified methodology; at US$58,400 per PDD.

IMPACT OF GHGs EMISSION AND REVENUES Mekong delta (Kampuchea, Laos, Myanmar) and East Asian (India, Pakistan, Nepal), countries showed higher ruminant livestock units (LU) per rural household (HH) than China, Malaysia, Philippines and Indonesia (Table x). For the monogastric LU/HH the reverse is true (Table x) which is a reflection of culture and religious affiliation and to some degree economic growth. As urbanization increases, monogastric growth seems to become more important. The number of potential biogas digester that can be developed from ruminant waste ranges from 41,404 for Bhutan to 39 million for India based on 45% of the LU available for digester development (Table x). This has the potential to generate an annual CER of 195,000 tCO2e to 186 MtCO2e for India and potential revenue of US$ 747.7 million per year based at US$4 per tCO2e. Nepal has a potential of 1.3 million digester generating CER of 6 MtCO2e/yr worth US$26 million. Pakistan could generate an annual CER of 32.7 MtCO2e worth US$130.9 million from 6.9 million digesters. China could generate 109 MtCO2e/yr worth US$439million from a potential of 23 million digesters. The Mekong delta countries show great potential for developing biogas digester project because of their higher ruminant LU/HH density. For the monogastric species, China, Vietnam, Indonesia and the Philippines show greater potential in developing large and small scale CDM biogas project (Table x). The transaction cost for developing these CDM projects is based on existing inflexible bundling rulings where the upper limit is fixed at 15 MW. Figure X. Poultry density Figure X. Pig density Impact poverty alleviation and gender CDM biogas projects have the greatest potential to meet the Millennium Development Goals (MDG) (Appendix xx) and in combating poverty and should be promoted by national government to CER buyers as high quality CDM projects as means to fetch higher premium. This could be achieved by using the standards (template) developed by the WWF for monitoring and evaluating SD indicators (Appendix xx). Hence it is

vital for host country to put in place a set of sound Sustainable Development criteria which may includes strengthening the five capitals (human, natural, environmental, financial and manufacturing) of the local community. Table XX. Matrix of Sustinable development indicators
by which a IBS project acvititvy must be assessed for the WWF Gold Standard Local/regional/global environment
• Water quality and quantity • Air quality • Other pollutants • Soil condition • Biodiversity (species and habitat conservation)
Social sustainablity and development • Employment (quality) • Livelihood for the poor • Access to energy services • Human and institutional capacity
Economic and technological development • Employment (job creation) • Impact on balance of payments • Technological self reliance
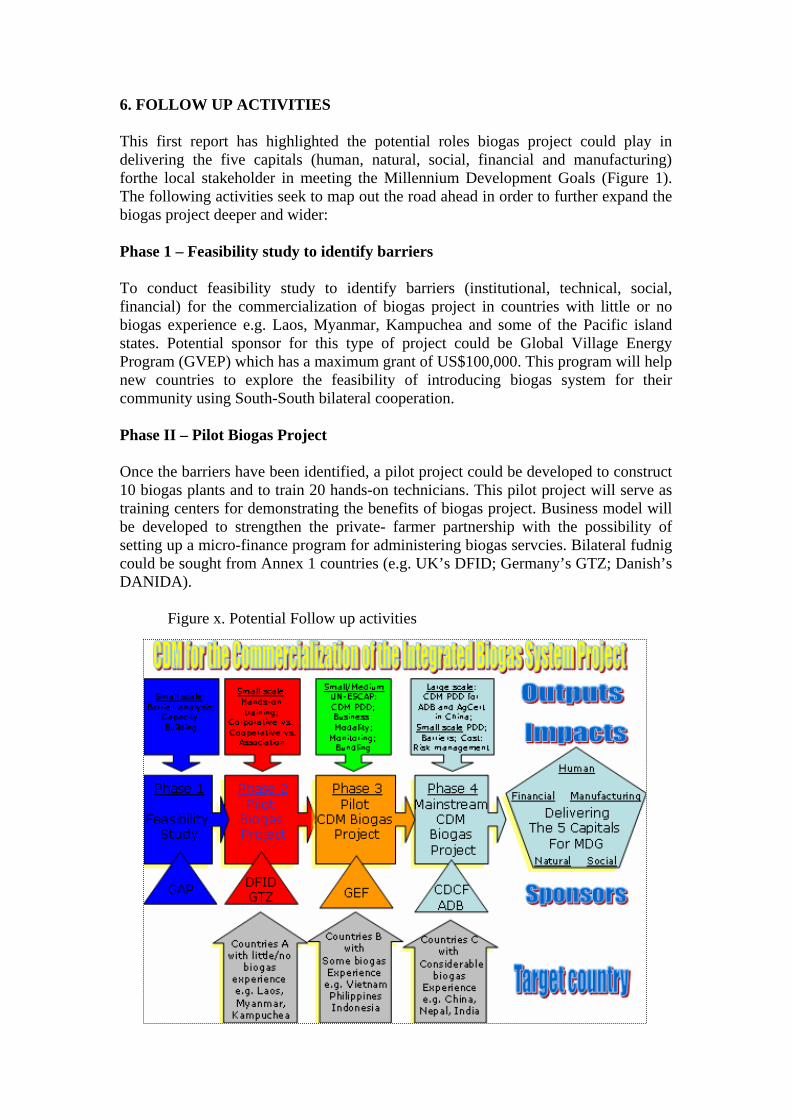
6. FOLLOW UP ACTIVITIES This first report has highlighted the potential roles biogas project could play in delivering the five capitals (human, natural, social, financial and manufacturing) forthe local stakeholder in meeting the Millennium Development Goals (Figure 1). The following activities seek to map out the road ahead in order to further expand the biogas project deeper and wider: Phase 1 – Feasibility study to identify barriers To conduct feasibility study to identify barriers (institutional, technical, social, financial) for the commercialization of biogas project in countries with little or no biogas experience e.g. Laos, Myanmar, Kampuchea and some of the Pacific island states. Potential sponsor for this type of project could be Global Village Energy Program (GVEP) which has a maximum grant of US$100,000. This program will help new countries to explore the feasibility of introducing biogas system for their community using South-South bilateral cooperation. Phase II – Pilot Biogas Project Once the barriers have been identified, a pilot project could be developed to construct 10 biogas plants and to train 20 hands-on technicians. This pilot project will serve as training centers for demonstrating the benefits of biogas project. Business model will be developed to strengthen the private- farmer partnership with the possibility of setting up a micro-finance program for administering biogas servcies. Bilateral fudnig could be sought from Annex 1 countries (e.g. UK’s DFID; Germany’s GTZ; Danish’s DANIDA).
Figure x. Potential Follow up activities

Phase III – Development of CDM pilot project. Where there is already substantial biogas capability such as Vietnam, pilot CDM project could be proposed to serve as ‘learning by doing’ program. GEF funding could be applied for this purpose. Lessons learnt will be valuable. Phase IV – Full commercialization of CDM project using Agricultural Sectoral policy based approach Where there is strong and established biogas experience such as in China, Nepal, India and Bangladesh, full CDM could be developed using sectoral approach as discussed earlier. This project will help to overcome the perverse incentive so often encounter in project-based CDM. CER will be allocated to the sector for the national government. Registry and verify. This could also cover for sanitation CDM such as for the DEWAT system.
Nearer term opportunities for AD development
• Conduct information outreach to educate communities, policy makers and AD industry on opportunities and benefits associated with AD development in host country
• Conduct solicitation on AD development • Establish a forum to coordinate, plan and evaluate AD development in host country • Help assist in technology development, environmental responsiveness and
community oriented financing of AD projects • Encourage research activities on improving biogas yield and electricity conversion
efficiency, and reducing cost of AD. • Encourage research activities on small-scale engine generator to fit the need of a
typical size using AD technology.
Longer term opportunities
• Encourage research activities on improving biogas yield and electricity conversion efficiency, and reducing cost of AD.
• Encourage research activities on small-scale engine generator to fit the need of a typical size using AD technology.
• Development of AD using advantaged technologies (i.e., high rate at high solid concentration, thermophilic temperature, advantaged digester design)
• Encourage research activities on improving biogas yield and electricity conversion efficiency, and reducing cost of AD.
Conclusions and guidelines for Potential Developers In view of the high fossil fuel prices and declining ODA contribution to national development program, innovative carbon finance could provide a timely opportunity for reinvigorating the uptake and commercialisation of IBS for national development in poverty alleviation. However the followings must be considered when designing any CDM projects: • It is important to identify and understand the barriers (market size, delivery
system, local acceptance, business model, local competence, rural energy

consumption pattern, local policy, CDM institutional capacity) and the risks involved in developing CDM in a particular country.
• Creative effort must be made to reduce transaction cost and reduce risk – how to bundle cost effectively – utilize existing delivery mechanism – organizational cost and monitoring cost, utilize as much of the local effort as possible suing participatory approach to create a solidarity of ownership and comradery.
• Minimize all risks by tackling the following problems: o Using standard digester sizes and certified hardware for bundled projects; o Thorough participatory baseline analysis for resource, social, wealth and
health mapping o For verification of CERs, monitoring can be combined with the Operation
and Maintenance using the service contracts (24 hours respond to complaint and repair within 2 days) built into the dealerships for the equipment
o Limiting the crediting period to lower risk of non delivery of CER o Drawing on international experience and progress to design baseline and
monitoring plan that will allow the carbon integrity to be maximized and realized.

7. REFERENCES ADB, 1998. Asia Least Cost Abatement Strategy. (ALGAS). Asia Development Bank, Manila, Philippines. October 1998. Bhardwaj, N., Partan, B., de Coninck, H.C., Roos, C., van der Linden, N.H., Green, J and Mariyappan, J. 2004. Realising the potential of small scale CDM projects in India. IT-Power-ECN report for EU-Synergy Programme. Global Livestock Production and Health Atlas. Livestock Information and Policy Branch, FAO HQ, Room C510, Viale delle Terme di Caracalla, 00100, Rome, Italy. (http://www.fao.org/ag/aga/glipha/index.jsp). Mariyappan, J, Taylor, S, Church, J, and Green, J. 2004. CDM project to stimulate the market for family hydro for low income families: Final Technical Report. DFID Knowledge and Research (KaR) Programme. Nierenberg, D. 2003. FACTORY FARMING IN THE DEVELOPING WORLD. Worldwatch Institute. Rai, K, 2005. Monitoring and Evaluation of the impact of renewable energy programmes: A toolkit for applying participatory approaches. An IT-Power report supported by Renewable Energy and Efficiency Partnership (REEEP). Saghir, J. 2005. The Global investment challenge: Financing the growth of renewable energy in developing countries. Renewable Energy World, July-August 205, vol. 8:4. James and James (Science Publishers) Ltd. U.K. Tang, Ying Hao, et al. 2005. A summary report of the survey on industrial biogas potential in Vanuatu and report of the Biogas Training workshops. Bilateral PRC-Vanuatu Biogas Project. Chengdu Energy-Environment International Corporation (CEEIC).
Winrock International Institute for Agricultural Development, 1996. In”MINING THE URBAN WASTE STREAM FOR ENERGY: Options, Technological Limitations,and Lessons from the Field”. Office of Energy, Environment, and Technology Center for Environment Bureau for Global Programs, Field Support, and Research. United States Agency for International Development.
World Health Organization (2000). “Addressing the links between indoor air pollution, household energy and human health”. Geneva: World Health Organization. Available at http://www.who.int/mediacentre/events/HSD_Plaq_10.pdf gy Transfer Rongjun Chen, 1997. Livestock-biogas-fruit systems in South China. Ecological Engineering, 8:19-29. Reprinted from Ecological Engineering. Vol. 8 Copyright 1997, Elsevier Science . United Nations Environment UNEP (2001). Managing Technological Change.

Appendix XX: The Socio-economic and environmental benefits of IBS Integrated Biogas System (IBS) when applied at the small farm level has the potential as intervention tools to bring the following economic, socio and environmental benefits: Economic benefits –
• Improved crop yield by 30-40% due to better soil fertility; • Reduced inorganic fertilizer input thus a saving of RMB 1,000 per year; • Improved income through improved gross margin and diversified cultivation and
production. • Potential to earn higher premium from certified organic food. • Improved livelihood lead to a greater capacity and incentive to adopt more
sustainable Conservation Agriculture practices for ensuring efficient resource management.
Environmental benefits –
• Better health through avoidance of using of smoky low quality coal and firewood for cooking and hygienic disposal of human waste;
• Reduce GHG emission (6.24 tCO2 equivalent per pig per year) by switching from electricity and firewood to Sulphur-scrubbed biogas lamp and stove;
• Reduce pollution of surface and ground water through the recycling of the pig and human wastes and digested sludge;
• Agronomically, liquid fertilizer and sludge improved plant health (more tolerant to pest and diseases) and land productivity by improving soil organic matter and humic acid buildup especially for reclaiming heavily degraded land.
• Potential to reduce enteric methane emission through improved animal husbandry (high quality feed and health).
• Potential to reduce nitrous oxide emission from replacement of imported fertilizer with organic fertilizer.
• Increased in carbon sink through soil and biomass carbon sequestration from reduced tillage and cultivation traffic under Conservation Agriculture practices.
Social Benefits –
• Generate new employment e.g. use of small tractor spreader to carry liquid fertilizer onto field;
• Greater synergy, cooperation and solidarity between villagers through the village Biogas Association and job sharing during the construction of the biogas system;
• Improvement in local capacity building through participation in training, study tours and workshops;
• Women-friendly technology – women relief of the need to look for firewood for cooking (3-4 hours per day) and strengthening of their position in the village through full participation in the biogas system;
• Potential to build a water cellar in a 5-in-1 biogas system for harvesting rain water for household use and crop irrigation.
Appendix X: Due Diligence checklist for eligibility test for project developer Table x: Comparison of aggregated emission per digester from India, China and Nepal Size biogas digester
A. Submitted PDD to develop 5,500 digesters in Kolar district, India (1.81 kw x 5,500 = 9.95 MW)
2 m3 4.93 tCO2e/ digester
Average yearly wood consumption for a household x emission coefficient for non-renewable woods + average yearly kerosene consumption of a household x emission coefficient for kerosene
1 PDD 5,500 digesters x 4.93 = 27,115 tCO2e /year x 7 yrs = 189,805 tCO2e B. ADB study to develop 10,000 digesters in Guangxi Zhuang Autonomous
Region Baseline Project 8 m3 i. CO2 from wood stove:
EFco2= 0.45 x 0.87 x 44/12 = 1.4355 kg CO2/Kg wood ii. 1.24 t wood x 1.4355 = 1.78 tCO2e/yr iii. CH4 from wood stove: EFch4= 0.45 x 0.87 x 16/12 x 21 = 0.132 kg CO2/Kg wood iv. 2.19 t/yr x 0.132 = 0.288 tCO2e/yr x 10,000 = 2,881 tCO2e/yr v. CH4 from pig: 3 pigs x 2.24 kg CH4/pig = 6.72 kgCH4 vi. EFch4= 141.12 kg CO2e x 10,000 = 1411 tCO2e/yr vii. Total = 1.78 +0.288 +0.141 = 2.209 yCO2e/yr x 10,000 = 22,092 tCO2/yr viii. Total = 2.209 – 0.4125 = 1.797 x 10,000 = 17,967 tCO2e/yr
8 m3 = 350 m3 biogas/yr x 60% = 210 m3 CH4/yr = 150 kg/yr = 412.5 kg CO2/yr = 10,000 x 412.5 = 4,125 tCO2e/yr
1 PDD 10,000 digesters x 1.797 = 17,967 tCO2e x 10 = 179,670 tCO2e Activity Emission per household Project (tCO2e/yr)Wood cook stove CO2 emission 1,780 kg CO2e 17,800Wood cook stove CH4 emission 288 kg CO2e 2,881 CH4 emission of manure 141 kg CO2e 1,411
Baseline emission
Sum 2,209 kgCO2e 22,092Project emission CO2 of biogas combustion 412.5 kgCO2e 4,125 GHG emission reduction 1, 796 kgCO2e 17,967 C. EcoSecurities Ltd. - Winrock International for Nepal Emission
source Baseline Project
Manure treatment/ Fertilizer displacement
CH4 emissions from storing and burning cow dung and from cow dung applied in the field
Leakage of biogas from digester
N2O emissions from storing and burning cow dung and from cow dung applied in the field
N2O emissions from biogas slurry pit N2O emissions from slurry used in the field
N2O emissions from displaced chemical fertilisers Fuel use CO2 emissions from kerosene CO2 emissions from burning unsustainable fuel wood CH4 emissions from burning of fuel wood Nepal Terai
(tCO2eq/digester/year)
Hills (tCO2eq/digester/year)
Mountain (tCO2eq/digester/year)
4 m3 2.65 3.13 3.216 m3 6.00 4.54 4.628 m3 7.76 5.38 5.4810 m3 6.21 4.35 4.05

Appendix XX: Baseline methodology for small scale biogas project.
Step 1: Identification of baseline and project emission sources
Emission source Baseline Project CH4 emissions from storing and burning cow dung and from cow dung applied in the field
Leakage of biogas from digester Manure treatment/ Fertilizer displacement
N2O emissions from storing and burning cow dung and from cow dung applied in the field
N2O emissions from biogas slurry pit
N2O emissions from slurry used in the field
N2O emissions from displaced chemical fertilisers
CO2 emissions from kerosene Fuel use CO2 emissions from burning unsustainable fuel wood
CH4 emissions from burning of fuel wood
Step 3: Identification of emission volumes per digester per region Step 2: Identification
of Emission Factors (EF)
Step 4: Calculation of emissions per source per digester per region
- Amount of cow dung fed into digester
- Amount of slurry used in the fields i) Manure: EF for
dairy, non-dairy and buffaloes from TIER 1 (IPCC); ii) Fuel-(IPCC)
By combining the EF with the volumes the emissions per source have been calculated.
- Amount of inorganic fertilizer displaced - Amount of fuel saved per household (kerosene) - Amount of methane leakage from biogas digesters into the air
Step 5: Aggregation of emission per source into one emission reduction factor per digester per region
The aggregate emission reduction factor consists of the difference baseline emissions minus project emissions

Appendix X. Table x: Comparison of aggregated emission per digester from India, China and Nepal Size biogas digester
A. Submitted PDD to develop 5,500 digesters in Kolar district, India (1.81 kw x 5,500 = 9.95 MW)
2 m3 4.93 tCO2e/ digester
Average yearly wood consumption for a household x emission coefficient for non-renewable woods + average yearly kerosene consumption of a household x emission coefficient for kerosene
1 PDD 5,500 digesters x 4.93 = 27,115 tCO2e /year x 7 yrs = 189,805 tCO2e B. ADB study to develop 10,000 digesters in Guangxi Zhuang Autonomous
Region Baseline Project 8 m3 i. CO2 from wood stove:
EFco2= 0.45 x 0.87 x 44/12 = 1.4355 kg CO2/Kg wood ii. 1.24 t wood x 1.4355 = 1.78 tCO2e/yr iii. CH4 from wood stove: EFch4= 0.45 x 0.87 x 16/12 x 21 = 0.132 kg CO2/Kg wood iv. 2.19 t/yr x 0.132 = 0.288 tCO2e/yr x 10,000 = 2,881 tCO2e/yr v. CH4 from pig: 3 pigs x 2.24 kg CH4/pig = 6.72 kgCH4 vi. EFch4= 141.12 kg CO2e x 10,000 = 1411 tCO2e/yr vii. Total = 1.78 +0.288 +0.141 = 2.209 yCO2e/yr x 10,000 = 22,092 tCO2/yr viii. Total = 2.209 – 0.4125 = 1.797 x 10,000 = 17,967 tCO2e/yr
8 m3 = 350 m3 biogas/yr x 60% = 210 m3 CH4/yr = 150 kg/yr = 412.5 kg CO2/yr = 10,000 x 412.5 = 4,125 tCO2e/yr
1 PDD 10,000 digesters x 1.797 = 17,967 tCO2e x 10 = 179,670 tCO2e Activity Emission per household Project (tCO2e/yr)Wood cook stove CO2 emission 1,780 kg CO2e 17,800Wood cook stove CH4 emission 288 kg CO2e 2,881 CH4 emission of manure 141 kg CO2e 1,411
Baseline emission
Sum 2,209 kgCO2e 22,092Project emission CO2 of biogas combustion 412.5 kgCO2e 4,125 GHG emission reduction 1, 796 kgCO2e 17,967 C. EcoSecurities Ltd. - Winrock International for Nepal Emission
source Baseline Project
Manure treatment/ Fertilizer displacement
CH4 emissions from storing and burning cow dung and from cow dung applied in the field
Leakage of biogas from digester
N2O emissions from storing and burning cow dung and from cow dung applied in the field
N2O emissions from biogas slurry pit N2O emissions from slurry used in the field
N2O emissions from displaced chemical fertilisers Fuel use CO2 emissions from kerosene CO2 emissions from burning unsustainable fuel wood CH4 emissions from burning of fuel wood Nepal Terai
(tCO2eq/digester/year)
Hills (tCO2eq/digester/year)
Mountain (tCO2eq/digester/year)
4 m3 2.65 3.13 3.216 m3 6.00 4.54 4.628 m3 7.76 5.38 5.4810 m3 6.21 4.35 4.05
Appendix XX: Example of EU directive for landfill and climate change policy.
Legislation
EU Landfill Directive
The EU Landfill Directive includes statutory targets for the reduction of the landfilling of biodegradable waste (kitchen waste, garden waste, paper, card, textiles and wood). The rationale is that the uncontrolled decomposition in a landfill causes: the emission of methane (a very powerful greenhouse gas) and of carbon dioxide; the production of leachate; and the attraction of vermin. Of the fractions of biodegradable waste it is food waste which has by far the greatest environmental impact. A biogas plant uses a similar process to that taking place in a landfill site, the key differences being that the former is contained & controlled, and takes only one month compared with many years in a landfill.
EU Animal By-Products Regulation
The EU Animal By-Products Regulation came into force across the European Community on 1st May. This divides animal by-products into 3 categories:
• Category 1 is high risk and must be incinerated. • Category 2 is material unfit for human consumption, e.g. fallen stock and animals
which have failed inspections. Most types of this material must be incinerated or rendered (133°C, 3 bar, 20 minutes).
• Category 3 is material which is fit for but not destined for human consumption, and it is this category which has the widest range of definition and on which the EU-ABPR has the greatest impact in terms of the permissible changes to the disposal route.
Category 3 material includes:
• Abattoir by-products such as soft offal, blood and feathers. • Food factory waste. • Food waste from retail outlets, in particular supermarkets. • Catering waste, including kitchen waste from domestic households and commercial
kitchen waste. • Category 2 material, which has been pressure-cooked.
Category 3 material may be incinerated, rendered or transformed in a composting or biogas plant; only catering waste and retail outlet waste may be landfilled, but the latter only until December 2005. The issue is further complicated in that if a composting or biogas plant transforms only catering waste, then the treatment standard may be set by member states. A biogas plant is likely to treat a combination of materials and is therefore subject to the strict standards set down by the EU, namely:
• The process must be in-vessel; controlled anaerobic digestion is by definition in-vessel.
• The maximum particle size of material is 12 mm. • All material must be pasteurised at a minimum temperature of 70°C for one hour. • Procedures must be adopted to prevent recontamination of the final product with raw
waste.

• Samples of the final product must be free of salmonella.
The Sunrise Project carried out by Greenfinch in partnership with the University of Southampton reached the following conclusion with respect to pathogen destruction, that:
• Mesophilic or thermophilic anaerobic digestion with the additional process stage of pasteurisation at 70°C for one hour achieves the eradication of salmonella, E.coli and F.streptococci, meeting the standards of the EU-ABPR.
It is EU policy that food waste and other animal by-products should be recycled as biofertiliser to improve the quality of soil, but that it is imperative that this is carried out safely with minimal risk to animal and human health. It is in all our interests to develop a sustainable economy in which resources are reused and recycled. It is has been confirmed that biogas technology is well placed to achieve this, and at the same time to produce renewable energy, contributing to the low carbon economy. Draft EU Biowaste Directive In its current draft the Biowaste Directive encourages the recycling of food waste to agricultural land to improve the organic quality of soil and its macro- and micro-nutrients. If this directive is implemented, local authorities will be forced to adopt separate collection schemes for food waste. Climate Change Legislation It is the policy of the EU and its member states that urgent means are applied to significantly reduce the emission of greenhouse gases. The controlled anaerobic digestion of food waste contributes in two ways: first, it prevents the emission of methane and carbon dioxide to atmosphere from uncontrolled decomposition; and second, by producing renewable energy the carbon dioxide emissions replace those which would otherwise have been emitted from burning fossil fuels.