cdfr 2005 04 prsnttn c5cmufireregimeanalysis
DESCRIPTION
http://foothillsri.ca/sites/default/files/null/CDFR_2005_04_Prsnttn_C5CMUFireRegimeAnalysis.pdfTRANSCRIPT

C5 FMU FIRE REGIME ANALYSIS
Marie-Pierre Rogeau, M.Sc.Wildland Disturbance Consulting

PRESENTATION OUTLINE
• Study area• Research objectives• Overview of methods Used• Recent fire regime (1950 – 2003)• Historical fire regime• Recent fire mapping• Fire regime modeling• Field results from K. Country

RESEARCH OBJECTIVES
• To identify the number of fire regimes on the landscape (how homogeneous the fire regime really is)
• To determine the age-class distribution & NRV
• To determine fire size distribution
• To determine the spatial NRV of the fire cycle

OVERVIEW OF METHODS USED
• Recent fire regime approach– Fire occurrence database: 1950 – 2003– Lightning strike database: 1990 – 2003– Probability of ignition model
• Historical fire regime approach– 1950 aerial photography screening by watershed of
several fire regime parameters such as: veg. complexity, no. of fires, TSF, max. forest age
• Recent fire mapping1950 photographs to map fires from 1930-1950
• Fire regime modeling approach– Fire regime knowledge, FBP fuel map, real fire weather
data, p. of ignition map, p. of burning map
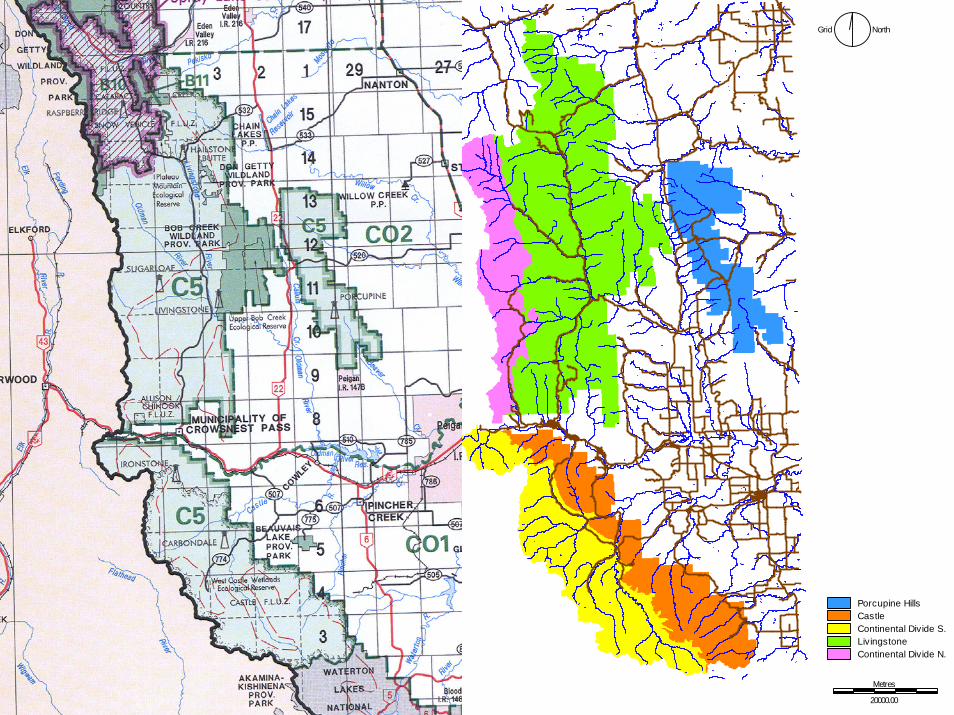
STUDY AREA
NorthGrid
Metres
20000.00
Porcupine HillsCastleContinental Divide S.LivingstoneContinental Divide N.
RECENT FIRE REGIME
0
50
100
150
200
250
J F M A M J J A S O N D
Peoplefires
Lightningfires
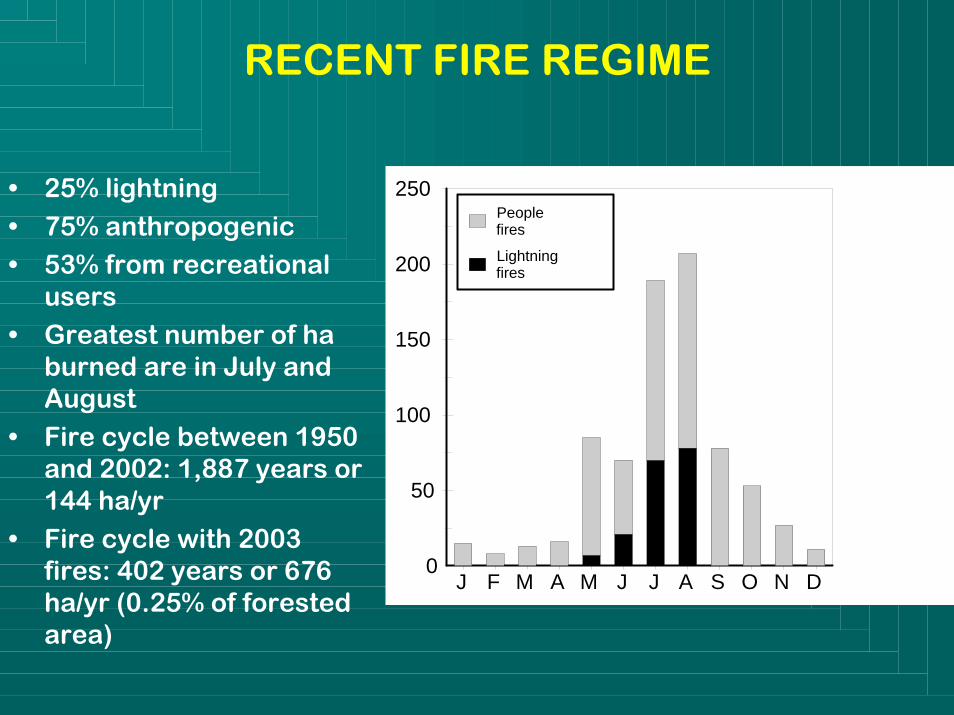
• 25% lightning• 75% anthropogenic• 53% from recreational
users• Greatest number of ha
burned are in July and August
• Fire cycle between 1950 and 2002: 1,887 years or 144 ha/yr
• Fire cycle with 2003 fires: 402 years or 676 ha/yr (0.25% of forested area)

RECENT FIRE REGIME
Ignition type P. Hills Castle C.D.S Living. C.D.N
Lightning 36.94 20.67 17.56 15.25 9.89
People 23.16 20.52 20.65 20.63 15.50
All 27.42 20.57 19.69 18.96 13.76
% Area of C5 11.20 15.35 18.85 43.43 11.16

Metres
25000.00
1-10 strikes11-1516-2021-30> 30
Avg. Yearly Lightning Strike Density
RECENT FIRE REGIME
• Cross-tabulation results show that lightning strike density is a poor indicator of lightning fire occurrence.
• This map was not included in the p. of ignition model.
RECENT FIRE REGIME
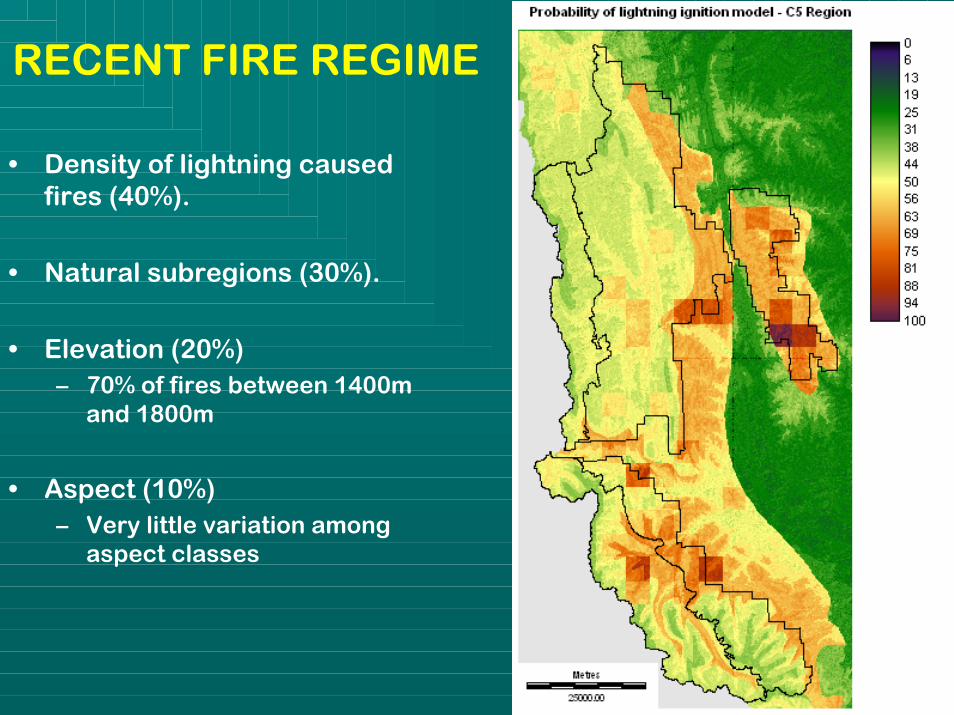
• Density of lightning caused fires (40%).
• Natural subregions (30%).
• Elevation (20%)– 70% of fires between 1400m
and 1800m
• Aspect (10%)– Very little variation among
aspect classes

HISTORICAL FIRE REGIME
• Air photo screening by watershed (84)• Vegetation complexity• Total number of fires• Number of fires since 1900• Estimate of T-S-F• Estimate of oldest age• MFRI• Valley orientation• Fuel continuity (continuous/broken)

HISTORICAL FIRE REGIME 7
689
1011
54
15 1216
3171
2 1814 13
19 2120 22
2324 25
26
27
28
4243
46
4745
44
393841
40
374849
3332
2930
31
82 34
35 36 50
51 525361
8454 83
5556 5760
58
6263
6459
6566
67 68
69 70
78
71
7273
74757677
798081
NorthGrid
Metres
25000.00
Very LowLowModerateHighVery High
Vegetation complexity

Total no. of fires Recent fires
768
910
11
54
15 1216
3171
2 1814 13
19 2120 22
2324 25
26
27
28
4243
46
4745
44
393841
40
374849
3332
2930
31
82 34
35 36 50
51 525361
8454 83
5556 5760
58
6263
6459
6566
67 68
69 70
78
71
7273
74757677
798081
NorthGrid
Metres
25000.00
< 2 f ires3 - 5 f ires6 - 10 f ires11 - 15 f ires15+ fires
768
910
11
54
15 12163171
2 1814 13
1921
20 2223
24 2526
27
28
4243
46
4745
44
393841
40
374849
3332
2930
31
82 34
35 36 50
51 525361
8454 83
5556 5760
58
6263
6459
6566
67 68
69 70
78
71
7273
74757677
798081
NorthGrid
Metres
25000.00
01234

Time-since-fire Max. age
768
910
11
54
15 1216
3171
2 1814 13
19 2120 22
2324 25
26
27
28
4243
46
4745
44
393841
40
374849
3332
2930
31
82 34
35 36 50
51 525361
8454 83
5556 5760
58
6263
6459
6566
67 68
69 70
78
71
7273
74757677
798081
NorthGrid
Metres
25000.00
< 25 years26 - 5051 - 7576 - 100101 - 125
768
910
11
54
15 1216
3171
2 1814 13
19 2120 22
2324 25
26
27
28
4243
46
4745
44
393841
40
374849
3332
2930
31
82 34
35 36 50
51 525361
8454 83
5556 5760
58
6263
6459
6566
67 68
69 70
78
71
7273
74757677
798081
NorthGrid
Metres
25000.00
150 years200250300350+

MFRI Valley Orientation
768
910
11
54
15 12163171
2 1814 13
1921
20 2223
24 2526
27
28
4243
46
4745
44
393841
40
374849
3332
2930
31
82 34
35 36 50
51 525361
8454 83
5556 5760
58
6263
6459
6566
67 68
69 70
78
71
7273
74757677
798081
NorthGrid
Metres
25000.00
1 - 9 years10 - 1920 - 2930 - 3940 - 4950 - 59
768
910
11
54
15 1216
3171
2 1814 13
19 2120 22
2324 25
26
27
28
4243
46
4745
44
393841
40
374849
3332
2930
31
82 34
35 36 50
51 525361
8454 83
5556 5760
58
6263
6459
6566
67 68
69 70
78
71
7273
74757677
798081
NorthGrid
Metres
25000.00
Main NW-SEMain NE-SWMain N-SMain E-WNW-SE/NE-SWNW-SE/N-SNW-SE/E-WNE-SW/NW-SENE-SW/N-SNE-SW/E-WN-S/NE-SWN-S/NW-SEN-S/E-WE-W/NW-SEE-W/NE-SWE-W/N-S
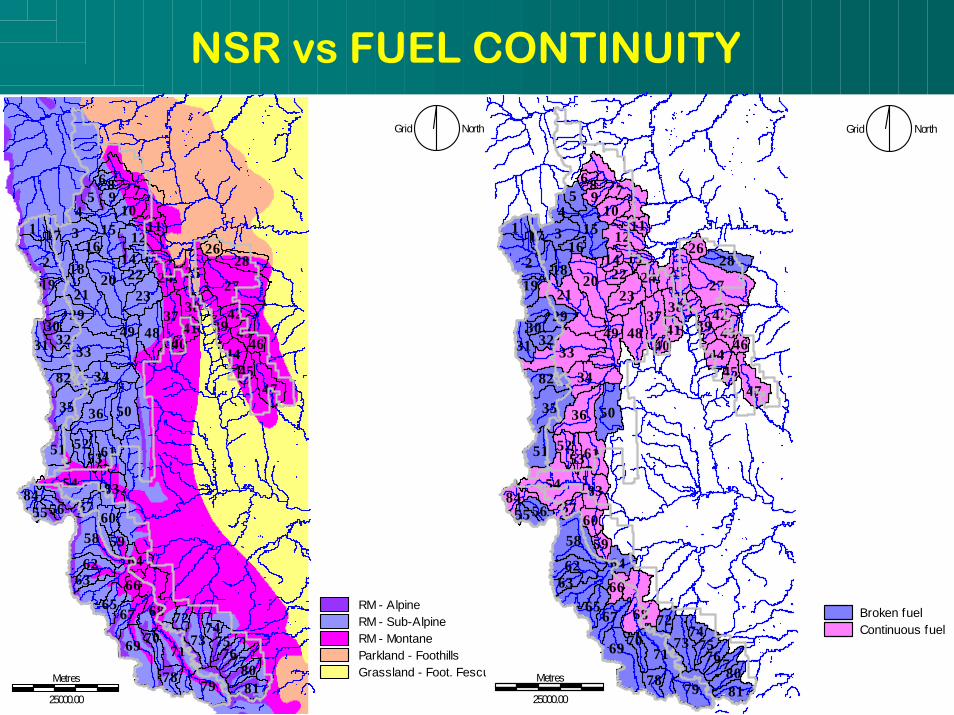
NSR vs FUEL CONTINUITY
768
910
11
54
15 12163171
2 1814 13
1921
20 2223
24 2526
27
28
4243
46
4745
44
393841
40
374849
3332
2930
31
82 34
35 36 50
51 525361
8454 83
5556 5760
58
6263
6459
6566
67 68
69 70
78
71
7273
74757677
798081
NorthGrid
Metres
25000.00
RM - AlpineRM - Sub-AlpineRM - MontaneParkland - FoothillsGrassland - Foot. Fescue
768
910
11
54
15 1216
317
2 1814 13
19 2120 22
2324 25
26
27
28
4243
46
4745
44
393841
40
374849
3332
2930
82 34
35 36 50
51 525361
54 8356 57
6058
6263
6459
6566
67 68
69 70
78
71
7273
74757677
798081
1
31
8455
NorthGrid
Metres
25000.00
Broken fuelContinuous fuel

NSR vs FUEL CONTINUITY
Fire Variable NSRFuel ContinuityComplexity 0.49 0.86Total fires 0.43 0.71TSF 0.43 0.75MFRI 0.45 0.8Max age 0.52 0.84
Cramer’s V measure of association

PRELIMINARY CONCLUSIONS
• Fire regime is not spatially homogeneous• Veg. complexity linked to fuel continuity and
not an E. to W. elevation gradient as observed in K. Country
• Fuel continuity map a good surrogate to map fire regimes rather than NSR
• 5 mngt subregions map is a good substitute to map fire regimes in greater details

PRELIMINARY CONCLUSIONS
• P. Hills has the most unique fire regime followed by the CDN
• Both Castle and the CDS are similar enough to be treated equally
• Livingstone shares similar fire regime elements with all other subregions, which makes it unique
• Regions of high to very high veg. complexity and high number of fires tend to coincide with regions of low probabilities of lightning ignition. This means that the historical fire regime had to be driven by anthropogenic sources of fire

1
2
3
4 5
6
7
8 9 10
111213
1314
15 16
17 18
19
Metres
20000.00
RECENT FIRE MAPPING
• Calculation of fire cycle for a period that was less impacted by fire suppression: 1930-1950.
• Fires mapped for the subalpine nsr.
• Fire cycle of 85 years or 2,400 ha/yr or 1.18% of forested area
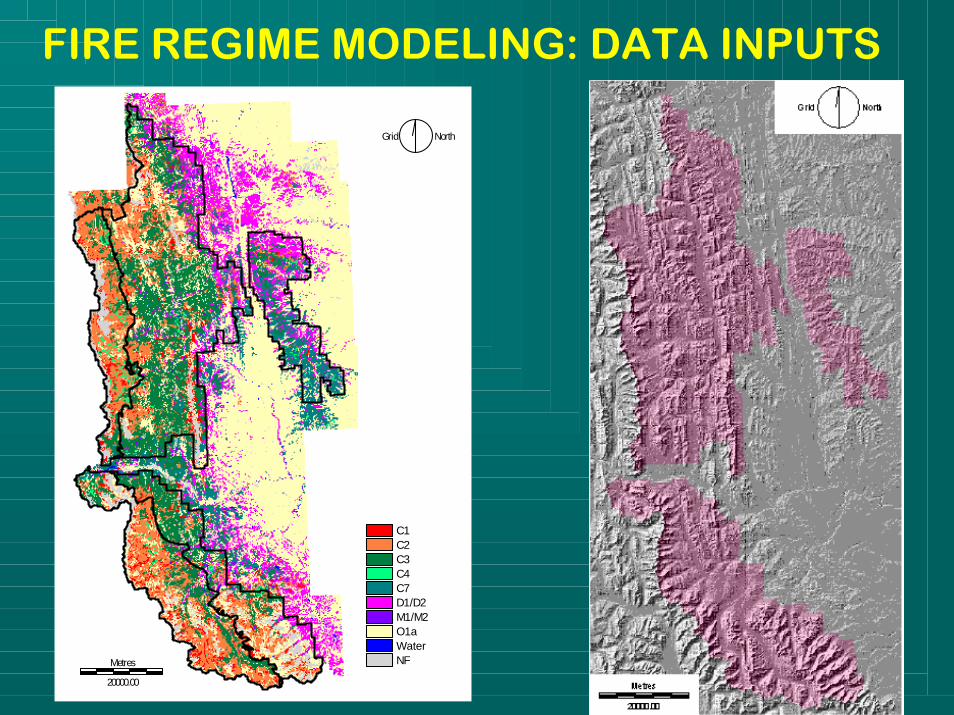
FIRE REGIME MODELING: DATA INPUTS
NorthGrid
Metres
20000.00
C1C2C3C4C7D1/D2M1/M2O1aWaterNF

FIRE REGIME MODELING: DATA INPUTSB1
B2HB
SLLV
C1PL
BQ
IS
CB
C2
NorthGrid
Metres
20000.00
Livingstone - C1Ironstone - ISWillow Creek - B2Porcupine - PLCarbondale - CBCastle - C2Blairmore - BQ

FIRE REGIME MODELING: DATA INPUTSNorthGrid
Metres
20000.00
01122334556677889100111122134145156167178
NorthGrid
Metres
20000.00
06121723293540465258636975818692

FIRE REGIME MODELING: DATA OUTPUTS
• Stand origin map• Fire count map• Age-class distribution + NRV• Accurate fire cycle + NRV• Fire size distribution

FIRE REGIME MODELING: DATA OUTPUTSStand Origin Fire Count
NorthGrid
Metres
20000.00
1-2020-4040-6060-8080-100100-120120-140140-160160-180180-200200-220220-240240-260260-280280-300300-500500-10001000+
NorthGrid
Metres
20000.00
023568911121415171820212324

FIRE CYCLE MODEL RESULTS
Sub Montane CDN Living. CDS Castle P.Hills
Avg FC 116 92 145 115 64 84 n/a
Std Dev 23 16 38 22 16 25
NRV FC 93-139 76-108 107-183 93-137 48-80 59-109
Shortest FC 70 60 80 70 40 40
Longest FC 190 150 270 170 110 160
Forested area 269,425 222,959 33,067 147,225 59,758 47,582 39,414
Annual area (ha/yr) 2,320 2,433 229 1,280 935 564
Avg dist. rate (%/yr) 0.86 1.09 0.69 0.87 1.56 1.19
NRV dist rate (ha) 1,938-2,8272,064-2,937 181-3091,075-1,583 747-1,245 437-807
Min dist. rate (ha) 1,418 1,486 123 866 543 297
Max dist. rate (ha) 3,849 3,716 413 2,103 1,494 1,190

NorthGrid
Metres
20000.00
Boreal - Dry Mix.RM - AlpineRM - Sub-AlpineRM - MontaneFoothills - UpperFoothills - LowerParkland - FoothillsParkland - CentralGrassland - Foot. Fescue
FIELD RESULTS K. COUNTRY

FIELD RESULTS K. COUNTRY
ACKNOWLEDGMENTS
• FMF for project funding
• ASRD for technical support– Kevin Quintilio– Dave Coish– Bev Wilson