cd008152
DESCRIPTION
http://cddep.org/sites/cddep.org/files/publication_files/cd008152.pdfTRANSCRIPT

Primaquine for reducing Plasmodium falciparum transmission
(Review)
Graves PM, Gelband H, Garner P
This is a reprint of a Cochrane review, prepared and maintained by The Cochrane Collaboration and published in The Cochrane Library2012, Issue 9
http://www.thecochranelibrary.com
Primaquine for reducing Plasmodium falciparum transmission (Review)
Copyright © 2012 The Cochrane Collaboration. Published by John Wiley & Sons, Ltd.

T A B L E O F C O N T E N T S
1HEADER . . . . . . . . . . . . . . . . . . . . . . . . . . . . . . . . . . . . . . .
1ABSTRACT . . . . . . . . . . . . . . . . . . . . . . . . . . . . . . . . . . . . . .
2PLAIN LANGUAGE SUMMARY . . . . . . . . . . . . . . . . . . . . . . . . . . . . . .
3SUMMARY OF FINDINGS FOR THE MAIN COMPARISON . . . . . . . . . . . . . . . . . . .
6BACKGROUND . . . . . . . . . . . . . . . . . . . . . . . . . . . . . . . . . . . .
Figure 1. . . . . . . . . . . . . . . . . . . . . . . . . . . . . . . . . . . . . . 6
8OBJECTIVES . . . . . . . . . . . . . . . . . . . . . . . . . . . . . . . . . . . . .
8METHODS . . . . . . . . . . . . . . . . . . . . . . . . . . . . . . . . . . . . . .
Figure 2. . . . . . . . . . . . . . . . . . . . . . . . . . . . . . . . . . . . . . 12
Figure 3. . . . . . . . . . . . . . . . . . . . . . . . . . . . . . . . . . . . . . 13
14RESULTS . . . . . . . . . . . . . . . . . . . . . . . . . . . . . . . . . . . . . . .
Figure 4. . . . . . . . . . . . . . . . . . . . . . . . . . . . . . . . . . . . . . 15
19ADDITIONAL SUMMARY OF FINDINGS . . . . . . . . . . . . . . . . . . . . . . . . . .
22DISCUSSION . . . . . . . . . . . . . . . . . . . . . . . . . . . . . . . . . . . . .
24AUTHORS’ CONCLUSIONS . . . . . . . . . . . . . . . . . . . . . . . . . . . . . . .
25ACKNOWLEDGEMENTS . . . . . . . . . . . . . . . . . . . . . . . . . . . . . . . .
25REFERENCES . . . . . . . . . . . . . . . . . . . . . . . . . . . . . . . . . . . . .
29CHARACTERISTICS OF STUDIES . . . . . . . . . . . . . . . . . . . . . . . . . . . . .
47DATA AND ANALYSES . . . . . . . . . . . . . . . . . . . . . . . . . . . . . . . . . .
Analysis 1.1. Comparison 1 GIVEN WITH CQ, OR CQ+SP, Outcome 1 Participants with gametocytes. . . . . 50
Analysis 1.2. Comparison 1 GIVEN WITH CQ, OR CQ+SP, Outcome 2 Participants with asexual parasites (treatment
failure day 29). . . . . . . . . . . . . . . . . . . . . . . . . . . . . . . . . . 52
Analysis 2.1. Comparison 2 GIVEN WITH SP, Outcome 1 Participants with gametocytes. . . . . . . . . . 53
Analysis 2.2. Comparison 2 GIVEN WITH SP, Outcome 2 Participants with asexual parasites (treatment failure day 29). 55
Analysis 3.1. Comparison 3 GIVEN WITH MQ, OR MQ+SP, Outcome 1 Participants infectious. . . . . . . 56
Analysis 3.2. Comparison 3 GIVEN WITH MQ, OR MQ+SP, Outcome 2 Mosquitoes infected. . . . . . . . 57
Analysis 3.3. Comparison 3 GIVEN WITH MQ, OR MQ+SP, Outcome 3 Gametocyte clearance time (days). . . 58
Analysis 3.4. Comparison 3 GIVEN WITH MQ, OR MQ+SP, Outcome 4 Asexual parasite clearance time (hrs). . 58
Analysis 4.1. Comparison 4 GIVEN WITH QN, Outcome 1 Participants with gametocytes. . . . . . . . . 59
Analysis 4.2. Comparison 4 GIVEN WITH QN, Outcome 2 Asexual parasite clearance time (hours). . . . . . 60
Analysis 5.1. Comparison 5 GIVEN WITH AS, OR WITH ACTs, Outcome 1 Participants with gametocytes
(microscopy). . . . . . . . . . . . . . . . . . . . . . . . . . . . . . . . . . . 60
Analysis 5.2. Comparison 5 GIVEN WITH AS, OR WITH ACTs, Outcome 2 Participants with gametocytes (PCR). 63
Analysis 5.3. Comparison 5 GIVEN WITH AS, OR WITH ACTs, Outcome 3 Log(10) AUC of gametocyte density over
time d1-43. . . . . . . . . . . . . . . . . . . . . . . . . . . . . . . . . . . 64
Analysis 5.4. Comparison 5 GIVEN WITH AS, OR WITH ACTs, Outcome 4 Participants with asexual parasites (PCR). 64
Analysis 5.5. Comparison 5 GIVEN WITH AS, OR WITH ACTs, Outcome 5 Asexual parasite clearance time. . . 65
Analysis 5.6. Comparison 5 GIVEN WITH AS, OR WITH ACTs, Outcome 6 Haemoglobin concentration. . . . 66
Analysis 5.7. Comparison 5 GIVEN WITH AS, OR WITH ACTs, Outcome 7 % change in haemoglobin concentration. 67
Analysis 6.1. Comparison 6 ALL TREATMENTS COMBINED, Outcome 1 Participants with gametocytes at day 8
(microscopy). . . . . . . . . . . . . . . . . . . . . . . . . . . . . . . . . . . 68
69ADDITIONAL TABLES . . . . . . . . . . . . . . . . . . . . . . . . . . . . . . . . . .
73APPENDICES . . . . . . . . . . . . . . . . . . . . . . . . . . . . . . . . . . . . .
74HISTORY . . . . . . . . . . . . . . . . . . . . . . . . . . . . . . . . . . . . . . .
74CONTRIBUTIONS OF AUTHORS . . . . . . . . . . . . . . . . . . . . . . . . . . . . .
74DECLARATIONS OF INTEREST . . . . . . . . . . . . . . . . . . . . . . . . . . . . . .
75SOURCES OF SUPPORT . . . . . . . . . . . . . . . . . . . . . . . . . . . . . . . . .
75DIFFERENCES BETWEEN PROTOCOL AND REVIEW . . . . . . . . . . . . . . . . . . . . .
iPrimaquine for reducing Plasmodium falciparum transmission (Review)
Copyright © 2012 The Cochrane Collaboration. Published by John Wiley & Sons, Ltd.

[Intervention Review]
Primaquine for reducing Plasmodium falciparum transmission
Patricia M Graves1,2, Hellen Gelband3, Paul Garner4
1EpiVec Consulting, Atlanta, USA. 2School of Public Health, Tropical Medicine and Rehabilitation Sciences, James Cook University,
Cairns, Australia. 3Center for Disease Dynamics, Economics & Policy, Washington, DC, USA. 4International Health Group, Liverpool
School of Tropical Medicine, Liverpool, UK
Contact address: Patricia M Graves, School of Public Health, Tropical Medicine and Rehabilitation Sciences, James Cook University,
PO Box 6811, Cairns, Queensland, 4870, Australia. [email protected]. [email protected].
Editorial group: Cochrane Infectious Diseases Group.
Publication status and date: New, published in Issue 9, 2012.
Review content assessed as up-to-date: 5 July 2012.
Citation: Graves PM, Gelband H, Garner P. Primaquine for reducing Plasmodium falciparum transmission. Cochrane Database ofSystematic Reviews 2012, Issue 9. Art. No.: CD008152. DOI: 10.1002/14651858.CD008152.pub2.
Copyright © 2012 The Cochrane Collaboration. Published by John Wiley & Sons, Ltd.
A B S T R A C T
Background
Mosquitoes become infected with malaria when they ingest gametocyte stages of the parasite from the blood of a human host. Plasmodiumfalciparum gametocytes are sensitive to the drug primaquine (PQ). The World Health Organization (WHO) recommends giving a
single dose or short course of PQ alongside primary treatment for people ill with P. falciparum infection to reduce malaria transmission.
Gametocytes themselves cause no symptoms, so this intervention does not directly benefit individuals. PQ causes haemolysis in some
people with glucose-6-phosphate dehydrogenase (G6PD) deficiency so may not be safe.
Objectives
To assess whether a single dose or short course of PQ added to treatments for malaria caused by P. falciparum infection reduces malaria
transmission and is safe.
Search methods
We searched the following databases up to 10 April 2012 for studies: the Cochrane Infectious Diseases Group Specialized Register; the
Cochrane Central Register of Controlled Trials (CENTRAL), published in The Cochrane Library; MEDLINE; EMBASE; LILACS;
metaRegister of Controlled Trials (mRCT) and the WHO trials search portal using ’malaria*’, ‘falciparum’, and ‘primaquine’ as search
terms. In addition, we searched conference proceedings and reference lists of included studies, and we contacted likely researchers and
organizations for relevant trials.
Selection criteria
Trials of mass treatment of whole populations (or actively detected fever or malaria cases within such populations) with antimalarial
drugs, compared to treatment with the same drug plus PQ; or patients with clinical malaria being treated for malaria at health facilities
randomized to short course/single dose PQ versus no PQ.
Data collection and analysis
Two authors (PMG and HG) independently screened all abstracts, applied inclusion criteria, and abstracted data. We sought data
on the effect of PQ on malaria transmission intensity, participant infectiousness, the number of participants with gametocytes, and
gametocyte density over time. We stratified results by primary treatment drug as this may modify any PQ effect. We calculated the
area under the curve (AUC) for gametocyte density over time for comparisons for which data were available, and also sought data on
1Primaquine for reducing Plasmodium falciparum transmission (Review)
Copyright © 2012 The Cochrane Collaboration. Published by John Wiley & Sons, Ltd.

haematologic and other adverse effects. We used GRADE guidelines to assess evidence quality, and this is reflected in the wording of
the results: high quality (“PQ reduces ....”); moderate quality (“PQ probably reduces ...”); low quality (“PQ may reduce....”); and very
low quality (“we don’t know if PQ reduces....”).
Main results
We included 11 individually randomized trials, with a total of 1776 individuals. The 11 trials included 20 comparisons with partner
drugs, which included chloroquine (CQ), sulfadoxine-pyrimethamine (SP), mefloquine (MQ), quinine (QN), artesunate (AS), and a
variety of artemisinin combination therapies (ACTs). For G6PD deficiency, studies either did not test (one study), tested and included
all (one study), included only G6PD deficient (one study), excluded G6PD deficient (two studies), or made no comment (six studies).
None of the trials we included assessed effects on malaria transmission (incidence, prevalence, or entomological inoculation rate (EIR))
in the trial area.
With non-artemisinin drug regimens, PQ may reduce the infectiousness to mosquitoes of individuals treated, based on one small study
with large effects (Risk Ratio (RR) 0.06 on day 8 after treatment, 95% confidence interval (CI) 0 to 0.89; low quality evidence).
Participants who received PQ had fewer circulating gametocytes up to day 43 (log(10) AUC relative decrease from 24.3 to 27.1%, one
study (two comparisons), moderate quality evidence); and there were 38% fewer people with gametocytes on day 8 (RR 0.62, 95% CI
0.51 to 0.76, four studies (five comparisons), moderate quality evidence). We did not identify any study that looked for effects of the
drug on haemolytic anaemia.
With artemisinin-based drug regimens, we do not know if PQ influences infectiousness to mosquitoes, as no study has examined this
directly. PQ probably reduces infectiousness, based on reduction in log(10) AUC (relative decrease range from 26.1% to 87.5%, two
studies (six comparisons), moderate quality evidence); and reduces by 88% the number of participants with gametocytes on day 8 (RR
0.12, 95% CI 0.08 to 0.20, four studies (eight comparisons), moderate quality evidence).
When used with artemisinin-based regimens, we do not know if PQ results in haemolytic anaemia; one trial reported percent change
in mean haemoglobin against baseline, and for the PQ group this indicated a significantly greater drop at day 8 in those given PQ (very
low quality evidence). Overall, the safety of PQ used in single dose or short course was poorly evaluated.
Authors’ conclusions
We do not know whether PQ added to treatment regimens for patients with P. falciparum infection reduces transmission of malaria. In
individual patients, it reduces gametocyte prevalence and density. In practical terms, even if PQ results in large reductions in gametocytes
in people being treated for malaria, there is no reliable evidence that this will reduce transmission in a malaria-endemic community,
where many people are infected but have no symptoms and are unlikely to be treated. Since PQ is acting as a monotherapy against
gametocytes, there is a risk of the parasite developing resistance to the drug. In terms of harms, there is insufficient evidence from trials
to know whether the drug can be used safely in this way in populations where G6PD deficiency occurs.
In light of these doubts about safety, and lack of evidence of any benefit in reducing transmission, countries should question whether to
continue to use PQ routinely in primary treatment of malaria. Further synthesis of observational data on safety and new trials may help
elucidate a role for PQ in malaria elimination, or in situations where most infected individuals are symptomatic and receive treatment.
P L A I N L A N G U A G E S U M M A R Y
Should people treated for malaria caused by P. falciparum infection take a single dose of primaquine along with primary
treatment?
Drugs that cure malaria caused by P. falciparum infection do not necessarily directly affect the gametocyte, which is the stage of the
parasite that infects mosquitoes to complete the transmission cycle. Primaquine (PQ), a drug with antimalarial properties, does not cure
P. falciparum infection but does kill P. falciparum gametocytes. Because of this property, this drug has long been recommended as a single
dose or short course add-on to P. falciparum infection treatment regimens. It is now recommended by the World Health Organization
(WHO) and several national malaria control programs, with the intention of reducing community level malaria transmission. However,
this drug also has potentially serious side effects in people with glucose-6-phosphate dehydrogenase (G6PD) deficiency, a common
genetic variant. When they take this drug it may cause haemolysis (disintegration of red blood cells) which can be serious. This review
examines the evidence of benefits and harms of PQ from trials where it has been used as an additional treatment intended to prevent
malaria transmission.
2Primaquine for reducing Plasmodium falciparum transmission (Review)
Copyright © 2012 The Cochrane Collaboration. Published by John Wiley & Sons, Ltd.

We found no studies testing whether the drug influences transmission intensity of malaria, and just one small study suggesting it reduces
the infectiousness of the parasite present in infected people to the mosquito. PQ probably reduces the potential infectiousness of the
parasite in people, as measured by the numbers of gametocytes circulating in the blood for up to six weeks after treatment. Regarding
safety, one study reported that there was a greater reduction in haemoglobin values in the PQ group at day 8, so the safety of the drug
remains uncertain if given to populations where G6PD occurs. Evidence of benefit and of safety is insufficient to recommend routine
use of PQ as an add-on for people being treated for malaria.
3Primaquine for reducing Plasmodium falciparum transmission (Review)
Copyright © 2012 The Cochrane Collaboration. Published by John Wiley & Sons, Ltd.

SU
MM
AR
YO
FF
IN
DI
NG
SF
OR
TH
EM
AI
NC
OM
PA
RI
SO
N[E
xpla
nati
on]
PrimaquineforpreventinginfectiousnesswithACTtreatments
Patientorpopulation:patientswithsymptom
aticmalaria
Settings:endemicmalarialareas
Intervention:primaquine
Outcomes
Illustrative
comparativerisks*
(95%CI)
Relativeeffect
(95%CI)
NoofParticipants
(studies)
Qualityoftheevidence
(GRADE)
Com
ments
Assumed
risk
Correspondingrisk
Control
Primaquine
Malaria
incidence,
prevalence
orEIR
-not
measured
0studies
People
infectious
to
mosquitoes-notmea-
sured
0studies
Gametocytaemia
Log(10)areaundercurve
ofdensity
over
time.
Scalefrom
:0to100.
Follow-up:43
days
Relativedecreaseranged
from
26.1to87.5%
907
(2studies1)
⊕⊕
⊕©
moderate
2
Participantswithgame-
tocytes
Microscopy
Follow-up:8days
242per1000
36per1000
(22to58)
RR0.15
(0.09to0.24)
1006
(4studies3)
⊕⊕
⊕©
moderate
4,5
Meanpercentchangein
haem
oglobin
6
Follow-up:28
days
Themeanpercentchange
inhaemoglobin
inthe
controlgroupswas
0.03%change
Themeanpercentchange
inhaemoglobininthein-
terventiongroupswas
0.06lower
101
(1study)
⊕©
©©
verylow
7,8
4Primaquine for reducing Plasmodium falciparum transmission (Review)
Copyright © 2012 The Cochrane Collaboration. Published by John Wiley & Sons, Ltd.

(0.11to0.02
lower)
*The
basisfortheassumedrisk(egthemediancontrolgroupriskacrossstudies)isprovidedinfootnotes.Thecorrespondingrisk(and
its95%CI)isbasedon
theassumed
riskinthe
comparison
groupandtherelativeeffectoftheintervention(andits95%CI).
CI:Confidenceinterval;RR:Riskratio;
GRADEWorkingGroupgradesofevidence
Highquality:Furtherresearchisveryunlikelytochangeourconfidenceintheestimateofeffect.
Moderatequality:Furtherresearchislikelytohaveanimportantimpactonourconfidenceintheestimateofeffectandmaychangetheestimate.
Lowquality:Furtherresearchisverylikelytohaveanimportantimpactonourconfidenceintheestimateofeffectandislikelytochangetheestimate.
Verylowquality:Weareveryuncertainabouttheestimate.
1Includestwotrialswithsixcomparisons.Weexcludedonetrialashighriskofbias(Vasquez2009)duetosmallsamplesizeandlarge
differenceinbaselinegametocytecountinthetwogroups
2Downgradedby1forimprecision:widerangeofestimatesintwotrials(sixcomparisons)
3Includesfourtrials,witheightcom
parisons:onetrialincludedfiveseparatecomparisonswithAS-AQ,DHAP,AS-MQ,andAL( Smithuis
2010)
4Noseriousriskofbias:twostudiesdidnotconcealallocationbutthesetrialsreportsmallereffectsizes.
5Downgradedby
1forindirectness:thereductioningametocyteshasonlybeen
demonstratedinMyanm
ar.Inthethreeotherstudies
gametocytecarriagewaslowinbothgroupsonday8,andnodifferencesweredetected.
6Shekalaghe2007
reportedrelativedecreaseinhaemoglobinagainstbaselineinbothgroupsatday8,15,29
and43
inallparticipants
irrespectiveofG6PDstatus.Thecomparison
betweenthosereceivingprimaquine
andthosenotwas
significantatday8andthese
resultsarepresentedintheSOF.Itwasnotsignificantlydifferentattheothertimepoints.
7Downgradedby2forindirectness:thepercentageofpeoplewithlargedropsinhaemoglobin,notthemeanchangeinthepopulation,is
theimportantsafetyoutcom
e..
8Downgradedby
1forimprecision:onlyonestudyin101peopletodetectan
adverseeffectthat,ifpresent,islikelytobe
relatively
uncommon.
5Primaquine for reducing Plasmodium falciparum transmission (Review)
Copyright © 2012 The Cochrane Collaboration. Published by John Wiley & Sons, Ltd.

B A C K G R O U N D
Gametocytes are the sexual stage of the Plasmodium parasite and
are present in the bloodstream of an infected person. Mosquitoes
become infected with the parasite when they ingest these stages.
Drugs for treating P. falciparum infection do not directly target
the gametocyte stage (’Status quo without PQ’ in Figure 1). How-
ever, primaquine (PQ) is a drug that has a direct impact on game-
tocytes, and for this reason several national malaria control pro-
grammes have for many years recommended PQ as a single dose
or short course add-on to P. falciparum treatment regimens to give
to people when they are sick with malaria with the goal of reduc-
ing transmission at the community level. This is now the World
Health Organization (WHO) current policy (’Clinical treatment
with PQ’ in Figure 1) (WHO 2010). However, this drug may
cause haemolysis (disintegration of blood cells) in people with glu-
cose-6-phosphate dehydrogenase (G6PD) deficiency, a common
genetic variant. PQ is also used to treat P. vivax infection, but this
is the subject of another review (Galappaththy 2007).
Figure 1.
Description of the condition
Malaria is caused by protozoan parasites of the genus Plasmod-ium and these parasites are transmitted by female Anophelesmosquitoes. In infections with three Plasmodium species, P. vivax,
P. ovale, and P. malariae, gametocytes (haploid sexual stages) form
early during the infection of the human host (before and during
clinical illness). The fourth species, P. falciparum, takes about 10
days for gametocytes to develop and they are usually found in the
later stages of the clinical infection. Whether they are present at
the time of treatment depends upon when treatment is sought.
This means that some patients are gametocytaemic at treatment,
and some only up to 10 days later, if at all. If the primary drug used
to treat the infection is successful at clearing the blood-stage para-
sites, no new gametocytes can develop. However, if the treatment
is unsuccessful (eg if the parasites are resistant to the drug used,
which may be the case if chloroquine (CQ) or another failing drug
is used), gametocytaemia will be prolonged.
Within the mosquito host, gametocytes form gametes which re-
combine to begin the next generation. Gametocytes in human
blood are not a cause of clinical malaria symptoms, but without
this stage no further parasite transmission via mosquito hosts is
possible. The mean circulation time of mature P. falciparum game-
6Primaquine for reducing Plasmodium falciparum transmission (Review)
Copyright © 2012 The Cochrane Collaboration. Published by John Wiley & Sons, Ltd.

tocytes in humans has been estimated by microscopy or polymerase
chain reaction (PCR) to be between 3.4 to 6.5 days (Smalley 1977;
Eichner 2001; Bousema 2010). However, different cohorts circu-
late together and non-immune individuals can remain gametocy-
taemic for months if left untreated.
Not all gametocytes are infectious to mosquitoes and the mere
presence of gametocytes in blood does not equate to infectivity.
Infectivity can be measured by directly feeding mosquitoes on in-
dividuals or their blood via membrane feeders (reviewed by Killeen
2006 and Bousema 2011) or by indirect estimates from infection
rates in wild-caught mosquitoes (Graves 1990; Lines 1991). The
number of gametocytes required for transmission from an infected
person to a mosquito to occur was estimated to be in the range of
100 to 300 gametocytes per µL blood (Carter 1988). Gametocyte
densities are estimated by light microscopy to be usually in the
range of 5 to 150 per µL blood in immune individuals carrying
these stages. However, PCR studies have shown that the propor-
tion of gametocyte carriers (predominantly those with low den-
sity) in the population seems to be routinely underestimated in
endemic areas (Okell 2008), and most gametocytaemias are prob-
ably in people who are asymptomatic.
Overall in the population, the percentage of bites on humans that
result in infection in the mosquito has been estimated to range
between 0.3% to 46%, although most estimates are in the range
of 1% to 10% (Killeen 2006). Most studies assessed infectiousness
to mosquitoes in people known to be gametocyte carriers (Graves
1988; Killeen 2006) but some studies have shown that asymp-
tomatic people are frequently infectious (Bousema 2011).
After uptake of a P. falciparum infected bloodmeal by the mosquito,
gametocytes mature into male and female gametes. When fer-
tilized, diploid oocysts develop on the mosquito’s stomach wall
and subsequently mature into sporozoites that migrate to the sali-
vary glands, ready to be released into the next host to be bitten.
The median number of oocysts formed in wild caught infected
mosquitoes is two to three (Rosenberg 2008). Each oocyst devel-
ops thousands of sporozoites, but only about 20% are thought to
reach the mosquito salivary glands, and fewer than 25 sporozoites
on average are ejected during mosquito bloodfeeding (Rosenberg
1990; Rosenberg 2008).
Description of the intervention
In this review we assessed the effects of PQ given in a single dose
or as a short course added to a partner drug as standard treatment
for malaria, with the intention of reducing parasite transmission
from the infected person to mosquitoes and hence reducing the
number of subsequent malaria cases.
The pharmacokinetic mode of action of PQ, an 8-amino-quino-
line, is not well understood, but it is known to be rapidly metabo-
lized, with a half-life of six hours (White 1992). PQ kills late-stage
P. falciparum gametocytes (Burgess 1961; Pukrittayakamee 2004;
Chotivanich 2006) but does not directly affect the asexual stages
of P. falciparum (Arnold 1955; Pukrittayakamee 2004). It does not
appear to affect the early or maturing gametocytes (Bhasin 1984;
White 2008) although it does have some activity against the asex-
ual stages of P. vivax (Pukrittayakamee 1994) as well as killing liver
stage hypnozoites of P. vivax and P. ovale.Because artemisinin drugs also kill some immature gametocytes
(Chotivanich 2006), the effect of PQ may be different if given
with non-artemisinin treatments compared with adding it to
artemisinin treatments, and for this reason the analysis is stratified
in this review. Some non-artemisinin drugs may even increase the
number of gametocytes that would otherwise develop (Drakeley
2006; Barnes 2008).
How the intervention might work
The theory behind PQ use is that by administering PQ to P. fal-ciparum infected patients, they have a reduced number of game-
tocytes in their bloodstreams and transmission of the parasite is
reduced.
When given as an adjunct to clinical treatment, the only groups
that receive PQ are those that are symptomatic and attend a clinic.
Thus the effect on transmission presumes that PQ not only effec-
tively reduces gametocytes in the sick patients, but in the overall
community. However, within any community it is likely that there
will be carriers of P. falciparum gametocytes who have not been
treated (’clinical treatment’ in Figure 1). This point highlights the
importance of seeking community studies that have measured the
impact on transmission in humans.
On an individual basis, a decrease in potential infectiousness can
be detected from a decrease in the proportion of people with ga-
metocytes, a reduction in the number of gametocytes per person, a
reduction in the duration of gametocytaemia, or by a combination
of these parameters in an area under the curve (AUC) measure
(Mendez 2006); see Figure 1. More directly, a reduction in infec-
tiousness can also be measured by comparing the proportion of
treated and untreated people who are infectious to mosquitoes, or
by comparing the proportion of mosquitoes infected or intensity
of infections produced in mosquitoes (ie number of oocysts per in-
fected mosquito), or both. Finally, an impact on malaria transmis-
sion intensity, either through the number of infected mosquitoes
biting people in a given time period (entomological inoculation
rate (EIR)) or measures of malaria infection in humans (malaria in-
cidence or prevalence) are important outcomes to ascertain Figure
1).
More recently, with the move toward a target of elimination,
some policy makers are considering mass treatment strategies (von
Seidlein 2003) such as mass drug administration or ’mass test and
treat’, where all people in a community are tested and, if positive,
treated for malaria as a way to reduce transmission or contain out-
breaks once transmission is reduced to low levels. In this instance,
it seems more likely that a higher proportion of the population
with gametocytes will be detected and treated, and that this could
7Primaquine for reducing Plasmodium falciparum transmission (Review)
Copyright © 2012 The Cochrane Collaboration. Published by John Wiley & Sons, Ltd.

be effective in reducing or interrupting transmission. This policy
is relatively new, and being considered in countries with lower
intensity transmission, on islands or at the northern and south-
ern fringes of malaria distribution or both (GMAP 2008; Mendis
2009). Effective antimalarial drugs are likely to play a large role
in this new strategy. One of the questions in this effort is whether
there is a role for PQ, given in addition to curative antimalarial
drugs (including artemisinin combination therapies (ACTS)), for
the treatment of P. falciparum malaria, to further reduce the trans-
missibility of the infections (White 2008).
Why it is important to do this review
PQ could be a tool in malaria elimination if it has the intended
effect of reducing P. falciparum transmission. Use of PQ has also
been suggested to prevent the spread of artemisinin resistance in
Southeast Asia. This review contributes to an evaluation of the
evidence that exists and exposes gaps that should be examined
in the near future, and shows the evidence base to define the
conditions under which it is beneficial to use PQ.
Single-dose or short-course PQ in addition to a partner drug is
now recommended standard treatment for malaria caused by P.falciparum infection in a number of countries, mainly in Asia
and South America. WHO malaria treatment guidelines (WHO
2010) recommend “addition of a single dose of PQ (0.75 mg/kg)
to artemisinin combination treatment (ACT) for uncomplicated
falciparum malaria as an antigametocyte medicine, particularly as
a component of pre-elimination or an elimination programme”.
The guidelines state that this recommendation is supported by
high quality evidence, while acknowledging that studies on the
impact of this strategy are very limited. The guidelines cite just
one study (Shekalaghe 2007) which is included in this review. In
our attempt to comprehensively clarify the evidence behind the
WHO guidelines, we have included both single dose and short-
course PQ for primary treatment of P. falciparum infection in this
review.
The primary antimalarial drug to which PQ is added may also in-
fluence any added impact of PQ. The situation has changed since
ACTs were introduced, as artemisinin-based drugs kill immature
(but not mature) gametocytes and may have some transmission re-
ducing effects (Price 1996). Artemisinin-based drugs appear to be
more effective at reducing gametocyte densities and transmission
than older drugs (Okell 2008), possibly modifying any additional
effect of PQ. However, it is hard to distinguish the effects of drugs
acting directly on the gametocytes from the indirect effect of just
reducing the numbers of asexual parasites that could develop into
gametocytes. Therefore, evidence should be developed that takes
account of any artemisinin-based drug (or other partner) effect, if
possible.
It is known from experimental challenge studies that PQ kills
mature gametocytes and reduces infectiousness of P. falciparumparasites to mosquitoes (Rieckmann 1968; Rieckmann 1969). In
these trials, PQ given at one to two week intervals (usually without
partner drug) markedly reduced infectiousness of both Malayan
CAMP and Uganda I strains of P. falciparum in small numbers
of semi-immune volunteers. There was suggestion of dose depen-
dence, with doses of 15 mg being less consistently effective, and
effects of 30 mg being perhaps less rapid than 45 mg. However
Bunnag 1980 did not observe any difference in gametocyte out-
comes between regimens using 15 mg PQ (five days) or single
doses of 30 mg or 45 mg PQ in adults.
During the course of a natural infection, it is not known when
PQ should be given for maximum effect. The most important un-
known is whether the reduction in gametocyte numbers then re-
sults in a meaningful reduction in infectiousness and hence trans-
mission of the disease, with lower incidence of new infections in
the local community.
O B J E C T I V E S
1. To assess whether giving PQ when treating P. falciparum infec-
tion reduces:
• malaria transmission intensity;
• infectiousness of infected people to mosquitoes;
• potential infectiousness (gametocyte prevalence and density
over time).
2. To estimate the frequency of severe or haematological adverse
events associated with single dose or short course PQ when it has
been used for this purpose.
M E T H O D S
Criteria for considering studies for this review
Types of studies
Randomized controlled trials (RCTs) where the unit of random-
ization is an individual or a cluster (such as a village or commu-
nity). Cluster-RCTs must have at least two clusters per arm.
Trials that evaluate giving PQ accompanying treatment of symp-
tomatic patients; and trials evaluating mass treatment strategies
(either mass treatment without diagnosis or of people treated after
detection as infected through mass test-and-treat programmes).
8Primaquine for reducing Plasmodium falciparum transmission (Review)
Copyright © 2012 The Cochrane Collaboration. Published by John Wiley & Sons, Ltd.

Types of participants
Adults or children with P. falciparum infection or a mixed infec-
tion of P. falciparum and other Plasmodium species. For individual
RCTs, eligible studies must diagnose patients by blood slide, rapid
diagnostic test, or other valid molecular method; for cluster-RCTs,
diagnosis could be by clinical judgment if that was standard in the
trial area at the time of the trial.
Types of interventions
Intervention
A single dose or short course (up to seven days) of PQ administered
with partner drug(s).
Control
Identical treatment for malaria not including PQ (or substituting
placebo for PQ).
Types of outcome measures
Primary outcomes
a) Malaria transmission intensity (in cluster-RCTs)
• Prevalence
• Incidence
• EIR
b) Infectiousness
• Individuals infectious to mosquitoes
• Mosquitoes infected by direct feeding
c) Potential infectiousness
• AUC of gametocyte density (y-axis) over time (x-axis)
• Gametocyte prevalence (estimated by microscopy or PCR)
• Gametocyte density (estimated by microscopy or PCR)
• Gametocyte clearance time (duration of gametocyte
carriage)
Secondary outcomes
• Presence of asexual stage parasites (may be reported as
treatment failure rate)
• Asexual parasite clearance time (duration of asexual
carriage)
Adverse events
• Serious adverse events leading to hospital admission or
death
• Haematologic effects
◦ Haemolysis (higher prevalence)
◦ Haemoglobin concentration (decline)
◦ Packed cell volume (decline)
Search methods for identification of studies
We attempted to identify all relevant trials, regardless of language
or publication status (published, unpublished, in press, and in
progress).
The search strategy is shown in Appendix 1.
Electronic searches
Databases
We searched the following databases using the search terms and
strategy described in Appendix 1: the Cochrane Infectious Diseases
Group Specialized Register (accessed 10 April 2012); the Cochrane
Central Register of Controlled Trials (CENTRAL), published in
The Cochrane Library (issue 3 2012); MEDLINE (1966 to 10 April
2012); EMBASE (1980 to 10 April 2012) ; and LILACS (1982 to
10 April 2012). We also searched the metaRegister of Controlled
Trials (mRCT) and the WHO trials search portal (both accessed
10 April 2012) using ’malaria*’, ‘falciparum’, and ‘Primaquine ’ as
search terms.
Conference proceedings
We searched the following conference proceedings for relevant ab-
stracts: the MIM Pan-African Malaria Conferences and the Amer-
ican Society of Tropical Medicine and Hygiene (ASTMH) to De-
cember 2009.
Searching other resources
Researchers and organizations
We contacted researchers at LSHTM who are authors of some of
the included and in-progress trials, and other experts in the field
of malaria chemotherapy, including those at WHO.
Reference lists
We checked the reference lists of all studies identified by the above
methods.
9Primaquine for reducing Plasmodium falciparum transmission (Review)
Copyright © 2012 The Cochrane Collaboration. Published by John Wiley & Sons, Ltd.

Data collection and analysis
Selection of studies
Two authors (PMG and HG) independently screened all citations
and abstracts identified by the search strategy, including ongoing
studies, to identify potentially eligible studies. We independently
assessed full reports of potentially eligible studies for inclusion in
the review. Notably, we did not contact any of the trial authors for
clarification regarding inclusion (although some were contacted
later about details of their studies) because it was clear whether
trials were or were not eligible for inclusion. We used translations
of two papers published in Chinese to assess eligibility. We resolved
differences of opinion by discussion with PG. We documented
one instance of duplicate reports of the same study (in different
languages).
Data extraction and management
Two authors (PMG and HG) independently extracted the follow-
ing information for each trial using a data extraction form de-
signed by the authors for this review.
Characteristics of trial
• Design (randomized or quasi-randomized, type of
randomization)
• Dates and duration of trial
Characteristics of participants
• Number of participants
• Age and sex of participants
• Proportion with G6PD deficiency
• Inclusion criteria
• Exclusion criteria
Characteristics of interventions
• Type of drug, dose, and schedule
Presented outcomes
• Description of outcomes presented in the papers
Other
• Location of trial, setting, and source of funding
Outcomes data
For each trial, two authors (PMG and HG) extracted data on the
trial outcomes eligible for inclusion in this review, for the PQ and
non-PQ groups. We extracted the number of participants random-
ized and the numbers analysed in each treatment group for each
outcome. For dichotomous data outcomes (proportion of partic-
ipants with gametocytes or asexual stages, proportion of partici-
pants infectious to mosquitoes, and proportion of mosquitoes in-
fected), we extracted the number of participants experiencing the
event of interest and the total number of patients or mosquitoes
in each treatment arm of each study. For continuous outcomes
(AUC for gametocyte numbers over time), we extracted arithmetic
or geometric means and standard deviations for each treatment
group by day of assessment, together with the numbers of patients
in each group. We noted details on the method of determining
parasite presence and density, for example light microscopy (if so,
the method of staining and number of fields examined), PCR, or
other methods.
For G6PD deficiency, we noted the sex of the carrier (if avail-
able) and the method used to determine G6PD deficiency, ie ei-
ther phenotypically (by enzyme function) or PCR (by genotype).
We adopted the definition of ’deficient’ used in the trials that as-
sessed this outcome. We extracted adverse event data for each in-
dividual type of event wherever possible. Where adverse events
were reported separately for more than one dose (for short-course
regimens), we attempted to record the average number of people
reporting each adverse event for each dose. If trials reported the
occurrence of adverse events at more than one time point follow-
ing a single dose, but did not record the total number of people
reporting each event, we attempted to record the events occurring
in the first time period.
In cases of disagreement, we double checked the data and we came
to a consensus through discussion between all three authors.
Assessment of risk of bias in included studies
PMG and HG independently assessed the risk of bias of the in-
cluded trials using a pro forma. We assessed the risk of bias in
studies as recommended in the Cochrane Handbook for SystematicReviews of Interventions (Higgins 2011). For each trial included,
we assigned a score of low, unclear or high risk of bias for the
following components: random sequence generation, allocation
concealment, blinding of participants and personnel, blinding of
outcome assessors, incomplete outcome data, selective outcome
reporting, and other biases.
For sequence generation and allocation concealment, we described
the methods used, if given. For blinding, we described who was
blinded and the blinding method. For incomplete outcome data
we reported the percentage and proportion of loss to follow-up
(the number of patients for whom outcomes are not measured/the
number randomized), if given. For selective outcome reporting,
we stated any discrepancies between the methods and the results
10Primaquine for reducing Plasmodium falciparum transmission (Review)
Copyright © 2012 The Cochrane Collaboration. Published by John Wiley & Sons, Ltd.

in terms of the outcomes measured and the outcomes reported;
we also stated if we knew that an outcome was measured but was
not reported in the publication. For other biases we described
any other trial features that we believe could have affected the
trial’s results (eg whether a trial was stopped early or if no sample
size calculation was included). We resolved disagreements between
authors by discussion.
We reported the results of the risk of bias assessment in a ’Risk
of bias’ table and displayed them in a ’Risk of bias’ summary and
’Risk of bias’ graph (Figure 2; Figure 3).
11Primaquine for reducing Plasmodium falciparum transmission (Review)
Copyright © 2012 The Cochrane Collaboration. Published by John Wiley & Sons, Ltd.

Figure 2. Risk of bias summary: review authors’ judgements about each risk of bias item for each included
study.
12Primaquine for reducing Plasmodium falciparum transmission (Review)
Copyright © 2012 The Cochrane Collaboration. Published by John Wiley & Sons, Ltd.

Figure 3. Risk of bias graph: review authors’ judgements about each risk of bias item presented as
percentages across all included studies.
Measures of treatment effect
We analysed the data using Review Manager (RevMan) 5.1. For
dichotomous data, we estimated the Risk Ratio (RR) and used
the Mantel-Haenszel method with fixed-effect, or with random-
effects if there was heterogeneity. For continuous data, we esti-
mated the mean difference (MD). All results are presented with
95% confidence intervals (CIs). We reported results only for days
after the first day of PQ treatment, which, in some trials, was later
than the beginning of primary treatment.
We estimated AUC for trials that reported gametocyte numbers
(either as summary measure by group in the paper, or calculated
from individual patient data supplied by the authors) for trials that
reported gametocyte outcomes for days 1, 8, 15, 29, and 43. Since
few patients had gametocytes up to day 43, we also estimated AUC
only up to day 29 for the same trials. The AUC is a weighted sum of
gametocyte densities, with weights proportional to the difference
in time between adjacent sampling points as described by Dunyo
2006 and Mendez 2006 in trials assessing gametocytaemia after
sulfadoxine-pyrimethamine (SP) treatment. However, Mendez
2006 used follow-up days 4 to 22 (reported as days 3 to 21 in trial),
which do not encompass the early days of highest gametocytaemia
nor the participants who still had gametocytes after day 21.
The formulas used were:
AUC (days 1 to 29) = ((8-1)*(G1+G8)/2)+((15-8)*(G15+G8)/
2)+((29-15)*(G29+G15)/2)/28 for days 1 through 29
AUC (days 1 to 43) = ((8-1)*(G1+G8)/2)+((15-8)*(G15+G8)/
2)+((29-15)*(G29+G15)/2)+((43-29)*(G43+G29)/2)/42 for
days 1 through 43
where Gx = mean gametocyte density on day X (estimated using
data from all participants still enrolled on day X). Log(10) AUC
values were estimated using geometric mean gametocyte density.
Unit of analysis issues
All trials we included were individually randomized and analysed.
We did not find any cluster-RCTs.
Dealing with missing data
Where data were missing from the trials or if details were unclear,
we attempted to contact the authors and were successful in four
cases. We used complete case analysis for trials with missing data.
Assessment of heterogeneity
We assessed heterogeneity between the trials by examining the
forest plot to check for overlapping confidence intervals, using the
Chi2 test for heterogeneity with a 10% level of significance, and
the I2 statistic using a value of 50% to represent moderate levels
of heterogeneity.
13Primaquine for reducing Plasmodium falciparum transmission (Review)
Copyright © 2012 The Cochrane Collaboration. Published by John Wiley & Sons, Ltd.

Assessment of reporting biases
There were insufficient trials within each comparison to assess
the likelihood of small study effects, such as publication bias, by
examining a funnel plot for asymmetry.
Data synthesis
We stratified the analyses by partner drug, as we anticipated het-
erogeneity in estimates of PQ efficacy due to the different effects of
the partner drugs on the asexual and sexual stages of P. falciparum.We combined partner drug groups for some comparisons, either
because trials did not distinguish partner drug groups (eg CQ or
CQ plus SP) or to group trials of related drugs (mefloquine (MQ),
MQ+SP).
We also grouped all trials that included an artemisinin compound
(comparison 5) with and without PQ, for two reasons. Firstly,
artemisinins may kill early-stage gametocytes and secondly, ACTs
are the currently recommended first-line treatment for P. falci-parum. Comparisons 1 to 5 were stratified by timepoint after treat-
ment. In comparison 6, we assessed only on day 8 the outcome
of percentage of people with gametocytes and combined all trials
(both artemisinin-based and non-artemisinin-based) that started
PQ any time up to day 7.
Throughout this review, we designated the first day of treatment
as day 1 rather than day 0 as reported in some trials. Where not
stated as mg/kg, the PQ dose is reported as the adult dose; trials
stated that the dose was adjusted for children.
When no statistically significant heterogeneity between trials was
detected, we applied the fixed-effect meta-analysis model. When
statistically significant heterogeneity was observed within groups
that could not be explained by subgroup or sensitivity analyses, we
used a random-effects meta-analysis model to synthesize the data.
When substantial heterogeneity was determined from the assess-
ments of heterogeneity (ie high I2 value, low Chi2 statistic P value,
or when a pooled meta-analysis result is considered to be meaning-
less because of clinical heterogeneity) we did not carry out meta-
analysis but instead present a forest plot with the pooled effect
suppressed.
Subgroup analysis and investigation of heterogeneity
In our protocol, we had stated we would investigate heterogeneity
in relation to drug resistance pattern, the parasite density before
treatment and the local endemicity of malaria. However, were too
few trials for this analysis.
Sensitivity analysis
There were insufficient trials to conduct a sensitivity analysis to
investigate the robustness of the results to the quality (risk of bias)
components.
R E S U L T S
Description of studies
See: Characteristics of included studies; Characteristics of
excluded studies; Characteristics of studies awaiting classification;
Characteristics of ongoing studies.
Results of the search
The search identified 46 potentially relevant publications, of which
15 were excluded at abstract stage (Figure 4). In one case, two
publications (in different languages) described the same trial (
Chen 1994). Of the 31 remaining trials, 20 were excluded on
reading of the full paper, leaving 11 trials that were included. Five
of the trials included more than one comparison (different drugs,
doses, or schedules); overall there were 20 distinct comparisons
and 1776 individuals.
14Primaquine for reducing Plasmodium falciparum transmission (Review)
Copyright © 2012 The Cochrane Collaboration. Published by John Wiley & Sons, Ltd.

Figure 4. Study flow diagram.
15Primaquine for reducing Plasmodium falciparum transmission (Review)
Copyright © 2012 The Cochrane Collaboration. Published by John Wiley & Sons, Ltd.

Included studies
We did not identify any community trials examining malaria trans-
mission intensity (measuring incidence of malaria, prevalence, or
EIR). For direct measures of infectiousness, one small trial (Chen
1994) in China compared the infectiousness to mosquitoes of peo-
ple treated with MQ only to those treated with MQ plus PQ.
The remaining 10 trials examined the impact of PQ on various
measures of gametocytes in trial subjects after treatment. One trial
(Shekalaghe 2007) reported on AUC as a summary combined
measure of gametocyte prevalence and density.
Participants
For G6PD deficiency, two studies did not screen (Kamtekar
2004; Smithuis 2010), one study screened and included all
(Shekalaghe 2007), one study only included deficient participants
(Khoo 1981), two studies included only non-deficient partici-
pants (Pukrittayakamee 2004; Ledermann 2006), and the remain-
ing five studies made no comment (Chen 1994; El-Sayed 2007;
Kolaczinski 2012; Singhasivanon 1994; Vasquez 2009).
Interventions
Non-artemisinin-based regimens
CQ or CQ combinations: CQ was the partner drug in one com-
parison of a multi-arm study (Kolaczinski 2012, Pakistan) and in
the trial of Khoo 1981 (Malaysia). However, Khoo 1981 did not
distinguish P. falciparum and P. vivax cases and hence the number
of days of PQ given. CQ combined with SP was the partner drug
in two comparisons of a multi-arm study in Indonesia (Ledermann
2006). CQ or CQ + SP were used in one comparison of a multi-
arm study in India (Kamtekar 2004). The results across the two
partner treatments were combined.
SP: SP was the partner drug in one comparison of a multi-arm
study in Pakistan (Kolaczinski 2012).
MQ or MQ combinations: MQ was the partner drug in one
trial in China (Chen 1994). MQ + SP (fixed combination, also
known as MSP) was the partner drug in one trial in Thailand
(Singhasivanon 1994).
Quinine (QN): QN was studied in three comparisons, in two
multi-arm studies: Kamtekar 2004 (India) (one comparison) and
Pukrittayakamee 2004 (Thailand) (two comparisons).
Artemisinin-based regimens
Artesunate (AS) monotherapy was the partner drug in one com-
parison of a multi-arm study in Thailand (Pukrittayakamee 2004).
AS + SP was the partner drug in two trials: El-Sayed 2007 (Su-
dan) and Shekalaghe 2007 (Tanzania). AS + amodiaquine (AQ)
was the partner drug in one comparison of a multi-arm study:
Smithuis 2010 (Myanmar). Artemether-lumefantrine (AL) was
the partner drug in one comparison of a multi-arm study in
Myanmar (Smithuis 2010). AS + MQ was studied in Colom-
bia (Vasquez 2009) and two comparisons of a multi-arm study
in Myanmar (Smithuis 2010). Dihydroxyartemisinin-piperaquine
(DHAP) was the partner drug in one comparison of a multi-arm
study in Myanmar (Smithuis 2010).
Dose
Most trials used the equivalent of 0.75 mg/kg PQ per day (adult
dose 45 mg/day). The exceptions were:
• Khoo 1981: adult dose of 25 mg or approximately 0.42
mg/kg/day;
• Kolaczinski 2012: 0.5 mg/kg or adult dose 30 mg/day;
• Pukrittayakamee 2004: the trial with QN had two arms,
one with 0.25 mg/kg and the other 0.5 mg/kg per day (adult
dose 15 mg or 30 mg per day respectively); the comparison with
AS used 0.5 mg/kg per day (adult dose 30 mg per day).
Schedule
Most trials used a single dose of PQ given on the following days:
Day 1: Chen 1994, Kolaczinski 2012 (one of two comparisons),
Ledermann 2006 (one of two comparisons), Singhasivanon 1994,
Smithuis 2010 (five comparisons);
Day 3: Kolaczinski 2012 (one of two comparisons), Ledermann
2006 (one of two comparisons), Vasquez 2009;
Day 4: Kamtekar 2004 (one of two comparisons), El-Sayed 2007,
Shekalaghe 2007;
Day 8: Kamtekar 2004 (one of two comparisons).
Two trials used a longer course of PQ:
3 days: Khoo 1981;
7 days: Pukrittayakamee 2004 (three comparisons).
Details of the trial locations, partner drugs, PQ doses and schedules
are shown in Table 1.
Excluded studies
Reasons for exclusion of 20 trials are shown in the Characteristics
of excluded studies. Among the trials considered, four were con-
ducted in populations attempting to estimate the effect of PQ
on transmission (Hii 1987; Doi 1989; Kaneko 1989; Shekalaghe
2011). None of these could be included because they either were
not randomized, had insufficient clusters per arm, or had no ap-
propriate comparison or control group of partner drug without
PQ.
16Primaquine for reducing Plasmodium falciparum transmission (Review)
Copyright © 2012 The Cochrane Collaboration. Published by John Wiley & Sons, Ltd.

Risk of bias in included studies
Out of the 11 studies, those that demonstrated low risk of bias were
in the minority for sequence generation (five studies), allocation
concealment (two studies), blinding of participants (one study),
and blinding of outcomes assessment (four studies); see Figure
2 and Figure 3. We did not identify concerns with incomplete
outcome data or selective reporting.
The exclusion of G6PD-deficient people from the PQ group in
Pukrittayakamee 2004 is a post-randomization exclusion. We had
no reason to suppose it biased the primary outcomes but it could
have affected assessment of adverse effects.
Note that when one study contained more than one comparison
with the same placebo group, we did not divide the placebo group
participants between the comparisons (due to small numbers in
most trials). This may have resulted in overestimation of the pre-
cision of some results.
Effects of interventions
See: Summary of findings for the main comparison Primaquine
for preventing infectiousness with ACT treatments; Summary of
findings 2 Primaquine for preventing infectiousness with non-
ACT malaria treatment
For malaria transmission intensity (prevalence, incidence, or EIR)
we found no community cluster-RCTs measuring these outcomes.
Regarding infectiousness, we found one trial (Chen 1994) that
measured this in 18 patients for non-artemisinin drugs (see com-
parison 3 below).
All other trials reported potential infectiousness, ie effects of PQ
on gametocyte prevalence, density or clearance time, or both. Only
one trial (Shekalaghe 2007) reported a summary measure of po-
tential infectiousness (AUC); we calculated this for other trials
with available data.
Non-artemisinin-based partner regimens
CQ or CQ combination partner treatments (comparison 1)
For the outcome of participants with gametocytes at various time-
points after treatment, we found three trials (Kamtekar 2004;
Ledermann 2006 (two comparisons) Kolaczinski 2012) with re-
duction in the groups given PQ that was significant in the com-
bined analysis on day 8, 12, 15, 22 and 29 (Analysis 1.1). One
arm of Ledermann 2006 received PQ on day 1 and the other on
day 3. There was no apparent difference in the outcome between
these two arms (Analysis 1.1).
One trial also assessed the proportion with ’viable gametocytes’
as determined by presence of exflagellating microgametocytes on
stained blood slides (Kamtekar 2004). This is relatively subjective,
but the results were similar to the proportion with gametocytes.
Data from one other trial in this comparison (Khoo 1981) could
not be used because it did not distinguish between patients with P.falciparum and P. vivax and their respective treatment with either
3-day or 14-day PQ. There was a much higher risk of adverse
haemolytic events in those who received PQ in the Khoo 1981 trial
(OR of 22.27 for both haemolysis and need for blood transfusion),
but the results could not be included in this systematic review
because the groups combined participants receiving a short course
(3 days) of PQ with those receiving a 14-day regimen. The most
unusual aspect of the study, however, is that only individuals with
G6PD deficiency were included.
There was no effect of PQ added to CQ on prevalence of asexual
parasites at day 29 (parasitological treatment failure, whether or
not the results were adjusted for new infections detected by PCR)
in Kolaczinski 2012 (Analysis 1.2).
SP partner treatments (comparison 2)
Using SP as the partner drug with measurements at different time
points from days 1 to 43, one trial showed an effect of PQ on
people with gametocytes, which was significant from day 15 to
day 36 (Kolaczinski 2012; Analysis 2.1).
There was no effect of PQ added to SP on prevalence of asexual
parasites at day 29 (parasitological treatment failure) in Kolaczinski
2012 (Analysis 2.2).
MQ or MQ-SP combination partner treatments
(comparison 3)
One small trial in China (Chen 1994) with only nine participants
per group tested directly the impact of PQ on infectiousness to
mosquitoes. The results showed that while on day 1 all patients in
the trial were infectious to Anopheles dirus mosquitoes, after a dose
of PQ on day 1 the proportion of people infectious was reduced
to 0 when measured on day 5 and day 8 (Analysis 3.1). By day 15
and day 22 the difference was attenuated as infectiousness in the
control group declined.
Chen 1994 also examined the number of mosquitoes infected after
feeding on trial participants (Analysis 3.2). None of the mosquitoes
feeding on people receiving PQ were infected, with over 64%
infected at day 5 after feeding on the group not receiving PQ (RR
0.01, 95% CI 0.0 to 0.14), with the effect still evident up to day
22, although the proportion infected in the control group declined
over time.
The Chen 1994 trial also included an artemisinin (ART) arm, but
there was no comparison of ART with and without PQ. However,
on indirect comparison, ART appeared at least as effective at re-
ducing infectiousness as MQ+PQ (compared to MQ alone).
Gametocyte clearance time (in days) was estimated in a trial of
MQ+SP with and without PQ (Singhasivanon 1994). Clearance
time was significantly reduced in the PQ group with a mean dif-
ference of -14.90 days (95% CI -18.18 to -11.62). (Analysis 3.3).
17Primaquine for reducing Plasmodium falciparum transmission (Review)
Copyright © 2012 The Cochrane Collaboration. Published by John Wiley & Sons, Ltd.

In Singhasivanon 1994 there was no significant effect of PQ on
asexual clearance time (Analysis 3.4).
None of these trials reported on haemolysis, other haematological
measures, or severe adverse events. Singhasivanon 1994 reported
the following adverse effects: nausea (3/11 MQ+SP versus 1/7
MQ+SP+PQ), vomiting (2/11 versus 2/7), dizziness (1/11 versus
1/7) and all children with an adverse event (3/11 versus 2/7). These
counts represented no significant differences between groups.
QN partner treatments (comparison 4)
Two trials with different schedules tested this comparison. One
(Kamtekar 2004) gave single-dose PQ on day 8, after the 7-day
course of QN was finished. The other trial (Pukrittayakamee 2004)
had two arms (’low’ 0.25 mg/kg and ’high’ 0.50 mg/kg doses
of PQ) but in both comparisons, the PQ was given for 7 days
along with the QN. Both of these doses were low compared to
the standard 0.75 mg/kg per day used in most of the other trials,
but in Pukrittayakamee 2004 the PQ course was unusually long
(ie total PQ dose 1.75 or 3.5 mg/kg over 7 days).
There was no difference between the QN+PQ and QN groups (ei-
ther dose) regarding the proportion of people with gametocytes on
day 8 in Pukrittayakamee 2004 (Analysis 4.1). Only the Kamtekar
2004 trial continued follow-up after day 8, and there was no dif-
ference in the proportion of people with gametocytes at day 15,
after which no one in either arm had gametocytes (Analysis 4.1).
The median gametocyte clearance time was reduced in
Pukrittayakamee 2004 from 216 hours to 48 hours with 0.5 mg/
kg PQ, or 87 hours with 0.25 mg/kg PQ, although results were not
presented in a form that could be shown graphically. The mean
asexual parasite clearance time of 78 to 80 hours was no different
between groups (Analysis 4.2).
Artemisinin-based partner regimens
AS or ACT partner treatments (comparison 5)
Microscopy analysis revealed that PQ clearly reduced the number
of people infected with gametocytes (Analysis 5.1), on day 8 (RR
0.15, 95% CI 0.09 to 0.24, four trials, eight comparisons), day 15
(RR 0.10, 95% CI 0.04 to 0.22, three trials, seven comparisons),
day 22 (RR 0.06, 95% CI 0.01 to 0.24, two trials, six comparisons,
three with estimable results) and day 29 (RR 0.15, 95% CI 0.05 to
0.51, three trials, seven comparisons, three with estimable results).
In Smithuis 2010, new gametocytaemia (by microscopy) on day
7 was also reduced by PQ (one of 272 versus 10 of 268; RR 0.1,
95% CI 0.01 to 0.76, P = 0.006).
Two trials examined gametocytes by PCR rather than microscopy.
In one trial (Shekalaghe 2007), a reduction in gametocyte preva-
lence was observed on day 8 and day 15 (Analysis 5.2). However,
in the other trial (El-Sayed 2007), giving PQ did not lead to a de-
tectable difference between the two groups on these two follow-up
days, although there were very few participants with gametocytes
in the control group. Given the clear statistical and clinical hetero-
geneity between the two estimates (related to different numbers of
participants with gametocytes in the comparator arm in these two
studies) we did not combine them in meta-analysis Analysis 5.2.
In Shekalaghe 2007, with additional follow-up day 29, reduction
in gametocyte prevalence was significant (RR 0.23, 95% CI 0.08
to 0.62), and on day 43, it was not (Analysis 5.2).
Gametocyte density over time was assessed by microscopy in the
trials of Shekalaghe 2007, Smithuis 2010 (five comparisons) and
Vasquez 2009, and is analysed further below using the AUC mea-
sure estimated from data provided by the authors. For PCR de-
tected gametocyte density, Shekalaghe 2007 provided geometric
mean and inter-quartile range (IQR) on days 1, 4, 8, 15, 29 and
43, and mean density was consistently lower in the PQ than the
non-group, for days when gametocytes were detected (with PQ:
5.8, IQR 0.8 to 55.1; without PQ: 15.8, IQR 4.1 to 85.8).
Gametocyte clearance time is presented in Shekalaghe 2007 and
was significantly lower in the PQ group (6.3 days, 95% CI 4.7 to
8.5) than in the non-PQ group (28.6 days, 95% CI 17.0 to 48.0,
P < 0.001). Smithuis 2010 also reported significantly lower game-
tocyte clearance time in the PQ groups, reported as person game-
tocytaemia weeks standardized per 1000 person-weeks of follow-
up. This was 5.5 weeks in the ACT+PQ groups versus 65.5 weeks
in the non-PQ groups (RR 11.9, 95% CI 7.4 to 20.5, P < 0.001)
and the difference was very large for each individual partner drug.
Although the duration of gametocyte carriage (without PQ) was
significantly longer for AS+AQ, AL and DHAP than for AS+MQ,
there was no significant difference in length of gametocyte carriage
between the ACT groups when PQ was added (Smithuis 2010).
Shekalaghe 2007 was the only trial to present a comparison of
AUC of gametocyte density (by PCR) over time, with a 95% CI
derived from generalized estimation equations. Shekalaghe 2007
derived AUC from gametocyte densities estimated on days 1, 4,
8, 15, 29 and 43 (reported in trial as days 0, 3, 7, 14, 28 and 42).
There was a significant reduction in AUC in the PQ groups over 43
days after treatment, reported as mean of 1.5 (IQR 0.3 to 8.8) in
the PQ group versus 11.1 (IQR 2.2 to 53.8) in the non-PQ group
(P < 0.001). We used trial raw data to estimate geometric mean
and SD for this variable (Analysis 5.3) and observed a significant
reduction in AUC (expressed as log(10)) with a mean difference
of -0.88 [-1.32, -0.43].
There was no difference between PQ and non-PQ groups in pro-
portion of participants with asexual parasites (Analysis 5.4) or asex-
ual parasite clearance time (Analysis 5.5). No difference in asexual
recrudescence rates was noted in Smithuis 2010.
For haematologic adverse events, Smithuis 2010 stated that there
were no cases of severe anaemia (<5g/dL) or blackwater fever in
any group. El-Sayed 2007 showed that there was no difference in
packed cell volume between groups at day 7 (34.2% (15 to 44%)
versus 36.2% (26 to 42%)) or day 14 (35.2% versus 35.4%). The
difference was not significant at either day 7 (0.78, (-0.75 to 0.23)
18Primaquine for reducing Plasmodium falciparum transmission (Review)
Copyright © 2012 The Cochrane Collaboration. Published by John Wiley & Sons, Ltd.

P = 0.32) or day 14 (0.86, (-0.31 to +2.0) P = 0.15). In Shekalaghe
2007, although there was also no reduction in mean haemoglobin
by group (Analysis 5.6), there was a significantly greater change
(decrease) in haemoglobin status in the PQ group on day 8; hae-
moglobin decreased by 5% in the PQ group compared to 1%
in the non-PQ group (Analysis 5.7). These findings suggest that
rather than look at population mean of haemoglobin, it would be
more meaningful to examine the proportion of individuals who
had serious adverse events: Shekalaghe 2007 state that 8 of 52
children in the PQ group had 20% reduction in haemoglobin by
day 8, compared to 0 of 53 children in the control group. How-
ever, it is also stated that no child developed clinical symptoms
related to anaemia or a haemoglobin below 5 g/dL. The effect on
haemoglobin in the PQ group was transient and was no longer
significant by day 15.
El-Sayed 2007 assessed he minor adverse effects of vomiting, in-
somnia and itching and found no difference between groups.
Smithuis 2010 found a higher percentage of patients in the PQ
groups had abdominal pain (16%; N = 397 versus 11%; N = 411,
P = 0.05); frequencies of dizziness, nausea, anorexia, diarrhoea,
palpitations, sleeplessness, headache and vomiting were not in-
creased in the PQ groups.
Summary stratified by non-artemisinin and
artemisinin regimens
A summary across all drugs, stratified into two groups (partner
drug including or not including an artemisinin-based drug) was
conducted.
Outcome 1. Gametocytes on day 8 (comparison 6)
A single outcome, percent of participants with microscopy-de-
tected gametocytes on day 8, is displayed for this comparison, as
a representative outcome across the trials. The QN comparison of
Kamtekar 2004 was excluded, because PQ was not given until day
8, but all others are included. The day on which PQ was given
varies and is shown for each trial in footnotes in Analysis 6.1. The
data have been subgrouped by whether or not the partner drug
was an artemisinin-based treatment. This comparison shows that,
overall, PQ reduced the prevalence of gametocytaemia on day 8
following treatment (RR 0.36, 95% CI 0.30 to 0.43) Analysis 6.1.
The individual trials nearly all trended in the direction of a reduc-
tion, and this is true of non-artemisinin-based (RR 0.62, 95% CI
0.51 to 0.76) as well as artemisinin-based partner drugs (RR 0.12,
95% CI 0.08 to 0.20) (Analysis 6.1).
Outcome 2. AUC
The AUC was estimated here for microscopy-determined densities
for Shekalaghe 2007, Smithuis 2010 (five comparisons), Vasquez
2009 and Kolaczinski 2012 (two comparisons), using the mean
(or geometric mean) gametocyte density by group at each day
of measurement. . Since trials were not consistent in the days
on which they estimated gametocyte density, the days on which
measurements were available for all trials were used (days 1, 8, 15,
29 and 43; see Methods section). AUC was estimated up to day 29
(Table 2) and day 43 (Table 3). Results are presented separately by
non-artemisinin-based and artemisinin-based partner drugs below
and given for log(10) AUC in the summary of findings tables for
days 1-43.
Table 2 and Table 3 show that all trials except Vasquez 2009
demonstrated reduction in the AUC after PQ. The reduction
ranged from -50.8% to 91.7% up to day 29 and from -41.3%
to 82.6% up to day 43. Using the log(10) AUC, the reduction
ranged from -7.0% to 27.3% up to day 29 and -15.8% to 87.5%
up to day 43.
The Vasquez 2009 trial was an exception suggesting increase in
AUC after PQ, possibly due to the small sample size and differing
mean gametocyte counts by group at baseline in this trial. Ex-
cluding Vasquez 2009, reductions in AUC varied from 37.9% to
91.7% for days 1 to 29, and 42.1% to 82.6% for days 1 to 43
using the mean gametocyte density. Using the log(10) AUC, the
reduction ranged from 8.3% to 27.3% for days 1 to 29 and 24.3%
to 87.5% for days 1 to 43.
Considering non-artemisinin and artemisinin-based partner drugs
separately (excluding Vasquez 2009), the reductions for day 1-43
for non-artemisinin partner drugs were 74.6% and 80.8% (one
trial, two comparisons); and for artemisinin partner drugs ranged
from 42.1% to 82.6%; two trials, six comparisons; (Table 3), using
simple arithmetic calculation of the AUC. Reductions for day 1-
29 were similar (Table 2).
Calculating using the log(10) AUC, for non-artemisinin partner
drugs for day 1-43 the estimates were 24.3% and 27.1% (one trial,
two comparisons); and for artemisinin partner drugs the range was
26.1% to 87.5% (two trials, six comparisons; Table 3). Reductions
for day 1-29 were similar (Table 2).
19Primaquine for reducing Plasmodium falciparum transmission (Review)
Copyright © 2012 The Cochrane Collaboration. Published by John Wiley & Sons, Ltd.
AD
DI
TI
ON
AL
SU
MM
AR
YO
FF
IN
DI
NG
S[E
xpla
nati
on]
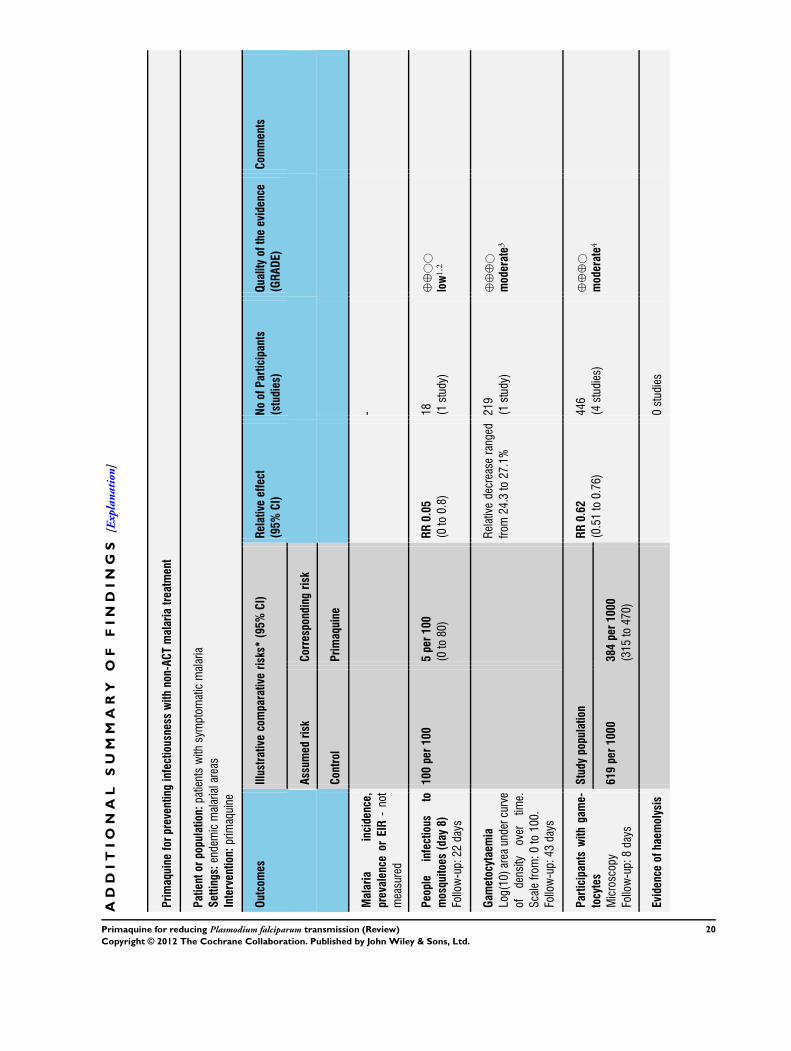
Primaquineforpreventinginfectiousnesswithnon-ACTmalariatreatment
Patientorpopulation:patientswithsymptom
aticmalaria
Settings:endemicmalarialareas
Intervention:primaquine
Outcomes
Illustrative
comparativerisks*
(95%CI)
Relativeeffect
(95%CI)
NoofParticipants
(studies)
Qualityoftheevidence
(GRADE)
Com
ments
Assumed
risk
Correspondingrisk
Control
Primaquine
Malaria
incidence,
prevalence
orEIR
-not
measured
-
People
infectious
to
mosquitoes(day8)
Follow-up:22
days
100per100
5per100
(0to80)
RR0.05
(0to0.8)
18 (1study)
⊕⊕
©©
low
1,2
Gametocytaemia
Log(10)areaundercurve
ofdensity
over
time.
Scalefrom
:0to100.
Follow-up:43
days
Relativedecreaseranged
from
24.3to27.1%
219
(1study)
⊕⊕
⊕©
moderate
3
Participantswithgame-
tocytes
Microscopy
Follow-up:8days
Studypopulation
RR0.62
(0.51to0.76)
446
(4studies)
⊕⊕
⊕©
moderate
4
619per1000
384per1000
(315
to470)
Evidenceofhaemolysis
0studies
20Primaquine for reducing Plasmodium falciparum transmission (Review)
Copyright © 2012 The Cochrane Collaboration. Published by John Wiley & Sons, Ltd.

*The
basisfortheassumedrisk(egthemediancontrolgroupriskacrossstudies)isprovidedinfootnotes.Thecorrespondingrisk(and
its95%CI)isbasedon
theassumed
riskinthe
comparison
groupandtherelativeeffectoftheintervention(andits95%CI).
CI:Confidenceinterval;RR:Riskratio;
GRADEWorkingGroupgradesofevidence
Highquality:Furtherresearchisveryunlikelytochangeourconfidenceintheestimateofeffect.
Moderatequality:Furtherresearchislikelytohaveanimportantimpactonourconfidenceintheestimateofeffectandmaychangetheestimate.
Lowquality:Furtherresearchisverylikelytohaveanimportantimpactonourconfidenceintheestimateofeffectandislikelytochangetheestimate.
Verylowquality:Weareveryuncertainabouttheestimate.
1Downgradedby1forriskofbias:thisstudydidnotconcealallocation,andnomethodofallocationisdescribed
2Downgradedby1forimprecision:thissinglestudyisunderpoweredwhichlimitstheconfidenceintheresults
3Downgradedby1forindirectness:onestudy,withtwocomparisons,andthusonlytwoestimatesofAUC(24.3%
and27.1%reduction)
4Downgradedby1forriskofbias:onestudywithtwocomparisonsisgoodquality,butalltheotherthreestudieshavemethodological
deficiencies
21Primaquine for reducing Plasmodium falciparum transmission (Review)
Copyright © 2012 The Cochrane Collaboration. Published by John Wiley & Sons, Ltd.

D I S C U S S I O N
Summary of main results
PQ used in clinical treatment
With artemisinin-based drug regimens
See Summary of findings for the main comparison
Malaria transmission intensity and infectiousness: we do not
know if PQ has an effect with artemisinin-based regimens, as no
study has examined this.
Potential infectiousness: PQ probably reduces potential infec-
tiousness, based on log(10) AUC to day 43 (relative decrease range
from -26.1 to 87.5%, two studies (six comparisons), moderate
quality evidence); and on participants with gametocytes on day 8
(RR 0.15, 95% CI 0.09 to 0.24, four studies (eight comparisons),
moderate quality evidence).
Haemolytic anaemia: we do not know if PQ results in haemolytic
anaemia. One study examined % change in mean haemoglobin
against baseline and found that overall the haemoglobin had de-
clined more in those treated with PQ at day 8 (but not at day 15,
29 and 43) (very low quality evidence).
With non-artemisinin-based drug regimens
See Summary of findings 2
Malaria transmission intensity: we do not know if PQ has an
effect, as no study has examined this.
Infectiousness: PQ may reduce infectiousness, based on one small
study with large effects from China (RR 0.05, 95% CI 0 to 0.79,
one study; low quality evidence).
Potential infectiousness: PQ probably reduces potential infec-
tiousness, based on: log(10) AUC (to day 43, relative decrease was
24.3 and 27.1%, one study (two comparisons), moderate quality
evidence); and participants with gametocytes on day 8 (RR 0.62,
95% CI 0.51 to 0.76, four studies (five comparisons); moderate
quality evidence).
Haemolytic anaemia: we do not know if PQ results in haemolytic
anaemia as no study in this systematic review has examined this.
PQ in mass test and treat programmes
We found no trials that assessed this (Figure 1).
Overall completeness and applicability ofevidence
Effectiveness
The trials included in this systematic review are all the ones we
identified that provide reliable evidence bearing on the main ques-
tion: whether, and under what circumstances, does PQ reduce in-
fectiousness sufficiently to reduce overall transmission in an area?
None of the trials that fulfilled the inclusion criteria addressed
this question directly, so we cannot draw direct conclusions to
answer the question. We can infer from the evidence that PQ does
reduce gametocyte prevalence and density in treated individuals
- including those treated with artemisinin-based drugs - and that
PQ probably would reduce transmission in a population, used
at an appropriate stage of malaria control. That stage cannot be
predicted with the information available but we believe that it
could be determined with specific trials, modelling studies, or
both.
Four studies not included in this review (Doi 1989, Hii 1987,
Kaneko 1989, Shekalaghe 2011) did attempt to measure the effect
of PQ on transmission but were excluded because they did not
provide reliable evidence (even though they are frequently cited
as evidence for PQ reducing transmission). They were excluded
because of concurrent interventions that might have contributed
to the results reported; or because they did not compare treatment
with and without PQ; or were too small (including only one cluster
per treatment). The table of Characteristics of excluded studies
specifies the reasons each was excluded.
Only one small trial included in this review (Chen 1994) (nine
participants per arm) measured infectiousness of participants to
mosquitoes directly, and reported marked effects. All other tri-
als used proxy measures such as gametocyte prevalence and den-
sity, duration of gametocyte carriage, or the combined measure of
AUC. While there is a relationship between measures of gameto-
cyte prevalence/density and infectiousness, this is not well defined
and the proxy measures do not give a quantitative estimate of the
absolute infectiousness of individuals. An analysis using a mod-
elled relationship between gametocyte density and infectiousness,
such as that done by Barnes 2005 and Barnes 2008, is required to
adequately estimate a reduction in infectiousness from the effect
on individuals.
The trials have answered the question of whether PQ added to
partner drugs reduces the prevalence and density of gametocytes,
which it does with most of the drug treatment regimens with which
it has been tested. The level of reduction in microscopy-detected
gametocyte prevalence by PQ was 85 to 90% when measured
at single time points on days 8 and 15 in the comparison with
artemisinin-based drugs.
There is a need for a summary measure of potential infectiousness
after drug treatment, such as is provided by the AUC. However,
standardization in the days used to estimate AUC and the for-
mula (arithmetic or geometric mean) are needed. Only one trial
(Shekalaghe 2007) formally compared AUC between study arms
in a statistically valid manner. Where individual patient data were
available from other trials, the AUC could be calculated. We com-
pared the AUC over 29 and 43 days after treatment. By using
22Primaquine for reducing Plasmodium falciparum transmission (Review)
Copyright © 2012 The Cochrane Collaboration. Published by John Wiley & Sons, Ltd.
this method the reduction in overall potential infectiousness by
artemisinin-based drugs ranged from 42% to 83% (AUC) and
24% to 88% (log(10) AUC) over days 1 through 43, excluding the
Vasquez 2009 trial. Thus estimates of reduction in potential in-
fectiousness using AUC are generally lower than the reduction es-
timated using prevalence of gametocytes on single follow-up days.
Both the AUC and prevalence estimates would be improved with
gametocyte measurements on more days nearer treatment with
PQ (eg days 2, 3, 4), since PQ is likely to have its greatest impact
in the early period of infectiousness, when gametocytes are most
prevalent and at highest density. Choosing to estimate effect on
days 5, 8 or later may bias the estimate of effect, but is unlikely to
change the main conclusions of the review.
PQ could be used in two ways to reduce malaria transmission:
1) given only to people who present for treatment because of
clinical symptoms (after parasitologic confirmation of malaria) or
2) given to all infected people (symptomatic and asymptomatic)
as part of a test-and-treat strategy. These alternatives are shown
diagrammatically in Figure 1, but neither question is addressed
by studies included in this review, which all involve treatment of
symptomatic people and do not assess impact on transmission
intensity in the area. The proportion of infected people who are
asymptomatic will vary based on endemicity. It is possible that
PQ may have a greater impact on transmission in low endemic
areas or under test-and-treat strategies where a greater proportion
of infected people receive it, but this has not been demonstrated.
An early study not included here (Clyde 1962) used a mass drug
administration strategy in Tanzania in which amodiaquine (AQ)
and PQ (adult dose 30 mg or 45 mg) were given every 1, 2 or 4
weeks to everyone in three fairly isolated sites of > 5000 people in
an attempt to interrupt transmission of P. falciparum. No group
was given AQ only, so the relative impact of PQ is not known.
Weekly or biweekly AQ+PQ given to >93% of the population re-
duced prevalence and sporozoite rates to low levels, but did not in-
terrupt transmission; however starting prevalence was high (rang-
ing from 60 to 90% in children under 5 years, to 25 to 35% in
adults) in the study areas.
Modelling studies have suggested that PQ be delayed to day 8 after
primary treatment in order to maximise the effect, given the delay
in gametocyte development in P. falciparum (Lawpoolsri 2009).
However, this assumes prompt treatment seeking during the early
asexual phase. Trials in this review had varying proportions of
gametocyte carriers at time of treatment. If patients already have
gametocytes at treatment, it does not seem advisable to wait for
another 8 days before giving PQ, if the practice is adopted.
Safety
PQ brings with it a serious safety concern: haemolysis that could
be severe, life-threatening, or even fatal, in those with G6PD de-
ficiency phenotypes. G6PD is an enzyme that protects cells from
oxidative damage, to which red blood cells are particularly vul-
nerable. PQ can cause erythrocytes to haemolyse (rupture) in the
absence of G6PD. Though often referenced as a single condition,
almost 400 variants of the G6PD gene have been identified (Carter
2011). The PQ sensitivity phenotype has been characterized for
only three of the variants (Baird 2011). The two best known and
most widespread types are A-, most common in Africa and those
of African descent, and B-, which occurs most frequently around
the Mediterranean, in Asia, and parts of the Pacific.
Of the studies included in this review, Ledermann 2006 excluded
people with G6PD deficiency; in Pukrittayakamee 2004, people
with G6PD deficiency were excluded from the PQ arm; and in
Shekalaghe 2007, all patients were treated but screened first and
results reported according to G6PD status. G6PD status was ig-
nored in the remaining trials. If patients were routinely tested for
G6PD deficiency before treatment, it might be possible to avoid
haemolytic events, but screening for G6PD deficiency is rarely un-
dertaken, and even biochemical phenotype testing requires special-
ized equipment, laboratory skills, and refrigeration (Baird 2011).
Very few studies appeared to record adverse events, and surpris-
ingly, haematological outcomes were rarely systematically sought.
Most minor adverse effects such as nausea, vomiting, dizziness,
insomnia, or itching were not significantly different between PQ
and control groups, although abdominal pain was greater with
PQ in one trial (Smithuis 2010). No severe or life threatening
adverse effects were mentioned, except in Khoo 1981 where all
participants were G6PD deficient and it was not clear whether the
seven participants (out of 23 enrolled) experiencing haemolysis
and needing blood transfusion had received 3-day or 14-day PQ.
El-Sayed 2007 did not detect a reduction in packed cell volume in
Sudan, a low endemic area of Africa; G6PD status of participants
was not stated. Shekalaghe 2007 did not detect a difference in
mean haemoglobin in Tanzania. However, when the results were
presented as relative haemoglobin concentration in the publica-
tion, there was a statistically significant decrease in haemoglobin
on day 7, most pronounced in children with G6PD deficiency of
the A- variant, although no clinical symptoms of anaemia or other
adverse effects or haemoglobin less than 5 g/dL were observed. By
one month post-treatment, levels had recovered.
G6PD deficiency affects an estimated 400 million people world-
wide (Carter 2011). The distribution is roughly analogous to the
distribution of malaria transmission now or in the recent past,
leading to the suggestion that the G6PD deficiency offers some
advantage against malaria. Other evidence corroborates this find-
ing, but is not considered further here.
As with other drugs that were developed decades ago (in the 1940s,
in this case), PQ has not undergone the intense evaluation that
would be required of new drugs today. This, along with a selective
history of use, has led to the situation faced now: the drug is recom-
mended for widespread use even though relatively little is known
about the effect of PQ in individuals with G6PD deficiency from
a wide range of phenotypes and genotypes. Baird and Surjadjaja
recount this history in detail in their 2011 paper (Baird 2011).
They make the point that the apparent comfort with recommend-
23Primaquine for reducing Plasmodium falciparum transmission (Review)
Copyright © 2012 The Cochrane Collaboration. Published by John Wiley & Sons, Ltd.

ing PQ for gametocytocidal use in people with P. falciparum has
its roots in the experience of using PQ to prevent relapses in US
servicemen who had been infected with P. vivax in the Korean
War. Many of these were African Americans who carried the A-
variant which results in only mild haemolysis after full treatment
for P. vivax. They experience a transient drop in haematocrit that
recovers after a couple of months (Reeve 1992). In the A- variant,
only older erythrocytes are haemolyzed on exposure to PQ, and
the red blood cell population recovers and stabilizes, even with
continued use. In the B- variant, all erythrocytes, including young
ones, are haemolyzed. Continued dosing with PQ (as would be
used for radical cure of P. vivax) seems ill advised, since even a
single 45 mg dose can cause severe effects (Clyde 1981).
Even if screening were done, it has been suggested that haemolysis
ranging from mild to severe may occur after a single dose of PQ
even in people with normal G6PD status, when PQ is added to
AS+SP (Shekalaghe 2010). However, patients treated for malaria
may haemolyse even without PQ. This study classified G6PD
deficiency by genotype and it is possible that deficient phenotypes
of unknown genotypes were misclassified as normal.
Nevertheless, according to Baird 2011: “The free application of
45 mg PQ to patients with falciparum malaria lacks supporting
assessments of safety across the range of G6PD variants exposed
to risk of potentially serious harm”.
Drug resistance
PQ is an important drug to maintain in the malaria pharmacopeia.
It is the only widely available therapy for eliminating parasites
from hepatocytes in P. vivax and P. ovale infections (Wells 2010).
Some evidence of resistant P. vivax has emerged, though the ex-
tent of resistance is not well reported. Even without such evidence,
however, the history of antimalarials and resistance is quite clear:
the parasite will develop resistance and drugs will be lost, sooner
or later. Since resistance to CQ became widespread, WHO has
revised guidelines to prohibit treatment of uncomplicated malaria
with a single antimalarial, based on evidence that multiple drugs,
with different modes of action, will make it much less likely that
resistant parasites will emerge. Although that guidance is applied
largely to drugs used to treat asexual stages of falciparum malaria,
the principle applies to PQ as well. And even though PQ is given
along with other antimalarials when it is used to reduce transmis-
sion, it is basically monotherapy for the gametocytes, which are
not affected by the other drugs. To our knowledge, no attempt
has been made to create resistant gametocytes in the laboratory, a
type of study commonly undertaken for drugs used for primary
malaria treatment - in those cases, inducing resistance in blood-
stage parasites.
The trials in this review do not mention PQ resistance as a potential
threat, nor is it discussed by WHO. PQ should certainly be used
where it is of clinical importance (in P. vivax and P. ovale infections),
but its effectiveness against P. falciparum gametocytes could be
reduced by use. Use should therefore be limited to situations in
which it is likely to have a meaningful anti-transmission effect.
Quality of the evidence
The quality of the evidence for an effect of PQ on gametocytes in
individuals seems reasonable, with moderate quality evidence in
non-artemisinin-based and artemisinin-based regimens.
However, the quality of the evidence on the substantive outcomes
is poor, and there is little evidence from these trials in relation to
the serious adverse events known to be associated with this drug.
Potential biases in the review process
None known.
Agreements and disagreements with otherstudies or reviews
The findings of this review provide very little support for current
WHO treatment guidelines (WHO 2010). While there is good ev-
idence that PQ reduces gametocyte prevalence, density and AUC,
there is no evidence that it is effective in reducing transmission.
If PQ is given only to the fraction of infected people attending
for treatment, it may not be covering enough of the infectious
population to make any difference to the overall human infectious
reservoir.
We found insufficient reliable evidence to recommend PQ in pri-
mary treatment for reducing transmission in a community.
As with all antimalarial drugs, there is a global responsibility to
maintain the effectiveness of PQ for as long as possible without
withholding it when needed. In this case, that translates into using
it to reduce transmission only if there is reasonable evidence that
it actually has that effect. Otherwise, it will be used to little or
no effect, but its value for radical cure may be diminished by the
development of resistant parasites.
We agree with the ethical issues raised by Baird 2011 and their
conclusion that PQ should not be used without first screening for
G6PD deficiency.
A U T H O R S ’ C O N C L U S I O N S
Implications for practice
Single dose or short course PQ should not be added to routine
treatment of P. falciparum with ACTs until: 1) it has been demon-
strated that reducing infectivity of treated people in a variety of
endemic situations reduces transmission on a community basis; 2)
further research is done on safety and the adverse hematological
24Primaquine for reducing Plasmodium falciparum transmission (Review)
Copyright © 2012 The Cochrane Collaboration. Published by John Wiley & Sons, Ltd.
effects for both G6PD and non-G6PD carriers; 3) we understand
more about the proportion of gametocyte carriers who present to
receive treatment in a given population and time period and 4) the
cost of the policy balanced against the potential benefit is explored.
In any case, patients should be screened for G6PD deficiency and
those with variants predisposing to haemolysis should not be given
PQ.
Implications for research
PQ may well have a strategic role in malaria control and elimina-
tion, but it has not yet been defined, and research to support this
definition is needed. As a first step, studies summarizing measures
of infectiousness to mosquitoes over an extended period including
the days immediately following treatment, as well as defining the
proportion of asymptomatic people treated, are needed. Stratifi-
cation of studies into participants with and without gametocytes
at initial treatment is recommended.
The dynamics of gametocytes after treatment need to be under-
stood for the currently most used drugs in primary treatment. That
information can then be fed into models used to predict trans-
mission effects and eventually, community-based trials should be
conducted to measure directly the effects of PQ on transmission
(incidence) in defined endemicities. The question of effectiveness
of PQ when used in mass treatment or mass test-and-treat strate-
gies for elimination is a separate issue that can also be approached
in modelling as well as experimental studies.
A variety of research studies are required:
1. Dose optimization studies with ACTs as partner drugs,
varying the total amount of PQ needed and the schedule for
administration, to maximize the effect on gametocytes and
minimize adverse effects.
2. Studies of the effects of PQ on individuals with common
G6PD-deficiency variants, to be conducted before PQ is used in
communities.
3. Studies on induction of PQ-resistant gametocytes to help
define likelihood of resistance development and identify possible
mechanisms of resistance.
4. Research and development of rapid field-usable tests for
G6PD deficiency.
For studies of the effect of PQ on transmission, G6PD screening
should always be conducted on participants, results reported ac-
cording to G6PD phenotype, and hematologic endpoints should
be reported. For detecting gametocytes, PCR can be used if avail-
able but microscopy probably identifies the majority of the people
with highest potential infectiousness. We also recommend that
gametocytaemia be reported as AUC, or that both density and
prevalence at different times be reported so that AUC can be cal-
culated, and that AUC measurements should include the first few
days of treatment. Statistical methods for comparing AUC in dif-
ferent treatment groups should be developed and applied.
A C K N O W L E D G E M E N T S
We thank authors of Shekalaghe 2007, Vasquez 2009, Smithuis
2010, and Kolaczinski 2012 for providing unpublished data for
this review. Isabela Ribeiro assisted with assessing trials in Por-
tuguese for inclusion. David Sinclair assisted with the Summary of
Findings tables. We are grateful to our affiliated Institutions and
Organizations, and thank the referees and editors for their very
important comments and encouragement. The editorial base for
the Cochrane Infectious Disease Group is funded by the Depart-
ment for International Development (DFID), UK, for the benefit
of developing countries.
R E F E R E N C E S
References to studies included in this review
Chen 1994 {published data only}
Chen PQ, Li GQ, Guo XB. [The infectivity of gametocytes
of Plasmodium falciparum from patients treated with
artemisinine]. Zhonghua yi xue za zhi [Chinese MedicalJournal] 1994;74(4):209-10, 253-4.∗ Chen PQ, Li GQ, Guo XB, He KR, Fu YX, Fu LC, et
al.The infectivity of gametocytes of Plasmodium falciparum
from patients treated with artemisinin. Chinese MedicalJournal (Engl.) 1994;107(9):709–11.
El-Sayed 2007 {published data only}
El-Sayed B, El-Zaki SE, Babiker H, Gadalla N, Ageep
T, Mansour F, et al.A randomized open-label trial of
artesunate-sulfadoxine-pyrimethamine with or without
primaquine for elimination of sub-microscopic P. falciparumparasitaemia and gametocyte carriage in eastern Sudan.
PLoS ONE 2007;2(12):e1311.
Kamtekar 2004 {published data only}
Kamtekar KD, Gogtay NJ, Dalvi SS, Karnad DR, Chogle
AR, Aigal U, et al.A prospective study evaluating the efficacy
of a single, 45-mg dose of primaquine, as a gametocytocidal
agent, in patients with Plasmodium falciparum malaria in
Mumbai, India. Annals of Tropical Medicine and Parasitology
2004;98(5):453–8.
Khoo 1981 {published data only}
Khoo KK. The treatment of malaria in glucose-6-phosphate
dehydrogenase deficient patients in Sabah. Annals of
25Primaquine for reducing Plasmodium falciparum transmission (Review)
Copyright © 2012 The Cochrane Collaboration. Published by John Wiley & Sons, Ltd.

Tropical Medicine and Parasitology 1981;75(6):591–5.
Kolaczinski 2012 {published data only}
Kolaczinski K, Leslie T, Ali I, Durrani N, Lee S, Barends M,
et al.Defining Plasmodium falciparum treatment in South
West Asia: a randomized trial comparing artesunate or
primaquine combined with chloroquine or SP. PLoS One2012;7(1):e28957.
Ledermann 2006 {published data only}
Lederman ER, Maguire JD, Sumawinata IW, Chand
K, Elyazar I, Estiana L, et al.Combined chloroquine,
sulfadoxine/pyrimethamine and primaquine against
Plasmodium falciparum in Central Java, Indonesia. Malaria
Journal 2006;5:108.
Pukrittayakamee 2004 {published data only}
Pukrittayakamee S, Chotivanich K, Chantra A, Clemens R,
Looareesuwan S, White NJ. Activities of artesunate and
primaquine against asexual- and sexual-stage parasites in
falciparum malaria. Antimicrobial Agents and Chemotherapy2004;48(4):1329–34.
Shekalaghe 2007 {published and unpublished data}
Bousema T, Okell L, Shekalaghe S, Griffin JT, Omar S,
Sawa P, et al.Revisiting the circulation time of Plasmodium
falciparum gametocytes: molecular detection methods to
estimate the duration of gametocyte carriage and the effect
of gametocytocidal drugs. Malar J 2010;9:136.∗ Shekalaghe S, Drakeley C, Gosling R, Ndaro A,
van Meegeren M, Enevold A, et al.Primaquine clears
submicroscopic Plasmodium falciparum gametocytes that
persist after treatment with sulphadoxine-pyrimethamine
and artesunate. PLoS ONE 2007;2(10):e1023.
Singhasivanon 1994 {published data only}
Singhasivanon V, Chongsuphajaisiddhi T, Sabchareon A,
Attanath P, Webster HK, Edstein MD, et al.Pharmacokinetic
study of mefloquine in Thai children aged 5-12 years
suffering from uncomplicated falciparum malaria treated
with MSP or MSP plus primaquine. European Journal ofDrug Metabolism and Pharmacokinetics 1994;19(1):27–32.
Smithuis 2010 {published and unpublished data}
Smithuis F, Kyaw MK, Phe O, Win T, Aung PP, Oo AP, et
al.Effectiveness of five artemisinin combination regimens
with or without primaquine in uncomplicated falciparum
malaria: an open-label randomised trial. Lancet Infectious
Diseases 2010;10(10):673–81.
Vasquez 2009 {published and unpublished data}
Vasquez AM, Sanin F, Alvarez LG, Tobon A, Rios A, Blair S.
[Therapeutic efficacy of a regimen of artesunate-mefloquine-
primaquine treatment for Plasmodium falciparum malaria
and treatment effects on gametocytic development].
Biomedica 2009;29(2):307–19.
References to studies excluded from this review
Arango 2012 {published data only}
Arango EA, Upegui UA, Carmona-Fonseca J. Efficacy of
different primaquine-based antimalarial regimens against
Plasmodium falciparum gametocytemia. Acta Tropica 2012;
122(2012):177–182.
Baird 2002 {published data only}
Baird JK, Wiady I, Sutanihardja A, Suradi, Purnomo, Basri
H, et al.Short report: therapeutic efficacy of chloroquine
combined with primaquine against Plasmodium falciparumin northeastern Papua, Indonesia. American Journal of
Tropical Medicine and Hygiene 2002; Vol. 66, issue 6:
659–60.
Bunnag 1980 {published data only}
Bunnag D, Harinasuta T, Pinichpongse S, Suntharasami
P. Effect of primaquine on gametocytes of Plasmodiumfalciparum in Thailand. Lancet 1980;2(8185):91.
Che 1987 {published data only}
Che LG, Huang KG, Yang HL, Yu L, Lin ZL, Huang
R. [Combined use of pyronaridine, sulfadoxine and
primaquine in areas with chloroquine-resistant falciparum
malaria]. Zhongguo Ji Sheng Chong Xue Yu Ji Sheng Chong
Bing Za Zhi (Chinese journal of parasitology & parasiticdiseases) 1987;5(3):194–6.
Clyde 1971 {published data only}
Clyde DF, Miller RM, Music SI, McCarthy VC.
Prophylactic and sporontocidal treatment of chloroquine-
resistant Plasmodium falciparum from Vietnam. AmericanJournal of Tropical Medicine and Hygiene 1971;20(1):1–5.
da Silva 1984 {published data only}
da Silva AR, Carneiro EW, dos Santos HJ. Response of
human Plasmodium to antimalarials on the island of Saint
Louis, State of Maranhao, Brazil. Revista do Instituto de
Medecina Tropical de Sao Paulo 1984;26(3):139–46.
Doi 1989 {published data only}
Doi H, Kaneko A, Panjaitan W, Ishii A. Chemotherapeutic
malaria control operation by single dose of Fansidar plus
primaquine in North Sumatra, Indonesia. Southeast Asian
Journal of Tropical Medicine and Public Health 1989;20(3):
341–9.
Giao 2004 {published data only}
Giao PT, de Vries PJ, Hung le Q, Binh TQ, Nam NV,
Kager PA. CV8, a new combination of dihydroartemisinin,
piperaquine, trimethoprim and primaquine, compared
with atovaquone-proguanil against falciparum malaria in
Vietnam. Tropical Medicine and International Health 2004;
9(2):209–16.
Gogtay 1999 {published data only}
Gogtay NJ, Chogle AR, Sorabjee JS, Marathe SN,
Kshirsagar NA. Poor gametocytocidal activity of 45 mg
primaquine in chloroquine-treated patients with acute,
uncomplicated, Plasmodium falciparum malaria in Mumbai
(Bombay): an issue of public-health importance. Annals of
Tropical Medicine and Parasitology 1999;93(8):813–6.
Gogtay 2004 {published data only}
Gogtay NJ, Kamtekar KD, Dalvi SS, Chogle AR, Aigal U,
Kshirsagar NA. Preliminary report of the evaluation of the
gametocytocidal action of bulaquine, in adult patients with
acute, Plasmodium falciparum malaria. Annals of Tropical
Medicine and Parasitology 2004;98(5):525–8.
26Primaquine for reducing Plasmodium falciparum transmission (Review)
Copyright © 2012 The Cochrane Collaboration. Published by John Wiley & Sons, Ltd.

Gogtay 2006 {published data only}
Gogtay NJ, Kamtekar KD, Dalvi SS, Mehta SS, Chogle
AR, Aigal U, et al.A randomized, parallel study of the
safety and efficacy of 45 mg primaquine versus 75 mg
bulaquine as gametocytocidal agents in adults with blood
schizonticide-responsive uncomplicated falciparum malaria
[ISCRTN50134587]. BMC Infectious Diseases 2006;6:16.
Hii 1987 {published data only}
Hii JL, Vun YS, Chin KF, Chua R, Tambakau S, Binisol ES,
et al.The influence of permethrin-impregnated bednets and
mass drug administration on the incidence of Plasmodiumfalciparum malaria in children in Sabah, Malaysia. Medical
and Veterinary Entomology 1987;1(4):397–407.
Huang 2001 {published data only}
Huang JR, Gao YQ, Elie N. [A study of artemether
combined with primaquine in the treatment of falciparum
malaria]. Zhongguo Ji Sheng Chong Xue Yu Ji Sheng Chong
Bing Za Zhi (Chinese journal of parasitology & parasiticdiseases) 2001;19(5):308–9.
Kaneko 1989 {published data only}
Kaneko A, Kamei K, Suzuki T, Ishii A, Siagian R,
Panjaitan W. Gametocytocidal effect of primaquine in a
chemotherapeutic malaria control trial in North Sumatra,
Indonesia. Southeast Asian Journal of Tropical Medicine and
Public Health 1989;20(3):351–9.
Karbwang 1992 {published data only}
Karbwang J, Na Bangchang K, Thanavibul A, Back DJ,
Bunnag D. Pharmacokinetics of mefloquine in the presence
of primaquine. European Journal of Clinical Pharmacology
1992;42(5):559–60.
Santana 2007 {published data only}
Santana MS, da Rocha MA, Arcanjo AR, Sardinha
JF, Alecrim WD, Alecrim MG. [Association of
methemoglobinemia and glucose-6-phosphate
dehydrogenase deficiency in malaria patients treated with
primaquine]. Revista da Sociedade de Brasileira de Medicina
Tropical 2007;40(5):533–6.
Shekalaghe 2010 {published data only}
Shekalaghe SA, ter Braak R, Daou M, Kavishe R, van
den Bijllaardt W, van den Bosch S, et al.In Tanzania,
hemolysis after a single dose of primaquine coadministered
with an artemisinin is not restricted to glucose-6-
phosphate dehydrogenase-deficient (G6PD A-) individuals.
Antimicrobial Agents and Chemotherapy 2010;54(5):1762–8.
Shekalaghe 2011 {published data only}
Skekalaghe SA, Drakeley C, van den Bosch S, ter Braak
R, van den Bijllhaardt W, Mwanziva C, et al.A cluster-
randomized trial of mass drug administration with a
gametocytocidal drug combination to interrupt malaria
transmission in a low endemic area in Tanzania. MalariaJournal 2011;10:247.
Suputtamongkol 2003 {published data only}
Suputtamongkol Y, Chindarat S, Silpasakorn S,
Chaikachonpatd S, Lim K, Chanthapakajee K, et al.The
efficacy of combined mefloquine-artesunate versus
mefloquine-primaquine on subsequent development of
Plasmodium falciparum gametocytemia. American Journal of
Tropical Medicine and Hygiene 2003;68(5):620–3.
Tangpukdee 2008 {published data only}
Tangpukdee N, Krudsood S, Srivilairit S, Phophak N,
Chonsawat P, Yanpanich W, et al.Gametocyte clearance
in uncomplicated and severe Plasmodium falciparum
malaria after artesunate-mefloquine treatment in Thailand.
Southeast Asian Journal of Tropical Medicine and Public
Health 2008;46(2):65–70.
References to studies awaiting assessment
Ishii 2009 {unpublished data only}
Ishii A, Ohta N, Owhashi M, Kawabata M, Chung D,
Bobogare A, et al.Trials of transmission blocking of P.
falciparum with single dose primaquine in villages of
Solomon Islands. MIM conference October 2009 MIM
16723361.
References to ongoing studies
Eziefula ongoing {unpublished data only}
Evaluation of the efficacy and safety of PQ in uncomplicated
falciparum malaria in Uganda. Ongoing study December
2011.
Additional references
Arnold 1955
Arnold J, Alving AS, Hockwald RS, Clayman CB, Dern
RJ, Beutler E, et al.The antimalarial action of primaquine
against the blood and tissue stages of falciparum malaria
(Panama, P-F-6 strain). Journal of Laboratory and Clinical
Medicine 1955;46:391–7.
Baird 2011
Baird JK, Surjadjaja C. Consideration of ethics in
primaquine therapy against malaria transmission. Trends inParasitology 2011;27:1.
Barnes 2005
Barnes KI, White NJ. Population biology and antimalarial
resistance: The transmission of antimalarial drug resistance
in Plasmodium falciparum. Acta Tropica 2005;94:230–50.
Barnes 2008
Barnes, KI, Little F, Mabuza A, Mngomezulu N, Govere J,
Durrheim D, et al.Increased gametocytemia after treatment:
an early parasitological indicator of emerging sulfadoxine-
pyrimethamine resistance in falciparum malaria. Journal ofInfectious Diseases 2008;197(11):1605–13.
Bhasin 1984
Bhasin VK, Trager W. Chapter XI: Gametocytocidal
effects in vitro of primaquine and related compounds on
Plasmodium falciparum. In: Wernsdorfer WH, Trigg PI
editor(s). Primaquine: pharmacokinetics, metabolism, toxicity
and activity. UNDP/World Bank/WHO, 1984.
Bousema 2010
Bousema T, Okell L, Shekalaghe S, Griffin J T, Omar S,
Sawa P, et al.Revisiting the circulation time of Plasmodium
falciparum gametocytes: molecular detection methods to
27Primaquine for reducing Plasmodium falciparum transmission (Review)
Copyright © 2012 The Cochrane Collaboration. Published by John Wiley & Sons, Ltd.

estimate the duration of gametocyte carriage and the effect
of gametocytocidal drugs. Malaria Journal 2010;9:136.
Bousema 2011
Bousema T, Drakeley C. Epidemiology and Infectivity of
Plasmodium falciparum and Plasmodium vivax gametocytes
in relation to malaria control and eradication. ClinicalMicrobiology Reviews 2011;24(2):377–410.
Burgess 1961
Burgess RW, Bray RS. The effect of a single dose of
primaquine on the gametocytes, gametogony and sporogony
of Laverania falciparum. Bulletin of the World Health
Organization 1961;24:451–6.
Carter 1988
Carter R, Graves PM. Gametocytes. In: Wernsdorfer,
MacGregror editor(s). Malaria: principles and practice ofmalariology. Edinburgh: Churchill Livingstone, 1988.
Carter 2011
Carter N, Pamba A, Duparc S, Waitumbi JN. Frequency
of glucose-6-phosphate dehydrogenase deficiency in
malaria patients from six African countries enrolled in two
randomized anti-malarial clinical trials. Malaria Journal2011;10:241.
Chotivanich 2006
Chotivanich K, Sattabongkot J, Udomsangpetch U,
Looareesuwan S, Day NPJ, Coleman RE, et al.Transmission
blocking activities of quinine, primaquine and artesunate.
Antimicrobial Agents and Chemotherapy 2006;50(6):
1927–30.
Clyde 1962
Clyde DF. Mass administration of an antimalarial drug
combining 4-aminoquinoline and 8-aminoquinoline in
Tanganyika. Bulletin of the World Health Organization1962;27:203–12.
Clyde 1981
Clyde DF. Clinical problems associated with the use of
primaquine as a tissue schizonticidal and gametocytocidal
drug. Bulletin of the World Health Organization 1981;59(3):
391–5.
Drakeley 2006
Drakeley, Sutherland C, Bousema JT, Sauerwein RW,
Targett GA. The epidemiology of Plasmodium falciparum
gametocytes: weapons of mass dispersion. Trends inParasitology 2006;22:424–30.
Dunyo 2006
Dunyo S, Milligan P, Edwards T, Sutherland C, Targett
G, Pinder M. Gametocytaemia after drug treatment of
asymptomatic Plasmodium falciparum. PLoS Clinical Trials2006;e20.
Eichner 2001
Eichner M, Diebner HH, Molineaux L, Collins WE,
Jeffery GM, Dietz K. Genesis, sequestration and survival of
Plasmodium falciparum gametocytes: parameter estimates
from fitting a model to malariotherapy data. Transactions of
the Royal Society of Tropical Medicine and Hygiene 2001;95:
497–501.
Galappaththy 2007
Galappaththy GNL, Omari AAA, Tharyan P. Primaquine
for preventing relapses in people with Plasmodium
vivax malaria. Cochrane Database of Systematic Reviews2007, Issue 1. [Art. No.: CD004389. DOI: 10.1002/
14651858.CD004389.pub2]
GMAP 2008
Roll Back Malaria Partnership. Global malaria action plan.
RBM/WHO, 2008.
Graves 1988
Graves PM, Burkot TR, Carter R, Cattani JA, Lagog M,
Parker J, et al.Measurement of malarial infectivity of human
populations to mosquitoes in the Madang area, Papua New
Guinea. Parasitology 1988;96(2):251–63.
Graves 1990
Graves PM, Burkot TR, Saul AJ, Hayes RJ, Carter R.
Estimation of anopheline survival rate, vectorial capacity
and mosquito infection probability from malaria infection
rates in villages near Madang, Papua New Guinea. Journalof Applied Ecology 1990;27:134–47.
Higgins 2011
Higgins JPT, Altman DH, Sterne JAC. Chapter 8:
Assessing risk of bias in included studies. In: Higgins
JPT, Green S (editors). Cochrane Handbook for SystematicReviews of Interventions Version 5.1 [updated March 2011].
The Cochrane Collaboration, 2008. Available from
www.cochrane-handbook.org.
Killeen 2006
Killeen GF, Ross A, Smith T. Infectiousness of malaria-
endemic human populations to vectors. American Journal of
Tropical Medicine and Hygiene 2006;75(Suppl 2):38–45.
Lawpoolsri 2009
Lawpoolsri S, Klein EY, Singhasivanon P, Yimsamran S,
Thanyavanich N, Maneeboonyang W, et al.Optimally
timing primaquine treatment to reduce Plasmodiumfalciparum transmission in low endemicity Thai-Myanmar
border populations. Malaria Journal 2009;8:159.
Lefebvre 2011
Lefebvre C, Manheimer E, Glanville J. Chapter 6:
Searching for studies. In: Higgins JPT, Green S (editors).
Cochrane Handbook for Systematic reviews of interventions
Version 5.0.1. (updated March 2011). The Cochrane
Collaboration, 2011. Available from www.cochrane-
handbook.org.
Lines 1991
Lines JD, Wilkes TJ, Lyimo EO. Human malaria
infectiousness measured by age-specific sporozoite rates in
Anopheles gambiae in Tanzania.. Parasitology 1991;102(2):
167–77.
Mendez 2006
Mendez F, Munoz A, Plowe CV. Use of area under the curve
to characterize transmission potential after antimalarial
treatment. American Journal of Tropical Medicine andHygiene 2006;75(4):640–4.
28Primaquine for reducing Plasmodium falciparum transmission (Review)
Copyright © 2012 The Cochrane Collaboration. Published by John Wiley & Sons, Ltd.

Mendis 2009
Mendis K, Rietveld A, Warsame M, Bosman A, Greenwood
B, Wernsdorfer W. From malaria control to eradication:
the WHO perspective. Tropical Medicine and InternationalHealth 2009;14(7):1–7.
Okell 2008
Okell LC, Drakeley CJ, Ghani AC, Bousema T, Sutherland
CJ. Reduction of transmission from malaria patients by
artemisinin therapies: a pooled analysis of six randomized
trials. Malaria Journal 2008;7:125.
Price 1996
Price R, Nosten F, Luxemburger C, ter Kuile FO, Paiphun
L, Chongsuphajaisiddhi T, et al.The effects of artemisinin
derivatives on malaria transmissibility. Lancet 1996;347
(9016):1654–8.
Pukrittayakamee 1994
Pukrittatakamee S, Vanijanonta S, Chantra A, Clemens R,
White NJ. Blood stage antimalarial efficacy in Plasmodium
vivax malaria. Journal of Infectious Diseases 1994;169:
932–5.
Pukrittayakamee 2004
Pukrittayakamee S, Chotivanich K, Chantra A, Clemens R,
Looareesuwan S, White NJ. Activities of artesunate and
primaquine against asexual and sexual stage parasites in
falciparum malaria. Antimicrobial Agents and Chemotherapy2004;48:1329–34.
Reeve 1992
Reeve PA, Toaliu H, Kaneko A, Hall JJ, Ganczakowski
M. Acute intravascular haemolysis in Vanuatu following a
single dose of primaquine in individuals with glucose-6-
phosphate dehydrogenase deficiency. Journal of TropicalMedicine and Hygiene 1992;95(5):349–51.
Review Manager (RevMan) 5.1
The Nordic Cochrane Centre. The Cochrane Collaboration.
Review Manager (RevMan). 5.1. Copenhagen: The Nordic
Cochrane Centre. The Cochrane Collaboration, 2011.
Rieckmann 1968
Rieckmann, KH, McNamara JV, Frischer H, Stockert
TA, Carson PE, Powell RD. Gametocytocidal and
sporonticidal effects of primaquine and of sulfadiazine
with pyrimethamine in a chloroquine resistant strain
of Plasmodium falciparum. Bulletin of the World Health
Organization 1968;38:625–32.
Rieckmann 1969
Rieckmann KH, McNamara JV, Kass L, Powell RD.
Gametocytocidal and sporontocidal effects of primaquine
upon two strains of Plasmodium falciparum. MilitaryMedicine 1969;134:802–19.
Rosenberg 1990
Rosenberg R, Wirtz RA, Schneider I, Burge R. An
estimation of the number of sporozoites ejected by a
salivating mosquito. Transactions of the Royal Society of
Tropical Medicine and Hygiene 1990;84:209–12.
Rosenberg 2008
Rosenberg R. Malaria: some considerations regarding
parasite productivity. Trends in Parasitology 2008;24(11):
487–91.
Shekalaghe 2010
Shekalaghe SA, ter Braak R, Daou M, Kavishe R, van
den Bijllaardt W, van den Bosch S, et al.In Tanzania,
hemolysis after a single dose of primaquine coadministered
with an artemisinin is not restricted to glucose-6-
phosphate dehydrogenase-deficient (G6PD A-) individuals.
Antimicrobial Agents and Chemotherapy 2010;54(5):1762–8.
Smalley 1977
Smalley ME, Sinden RE. Plasmodium falciparum
gametocytes: their longevity and infectivity. Parasitology1977;74:1–8.
von Seidlein 2003
Von Seidlein L, Greenwood BM. Mass administrations of
antimalarial drugs. Trends in Parasitology 2003;19(10):
452–60.
Wells 2010
Wells TNC, Burrows JN, Baid KJ. Targeting the hypnozoite
reservoir of Plasmodium vivax: the hidden barrier to malaria
elimination. Trends in Parasitology 2010;26(3):145–51.
White 1992
White NJ. Antimalarial pharmacokinetics and treatment
regimens. British Journal of Clinical Pharmacology 1992;34:
1–10.
White 2008
White NJ. The role of antimalarial drugs in eliminating
malaria. Malaria Journal 2008;7(Suppl 1):S8.
WHO 2010
WHO. Guidelines for the treatment of malaria, second
edition. Guidelines for the treatment of malaria, secondedition. Geneva: WHO, 2010.
∗ Indicates the major publication for the study
29Primaquine for reducing Plasmodium falciparum transmission (Review)
Copyright © 2012 The Cochrane Collaboration. Published by John Wiley & Sons, Ltd.

C H A R A C T E R I S T I C S O F S T U D I E S
Characteristics of included studies [ordered by study ID]
Chen 1994
Methods Possibly individually randomized controlled trial (stated to be randomized but no infor-
mation given)
Dates of study not reported.
Participants 27 patients with slide positive P. falciparum including both asexual stages and gameto-
cytes. No information given on age or sex. All dosages appear to be adult dosages
Site: malaria endemic Hainan Island, China.
Exclusion criteria: history of antimalarial treatment for present attack
Interventions 1. Artemisinin: 1200 mg per day for 5 days (not included in review)
2. MQ: 750 mg single dose day 1 (reported as day 0).
3. MQ + PQ:750 mg single dose + 45 mg single dose day 1 (reported as day 0)
Outcomes 1. Gametocyte density: days 5, 8, 15, 22, 29 (reported in paper as days 4, 7, 14, 21, 28
since first day was day 0). Given as percent of initial density on chart only
2. Percentage of participants infectious to An. dirus: days 5, 8, 15, 22 (reported as days
4, 7, 14, 21).
3. Percentage of mosquitoes infected: days 5, 8, 15, 22 (reported as days 4, 7, 14, 21)
Notes For gametocyte density, graph only of percentages; no raw numbers given except range
of asexuals and gametocyte numbers reported for each group on day 1 (reported as day
0)
Risk of bias
Bias Authors’ judgement Support for judgement
Random sequence generation (selection
bias)
Unclear risk No information on sequence generation.
Describes process as participants “divided
into groups A, B, and C”. Equal number
in each group and lack of detail suggests
randomization not done adequately
Allocation concealment (selection bias) High risk No data to suggest any measures to conceal
allocation.
Incomplete outcome data (attrition bias)
All outcomes
Low risk No missing participants in intervention
groups 2 and 3.
Selective reporting (reporting bias) Low risk No obvious selective reporting.
Other bias Low risk No indication of other bias.
30Primaquine for reducing Plasmodium falciparum transmission (Review)
Copyright © 2012 The Cochrane Collaboration. Published by John Wiley & Sons, Ltd.

Chen 1994 (Continued)
Blinding of participants and personnel
(performance bias)
All outcomes
Unclear risk Not reported.
Blinding of outcome assessment (detection
bias)
All outcomes
Unclear risk Not reported.
El-Sayed 2007
Methods Individually randomized controlled trial.
Dates of study: Randomization June 2004; trial done 17 Aug 2004 to 3 Sep 2004
Participants 104 persons with asymptomatic P. falciparum positive by slide and positive for gameto-
cytes by PCR. No information given on age and sex
Site: Two villages in East Sudan where there is seasonal malaria, mainly P. falciparum,during Oct to Dec.
Exclusion criteria: pregnancy, history of sulfa allergy, fever or other symptoms, Plasmod-ium spp other than P. falciparum present.
Interventions 1. AS: Children < 50 kg: 4 mg/kg; All > 50 kg: 200 mg (2 100-mg tabs) days 1, 2, 3
(reported as days 0, 1, 2)
SP: Children < 50 kg: 25 mg/kg S + 1.25 mg/kg P; All > 50 kg: 3 tablets of 500 mg
S+25 mg P
2. As for 1 above plus PQ 0.75 mg/kg day 4 (reported as day 3)
Outcomes 1. Proportion of persons with P. falciparum parasites by PCR days 4, 8 and 15 (reported
as days 3, 7 and 14)
2. Proportion of persons with gametocytes by RT-PCR days 8 and 15 (reported as days
7 and 14)
3. Adverse events days 2, 3, 4, 8 and 15 (reported as days 1, 2, 3, 7 and 14)
4. Packed cell volume days 1, 8 and 15 (reported as days 0, 7 and 14)
Notes The trial was conducted about 2 months after the initial screening for positives (asymp-
tomatic carriers)
Risk of bias
Bias Authors’ judgement Support for judgement
Random sequence generation (selection
bias)
Low risk “The list of carriers was sorted according
to village and age to ensure that the treat-
ment groups were balanced with respect to
these two variables. The random allocation
of this ordered list into the treatment arms
was then created using restricted random-
ization with a block size of 12 in STATA
v7...”
31Primaquine for reducing Plasmodium falciparum transmission (Review)
Copyright © 2012 The Cochrane Collaboration. Published by John Wiley & Sons, Ltd.

El-Sayed 2007 (Continued)
Allocation concealment (selection bias) Unclear risk No information given.
Incomplete outcome data (attrition bias)
All outcomes
Low risk Only 3 out of 104 participants did not
complete the follow up
Selective reporting (reporting bias) Low risk No obvious selective reporting.
Other bias Low risk No indication of other bias.
Blinding of participants and personnel
(performance bias)
All outcomes
High risk Patients and health staff were not blinded.
Blinding of outcome assessment (detection
bias)
All outcomes
Low risk Lab staff doing PCR were blinded.
Kamtekar 2004
Methods Individually randomized controlled trial, comprising two distinct comparisons a: (CQ
or [CQ+SP]) with and without PQ and b: QN with and without PQ
Dates of study: not given.
Participants 57 persons age >/= 16 years with symptomatic uncomplicated and 46 with severe (WHO
criteria) P. falciparum malaria, diagnosed by thick and thin blood slides. Gametocytaemic
within first 72 hrs with > 55 P. falciparum gametocytes/µL
Site: urban areas of Mumbai, India.
Exclusion criteria: Pregnant or lactating, treatment for malaria within last two weeks,
co-infection with P.vivax, history of PQ allergy.
Interventions Comparison a: for uncomplicated malaria
1. CQ or (CQ+SP)
CQ 10 mg/kg on days 1 and 2; 5 mg/kg on day 3;
SP 1500 mg S, 75 mg P on day 1;
Placebo for PQ on day 4.
2. [CQ or (CQ+SP)] + PQ
As above in 1, substituting PQ 45 mg for placebo on day 4
Comparison b: (for severe malaria)
3. QN
QN 10 mg/kg every 8 hrs for 24-48 hrs and orally for total of 7 days
Placebo for PQ on day 8.
4. QN +PQ
As above in 3, substituting PQ 45 mg for placebo on day 8.
Outcomes 1. Proportion of persons with gametocytes, days 1, 4, 8, 15, 22, 29
2. Proportion of persons with viable gametocytes (exflagellation), days 1, 4, 8, 15, 22,
29
3. Gametocyte density (given as range) days 1, 4, 8, 15, 22, 29
32Primaquine for reducing Plasmodium falciparum transmission (Review)
Copyright © 2012 The Cochrane Collaboration. Published by John Wiley & Sons, Ltd.

Kamtekar 2004 (Continued)
Notes No screening for G6PD deficiency. It is not stated how many got SP in addition to CQ
or why
Risk of bias
Bias Authors’ judgement Support for judgement
Random sequence generation (selection
bias)
High risk ’simple computer generated randomization
code’.
Not all patients had gametocytes on day 1.
Inclusion criteria were that the person had
to have gametocytes in the first 72 hours
(from day 1?). This suggests some post ran-
domization inclusions or exclusions
Allocation concealment (selection bias) Unclear risk No information.
Incomplete outcome data (attrition bias)
All outcomes
High risk Originally there were 57 persons included
in uncomplicated comparison (a), of whom
2 were lost to follow up and 9 were not
evaluated as they showed CQ resistance
There were 46 in severe comparison (b), of
whom 3 were lost to follow up
The final numbers evaluated in each group
were (a) 22 and 24 (b) 22 and 21
Selective reporting (reporting bias) Unclear risk No obvious selective reporting.
Other bias High risk It was not clear why some patients got SP
and others did not, and the numbers in
each group are not given
Blinding of participants and personnel
(performance bias)
All outcomes
Low risk Study used a placebo for PQ. Patients and
health workers were blinded
Blinding of outcome assessment (detection
bias)
All outcomes
Low risk Slide readers were blinded.
Khoo 1981
Methods Individually randomized controlled trial.
Dates of study: between June 1976 and March 1978.
Participants 69 persons (adults and children of both sexes, no ages specified) with G6PD deficiency
(full or partial by Brewer’s methaemoglobin reduction test) who were slide positive for
malaria (P. falciparum, P. vivax or mixed).
33Primaquine for reducing Plasmodium falciparum transmission (Review)
Copyright © 2012 The Cochrane Collaboration. Published by John Wiley & Sons, Ltd.

Khoo 1981 (Continued)
Site: Sabah, Malaysia.
Exclusion criteria:other associated clinical conditions.
Interventions 1. CQ
1.5 g CQ over 3 days for P. falciparum, P. vivax or mixed, less for children
2. CQ + PQ
CQ as above plus 75 mg PQ over 3 days for P. falciparum; 201 mg PQ over 14 days for
P. vivax and mixed infections; less for children
3. SP (not included in this review)
1.5 g S and 75 mg P, single dose
Outcomes 1. Hemolysis
2. Proportion cleared parasites by 72 hours
3. Need for blood transfusion
4. Renal failure
Notes The participants are not divided by P. falciparum, P. vivax or mixed, so it is not possible
to use the data.
Risk of bias
Bias Authors’ judgement Support for judgement
Random sequence generation (selection
bias)
Unclear risk “those found G6PD deficient were ran-
domly assigned.”
Allocation concealment (selection bias) Unclear risk No information given.
Incomplete outcome data (attrition bias)
All outcomes
Unclear risk No information given.
Selective reporting (reporting bias) Low risk No apparent selective reporting.
Other bias Low risk No indication of other bias.
Blinding of participants and personnel
(performance bias)
All outcomes
Unclear risk Not reported.
Blinding of outcome assessment (detection
bias)
All outcomes
Unclear risk Not reported.
34Primaquine for reducing Plasmodium falciparum transmission (Review)
Copyright © 2012 The Cochrane Collaboration. Published by John Wiley & Sons, Ltd.

Kolaczinski 2012
Methods Individually randomized controlled trial.
Dates of study: between July and January, from 2000 to 2003.
Participants 237 individuals aged from 3 to 70 years, in 5 villages for Afghan refugees in Pakistan
Inclusion: > 2 years of age, P. falciparum mono-infection, confirmed by slide, will be
resident during entire follow-up period
Exclusions: pregnancy, signs of severe malaria, report of antimalarial drug in past 21
days, other serious disease
Interventions 1. CQ
3 days 25 mg/kg.
2. CQ+PQ
CQ as in 1; PQ on day 3 (0.5 mg/kg).
3. SP
25:1.25 mg/kg in single dose.
4. SP+PQ
SP as in 3; PQ on same day (0.5 mg/kg).
Outcomes 1. Clinical treatment failure (PCR non-adjusted and adjusted)
2. Gametocytes on day 8.
3. Gametocyte density on days 1 to 8 of follow-up.
4. Genotyping of resistant strains for CQ and SP-specific mutations
Notes Also included CQ + AS and SP + AS arms, compared with CQ +/- PQ and SP +/- PQ
arms, respectively
Risk of bias
Bias Authors’ judgement Support for judgement
Random sequence generation (selection
bias)
Low risk Patients numbered sequentially at enrol-
ment. Random numbers with treatment as-
signment from Excel-generated lists, then
paired with patient numbers
Allocation concealment (selection bias) Low risk Patient number concealed until after enrol-
ment.
Incomplete outcome data (attrition bias)
All outcomes
Low risk 209 of 237 randomized completed treat-
ment and at least one follow-up test. 47
(13%) of those randomized did not con-
tribute data. Variable numbers tested dur-
ing follow-up (see analyses)
Selective reporting (reporting bias) Low risk None detected.
Other bias Low risk None noted.
35Primaquine for reducing Plasmodium falciparum transmission (Review)
Copyright © 2012 The Cochrane Collaboration. Published by John Wiley & Sons, Ltd.

Kolaczinski 2012 (Continued)
Blinding of participants and personnel
(performance bias)
All outcomes
High risk Identified in report as ’single-blind’. Man-
ager (gave Rx) not blinded; patients, mi-
croscopists and health workers ‘partially
blinded’ due to different drug appearance
and times of follow-up. No placebos used,
but vitamin given to those in non-PQ arms
Blinding of outcome assessment (detection
bias)
All outcomes
Low risk Implied only.
Ledermann 2006
Methods Individually randomized controlled trial.
Date of study July-Oct 2001.
Participants 117 malaria cases with P. falciparum >/= 400 asexual stages/µL (thick film) recruited by
mass blood survey and passive case detection. Symptoms not required
Age: >/=15 years
Site: Central Java, Indonesia, an area with high CQ resistance and resurgent malaria
approximately equal P. falciparum and P. vivax.
Exclusion criteria: Pregnancy, breast feeding, body weight < 40kg, G6PD deficiency,
history of antimalarial or antibiotic in last 7 days, severe or complicated malaria, history
or allergy or adverse reaction to study medications, Pv or mixed infection
Interventions 1. CQ only (not included in this review).
2. CQ+SP.
CQ 150 mg base, 10, 10 and 5 mg/kg on days 1, 2, 3 (reported as days 0, 1, 2)
SP 500 mg S 25 mg P on day 1 (reported as day 0).
3. CQ+SP as for group 2 above plus PQ 45 mg on day 1 (reported as day 0)
4. CQ+SP as for group 2 above plus PQ 45 mg on day 3 (reported as day 2)
Outcomes 1. Parasite clearance time assessed at days 1, 3, 8, 15, 22, 29 or day of recurrent para-
sitaemia (reported as days 0, 2, 7, 14, 21, 28)
2. Fever clearance time at days 2, 3, 4, 5, 8, 12, 15, 19, 22, 29
3. Proportion of persons with gametocytes (from chart) days 1 to 29
4. Adverse events.
Notes Some comparisons in the results reported include the CQ only group
Risk of bias
Bias Authors’ judgement Support for judgement
Random sequence generation (selection
bias)
Low risk Study subject codes were assigned to treat-
ment arms by a random process (not spec-
ified)
36Primaquine for reducing Plasmodium falciparum transmission (Review)
Copyright © 2012 The Cochrane Collaboration. Published by John Wiley & Sons, Ltd.

Ledermann 2006 (Continued)
Allocation concealment (selection bias) High risk Eligibles were assigned a sequential par-
ticipant number by the screening physi-
cian. Pre-packaged treatment but not stated
whether allocation was concealed
Incomplete outcome data (attrition bias)
All outcomes
Low risk 7% of participants withdrew before day 28.
Selective reporting (reporting bias) Unclear risk Abstract states that drugs were well toler-
ated and safe but no evidence is given in
report
Other bias Low risk No indication of other bias.
Blinding of participants and personnel
(performance bias)
All outcomes
Unclear risk Blinding was implied only.
Blinding of outcome assessment (detection
bias)
All outcomes
Unclear risk Blinding was implied only.
Pukrittayakamee 2004
Methods Individually randomized controlled trial.
Time of study not stated.
Participants 176 patients with acute uncomplicated P. falciparum. After exclusion of QN+tetracycline
group: 146.
Age 14 to 62.
All male.
Site: Hospital for Tropical Diseases, Bangkok, Thailand.
Exclusion criteria: Severe malaria, mixed malaria infection, history of drug hypersensi-
tivity, any antimalarial within last 48 hrs, urine positive for sulfonamide or 4-amino-
quinoline
Persons with G6PD deficient phenotype were excluded from receiving PQ
Interventions 1. QN
QN sulfate (300 mg salt/tab) at 10 mg salt/kg, 3x per day for 7 days
2. QN+tetracycline (excluded from this review).
3. QN+PQ low dose
QN as above in 1 plus PQ 15 mg base/tab, 0.25 mg/kg base (adult dose 15 mg base)
daily for 7 days
4. QN+PQ high dose
QN as above in 1 plus PQ 0.50 mg/kg base (adult dose 30 mg base) daily for 7 days
5. AS
AS 50 mg salt/tab 3.3 mg/kg (adult dose 200 mg) on day 1 and 1.65 mg/kg (adult dose
100 mg) daily on days 2 to 7
37Primaquine for reducing Plasmodium falciparum transmission (Review)
Copyright © 2012 The Cochrane Collaboration. Published by John Wiley & Sons, Ltd.

Pukrittayakamee 2004 (Continued)
6. AS+PQ (high dose)
AS as above plus PQ 0.5 mg/kg base daily on days 1 to 7.
Outcomes 1. Parasite clearance time: measured at 12 hrs until clearance
2. Gametocyte clearance time: median, 12 hrs until clearance
3. Fever clearance time (measured every 4 hr at first and then every 6-12 hrs until
resolution of fever
4. Parasite reduction ration at 48 hrs.
5. Reappearance of infection P. falciparum/P. vivax up to 28 days.
6. Prevalence of gametocytes on admission/after treatment/total
7. Gametocyte carriage: total number of hours for which gametocytes were detectable
Notes Patients with recrudescence of P. falciparum or relapse of P. vivax were re-treated with 7
day QN+tetracycline or ’standard doses’ of CQ+PQ respectively; not clear if they were
excluded from further study
Risk of bias
Bias Authors’ judgement Support for judgement
Random sequence generation (selection
bias)
High risk Method not stated. Patients with G6PD
deficiency were excluded from getting PQ
which suggests randomization was biased
Allocation concealment (selection bias) Unclear risk No information given.
Incomplete outcome data (attrition bias)
All outcomes
Unclear risk 122/142 of the original participants in the
5 groups studied here completed follow
up. Patients with recrudescences of P. falci-parum or relapse of P. vivax were re-treated
with QN+tetracycline or CQ+PQ respec-
tively; not clear if they were excluded from
further study
Selective reporting (reporting bias) Unclear risk Not detected.
Other bias Unclear risk Those who were unable to stay in hospital
until clearance of both fever and parasites
were excluded from study of fever clearance
time
Blinding of participants and personnel
(performance bias)
All outcomes
Unclear risk Not reported.
Blinding of outcome assessment (detection
bias)
All outcomes
Unclear risk Not reported.
38Primaquine for reducing Plasmodium falciparum transmission (Review)
Copyright © 2012 The Cochrane Collaboration. Published by John Wiley & Sons, Ltd.

Shekalaghe 2007
Methods Individually randomized controlled trial.
Time of study Jun to Sept 2006.
Participants 108 children with fever > 37.5 °C or history of fever in last 48 hours and P. falciparummono-infection 500 - 100,000/µL.
Age 3 to 15 years.
Both sexes.
Site: Mynuzi health center, NE Tanzania, a hyperendemic area with rainy seasons in
Mar-June and Oct-Dec
Exclusion criteria: Hb < 8, inability to take drugs orally, known hypersensitivity to meds,
reported anti-malarial treatment in last 2 weeks, evidence of chronic disease or acute
infection other than malaria, domicile outside study area, signs of severe malaria, eligible
for other malaria studies
Interventions 1. AS+SP
AS: 4 mg/kg once daily for 3 days
SP: S 25 mg/kg and P: 1.125 mg/kg
2. AS+SP+PQ
As above for AS and SP plus PQ base 0.75 mg/kg on the third day
Outcomes 1. Proportion of persons with gametocytes (by microscopy) days 1, 4, 8, 15, 29, 43
(reported as 0, 3, 7, 14, 28, 42)
2. Proportion with gametocytes (by PCR), same time points.
3. Gametocyte density by PCR.
4. AUC for gametocyte presence.
5. Adverse events.
6. Adequate clinical and parasitological response.
7. Haemoglobin.
Notes Hb outcome assessed with respect to G6PD variant.
Risk of bias
Bias Authors’ judgement Support for judgement
Random sequence generation (selection
bias)
Low risk Generated in STATA 8.0 using restricted
randomization with block size of 20
Allocation concealment (selection bias) Unclear risk Pre-prepared envelopes (but person who
opened envelope administered treatment)
Incomplete outcome data (attrition bias)
All outcomes
Low risk Only 2 out of 108 failed to complete fol-
low-up.
Selective reporting (reporting bias) Low risk Why no day 22 results?
Other bias Low risk No indication of other bias.
39Primaquine for reducing Plasmodium falciparum transmission (Review)
Copyright © 2012 The Cochrane Collaboration. Published by John Wiley & Sons, Ltd.

Shekalaghe 2007 (Continued)
Blinding of participants and personnel
(performance bias)
All outcomes
Unclear risk Study physician evaluated patients, opened
envelopes, and administered treatment.
Other staff were blinded. Not clear of par-
ticipants were blinded
Blinding of outcome assessment (detection
bias)
All outcomes
Unclear risk Not stated.
Singhasivanon 1994
Methods Study design: Individually randomized controlled trial.
Time of study: not stated.
Participants 23 persons with uncomplicated P. falciparum malaria, parasitaemia between 1-5 per 1000
rbc.
Age 5 to 12 years, sex not stated.
Exclusion criteria: antimalarial drugs, urine with quinoline and sulfonamide drugs, other
diseases, hematocrit </=20%, inability to take oral medication
Interventions 1. MSP
MQ 20 mg/kg; S 40 mg base/kg; P 2 mg/kg; single dose.
2. MSP + PQ
As above plus PQ 0.75 mg/kg single dose.
MSP+PQ crushed and mixed with 30 ml syrup (83% dextrose).
Outcomes 1. Gametocyte clearance time (days) (assessed twice daily until negative, then once daily,
by blood slide)
2. Adverse drug reactions, assessed once daily in first week then once a week
3. Parasite clearance time (hrs).
4. Fever clearance time (hrs).
5. Cure rate.
Notes Those who vomited within 3 hr of Rx were excluded - this is a post randomization
exclusion
Risk of bias
Bias Authors’ judgement Support for judgement
Random sequence generation (selection
bias)
Unclear risk No information given.
Allocation concealment (selection bias) Unclear risk No information given.
Incomplete outcome data (attrition bias)
All outcomes
High risk Outcomes only reported for 18 of the 23
participants.
40Primaquine for reducing Plasmodium falciparum transmission (Review)
Copyright © 2012 The Cochrane Collaboration. Published by John Wiley & Sons, Ltd.

Singhasivanon 1994 (Continued)
Selective reporting (reporting bias) Unclear risk No information given.
Other bias High risk Those who vomited within 3 hr of Rx were
excluded- this is a post randomization ex-
clusion
Blinding of participants and personnel
(performance bias)
All outcomes
Unclear risk Not stated.
Blinding of outcome assessment (detection
bias)
All outcomes
Unclear risk Not stated.
Smithuis 2010
Methods Study design: Individually randomized controlled trial (5 comparisons - 10 arms)
Follow up: Patients were asked to return weekly for 9 weeks for assessment and at any
other time they were unwell
Dates: Dec 2008 to March 2009.
Participants Number: 808 persons attending clinics in Myanmar.
Inclusion criteria: Age > 6 months, weight > 5kg, P. falciparum mono-infection 500 to
200,000 parasites/µL or co-infection with P. vivax, informed consent.
Exclusion criteria: Pregnancy, signs of severe malaria, severe malnutrition, history of
hypersensitivity to any of the study drugs, severe malnutrition, concomitant febrile
illness, history of psychiatric disorder, a full course of MQ in the previous 9 weeks or
any other antimalarial in the previous 48 hrs
Interventions Each of the five study arms was divided into two where one half also received a one-off
dose of 0.75 mg/kg PQ on day 1
Groups:
1+2. AS plus amodiaquine, fixed dose combination: 25 mg/67.5 mg or 50 mg/135 mg
or 100 mg/270 mg tablets
• AS 4 mg/kg once daily for 3 days
• AQ 10.8 mg base/kg once daily for 3 days
3+4. Artemether-lumefantrine, fixed dose combination: 20 mg/120 mg tablets
• A 3.3 mg/kg in two divided doses each day for 3 days
• L 19.8 mg/kg in two divided doses each day for 3 days
• Advised to consume fatty food or breast feed before each dose
5+6. ASplus MQ, fixed dose combination: 25 mg/55 mg or 100 mg/220 mg tablets
(artesunate: Guilin, Lariam: Hoffman-La Roche)
• AS 4 mg/kg once daily for 3 days
• MQ 8.8 mg/kg once daily for 3 days
7+8. Artesunate plus MQ, loose combination (artesunate: Guilin, Lariam: Hoffman-La
Roche)
• AS 4 mg/kg once daily for 3 days
• MQ 25 mg base/kg as a single dose on day 1 (reported as day 0)
41Primaquine for reducing Plasmodium falciparum transmission (Review)
Copyright © 2012 The Cochrane Collaboration. Published by John Wiley & Sons, Ltd.

Smithuis 2010 (Continued)
9+10. Dihydroartemisinin-piperaquine, fixed-dose combination: 40 mg/320 mg or 20
mg/160 mg tablets (Artekin: Holleykin)
• DHA 2.5 mg/kg once daily for 3 days
• P 20 mg/kg once daily for 3 days
First dose supervised, all others unsupervised.
Outcomes 1. Recurrent parasitaemia at day 15, 29, 43 and 64 (reported as days 14, 28, 42 and
63).
2. Treatment failure due to P. falciparum.3. Gametocytaemia prevalence.
4. Person-gametocyte weeks.
5. Haemoglobin on days 1 and 64.
6. Adverse events (monitoring not described).
Notes Funding: Médecins sans Frontières (Holland).
Risk of bias
Bias Authors’ judgement Support for judgement
Random sequence generation (selection
bias)
Low risk ’After patients were screened and enrolled
in the study, they were stratified prospec-
tively into three age groups (1-4 years, 5-
14 years and older than 14 years). Patients
were randomly assigned in equal numbers
to receive one of the five different treat-
ments. They were then randomly assigned
either a single dose of PQ ... or not.’
Allocation concealment (selection bias) Low risk ’Treatment allocations were put in sealed
envelopes in blocks of 50 for each
age group, and random assignment was
achieved by patients drawing an envelope
from a box after enrollment. When the
box was empty, another 50 envelopes were
added.’
Incomplete outcome data (attrition bias)
All outcomes
Low risk Attrition is low in absolute numbers and
unlikely to have introduced significant bias
Selective reporting (reporting bias) Low risk No evidence of selective reporting.
Other bias Low risk No indication of other bias.
Blinding of participants and personnel
(performance bias)
All outcomes
High risk Open label trial for patients and medical
staff.
42Primaquine for reducing Plasmodium falciparum transmission (Review)
Copyright © 2012 The Cochrane Collaboration. Published by John Wiley & Sons, Ltd.

Smithuis 2010 (Continued)
Blinding of outcome assessment (detection
bias)
All outcomes
Low risk Microscopists were blinded.
Vasquez 2009
Methods Individually randomized controlled trial.
Time of study: Apr 2007 to Feb 2008.
Participants 50 persons with uncomplicated P. falciparum diagnosis by thick blood slide, 150-50,000
parasites per µL
Age 1 yr and over, both sexes.
Exclusion criteria: pregnant, mixed infection, danger signs and complications, allergy to
antimalarials, serious illness at time or presentation, antimalaria treatment in last 72 hrs,
MQ in last 4 weeks
Interventions 1. AS+MQ
Age 1-6: AS 50 mg on days 1, 2, 3 (reported as 0, 1, 2); MQ 250 mg on day 2
Age 7-13: AS 100 mg on days 1, 2, 3, MQ 250 mg on days 1, 2, 3
Age > 13: AS 200 mg on days 1, 2, 3, MQ 500 mg on days 1, 2, 3
2. AS+MQ+PQ
As above plus PQ:
Age 1-6: 0.3-0.6 mg/kg day 3 (reported as day 2).
Age 7-13: 22.5 mg/kg day 3.
Age > 13: 45 mg day 3.
Outcomes Assessed on days 2, 3, 4, 8, 15, 22, 29, 36, 43.
1. Clinical recurrence.
2. Parasitemia prevalence.
3. Parasite density.
4. Fever resolution.
5. Prevalence of gametocytes.
6. Density of gametocytes.
7. Adverse effects.
Notes
Risk of bias
Bias Authors’ judgement Support for judgement
Random sequence generation (selection
bias)
High risk Seems to be alternate allocation following
order of arrival (“segun el orden de llegada”)
Allocation concealment (selection bias) Unclear risk Not clear.
Incomplete outcome data (attrition bias)
All outcomes
Low risk No dropouts noted.
43Primaquine for reducing Plasmodium falciparum transmission (Review)
Copyright © 2012 The Cochrane Collaboration. Published by John Wiley & Sons, Ltd.

Vasquez 2009 (Continued)
Selective reporting (reporting bias) Low risk No evidence of bias.
Other bias Low risk No suggestion of other bias.
Blinding of participants and personnel
(performance bias)
All outcomes
High risk Seems not be blinded (“con determination
no ciega del efecto en grupos iguales”).
Blinding of outcome assessment (detection
bias)
All outcomes
High risk
Characteristics of excluded studies [ordered by study ID]
Study Reason for exclusion
Arango 2012 Not randomized.
Baird 2002 Outcome is cure of asexual infection. No gametocyte outcomes
Bunnag 1980 Comparison of SP plus either 5 day PQ 15 mg, single dose PQ 30 mg or single dose PQ 45 mg in patients
with and without gametocytes at presentation. No regimen without PQ. Authors state they will do further
studies, including transmission. No difference in gametocyte outcomes between regimens and gametocytes
persisted for up to 21 days
Che 1987 No mention of randomization. No valid comparison group (pyronaridine phosphate plus sulfadoxine plus
PQ versus pyronaridine phosphate only)
Clyde 1971 Prophylactic efficacy trial of drug regimens, some including PQ, against sporozoite challenge. Gametocyti-
cidal effect of single dose 45 mg PQ tested in 7 P. falciparum gametocyte carriers but no comparison group.
Gametocytes cleared in 4 to 9 days in these persons. Inhibition of oocyst development despite presence of
gametocytes after PQ treatment also demonstrated in 2 persons but with no controls
da Silva 1984 Trial of treatment regimens, some including PQ, for P. vivax and P. falciparum.
Doi 1989 Non-randomized community observational study.
Giao 2004 No gametocyte outcomes.
Gogtay 1999 Compares QN+PQ against QN+bulaquine. Not a relevant comparison
Gogtay 2004 Compares QN+Doxycyline+PQ against QN+doxycycline+bulaquine. Not a relevant comparison
Gogtay 2006 No appropriate control group. Seems to be part of a CQ+PQ versus CoArtem trial but only reports results
from one arm
44Primaquine for reducing Plasmodium falciparum transmission (Review)
Copyright © 2012 The Cochrane Collaboration. Published by John Wiley & Sons, Ltd.

(Continued)
Hii 1987 Controlled before and after study comparing SP+PQ+ITN versus SP+PQ only. Only one cluster per arm
and no group without PQ
Huang 2001 No gametocyte outcomes.
Kaneko 1989 Non-randomized community trial comparing SP+PQ in one village with SP only in another. Only one
cluster per arm
Karbwang 1992 Pharmacokinetic study; no gametocyte outcomes or control group
Santana 2007 Study of 14 day regimen of 15 mg PQ. Some P. falciparum cases were included but study did not distinguish
between the patients with P. falciparum and P. vivax . Study was a comparison of association between
methaemoglobinaemia after 14 day PQ in persons with and without G6PD deficiency
Shekalaghe 2010 Randomized comparison of anaemia after SP+AS+PQ versus placebo. Children with haemoglobin < 8g
were excluded from receiving PQ
Shekalaghe 2011 Trial was a comparison of SP+AS+PQ versus placebo. No comparison of groups with and without PQ
Suputtamongkol 2003 Comparison of MQ+AS versus MQ+PQ. No appropriate control group
Tangpukdee 2008 Comparison of Artequick (contains PQ) with MQ+AS. No appropriate control group and no gametocyte
outcomes
Characteristics of studies awaiting assessment [ordered by study ID]
Ishii 2009
Methods Unclear
Participants Residents of trial villages in Solomon Islands (number not given)
Interventions Testing of clinical malaria patients for G6PD and addition of single dose PQ to a partner drug if appropriate
Outcomes Village prevalence of malaria
Notes
45Primaquine for reducing Plasmodium falciparum transmission (Review)
Copyright © 2012 The Cochrane Collaboration. Published by John Wiley & Sons, Ltd.

Characteristics of ongoing studies [ordered by study ID]
Eziefula ongoing
Trial name or title Evaluation of the efficacy and safety of PQ in uncomplicated falciparum malaria in Uganda
Methods Individually randomized trial
Participants Inclusion criteria: >/= 1 yr-10 years; both genders; 38 ° C (tympanic) or history of fever in last 24 hours; P.falciparum parasitaemia < 500,000/µL; normal G6PD enzyme function
Exclusion criteria: enrolled in another study; evidence of severe illness/danger signs; known allergy to medi-
cations; haemoglobin < 8 g/dL; started menstruation; pregnant or breastfeeding; PQ taken in last 4 weeks;
blood transfusion in last 90 days; Non-falciparum malaria co-infection
Interventions PQ
Outcomes Primary:
1. Fall in Hb from enrollment to day 28.
2. Mean days to gametocyte clearance.
Secondary:
1. Follow-up day of Hb nadir.
2. GI symptoms.
3. Serious adverse events.
4. AUC of gametocyte density during 14 days of follow-up.
5. Need for blood transfusion.
Starting date December 2011
Contact information Alice Eziefula; [email protected]
Notes
46Primaquine for reducing Plasmodium falciparum transmission (Review)
Copyright © 2012 The Cochrane Collaboration. Published by John Wiley & Sons, Ltd.

D A T A A N D A N A L Y S E S
Comparison 1. GIVEN WITH CQ, OR CQ+SP
Outcome or subgroup titleNo. of
studies
No. of
participants Statistical method Effect size
1 Participants with gametocytes 3 Risk Ratio (M-H, Fixed, 95% CI) Subtotals only
1.1 Day 4 1 139 Risk Ratio (M-H, Fixed, 95% CI) 0.99 [0.69, 1.42]
1.2 Day 8 3 303 Risk Ratio (M-H, Fixed, 95% CI) 0.45 [0.34, 0.60]
1.3 Day 12 1 120 Risk Ratio (M-H, Fixed, 95% CI) 0.07 [0.01, 0.49]
1.4 Day 15 3 270 Risk Ratio (M-H, Fixed, 95% CI) 0.12 [0.05, 0.26]
1.5 Day 22 3 227 Risk Ratio (M-H, Fixed, 95% CI) 0.09 [0.03, 0.31]
1.6 Day 29 3 201 Risk Ratio (M-H, Fixed, 95% CI) 0.29 [0.10, 0.86]
1.7 Day 36 1 19 Risk Ratio (M-H, Fixed, 95% CI) 0.6 [0.13, 2.82]
1.8 Day 43 1 12 Risk Ratio (M-H, Fixed, 95% CI) 0.71 [0.06, 8.90]
2 Participants with asexual
parasites (treatment failure day
29)
1 Risk Ratio (M-H, Fixed, 95% CI) Subtotals only
2.1 Not PCR adjusted 1 135 Risk Ratio (M-H, Fixed, 95% CI) 0.90 [0.75, 1.09]
2.2 PCR adjusted 1 135 Risk Ratio (M-H, Fixed, 95% CI) 0.87 [0.65, 1.16]
Comparison 2. GIVEN WITH SP
Outcome or subgroup titleNo. of
studies
No. of
participants Statistical method Effect size
1 Participants with gametocytes 1 Risk Ratio (M-H, Fixed, 95% CI) Subtotals only
1.1 Day 2 1 84 Risk Ratio (M-H, Fixed, 95% CI) 0.61 [0.32, 1.16]
1.2 Day 3 1 83 Risk Ratio (M-H, Fixed, 95% CI) 0.75 [0.45, 1.27]
1.3 Day 4 1 82 Risk Ratio (M-H, Fixed, 95% CI) 0.60 [0.35, 1.04]
1.4 Day 8 1 79 Risk Ratio (M-H, Fixed, 95% CI) 0.77 [0.60, 1.01]
1.5 Day 15 1 73 Risk Ratio (M-H, Fixed, 95% CI) 0.68 [0.48, 0.95]
1.6 Day 22 1 73 Risk Ratio (M-H, Fixed, 95% CI) 0.51 [0.34, 0.78]
1.7 Day 29 1 66 Risk Ratio (M-H, Fixed, 95% CI) 0.37 [0.19, 0.72]
1.8 Day 36 1 62 Risk Ratio (M-H, Fixed, 95% CI) 0.30 [0.09, 0.97]
1.9 Day 43 1 61 Risk Ratio (M-H, Fixed, 95% CI) 0.14 [0.01, 2.47]
2 Participants with asexual
parasites (treatment failure day
29)
1 Risk Ratio (M-H, Fixed, 95% CI) Subtotals only
2.1 Not PCR adjusted 1 74 Risk Ratio (M-H, Fixed, 95% CI) 1.55 [0.45, 5.33]
2.2 PCR adjusted 1 74 Risk Ratio (M-H, Fixed, 95% CI) 1.55 [0.45, 5.33]
47Primaquine for reducing Plasmodium falciparum transmission (Review)
Copyright © 2012 The Cochrane Collaboration. Published by John Wiley & Sons, Ltd.

Comparison 3. GIVEN WITH MQ, OR MQ+SP
Outcome or subgroup titleNo. of
studies
No. of
participants Statistical method Effect size
1 Participants infectious 1 Risk Ratio (M-H, Fixed, 95% CI) Subtotals only
1.1 Day 5 1 18 Risk Ratio (M-H, Fixed, 95% CI) 0.05 [0.00, 0.79]
1.2 Day 8 1 18 Risk Ratio (M-H, Fixed, 95% CI) 0.06 [0.00, 0.89]
1.3 Day 15 1 18 Risk Ratio (M-H, Fixed, 95% CI) 0.11 [0.01, 1.80]
1.4 Day 22 1 18 Risk Ratio (M-H, Fixed, 95% CI) 0.33 [0.02, 7.24]
2 Mosquitoes infected 1 Risk Ratio (M-H, Fixed, 95% CI) Subtotals only
2.1 Day 5 1 161 Risk Ratio (M-H, Fixed, 95% CI) 0.01 [5.49, 0.14]
2.2 Day 8 1 152 Risk Ratio (M-H, Fixed, 95% CI) 0.01 [9.17, 0.23]
2.3 Day 15 1 168 Risk Ratio (M-H, Fixed, 95% CI) 0.04 [0.00, 0.71]
2.4 Day 22 1 152 Risk Ratio (M-H, Fixed, 95% CI) 0.07 [0.00, 1.18]
3 Gametocyte clearance time
(days)
1 18 Mean Difference (IV, Fixed, 95% CI) -14.90 [-18.18, -11.
62]
4 Asexual parasite clearance time
(hrs)
1 18 Mean Difference (IV, Fixed, 95% CI) -4.0 [-30.07, 22.07]
Comparison 4. GIVEN WITH QN
Outcome or subgroup titleNo. of
studies
No. of
participants Statistical method Effect size
1 Participants with gametocytes 2 Risk Ratio (M-H, Random, 95% CI) Subtotals only
1.1 Day 8 1 126 Risk Ratio (M-H, Random, 95% CI) 1.17 [0.49, 2.78]
1.2 Day 15 1 43 Risk Ratio (M-H, Random, 95% CI) 0.30 [0.07, 1.28]
1.3 Day 22 1 43 Risk Ratio (M-H, Random, 95% CI) 0.0 [0.0, 0.0]
1.4 Day 29 1 43 Risk Ratio (M-H, Random, 95% CI) 0.0 [0.0, 0.0]
2 Asexual parasite clearance time
(hours)
1 126 Mean Difference (IV, Fixed, 95% CI) -1.44 [-9.76, 6.88]
Comparison 5. GIVEN WITH AS, OR WITH ACTs
Outcome or subgroup titleNo. of
studies
No. of
participants Statistical method Effect size
1 Participants with gametocytes
(microscopy)
4 Risk Ratio (M-H, Fixed, 95% CI) Subtotals only
1.1 Day 4 1 49 Risk Ratio (M-H, Fixed, 95% CI) 0.48 [0.10, 2.38]
1.2 Day 8 4 1006 Risk Ratio (M-H, Fixed, 95% CI) 0.15 [0.09, 0.24]
1.3 Day 15 3 923 Risk Ratio (M-H, Fixed, 95% CI) 0.10 [0.04, 0.22]
1.4 Day 22 2 776 Risk Ratio (M-H, Fixed, 95% CI) 0.06 [0.01, 0.24]
1.5 Day 29 3 873 Risk Ratio (M-H, Fixed, 95% CI) 0.15 [0.05, 0.51]
1.6 Day 36 2 766 Risk Ratio (M-H, Fixed, 95% CI) 0.21 [0.01, 4.32]
48Primaquine for reducing Plasmodium falciparum transmission (Review)
Copyright © 2012 The Cochrane Collaboration. Published by John Wiley & Sons, Ltd.

1.7 Day 43 3 847 Risk Ratio (M-H, Fixed, 95% CI) 0.41 [0.04, 3.85]
2 Participants with gametocytes
(PCR)
2 Risk Ratio (M-H, Random, 95% CI) Totals not selected
2.1 Day 8 2 Risk Ratio (M-H, Random, 95% CI) 0.0 [0.0, 0.0]
2.2 Day 15 2 Risk Ratio (M-H, Random, 95% CI) 0.0 [0.0, 0.0]
2.3 Day 29 1 Risk Ratio (M-H, Random, 95% CI) 0.0 [0.0, 0.0]
2.4 Day 43 1 Risk Ratio (M-H, Random, 95% CI) 0.0 [0.0, 0.0]
3 Log(10) AUC of gametocyte
density over time d1-43
1 106 Mean Difference (IV, Fixed, 95% CI) -0.88 [-1.32, -0.43]
4 Participants with asexual
parasites (PCR)
2 Risk Ratio (M-H, Fixed, 95% CI) Subtotals only
4.1 Day 8 1 94 Risk Ratio (M-H, Fixed, 95% CI) 1.28 [0.30, 5.40]
4.2 Day 15 2 198 Risk Ratio (M-H, Fixed, 95% CI) 0.97 [0.23, 4.15]
4.3 Day 29 1 106 Risk Ratio (M-H, Fixed, 95% CI) 0.75 [0.35, 1.63]
4.4 Day 43 1 106 Risk Ratio (M-H, Fixed, 95% CI) 1.13 [0.63, 2.03]
5 Asexual parasite clearance time 1 50 Mean Difference (IV, Fixed, 95% CI) -6.0 [-16.31, 4.31]
6 Haemoglobin concentration 1 Mean Difference (IV, Fixed, 95% CI) Subtotals only
6.1 Day 8 1 105 Mean Difference (IV, Fixed, 95% CI) -0.39 [1.00, 0.22]
6.2 Day 15 1 106 Mean Difference (IV, Fixed, 95% CI) -0.04 [-0.53, 0.44]
6.3 Day 29 1 105 Mean Difference (IV, Fixed, 95% CI) 0.26 [-0.25, 0.77]
6.4 Day 43 1 103 Mean Difference (IV, Fixed, 95% CI) -0.05 [-0.61, 0.52]
7 % change in haemoglobin
concentration
1 Mean Difference (IV, Fixed, 95% CI) Subtotals only
7.1 Day 8 1 101 Mean Difference (IV, Fixed, 95% CI) -0.06 [-0.11, -0.02]
7.2 Day 15 1 102 Mean Difference (IV, Fixed, 95% CI) -0.03 [-0.08, 0.02]
7.3 Day 29 1 101 Mean Difference (IV, Fixed, 95% CI) 0.00 [-0.06, 0.07]
7.4 Day 43 1 99 Mean Difference (IV, Fixed, 95% CI) -0.03 [-0.10, 0.04]
Comparison 6. ALL TREATMENTS COMBINED
Outcome or subgroup titleNo. of
studies
No. of
participants Statistical method Effect size
1 Participants with gametocytes at
day 8 (microscopy)
7 1322 Risk Ratio (M-H, Fixed, 95% CI) 0.36 [0.30, 0.43]
1.1 Non-artemisinin-based
partner drug
4 446 Risk Ratio (M-H, Fixed, 95% CI) 0.62 [0.51, 0.76]
1.2 Artemisinin-based partner
drug
4 876 Risk Ratio (M-H, Fixed, 95% CI) 0.12 [0.08, 0.20]
49Primaquine for reducing Plasmodium falciparum transmission (Review)
Copyright © 2012 The Cochrane Collaboration. Published by John Wiley & Sons, Ltd.

Analysis 1.1. Comparison 1 GIVEN WITH CQ, OR CQ+SP, Outcome 1 Participants with gametocytes.
Review: Primaquine for reducing Plasmodium falciparum transmission
Comparison: 1 GIVEN WITH CQ, OR CQ+SP
Outcome: 1 Participants with gametocytes
Study or subgroup With primaquine Without primaquine Risk Ratio Risk Ratio
n/N n/N M-H,Fixed,95% CI M-H,Fixed,95% CI
1 Day 4
Kolaczinski 2012 (1) 32/71 31/68 0.99 [ 0.69, 1.42 ]
Subtotal (95% CI) 71 68 0.99 [ 0.69, 1.42 ]
Total events: 32 (With primaquine), 31 (Without primaquine)
Heterogeneity: not applicable
Test for overall effect: Z = 0.06 (P = 0.95)
2 Day 8
Ledermann 2006 (2) 2/28 5/32 0.46 [ 0.10, 2.17 ]
Ledermann 2006 (3) 0/28 5/32 0.10 [ 0.01, 1.79 ]
Kamtekar 2004 (4) 7/24 16/22 0.40 [ 0.20, 0.79 ]
Kolaczinski 2012 (5) 27/70 52/67 0.50 [ 0.36, 0.69 ]
Subtotal (95% CI) 150 153 0.45 [ 0.34, 0.60 ]
Total events: 36 (With primaquine), 78 (Without primaquine)
Heterogeneity: Chi?? = 1.51, df = 3 (P = 0.68); I?? =0.0%
Test for overall effect: Z = 5.37 (P < 0.00001)
3 Day 12
Ledermann 2006 (6) 0/28 8/32 0.07 [ 0.00, 1.11 ]
Ledermann 2006 (7) 0/28 8/32 0.07 [ 0.00, 1.11 ]
Subtotal (95% CI) 56 64 0.07 [ 0.01, 0.49 ]
Total events: 0 (With primaquine), 16 (Without primaquine)
Heterogeneity: Chi?? = 0.0, df = 1 (P = 1.00); I?? =0.0%
Test for overall effect: Z = 2.67 (P = 0.0076)
4 Day 15
Ledermann 2006 (8) 0/28 2/32 0.23 [ 0.01, 4.55 ]
Ledermann 2006 (9) 0/28 2/32 0.23 [ 0.01, 4.55 ]
Kamtekar 2004 (10) 1/24 8/22 0.11 [ 0.02, 0.84 ]
Kolaczinski 2012 (11) 4/53 37/51 0.10 [ 0.04, 0.27 ]
Subtotal (95% CI) 133 137 0.12 [ 0.05, 0.26 ]
Total events: 5 (With primaquine), 49 (Without primaquine)
Heterogeneity: Chi?? = 0.44, df = 3 (P = 0.93); I?? =0.0%
Test for overall effect: Z = 5.30 (P < 0.00001)
5 Day 22
Ledermann 2006 0/28 2/32 0.23 [ 0.01, 4.55 ]
(11) PQ on day 3
(Continued . . . )
50Primaquine for reducing Plasmodium falciparum transmission (Review)
Copyright © 2012 The Cochrane Collaboration. Published by John Wiley & Sons, Ltd.

(. . . Continued)Study or subgroup With primaquine Without primaquine Risk Ratio Risk Ratio
n/N n/N M-H,Fixed,95% CI M-H,Fixed,95% CI
Kamtekar 2004 0/24 6/22 0.07 [ 0.00, 1.19 ]
Ledermann 2006 0/28 2/32 0.23 [ 0.01, 4.55 ]
Kolaczinski 2012 1/33 15/28 0.06 [ 0.01, 0.40 ]
Subtotal (95% CI) 113 114 0.09 [ 0.03, 0.31 ]
Total events: 1 (With primaquine), 25 (Without primaquine)
Heterogeneity: Chi?? = 0.99, df = 3 (P = 0.80); I?? =0.0%
Test for overall effect: Z = 3.81 (P = 0.00014)
6 Day 29
Ledermann 2006 0/28 0/32 0.0 [ 0.0, 0.0 ]
Ledermann 2006 0/28 0/32 0.0 [ 0.0, 0.0 ]
Kamtekar 2004 1/24 6/22 0.15 [ 0.02, 1.17 ]
Kolaczinski 2012 3/20 5/15 0.45 [ 0.13, 1.59 ]
Subtotal (95% CI) 100 101 0.29 [ 0.10, 0.86 ]
Total events: 4 (With primaquine), 11 (Without primaquine)
Heterogeneity: Chi?? = 0.83, df = 1 (P = 0.36); I?? =0.0%
Test for overall effect: Z = 2.24 (P = 0.025)
7 Day 36
Kolaczinski 2012 2/10 3/9 0.60 [ 0.13, 2.82 ]
Subtotal (95% CI) 10 9 0.60 [ 0.13, 2.82 ]
Total events: 2 (With primaquine), 3 (Without primaquine)
Heterogeneity: not applicable
Test for overall effect: Z = 0.65 (P = 0.52)
8 Day 43
Kolaczinski 2012 1/7 1/5 0.71 [ 0.06, 8.90 ]
Subtotal (95% CI) 7 5 0.71 [ 0.06, 8.90 ]
Total events: 1 (With primaquine), 1 (Without primaquine)
Heterogeneity: not applicable
Test for overall effect: Z = 0.26 (P = 0.79)
0.01 0.1 1 10 100
Favours primaquine Favours control
(1) PQ on day 3
(2) PQ on day 1
(3) PQ on day 3
(4) PQ on day 4
(5) PQ on day 3
(6) PQ on day 1
(7) PQ on day 3
(8) PQ on day 1
(9) PQ on day 3
(10) PQ on day 4
(11) PQ on day 3
51Primaquine for reducing Plasmodium falciparum transmission (Review)
Copyright © 2012 The Cochrane Collaboration. Published by John Wiley & Sons, Ltd.

Analysis 1.2. Comparison 1 GIVEN WITH CQ, OR CQ+SP, Outcome 2 Participants with asexual parasites
(treatment failure day 29).
Review: Primaquine for reducing Plasmodium falciparum transmission
Comparison: 1 GIVEN WITH CQ, OR CQ+SP
Outcome: 2 Participants with asexual parasites (treatment failure day 29)
Study or subgroup With primaquine Without primaquine Risk Ratio Weight Risk Ratio
n/N n/N M-H,Fixed,95% CI M-H,Fixed,95% CI
1 Not PCR adjusted
Kolaczinski 2012 49/67 55/68 100.0 % 0.90 [ 0.75, 1.09 ]
Subtotal (95% CI) 67 68 100.0 % 0.90 [ 0.75, 1.09 ]
Total events: 49 (With primaquine), 55 (Without primaquine)
Heterogeneity: not applicable
Test for overall effect: Z = 1.06 (P = 0.29)
2 PCR adjusted
Kolaczinski 2012 36/67 42/68 100.0 % 0.87 [ 0.65, 1.16 ]
Subtotal (95% CI) 67 68 100.0 % 0.87 [ 0.65, 1.16 ]
Total events: 36 (With primaquine), 42 (Without primaquine)
Heterogeneity: not applicable
Test for overall effect: Z = 0.94 (P = 0.35)
Test for subgroup differences: Chi?? = 0.05, df = 1 (P = 0.83), I?? =0.0%
0.01 0.1 1 10 100
Favours primaquine Favours control
52Primaquine for reducing Plasmodium falciparum transmission (Review)
Copyright © 2012 The Cochrane Collaboration. Published by John Wiley & Sons, Ltd.

Analysis 2.1. Comparison 2 GIVEN WITH SP, Outcome 1 Participants with gametocytes.
Review: Primaquine for reducing Plasmodium falciparum transmission
Comparison: 2 GIVEN WITH SP
Outcome: 1 Participants with gametocytes
Study or subgroup With primaquine Without primaquine Risk Ratio Weight Risk Ratio
n/N n/N M-H,Fixed,95% CI M-H,Fixed,95% CI
1 Day 2
Kolaczinski 2012 10/40 18/44 100.0 % 0.61 [ 0.32, 1.16 ]
Subtotal (95% CI) 40 44 100.0 % 0.61 [ 0.32, 1.16 ]
Total events: 10 (With primaquine), 18 (Without primaquine)
Heterogeneity: not applicable
Test for overall effect: Z = 1.50 (P = 0.13)
2 Day 3
Kolaczinski 2012 14/39 21/44 100.0 % 0.75 [ 0.45, 1.27 ]
Subtotal (95% CI) 39 44 100.0 % 0.75 [ 0.45, 1.27 ]
Total events: 14 (With primaquine), 21 (Without primaquine)
Heterogeneity: not applicable
Test for overall effect: Z = 1.07 (P = 0.28)
3 Day 4
Kolaczinski 2012 12/38 23/44 100.0 % 0.60 [ 0.35, 1.04 ]
Subtotal (95% CI) 38 44 100.0 % 0.60 [ 0.35, 1.04 ]
Total events: 12 (With primaquine), 23 (Without primaquine)
Heterogeneity: not applicable
Test for overall effect: Z = 1.81 (P = 0.071)
4 Day 8
Kolaczinski 2012 24/36 37/43 100.0 % 0.77 [ 0.60, 1.01 ]
Subtotal (95% CI) 36 43 100.0 % 0.77 [ 0.60, 1.01 ]
Total events: 24 (With primaquine), 37 (Without primaquine)
Heterogeneity: not applicable
Test for overall effect: Z = 1.92 (P = 0.055)
5 Day 15
Kolaczinski 2012 18/32 34/41 100.0 % 0.68 [ 0.48, 0.95 ]
Subtotal (95% CI) 32 41 100.0 % 0.68 [ 0.48, 0.95 ]
Total events: 18 (With primaquine), 34 (Without primaquine)
Heterogeneity: not applicable
Test for overall effect: Z = 2.27 (P = 0.023)
6 Day 22
Kolaczinski 2012 14/33 33/40 100.0 % 0.51 [ 0.34, 0.78 ]
Subtotal (95% CI) 33 40 100.0 % 0.51 [ 0.34, 0.78 ]
0.01 0.1 1 10 100
Favours experimental Favours control
(Continued . . . )
53Primaquine for reducing Plasmodium falciparum transmission (Review)
Copyright © 2012 The Cochrane Collaboration. Published by John Wiley & Sons, Ltd.

(. . . Continued)Study or subgroup With primaquine Without primaquine Risk Ratio Weight Risk Ratio
n/N n/N M-H,Fixed,95% CI M-H,Fixed,95% CI
Total events: 14 (With primaquine), 33 (Without primaquine)
Heterogeneity: not applicable
Test for overall effect: Z = 3.09 (P = 0.0020)
7 Day 29
Kolaczinski 2012 7/28 26/38 100.0 % 0.37 [ 0.19, 0.72 ]
Subtotal (95% CI) 28 38 100.0 % 0.37 [ 0.19, 0.72 ]
Total events: 7 (With primaquine), 26 (Without primaquine)
Heterogeneity: not applicable
Test for overall effect: Z = 2.92 (P = 0.0036)
8 Day 36
Kolaczinski 2012 3/28 12/34 100.0 % 0.30 [ 0.09, 0.97 ]
Subtotal (95% CI) 28 34 100.0 % 0.30 [ 0.09, 0.97 ]
Total events: 3 (With primaquine), 12 (Without primaquine)
Heterogeneity: not applicable
Test for overall effect: Z = 2.01 (P = 0.044)
9 Day 43
Kolaczinski 2012 0/27 4/34 100.0 % 0.14 [ 0.01, 2.47 ]
Subtotal (95% CI) 27 34 100.0 % 0.14 [ 0.01, 2.47 ]
Total events: 0 (With primaquine), 4 (Without primaquine)
Heterogeneity: not applicable
Test for overall effect: Z = 1.34 (P = 0.18)
0.01 0.1 1 10 100
Favours experimental Favours control
54Primaquine for reducing Plasmodium falciparum transmission (Review)
Copyright © 2012 The Cochrane Collaboration. Published by John Wiley & Sons, Ltd.

Analysis 2.2. Comparison 2 GIVEN WITH SP, Outcome 2 Participants with asexual parasites (treatment
failure day 29).
Review: Primaquine for reducing Plasmodium falciparum transmission
Comparison: 2 GIVEN WITH SP
Outcome: 2 Participants with asexual parasites (treatment failure day 29)
Study or subgroup With primaquine Without primaquine Risk Ratio Weight Risk Ratio
n/N n/N M-H,Fixed,95% CI M-H,Fixed,95% CI
1 Not PCR adjusted
Kolaczinski 2012 5/33 4/41 100.0 % 1.55 [ 0.45, 5.33 ]
Subtotal (95% CI) 33 41 100.0 % 1.55 [ 0.45, 5.33 ]
Total events: 5 (With primaquine), 4 (Without primaquine)
Heterogeneity: not applicable
Test for overall effect: Z = 0.70 (P = 0.48)
2 PCR adjusted
Kolaczinski 2012 5/33 4/41 100.0 % 1.55 [ 0.45, 5.33 ]
Subtotal (95% CI) 33 41 100.0 % 1.55 [ 0.45, 5.33 ]
Total events: 5 (With primaquine), 4 (Without primaquine)
Heterogeneity: not applicable
Test for overall effect: Z = 0.70 (P = 0.48)
0.01 0.1 1 10 100
Favours primaquine Favours control
55Primaquine for reducing Plasmodium falciparum transmission (Review)
Copyright © 2012 The Cochrane Collaboration. Published by John Wiley & Sons, Ltd.

Analysis 3.1. Comparison 3 GIVEN WITH MQ, OR MQ+SP, Outcome 1 Participants infectious.
Review: Primaquine for reducing Plasmodium falciparum transmission
Comparison: 3 GIVEN WITH MQ, OR MQ+SP
Outcome: 1 Participants infectious
Study or subgroup WIth primaquine Without primaquine Risk Ratio Weight Risk Ratio
n/N n/N M-H,Fixed,95% CI M-H,Fixed,95% CI
1 Day 5
Chen 1994 0/9 9/9 100.0 % 0.05 [ 0.00, 0.79 ]
Subtotal (95% CI) 9 9 100.0 % 0.05 [ 0.00, 0.79 ]
Total events: 0 (WIth primaquine), 9 (Without primaquine)
Heterogeneity: not applicable
Test for overall effect: Z = 2.13 (P = 0.033)
2 Day 8
Chen 1994 0/9 8/9 100.0 % 0.06 [ 0.00, 0.89 ]
Subtotal (95% CI) 9 9 100.0 % 0.06 [ 0.00, 0.89 ]
Total events: 0 (WIth primaquine), 8 (Without primaquine)
Heterogeneity: not applicable
Test for overall effect: Z = 2.05 (P = 0.041)
3 Day 15
Chen 1994 0/9 4/9 100.0 % 0.11 [ 0.01, 1.80 ]
Subtotal (95% CI) 9 9 100.0 % 0.11 [ 0.01, 1.80 ]
Total events: 0 (WIth primaquine), 4 (Without primaquine)
Heterogeneity: not applicable
Test for overall effect: Z = 1.55 (P = 0.12)
4 Day 22
Chen 1994 0/9 1/9 100.0 % 0.33 [ 0.02, 7.24 ]
Subtotal (95% CI) 9 9 100.0 % 0.33 [ 0.02, 7.24 ]
Total events: 0 (WIth primaquine), 1 (Without primaquine)
Heterogeneity: not applicable
Test for overall effect: Z = 0.70 (P = 0.48)
0.002 0.1 1 10 500
Favours primaquine Favours control
56Primaquine for reducing Plasmodium falciparum transmission (Review)
Copyright © 2012 The Cochrane Collaboration. Published by John Wiley & Sons, Ltd.

Analysis 3.2. Comparison 3 GIVEN WITH MQ, OR MQ+SP, Outcome 2 Mosquitoes infected.
Review: Primaquine for reducing Plasmodium falciparum transmission
Comparison: 3 GIVEN WITH MQ, OR MQ+SP
Outcome: 2 Mosquitoes infected
Study or subgroup WIth primaquine Without primaquine Risk Ratio Weight Risk Ratio
n/N n/N M-H,Fixed,95% CI M-H,Fixed,95% CI
1 Day 5
Chen 1994 0/88 47/73 100.0 % 0.01 [ 0.00, 0.14 ]
Subtotal (95% CI) 88 73 100.0 % 0.01 [ 0.00, 0.14 ]
Total events: 0 (WIth primaquine), 47 (Without primaquine)
Heterogeneity: not applicable
Test for overall effect: Z = 3.35 (P = 0.00080)
2 Day 8
Chen 1994 0/62 49/90 100.0 % 0.01 [ 0.00, 0.23 ]
Subtotal (95% CI) 62 90 100.0 % 0.01 [ 0.00, 0.23 ]
Total events: 0 (WIth primaquine), 49 (Without primaquine)
Heterogeneity: not applicable
Test for overall effect: Z = 2.99 (P = 0.0028)
3 Day 15
Chen 1994 0/81 12/87 100.0 % 0.04 [ 0.00, 0.71 ]
Subtotal (95% CI) 81 87 100.0 % 0.04 [ 0.00, 0.71 ]
Total events: 0 (WIth primaquine), 12 (Without primaquine)
Heterogeneity: not applicable
Test for overall effect: Z = 2.20 (P = 0.028)
4 Day 22
Chen 1994 0/88 5/64 100.0 % 0.07 [ 0.00, 1.18 ]
Subtotal (95% CI) 88 64 100.0 % 0.07 [ 0.00, 1.18 ]
Total events: 0 (WIth primaquine), 5 (Without primaquine)
Heterogeneity: not applicable
Test for overall effect: Z = 1.85 (P = 0.065)
0.001 0.01 0.1 1 10 100 1000
Favours primaquine Favours control
57Primaquine for reducing Plasmodium falciparum transmission (Review)
Copyright © 2012 The Cochrane Collaboration. Published by John Wiley & Sons, Ltd.

Analysis 3.3. Comparison 3 GIVEN WITH MQ, OR MQ+SP, Outcome 3 Gametocyte clearance time (days).
Review: Primaquine for reducing Plasmodium falciparum transmission
Comparison: 3 GIVEN WITH MQ, OR MQ+SP
Outcome: 3 Gametocyte clearance time (days)
Study or subgroup WIth primaquine Without primaquineMean
Difference WeightMean
Difference
N Mean(SD) N Mean(SD) IV,Fixed,95% CI IV,Fixed,95% CI
Singhasivanon 1994 7 7 (2.7) 11 21.9 (4.4) 100.0 % -14.90 [ -18.18, -11.62 ]
Total (95% CI) 7 11 100.0 % -14.90 [ -18.18, -11.62 ]
Heterogeneity: not applicable
Test for overall effect: Z = 8.90 (P < 0.00001)
Test for subgroup differences: Not applicable
-100 -50 0 50 100
Favours primaquine Favours control
Analysis 3.4. Comparison 3 GIVEN WITH MQ, OR MQ+SP, Outcome 4 Asexual parasite clearance time
(hrs).
Review: Primaquine for reducing Plasmodium falciparum transmission
Comparison: 3 GIVEN WITH MQ, OR MQ+SP
Outcome: 4 Asexual parasite clearance time (hrs)
Study or subgroup WIth primaquine Without primaquineMean
Difference WeightMean
Difference
N Mean(SD) N Mean(SD) IV,Fixed,95% CI IV,Fixed,95% CI
Singhasivanon 1994 7 93 (15) 11 97 (39.9) 100.0 % -4.00 [ -30.07, 22.07 ]
Total (95% CI) 7 11 100.0 % -4.00 [ -30.07, 22.07 ]
Heterogeneity: not applicable
Test for overall effect: Z = 0.30 (P = 0.76)
Test for subgroup differences: Not applicable
-100 -50 0 50 100
Favours primaquine Favours control
58Primaquine for reducing Plasmodium falciparum transmission (Review)
Copyright © 2012 The Cochrane Collaboration. Published by John Wiley & Sons, Ltd.

Analysis 4.1. Comparison 4 GIVEN WITH QN, Outcome 1 Participants with gametocytes.
Review: Primaquine for reducing Plasmodium falciparum transmission
Comparison: 4 GIVEN WITH QN
Outcome: 1 Participants with gametocytes
Study or subgroup With primaquine Without primaquine Risk Ratio Risk Ratio
n/N n/N
M-H,Random,95%
CI
M-H,Random,95%
CI
1 Day 8
Pukrittayakamee 2004 (1) 9/37 10/30 0.73 [ 0.34, 1.56 ]
Pukrittayakamee 2004 (2) 17/29 10/30 1.76 [ 0.97, 3.18 ]
Subtotal (95% CI) 66 60 1.17 [ 0.49, 2.78 ]
Total events: 26 (With primaquine), 20 (Without primaquine)
Heterogeneity: Tau?? = 0.27; Chi?? = 3.23, df = 1 (P = 0.07); I?? =69%
Test for overall effect: Z = 0.36 (P = 0.72)
2 Day 15
Kamtekar 2004 2/21 7/22 0.30 [ 0.07, 1.28 ]
Subtotal (95% CI) 21 22 0.30 [ 0.07, 1.28 ]
Total events: 2 (With primaquine), 7 (Without primaquine)
Heterogeneity: not applicable
Test for overall effect: Z = 1.63 (P = 0.10)
3 Day 22
Kamtekar 2004 0/21 0/22 0.0 [ 0.0, 0.0 ]
Subtotal (95% CI) 21 22 0.0 [ 0.0, 0.0 ]
Total events: 0 (With primaquine), 0 (Without primaquine)
Heterogeneity: not applicable
Test for overall effect: Z = 0.0 (P < 0.00001)
4 Day 29
Kamtekar 2004 0/21 0/22 0.0 [ 0.0, 0.0 ]
Subtotal (95% CI) 21 22 0.0 [ 0.0, 0.0 ]
Total events: 0 (With primaquine), 0 (Without primaquine)
Heterogeneity: not applicable
Test for overall effect: Z = 0.0 (P < 0.00001)
0.01 0.1 1 10 100
Favours primaquine Favours control
(1) PQ 0.5 mg/kg per day on days 1-7
(2) PQ 0.25 mg/kg per day on days 1-7
59Primaquine for reducing Plasmodium falciparum transmission (Review)
Copyright © 2012 The Cochrane Collaboration. Published by John Wiley & Sons, Ltd.

Analysis 4.2. Comparison 4 GIVEN WITH QN, Outcome 2 Asexual parasite clearance time (hours).
Review: Primaquine for reducing Plasmodium falciparum transmission
Comparison: 4 GIVEN WITH QN
Outcome: 2 Asexual parasite clearance time (hours)
Study or subgroup With primaquine Without primaquineMean
Difference WeightMean
Difference
N Mean(SD) N Mean(SD) IV,Fixed,95% CI IV,Fixed,95% CI
Pukrittayakamee 2004 (1) 29 78 (23) 30 80 (26) 44.2 % -2.00 [ -14.52, 10.52 ]
Pukrittayakamee 2004 (2) 37 79 (19) 30 80 (26) 55.8 % -1.00 [ -12.14, 10.14 ]
Total (95% CI) 66 60 100.0 % -1.44 [ -9.76, 6.88 ]
Heterogeneity: Chi?? = 0.01, df = 1 (P = 0.91); I?? =0.0%
Test for overall effect: Z = 0.34 (P = 0.73)
Test for subgroup differences: Not applicable
-100 -50 0 50 100
Favours primaquine Favours control
(1) PQ 0.50 mg/kg per day on days 1-7
(2) PQ 0.25 mg/kg per day on days 1-7
Analysis 5.1. Comparison 5 GIVEN WITH AS, OR WITH ACTs, Outcome 1 Participants with gametocytes
(microscopy).
Review: Primaquine for reducing Plasmodium falciparum transmission
Comparison: 5 GIVEN WITH AS, OR WITH ACTs
Outcome: 1 Participants with gametocytes (microscopy)
Study or subgroup WIth primaquine Without primaquine Risk Ratio Risk Ratio
n/N n/N M-H,Fixed,95% CI M-H,Fixed,95% CI
1 Day 4
Vasquez 2009 2/25 4/24 0.48 [ 0.10, 2.38 ]
Subtotal (95% CI) 25 24 0.48 [ 0.10, 2.38 ]
Total events: 2 (WIth primaquine), 4 (Without primaquine)
Heterogeneity: not applicable
Test for overall effect: Z = 0.90 (P = 0.37)
2 Day 8
Pukrittayakamee 2004 3/27 4/23 0.64 [ 0.16, 2.56 ]
Shekalaghe 2007 0/53 6/53 0.08 [ 0.00, 1.33 ]
(5) DHAP+PQ vs DHAP
(Continued . . . )
60Primaquine for reducing Plasmodium falciparum transmission (Review)
Copyright © 2012 The Cochrane Collaboration. Published by John Wiley & Sons, Ltd.

(. . . Continued)Study or subgroup WIth primaquine Without primaquine Risk Ratio Risk Ratio
n/N n/N M-H,Fixed,95% CI M-H,Fixed,95% CI
Smithuis 2010 (1) 3/71 24/84 0.15 [ 0.05, 0.47 ]
Smithuis 2010 (2) 1/78 28/84 0.04 [ 0.01, 0.28 ]
Smithuis 2010 (3) 3/84 17/83 0.17 [ 0.05, 0.57 ]
Smithuis 2010 (4) 3/77 18/80 0.17 [ 0.05, 0.56 ]
Smithuis 2010 (5) 3/83 24/77 0.12 [ 0.04, 0.37 ]
Vasquez 2009 2/25 2/24 0.96 [ 0.15, 6.28 ]
Subtotal (95% CI) 498 508 0.15 [ 0.09, 0.24 ]
Total events: 18 (WIth primaquine), 123 (Without primaquine)
Heterogeneity: Chi?? = 10.21, df = 7 (P = 0.18); I?? =31%
Test for overall effect: Z = 7.73 (P < 0.00001)
3 Day 15
Shekalaghe 2007 0/52 2/52 0.20 [ 0.01, 4.07 ]
Smithuis 2010 1/67 18/83 0.07 [ 0.01, 0.50 ]
Smithuis 2010 1/73 8/81 0.14 [ 0.02, 1.08 ]
Smithuis 2010 0/81 4/80 0.11 [ 0.01, 2.01 ]
Smithuis 2010 0/73 4/77 0.12 [ 0.01, 2.14 ]
Smithuis 2010 2/80 24/76 0.08 [ 0.02, 0.32 ]
Vasquez 2009 0/25 2/23 0.18 [ 0.01, 3.65 ]
Subtotal (95% CI) 451 472 0.10 [ 0.04, 0.22 ]
Total events: 4 (WIth primaquine), 62 (Without primaquine)
Heterogeneity: Chi?? = 0.73, df = 6 (P = 0.99); I?? =0.0%
Test for overall effect: Z = 5.51 (P < 0.00001)
4 Day 22
Smithuis 2010 0/58 15/74 0.04 [ 0.00, 0.67 ]
Smithuis 2010 1/69 5/79 0.23 [ 0.03, 1.91 ]
Smithuis 2010 0/84 0/79 0.0 [ 0.0, 0.0 ]
Smithuis 2010 0/70 0/72 0.0 [ 0.0, 0.0 ]
Smithuis 2010 0/78 15/66 0.03 [ 0.00, 0.45 ]
Vasquez 2009 0/25 0/22 0.0 [ 0.0, 0.0 ]
Subtotal (95% CI) 384 392 0.06 [ 0.01, 0.24 ]
Total events: 1 (WIth primaquine), 35 (Without primaquine)
Heterogeneity: Chi?? = 1.91, df = 2 (P = 0.38); I?? =0.0%
Test for overall effect: Z = 3.97 (P = 0.000073)
5 Day 29
Shekalaghe 2007 2/51 3/52 0.68 [ 0.12, 3.90 ]
Smithuis 2010 0/54 8/75 0.08 [ 0.00, 1.38 ]
Smithuis 2010 0/69 0/78 0.0 [ 0.0, 0.0 ]
(5) DHAP+PQ vs DHAP
(Continued . . . )
61Primaquine for reducing Plasmodium falciparum transmission (Review)
Copyright © 2012 The Cochrane Collaboration. Published by John Wiley & Sons, Ltd.

(. . . Continued)
Study or subgroup WIth primaquine Without primaquine Risk Ratio Risk Ratio
n/N n/N M-H,Fixed,95% CI M-H,Fixed,95% CI
Smithuis 2010 0/82 0/76 0.0 [ 0.0, 0.0 ]
Smithuis 2010 0/67 0/70 0.0 [ 0.0, 0.0 ]
Smithuis 2010 0/75 10/77 0.05 [ 0.00, 0.82 ]
Vasquez 2009 0/25 0/22 0.0 [ 0.0, 0.0 ]
Subtotal (95% CI) 423 450 0.15 [ 0.05, 0.51 ]
Total events: 2 (WIth primaquine), 21 (Without primaquine)
Heterogeneity: Chi?? = 3.64, df = 2 (P = 0.16); I?? =45%
Test for overall effect: Z = 3.05 (P = 0.0023)
6 Day 36
Smithuis 2010 0/55 0/76 0.0 [ 0.0, 0.0 ]
Smithuis 2010 0/70 0/74 0.0 [ 0.0, 0.0 ]
Smithuis 2010 0/80 0/79 0.0 [ 0.0, 0.0 ]
Smithuis 2010 0/69 0/70 0.0 [ 0.0, 0.0 ]
Smithuis 2010 0/71 2/75 0.21 [ 0.01, 4.32 ]
Vasquez 2009 0/25 0/22 0.0 [ 0.0, 0.0 ]
Subtotal (95% CI) 370 396 0.21 [ 0.01, 4.32 ]
Total events: 0 (WIth primaquine), 2 (Without primaquine)
Heterogeneity: Chi?? = 0.0, df = 0 (P = 1.00); I?? =0.0%
Test for overall effect: Z = 1.01 (P = 0.31)
7 Day 43
Shekalaghe 2007 0/50 0/52 0.0 [ 0.0, 0.0 ]
Smithuis 2010 0/50 1/74 0.49 [ 0.02, 11.80 ]
Smithuis 2010 0/62 0/75 0.0 [ 0.0, 0.0 ]
Smithuis 2010 0/79 0/76 0.0 [ 0.0, 0.0 ]
Smithuis 2010 0/69 1/71 0.34 [ 0.01, 8.27 ]
Smithuis 2010 0/71 0/71 0.0 [ 0.0, 0.0 ]
Vasquez 2009 0/25 0/22 0.0 [ 0.0, 0.0 ]
Subtotal (95% CI) 406 441 0.41 [ 0.04, 3.85 ]
Total events: 0 (WIth primaquine), 2 (Without primaquine)
Heterogeneity: Chi?? = 0.02, df = 1 (P = 0.88); I?? =0.0%
Test for overall effect: Z = 0.78 (P = 0.43)
0.01 0.1 1 10 100
Favours primaquine Favours control
(1) ASAQ + PQ vs ASAQ
(2) AL+PQ vs AL
(3) AS+MQ (fixed dose) + PQ vs AS+MQ (fixed dose)
(4) AS+MQ (loose) + PQ vs AS+MQ (loose)
(5) DHAP+PQ vs DHAP
62Primaquine for reducing Plasmodium falciparum transmission (Review)
Copyright © 2012 The Cochrane Collaboration. Published by John Wiley & Sons, Ltd.

Analysis 5.2. Comparison 5 GIVEN WITH AS, OR WITH ACTs, Outcome 2 Participants with gametocytes
(PCR).
Review: Primaquine for reducing Plasmodium falciparum transmission
Comparison: 5 GIVEN WITH AS, OR WITH ACTs
Outcome: 2 Participants with gametocytes (PCR)
Study or subgroup WIth primaquine Without primaquine Risk Ratio Risk Ratio
n/N n/N
M-H,Random,95%
CI
M-H,Random,95%
CI
1 Day 8
El-Sayed 2007 4/48 3/46 1.28 [ 0.30, 5.40 ]
Shekalaghe 2007 8/51 36/51 0.22 [ 0.11, 0.43 ]
2 Day 15
El-Sayed 2007 3/47 2/45 1.44 [ 0.25, 8.20 ]
Shekalaghe 2007 2/51 30/49 0.06 [ 0.02, 0.25 ]
3 Day 29
Shekalaghe 2007 4/46 17/44 0.23 [ 0.08, 0.62 ]
4 Day 43
Shekalaghe 2007 5/40 11/39 0.44 [ 0.17, 1.16 ]
0.02 0.1 1 10 50
Favours primaquine Favours control
63Primaquine for reducing Plasmodium falciparum transmission (Review)
Copyright © 2012 The Cochrane Collaboration. Published by John Wiley & Sons, Ltd.

Analysis 5.3. Comparison 5 GIVEN WITH AS, OR WITH ACTs, Outcome 3 Log(10) AUC of gametocyte
density over time d1-43.
Review: Primaquine for reducing Plasmodium falciparum transmission
Comparison: 5 GIVEN WITH AS, OR WITH ACTs
Outcome: 3 Log(10) AUC of gametocyte density over time d1-43
Study or subgroup WIth primaquine Without primaquineMean
Difference WeightMean
Difference
N Mean(SD) N Mean(SD) IV,Fixed,95% CI IV,Fixed,95% CI
Shekalaghe 2007 53 3.1692 (1.0309) 53 4.05 (1.2923) 100.0 % -0.88 [ -1.32, -0.43 ]
Total (95% CI) 53 53 100.0 % -0.88 [ -1.32, -0.43 ]
Heterogeneity: not applicable
Test for overall effect: Z = 3.86 (P = 0.00011)
Test for subgroup differences: Not applicable
-10 -5 0 5 10
Favours primaquine Favours control
Analysis 5.4. Comparison 5 GIVEN WITH AS, OR WITH ACTs, Outcome 4 Participants with asexual
parasites (PCR).
Review: Primaquine for reducing Plasmodium falciparum transmission
Comparison: 5 GIVEN WITH AS, OR WITH ACTs
Outcome: 4 Participants with asexual parasites (PCR)
Study or subgroup WIth primaquine Without primaquine Risk Ratio Weight Risk Ratio
n/N n/N M-H,Fixed,95% CI M-H,Fixed,95% CI
1 Day 8
El-Sayed 2007 4/48 3/46 100.0 % 1.28 [ 0.30, 5.40 ]
Subtotal (95% CI) 48 46 100.0 % 1.28 [ 0.30, 5.40 ]
Total events: 4 (WIth primaquine), 3 (Without primaquine)
Heterogeneity: not applicable
Test for overall effect: Z = 0.33 (P = 0.74)
2 Day 15
Shekalaghe 2007 0/53 1/53 42.3 % 0.33 [ 0.01, 8.00 ]
El-Sayed 2007 3/47 2/45 57.7 % 1.44 [ 0.25, 8.20 ]
0.001 0.01 0.1 1 10 100 1000
Favours primaquine Favours control
(Continued . . . )
64Primaquine for reducing Plasmodium falciparum transmission (Review)
Copyright © 2012 The Cochrane Collaboration. Published by John Wiley & Sons, Ltd.

(. . . Continued)Study or subgroup WIth primaquine Without primaquine Risk Ratio Weight Risk Ratio
n/N n/N M-H,Fixed,95% CI M-H,Fixed,95% CI
Subtotal (95% CI) 100 98 100.0 % 0.97 [ 0.23, 4.15 ]
Total events: 3 (WIth primaquine), 3 (Without primaquine)
Heterogeneity: Chi?? = 0.63, df = 1 (P = 0.43); I?? =0.0%
Test for overall effect: Z = 0.04 (P = 0.97)
3 Day 29
Shekalaghe 2007 9/53 12/53 100.0 % 0.75 [ 0.35, 1.63 ]
Subtotal (95% CI) 53 53 100.0 % 0.75 [ 0.35, 1.63 ]
Total events: 9 (WIth primaquine), 12 (Without primaquine)
Heterogeneity: not applicable
Test for overall effect: Z = 0.73 (P = 0.47)
4 Day 43
Shekalaghe 2007 17/53 15/53 100.0 % 1.13 [ 0.63, 2.03 ]
Subtotal (95% CI) 53 53 100.0 % 1.13 [ 0.63, 2.03 ]
Total events: 17 (WIth primaquine), 15 (Without primaquine)
Heterogeneity: not applicable
Test for overall effect: Z = 0.42 (P = 0.67)
0.001 0.01 0.1 1 10 100 1000
Favours primaquine Favours control
Analysis 5.5. Comparison 5 GIVEN WITH AS, OR WITH ACTs, Outcome 5 Asexual parasite clearance
time.
Review: Primaquine for reducing Plasmodium falciparum transmission
Comparison: 5 GIVEN WITH AS, OR WITH ACTs
Outcome: 5 Asexual parasite clearance time
Study or subgroup WIth primaquine Without primaquineMean
Difference WeightMean
Difference
N Mean(SD) N Mean(SD) IV,Fixed,95% CI IV,Fixed,95% CI
Pukrittayakamee 2004 27 63 (18) 23 69 (19) 100.0 % -6.00 [ -16.31, 4.31 ]
Total (95% CI) 27 23 100.0 % -6.00 [ -16.31, 4.31 ]
Heterogeneity: not applicable
Test for overall effect: Z = 1.14 (P = 0.25)
Test for subgroup differences: Not applicable
-100 -50 0 50 100
Favours primaquine Favours control
65Primaquine for reducing Plasmodium falciparum transmission (Review)
Copyright © 2012 The Cochrane Collaboration. Published by John Wiley & Sons, Ltd.

Analysis 5.6. Comparison 5 GIVEN WITH AS, OR WITH ACTs, Outcome 6 Haemoglobin concentration.
Review: Primaquine for reducing Plasmodium falciparum transmission
Comparison: 5 GIVEN WITH AS, OR WITH ACTs
Outcome: 6 Haemoglobin concentration
Study or subgroup WIth primaquine Without primaquineMean
Difference WeightMean
Difference
N Mean(SD) N Mean(SD) IV,Fixed,95% CI IV,Fixed,95% CI
1 Day 8
Shekalaghe 2007 10.0965 (1.643201) 52 53 10.48 (1.544036) 100.0 % -0.39 [ -1.00, 0.22 ]
Subtotal (95% CI) 52 53 100.0 % -0.39 [ -1.00, 0.22 ]
Heterogeneity: not applicable
Test for overall effect: Z = 1.24 (P = 0.22)
2 Day 15
Shekalaghe 2007 53 10.686 (1.16135) 53 10.73 (1.379669) 100.0 % -0.04 [ -0.53, 0.44 ]
Subtotal (95% CI) 53 53 100.0 % -0.04 [ -0.53, 0.44 ]
Heterogeneity: not applicable
Test for overall effect: Z = 0.18 (P = 0.86)
3 Day 29
Shekalaghe 2007 53 11.448 (1.30371) 52 11.19 (1.3591) 100.0 % 0.26 [ -0.25, 0.77 ]
Subtotal (95% CI) 53 52 100.0 % 0.26 [ -0.25, 0.77 ]
Heterogeneity: not applicable
Test for overall effect: Z = 0.99 (P = 0.32)
4 Day 43
Shekalaghe 2007 11.79718 (1.625543) 51 52 11.85 (1.273753) 100.0 % -0.05 [ -0.61, 0.52 ]
Subtotal (95% CI) 51 52 100.0 % -0.05 [ -0.61, 0.52 ]
Heterogeneity: not applicable
Test for overall effect: Z = 0.17 (P = 0.87)
-10 -5 0 5 10
Favours primaquine Favours control
66Primaquine for reducing Plasmodium falciparum transmission (Review)
Copyright © 2012 The Cochrane Collaboration. Published by John Wiley & Sons, Ltd.

Analysis 5.7. Comparison 5 GIVEN WITH AS, OR WITH ACTs, Outcome 7 % change in haemoglobin
concentration.
Review: Primaquine for reducing Plasmodium falciparum transmission
Comparison: 5 GIVEN WITH AS, OR WITH ACTs
Outcome: 7 % change in haemoglobin concentration
Study or subgroup WIth primaquine Without primaquineMean
Difference WeightMean
Difference
N Mean(SD) N Mean(SD) IV,Fixed,95% CI IV,Fixed,95% CI
1 Day 8
Shekalaghe 2007 -0.0513034 (0.1411953) 51 50 0.01 (0.0922952) 100.0 % -0.06 [ -0.11, -0.02 ]
Subtotal (95% CI) 51 50 100.0 % -0.06 [ -0.11, -0.02 ]
Heterogeneity: not applicable
Test for overall effect: Z = 2.74 (P = 0.0061)
2 Day 15
Shekalaghe 2007 0.0148362 (0.134191) 52 50 0.04 (0.1272108) 100.0 % -0.03 [ -0.08, 0.02 ]
Subtotal (95% CI) 52 50 100.0 % -0.03 [ -0.08, 0.02 ]
Heterogeneity: not applicable
Test for overall effect: Z = 1.06 (P = 0.29)
3 Day 29
Shekalaghe 2007 0.0930569 (0.1671262) 52 49 0.09 (0.1698335) 100.0 % 0.00 [ -0.06, 0.07 ]
Subtotal (95% CI) 52 49 100.0 % 0.00 [ -0.06, 0.07 ]
Heterogeneity: not applicable
Test for overall effect: Z = 0.09 (P = 0.93)
4 Day 43
Shekalaghe 2007 0.1164377 (0.1546697) 50 49 0.15 (0.1973936) 100.0 % -0.03 [ -0.10, 0.04 ]
Subtotal (95% CI) 50 49 100.0 % -0.03 [ -0.10, 0.04 ]
Heterogeneity: not applicable
Test for overall effect: Z = 0.92 (P = 0.36)
-1 -0.5 0 0.5 1
Favours control Favours primaquine
67Primaquine for reducing Plasmodium falciparum transmission (Review)
Copyright © 2012 The Cochrane Collaboration. Published by John Wiley & Sons, Ltd.

Analysis 6.1. Comparison 6 ALL TREATMENTS COMBINED, Outcome 1 Participants with gametocytes at
day 8 (microscopy).
Review: Primaquine for reducing Plasmodium falciparum transmission
Comparison: 6 ALL TREATMENTS COMBINED
Outcome: 1 Participants with gametocytes at day 8 (microscopy)
Study or subgroup with PQ without PQ Risk Ratio Weight Risk Ratio
n/N n/N M-H,Fixed,95% CI M-H,Fixed,95% CI
1 Non-artemisinin-based partner drug
Kolaczinski 2012 (1) 27/70 52/67 20.4 % 0.50 [ 0.36, 0.69 ]
Kolaczinski 2012 (2) 24/36 37/43 12.9 % 0.77 [ 0.60, 1.01 ]
Ledermann 2006 (3) 2/56 5/32 2.4 % 0.23 [ 0.05, 1.11 ]
Kamtekar 2004 (4) 7/24 16/22 6.4 % 0.40 [ 0.20, 0.79 ]
Pukrittayakamee 2004 (5) 26/66 10/30 5.3 % 1.18 [ 0.66, 2.13 ]
Subtotal (95% CI) 252 194 47.5 % 0.62 [ 0.51, 0.76 ]
Total events: 86 (with PQ), 120 (without PQ)
Heterogeneity: Chi?? = 12.34, df = 4 (P = 0.02); I?? =68%
Test for overall effect: Z = 4.80 (P < 0.00001)
2 Artemisinin-based partner drug
Pukrittayakamee 2004 (6) 3/27 4/23 1.7 % 0.64 [ 0.16, 2.56 ]
Smithuis 2010 (7) 3/68 24/60 9.8 % 0.11 [ 0.03, 0.35 ]
Smithuis 2010 (8) 1/71 28/56 12.0 % 0.03 [ 0.00, 0.20 ]
Smithuis 2010 (9) 3/81 17/66 7.2 % 0.14 [ 0.04, 0.47 ]
Smithuis 2010 (10) 3/74 18/62 7.5 % 0.14 [ 0.04, 0.45 ]
Smithuis 2010 (11) 3/80 24/53 11.1 % 0.08 [ 0.03, 0.26 ]
Shekalaghe 2007 (12) 0/53 6/53 2.5 % 0.08 [ 0.00, 1.33 ]
Vasquez 2009 (13) 2/25 2/24 0.8 % 0.96 [ 0.15, 6.28 ]
Subtotal (95% CI) 479 397 52.5 % 0.12 [ 0.08, 0.20 ]
Total events: 18 (with PQ), 123 (without PQ)
Heterogeneity: Chi?? = 12.90, df = 7 (P = 0.07); I?? =46%
Test for overall effect: Z = 8.81 (P < 0.00001)
Total (95% CI) 731 591 100.0 % 0.36 [ 0.30, 0.43 ]
Total events: 104 (with PQ), 243 (without PQ)
Heterogeneity: Chi?? = 77.83, df = 12 (P<0.00001); I?? =85%
Test for overall effect: Z = 10.70 (P < 0.00001)
Test for subgroup differences: Chi?? = 39.71, df = 1 (P = 0.00), I?? =97%
0.01 0.1 1 10 100
Favours primaaquine Favours control
(13) Partner drug AS+MQ; PQ on day 3
(Continued . . . )
68Primaquine for reducing Plasmodium falciparum transmission (Review)
Copyright © 2012 The Cochrane Collaboration. Published by John Wiley & Sons, Ltd.

(. . . Continued)Study or subgroup with PQ without PQ Risk Ratio Weight Risk Ratio
n/N n/N M-H,Fixed,95% CI M-H,Fixed,95% CI
(1) Partner drug CQ: PQ on day 3
(2) Partner drug SP: PQ on day 1
(3) Partner drug CQ+SP; PQ on day 1 or 3
(4) Partner drug CQ or (CQ+SP); PQ on day 4
(5) Partner drug QN; PQ on days 1-7
(6) Partner drug AS: PQ on days 1-7
(7) Partner drug AS+AQ; PQ on day 1
(8) Partner drug AL; PQ on day 1
(9) Partner drug AS+MQ (fixed); PQ on day 1
(10) Partner drug AS+MQ (loose); PQ on day 1
(11) Partner drug DHAP; PQ on day 1
(12) Partner drug AS+SP; PQ on day 4
(13) Partner drug AS+MQ; PQ on day 3
A D D I T I O N A L T A B L E S
Table 1. G6PD status, partner drugs, and PQ dose and treatment schedule
Compara-
tor
Trial Compari-
son
Place G6PD sta-
tus
Parasite
species
Partner
drug
PQ day(s)
*
PQ dose
per day
Non-
artemisinin
(CQ or
CQ+SP)
Kamtekar
2004
a India
(Mumbai)
Not
screened
Pf only CQ days 1-3
or
CQ days 1-3
+ SP day 1
day 4 45 mg (~0.
75 mg/kg)
Khoo 1981 Malaysia
(Sabah)
Only
deficient
(method:
Brewer’s
methaemoglobin
reduction
test)
Pf, Pv or
mixed
CQ days 1-3 days 1-3 25 mg (~0.
42 mg/kg)
Kolaczinski
2012
a Pakistan Not
reported
Pf only CQ days 1-3 day 3 0.5 mg/kg
Ledermann
2006
a Indone-
sia (Central
Java)
Only non-
deficient
(method:
semiquanti-
ta-
tive glucose-
6-phos-
Pf only CQ days 1-3
+ SP day 1
day 1 45 mg (~0.
75 mg/kg)
69Primaquine for reducing Plasmodium falciparum transmission (Review)
Copyright © 2012 The Cochrane Collaboration. Published by John Wiley & Sons, Ltd.

Table 1. G6PD status, partner drugs, and PQ dose and treatment schedule (Continued)
phate dehy-
drogenase
(G6PD) as-
say)
Ledermann
2006
b Indone-
sia (Central
Java)
Only non-
deficient
(method:
semiquanti-
ta-
tive glucose-
6-phos-
phate dehy-
drogenase
(G6PD) as-
say)
Pf only CQ days 1-3
+ SP day 1
day 3 45 mg
(~0.75 mg/
kg)
Non-
artemisinin
(SP)
Kolaczinski
2012
b Pakistan Not
reported
Pf only SP day 1 day 1 0.5 mg/kg
Non-
artemisinin
(MQ or
MQ+SP)
Chen 1994 China
(Hainan
province)
Not
reported
Pf only MQ day 1 day 1 45 mg (~0.
75 mg/kg)
Singhasi-
vanon
1994
Thailand
(Bangkok)
Not
reported
Pf only MQ+SP
fixed day 1
day 1 0.75 mg/kg
Non-
artemisinin
(QN)
Kamtekar
2004
b India
(Mumbai)
Not
screened
Pf only QN iv days
1-
2 and orally
days 1-7
day 8 45 mg (~0.
75 mg/kg)
Pukrit-
tayakamee
2004
a Thailand Patients
with G6PD
deficiency
were ex-
cluded from
getting PQ
(method not
reported)
Pf only QN days 1-
7
days 1-7 0.25 mg
base/kg
Pukrit-
tayakamee
2004
b Thailand Patients
with G6PD
deficiency
were ex-
cluded from
getting PQ
Pf only QN days 1-
7
days 1-7 0.5 mg base/
kg
70Primaquine for reducing Plasmodium falciparum transmission (Review)
Copyright © 2012 The Cochrane Collaboration. Published by John Wiley & Sons, Ltd.

Table 1. G6PD status, partner drugs, and PQ dose and treatment schedule (Continued)
(method not
reported)
Artemisinin-
based
AS or ACT
El-Sayed
2007
Sudan
(east)
Not
reported
Pf only AS+SP days
1-3
day 4 0.75 mg/kg
Pukrit-
tayakamee
2004
c Thailand Patients
with G6PD
deficiency
were ex-
cluded from
getting PQ
(method not
reported)
Pf only AS days 1-7 days 1-7 0.5 mg base/
kg
Shekalaghe
2007
Tanzania
(North east)
Screened
and all in-
cluded
(method:
detection
of single
nucleotide
polymor-
phisms in
the human
G6PD gene
(G202A,
A376G)
by a sim-
ple high
throughput
PCR using
sequence
specific
oligonu-
cleotide
probes
(SSOPs)
and ELISA
testing)
Pf only AS+SP days
1-3
day 4 0.75 mg/kg
Smithuis
2010
a Myanmar (3
states)
Not
screened
Pf or mixed AS+AQ days
1-3
day 1 0.75 mg/kg
Smithuis
2010
b Myanmar (3
states)
Not
screened
Pf or mixed AL days 1-3 day 1 0.75 mg/kg
71Primaquine for reducing Plasmodium falciparum transmission (Review)
Copyright © 2012 The Cochrane Collaboration. Published by John Wiley & Sons, Ltd.

Table 1. G6PD status, partner drugs, and PQ dose and treatment schedule (Continued)
Smithuis
2010
c Myanmar (3
states)
Not
screened
Pf or mixed AS+MQ
fixed dose
days 1-3
day 1 0.75 mg/kg
Smithuis
2010
d Myanmar (3
states)
Not
screened
Pf or mixed AS days 1-3
+ MQ day 1
loose
day 1 0.75 mg/kg
Smithuis
2010
e Myanmar (3
states)
Not
screened
Pf or mixed DHAP days
1-3
day 1 0.75 mg/kg
Vasquez
2009
Colombia
(Antioquia)
Not
reported
Pf only AS+MQ
days 1-
3 (MQ only
on day 2 for
children < 6)
day 3 45 mg (~0.
75 mg/kg)
* first day of any treatment = day 1
Pf = P. falciparum; Pv = P. vivax
Table 2. AUC of gametocyte density over time, days 1 to 29 after treatment
Partner
drug
type
Trial Partner
drug
AUC
with PQ
days
1-29
AUC
without
PQ
days
1-29
% reduc-
tion
AUC
days
1-29
log(10)
AUC
with PQ
days
1-29
log(10)
AUC
without PQ
days
1-29
% reduction
log(10)
AUC
days
1-29
Non-
artemisinin-
based
Kolaczin-
ski
2012
CQ 732.98 8777.24 91.7 2.87 3.94 27.3
Kolaczin-
ski
2012
SP 2111.55 12847.37 83.6 3.32 4.11 19.1
Artemisinin-
based
Shekalaghe
2007
AS+SP 40.30 87.69 54.0 1.61 1.94 17.4
Smithuis
2010
AS+AQ 141.08 649.46 78.3 2.15 2.81 23.6
Smithuis
2010
AL 197.57 318.23 37.9 2.3 2.5 8.3
Smithuis
2010
AS+MQ
fixed
240.79 535.40 55.0 2.38 2.73 12.7
72Primaquine for reducing Plasmodium falciparum transmission (Review)
Copyright © 2012 The Cochrane Collaboration. Published by John Wiley & Sons, Ltd.

Table 2. AUC of gametocyte density over time, days 1 to 29 after treatment (Continued)
Smithuis
2010
AS+MQ
loose
183.51 321.96 43.0 2.26 2.51 9.7
Smithuis
2010
DHAP 307.14 952.93 67.8 2.49 2.98 16.5
Vasquez
2009
AS+MQ 526.40 349.04 -50.8 2.72 2.54 -7.0
Table 3. AUC of gametocyte density over time, days 1 to 43 after treatment
Partner
drug
type
Trial Partner
drug
AUC
with PQ
days
1-43
AUC
without
PQ
days
1-43
% reduc-
tion
AUC
days
1-43
log(10)
AUC
with PQ
days
1-43
log(10)
AUC
without PQ
days
1-43
% reduction
log(10)
AUC
days
1-43
Non-
artemisinin-
based
Kolaczin-
ski
2012
CQ 71.02 279.13 74.6 1.85 2.45 24.3
Kolaczin-
ski
2012
SP 85.47 445.65 80.8 1.93 2.65 27.1
Artemisinin-
based
Shekalaghe
2007
AS+SP 1.16 3.22 64.1 0.06 0.51 87.5
Smithuis
2010
AS+AQ 3.36 19.29 82.6 0.53 1.29 59.1
Smithuis
2010
AL 4.70 8.12 42.1 0.67 0.91 26.1
Smithuis
2010
AS+MQ
fixed
5.73 12.75 55.0 0.76 1.11 31.4
Smithuis
2010
AS+MQ
loose
4.37 7.74 43.5 0.64 0.89 27.9
Smithuis
2010
DHAP 7.38 25.49 71.1 0.87 1.41 38.3
Vasquez
2009
AS+MQ 12.53 8.87 -41.3 1.10 0.95 -15.8
73Primaquine for reducing Plasmodium falciparum transmission (Review)
Copyright © 2012 The Cochrane Collaboration. Published by John Wiley & Sons, Ltd.

A P P E N D I C E S
Appendix 1. Search strategy
Search set CIDG SRa CENTRAL MEDLINEb EMBASEb LILACSb
1 malaria MALARIA,
FALCIPARUM/
DRUG THERAPY
MALARIA,
FALCIPARUM/
DRUG THERAPY
MALARIA
FALCIPARUM/
DRUG THERAPY
Malaria AND
falciparum
2 Primaquine Malaria AND
falciparum ti, ab
Malaria AND
falciparum ti, ab
Malaria AND
falciparum ti, ab
Primaquine*
3 1 and 2 1 or 2 1 or 2 1 or 2 1 and 2
4 - PRIMAQUINE/
ADMINISTRATION
AND DOSAGE/
THERAPEUTIC USE
PRIMAQUINE/
ADMINISTRATION
AND DOSAGE/
THERAPEUTIC USE
PRIMAQUINE -
5 - Primaquine ti, ab Primaquine ti, ab Primaquine ti, ab -
6 - 4 and 5 4 and 5 4 and 5 -
7 - 3 and 6 3 and 6 3 and 6 -
8 - - Limit 7 to Humans Limit 7 to Human -
aCochrane Infectious Diseases Group Specialized Register.bSearch terms used in combination with the search strategy for retrieving trials developed by The Cochrane Collaboration (Lefebvre
2011); upper case: MeSH or EMTREE heading; lower case: free text term.
H I S T O R Y
Protocol first published: Issue 4, 2009
Review first published: Issue 9, 2012
C O N T R I B U T I O N S O F A U T H O R S
Two authors (PMG and HG) independently screened all abstracts, applied inclusion criteria, and abstracted data. PG helped structure
the review, and contributed to the logic framework of the SOF tables. All authors contributed to the writing of the review, the
interpretation of the results, and the conclusions drawn.
74Primaquine for reducing Plasmodium falciparum transmission (Review)
Copyright © 2012 The Cochrane Collaboration. Published by John Wiley & Sons, Ltd.

D E C L A R A T I O N S O F I N T E R E S T
We certify that we have no affiliations with or involvement in any organization or entity with a direct financial interest in the subject
matter of the review (eg employment, consultancy, stock ownership, honoraria, expert testimony).
This review and the salary of PG is supported by a DFID grant aimed at ensuring the best possible systematic reviews, particularly
Cochrane Reviews, are completed on topics relevant to the poor in low- and middle-income countries. DFID does not participate in
the selection of topics, in the conduct of the review, or in the interpretation of findings.
S O U R C E S O F S U P P O R T
Internal sources
• No sources of support supplied
External sources
• Department for International Development, UK.
D I F F E R E N C E S B E T W E E N P R O T O C O L A N D R E V I E W
1) After reading the trials, several new outcomes were added and some outcomes were modified; two outcomes were deleted.
Changes to Primary outcomes:
• Proportion of participants with gametocytes (ADDED: by microscopy and PCR).
• ADDED: Proportion of participants infectious.
• ADDED: Gametocyte density (by microscopy and PCR).
• ADDED: Gametocyte clearance time (also called duration of gametocyte carriage).
The primary outcomes were ordered to capture the three categories: transmission intensity, infectiousness, and potential infectiousness.
Changes to Secondary outcomes:
• DELETED: AUC of asexual parasite density over time. No relevant data were identified.
• ADDED: Asexual clearance time.
Changes to Adverse events:
• DELETED: All adverse events (data reported was minimal and not in a form that was easily summarised. The main question is
whether there are serious adverse events).
• Haemolysis or drop in haemoglobin or PCV (as assessed/defined in each trial). (MODIFIED BY deleting reference to G6PD
since these outcomes occur in non-G6PD people too. MODIFIED by adding PCV since this was used in some trials as measure of
anaemia).
2) We deleted the objective: “To compare the effects of different doses and schedules of PQ given to reduce infectiousness” and the
definition of ’control’ in comparisons was modified accordingly. Only controls without PQ were included. Comparison of different
doses of PQ with identical partner drug was deleted since it does not answer the important question of whether adding PQ is effective.
75Primaquine for reducing Plasmodium falciparum transmission (Review)
Copyright © 2012 The Cochrane Collaboration. Published by John Wiley & Sons, Ltd.

One trial with two arms using different doses of PQ with same partner drug was included as two separate arms within the same
comparison.
3) We planned to use the following comparisons described in the protocol:
• CQ (with and without PQ, or with different doses of PQ)
• SP (with and without PQ, or with different doses of PQ)
• CQ plus sulfadoxine + pyrimethamine (with and without PQ, or with different doses of PQ)
• Artemisinin derivatives (with and without PQ, or with different doses of PQ)
• Other drugs (with and without PQ, or with different doses of PQ)
In the review, the groups changed, some were added, and some were combined for the following reasons:
a) some trials combined two types of partner drug, not distinguishing the patients who received each one (eg CQ or CQ plus SP).
b) there were many different artemisinin derivatives and combinations tested, with few trials of each, so these were grouped within the
same comparison. Combinations of an artemisinin derivative with SP were also grouped here.
3) There were no cluster-RCTs so we deleted how we would manage them from the methods. If we include any cluster-randomized trials
in future editions, we will check that trials have correctly adjusted for clustering and, if not, attempt to make this adjustment. When
the analyses have not adjusted for clustering, we will make attempts to adjust the results for clustering by multiplying the standard
errors of the estimates by the square root of the design effect, where the design effect is calculated as DEff=1+(m-1)*ICC. This assumes
that the necessary information is reported, ie the average cluster size (m) and the intra-cluster correlation coefficient (ICC).
4) We intended a sensitivity analysis to investigate the robustness of the results to the quality (risk of bias) components, but were unable
to do so as there were insufficient trials. If appropriate and necessary, we will conduct sensitivity analysis on cluster-randomized trials
using a range of estimates for the ICC to see if clustering could influence the individual trial’s result.
76Primaquine for reducing Plasmodium falciparum transmission (Review)
Copyright © 2012 The Cochrane Collaboration. Published by John Wiley & Sons, Ltd.