cd-moa: change detection framework for massive online analysis · cd-moa: change detection...
TRANSCRIPT

CD-MOA: Change Detection Framework
for Massive Online Analysis
Albert Bifet1, Jesse Read2, Bernhard Pfahringer3,Geoff Holmes3, and Indre Zliobaite4
1 Yahoo! Research Barcelona, [email protected]
2 Universidad Carlos III, [email protected]
3 University of Waikato, New Zealand{bernhard,geoff}@waikato.ac.nz
4 Aalto University and HIIT, [email protected]
Abstract. Analysis of data from networked digital information systemssuch as mobile devices, remote sensors, and streaming applications, needsto deal with two challenges: the size of data and the capacity to beadaptive to changes in concept in real-time. Many approaches meet thechallenge by using an explicit change detector alongside a classificationalgorithm and then evaluate performance using classification accuracy.However, there is an unexpected connection between change detectorsand classification methods that needs to be acknowledged. The phe-nomenon has been observed previously, connecting high classificationperformance with high false positive rates. The implication is that weneed to be careful to evaluate systems against intended outcomes–highclassification rates, low false alarm rates, compromises between the twoand so forth. This paper proposes a new experimental framework forevaluating change detection methods against intended outcomes. Theframework is general in the sense that it can be used with other datamining tasks such as frequent item and pattern mining, clustering etc.Included in the framework is a new measure of performance of a changedetector that monitors the compromise between fast detection and falsealarms. Using this new experimental framework we conduct an evalu-ation study on synthetic and real-world datasets to show that classifi-cation performance is indeed a poor proxy for change detection perfor-mance and provide further evidence that classification performance iscorrelated strongly with the use of change detectors that produce highfalse positive rates.
Keywords: data streams, incremental, dynamic, evolving, online.
1 Introduction
Real-time analytics is a term used to identify analytics performed taking intoaccount recent data that is being generated in real time. The analytical models
A. Tucker et al. (Eds.): IDA 2013, LNCS 8207, pp. 92–103, 2013.c© Springer-Verlag Berlin Heidelberg 2013

CD-MOA: Change Detection Framework for Massive Online Analysis 93
should be up-to-date to match the current distribution of data. To be able to dothat, models should be able to adapt quickly. Drift detection is a very importantcomponent in adaptive modeling, detecting a change gives a signal about when toadapt models. Typically, the streaming error of predictive models is monitoredand when the detector raises a change alarm, then the model is updated orreplaced by a new one.
Currently, drift detection methods are typically evaluated by the final clas-sification accuracy [1,2]. For example, in [2], the authors notice that for a realdataset, the Electricity Market Dataset [3], performance increases when thereis a large number of false positives (or low ARL0): “Interestingly, the fact thatthe best performance is achieved with a low ARL0 suggests that changes are oc-curring quite frequently.” Thus, evaluating drift detection methods only usingclassifiers may not be informative enough, since the adaptation strategy occludeschange detector performance. Further, given that classification is not the onlycontext for change detection we need to match our drift detection evaluationmethodologies with what it is that we want to achieve from the task as a whole.
This paper investigates change detection for real time predictive modeling,and presents the following contributions:
1. CD-MOA, a new experimental framework for evaluating concept driftdetection methods,
2. MTR, a new measure of performance of a concept drift detection method.
It is important to note that the framework generalises to other tasks but inthis paper our focus is on change detection in the context of classification. Theproposed framework is intended to serve as a tool for the research community andindustry data analysts for experimentally comparing and benchmarking changedetection techniques on synthetic data where ground truth changes are known.On real data, the framework allows to find changes in time series, and monitorthe error in classification tasks. The framework and the proposed techniques areimplemented in the open source data stream analysis software MOA and areavailable online1.
In Section 2 we present the new change detection framework and propose anew evaluation measure for change detection. Section 3 presents the results ofour experimental evaluation. We conclude the study in Section 4.
2 Experimental Framework
CD-MOA is a new framework for comparing change detection methods. It isbuilt as an extension of MOA. Massive Online Analysis (MOA) [4] is a softwareenvironment for implementing algorithms and running experiments for onlinelearning from data streams.
CD-MOA contains a graphical user interface where experiments can be run.Figure 1 shows the GUI. It contains three different components. The first is the
1 http://moa.cs.waikato.ac.nz/

94 A. Bifet et al.
Fig. 1. Example of the new CD-MOA framework graphical user interface
panel where the user can specify the experiment they would like to run. Anotherpanel in the middle shows the numeric results of the experiment, and the panelat the bottom displays a plot of the experiment, showing graphically where thechange has been detected.
CD-MOA contains a Java API for easier customization, and implementationof new methods and experiments. The main components of CD-MOA are:
– Tasks: experiments to run combining change detectors and streams– Methods: change detection algorithms used to detect change– Streams: time series used to run the experiment. If they have been artificially
generated and have ground truth, then the system will output the statisticsabout detection time.
CD-MOA is connected to MOA, and it is easy to use the change detec-tor methods in CD-MOA to evaluate classifiers, checking how their accuracyevolves. For evaluation purposes, all the methods in CD-MOA have a measureof the resources consumed: time, memory, and RAM-Hours, a measure of thecost of the mining process that merges time and memory into a single measure.
2.1 Evaluation of Change Detection
Change detection is a challenging task due to a fundamental limitation [5]: thedesign of a change detector is a compromise between detecting true changes andavoiding false alarms.

CD-MOA: Change Detection Framework for Massive Online Analysis 95
When designing a change detection algorithm one needs to balance false andtrue alarms and minimize the time from the change actually happening to de-tection. The following existing criteria [5,6] formally capture these properties forevaluating change detection methods.
Mean Time between False Alarms (MTFA) characterizes how often weget false alarms when there is no change. The false alarm rate FAR is definedas 1/MTFA. A good change detector would have high MTFA.
Mean Time to Detection (MTD) characterizes the reactivity of the systemto changes after they occur. A good change detector would have small MTD.
Missed Detection Rate (MDR) gives the probability of not receiving analarm when there has been a change. It is the fraction of non-detectedchanges in all the changes. A good detector would have small or zero MDR.
Average Run Length (ARL(θ)) generalizes over MTFA and MTD. It quan-tifies how long we have to wait before we detect a change of size θ in thevariable that we are monitoring.
ARL(θ = 0) = MTFA, ARL(θ �= 0) = MTD
Our framework needs to know ground truth changes in the data for evaluationof change detection algorithms. Thus, we generate synthetic datasets with groundtruth. Before a true change happens, all the alarms are considered as false alarms.After a true change occurs, the first detection that is flagged is considered asthe true alarm. After that and before a new true change occurs, the consequentdetections are considered as false alarms. If no detection is flagged betweentwo true changes, then it is considered a missed detection. These concepts aregraphically illustrated in Figure 2.
Fig. 2. The setting of change detection evaluation
We propose a new quality evaluation measure that monitors the compromisebetween fast detection and false alarms:
MTR(θ) =MTFA
MTD× (1−MDR) =
ARL(0)
ARL(θ)× (1−MDR). (1)
This measure MTR (Mean Time Ratio) is the ratio between the mean timebetween false alarms and the mean time to detection, multiplied by the proba-bility of detecting an alarm. An ideal change detection algorithm would have a

96 A. Bifet et al.
low false positive rate (which means a high mean time between false alarms), alow mean time to detection, and a low missed detection rate.
Comparing two change detectors for a specific change θ is easy with this newmeasure: the algorithm that has the highest MTR(θ) value is to be preferred.
2.2 Change Detectors
A change detector or drift detector is an algorithm that takes a stream of in-stances as input and outputs an alarm if it detects a change in the distribution ofthe data. A detector may often be combined with a predictive model to output aprediction of the next instance to come. In general, the input to a change detec-tion algorithm is a sequence x1, x2, . . . , xt, . . . of data points whose distributionvaries over time in an unknown way. At each time step the algorithm outputs:
1. an estimate of the parameters of the input distribution, and
2. an alarm signal indicating whether a change in this distribution has occurred.
We consider a specific, but very frequent case, of this setting with all xt
being real values. The desired estimate is usually the current expected valueof xt, and sometimes other statistics of the distribution such as, for instance,variance. The only assumption about the distribution of x is that each xt isdrawn independently from each other. This assumption may be not satisfied ifxt is an error produced by a classifier that updates itself incrementally, becausethe update depends on the performance, and the next performance depends onwhether we updated it correctly. In practice, however, this effect is negligible, sotreating them independently is a reasonable approach.
The most general structure of a change detection algorithm contains threecomponents:
1. Memory is the component where the algorithm stores the sample data ordata summaries that are considered to be relevant at the current time, i.e.,the ones that describe the current data distribution.
2. Estimator is an algorithm that estimates the desired statistics on the in-put data, which may change over time. The algorithm may or may not usethe data contained in Memory. One of the simplest Estimator algorithmsis the linear estimator, which simply returns the average of the data itemscontained in Memory. Other examples of run-time efficient estimators areAuto-Regressive, Auto Regressive Moving Average, and Kalman filters [7].
3. Change detector (hypothesis testing) outputs an alarm signal when it detectsa change in the input data distribution. It uses the output of the Estimator,and may or may not in addition use the contents of Memory.
There are many different algorithms to detect change in time series. Our newframework contains the classical ones used in statistical quality control [6], timeseries analysis [8], statistical methods and more recent ones such as ADWIN[9].
CD-MOA: Change Detection Framework for Massive Online Analysis 97
2.3 Statistical Tests with Stopping Rules
These tests decide between the hypothesis that there is change and the hypoth-esis that there is no change, using a stopping rule. When this stopping ruleis achieved, then the change detector method signals a change. The followingmethods differ in their stopping rule.
The CUSUM Test. The cumulative sum (CUSUM algorithm), which was firstproposed in [10], is a change detection algorithm that raises an alarm when themean of the input data is significantly different from zero. The CUSUM input εtcan be any filter residual, for instance the prediction error from a Kalman filter.
The stopping rule of the CUSUM test is as follows:
g0 = 0, gt = max (0, gt−1 + εt − υ), if gt > h then alarm and gt = 0
The CUSUM test is memoryless, and its accuracy depends on the choice ofparameters υ and h. Note that CUSUM is a one sided, or asymmetric test. Itassumes that changes can happen only in one direction of the statistics, detectingonly increases.
The Page Hinckley Test. The Page Hinckley Test [10] stopping rule is asfollows, when the signal is increasing:
g0 = 0, gt = gt−1 + (εt − υ), Gt = min(gt, Gt−1)
if gt −Gt > h then alarm and gt = 0
When the signal is decreasing, instead of Gt = min(gt, Gt−1), we should useGt = max(gt, Gt−1) and Gt−gt > h as the stopping rule. Like the CUSUM test,the Page Hinckley test is memoryless, and its accuracy depends on the choice ofparameters υ and h.
2.4 Drift Detection Method
The drift detection method (DDM) proposed by Gama et al. [1] controls thenumber of errors produced by the learning model during prediction. It comparesthe statistics of two windows: the first contains all the data, and the secondcontains only the data from the beginning until the number of errors increases.Their method doesn’t store these windows in memory. It keeps only statisticsand a window of recent errors data.
The number of errors in a sample of n examples is modelled by a binomialdistribution. For each point t in the sequence that is being sampled, the errorrate is the probability of misclassifying (pt), with standard deviation given byst =
√pt(1 − pt)/t. They assume that the error rate of the learning algorithm
(pt) will decrease while the number of examples increases if the distribution ofthe examples is stationary. A significant increase in the error of the algorithm,

98 A. Bifet et al.
suggests that the class distribution is changing and, hence, the actual decisionmodel is supposed to be inappropriate. Thus, they store the values of pt and stwhen pt + st reaches its minimum value during the process (obtaining pmin andsmin). DDM then checks if the following conditions trigger:
– pt+st ≥ pmin+2 ·smin for the warning level. Beyond this level, the examplesare stored in anticipation of a possible change of context.
– pt + st ≥ pmin + 3 · smin for the drift level. Beyond this level the conceptdrift is supposed to be true, the model induced by the learning method isreset and a new model is learnt using the examples stored since the warninglevel triggered. The values for pmin and smin are reset.
In the standard notation, they have two hypothesis tests hw for warning and hd
for detection:
– gt = pt+st, if gt ≥ hw then alarm warning, if gt ≥ hd then alarm detection,where hw = pmin + 2smin and hd = pmin + 3smin.
The test is nearly memoryless, it only needs to store the statistics pt and st, aswell as switch on some memory to store an extra model of data from the timeof warning until the time of detection.
This approach works well for detecting abrupt changes and reasonably fastchanges, but it has difficulties detecting slow gradual changes. In the latter case,examples will be stored for long periods of time, the drift level can take too muchtime to trigger and the examples in memory may overflow.
Baena-Garcıa et al. proposed a new method EDDM (Early Drift DetectionMethod) [11] in order to improve DDM. It is based on the estimated distributionof the distances between classification errors. The window resize procedure isgoverned by the same heuristics.
2.5 EWMA Drift Detection Method
A new drift detection method based on an EWMA (Exponential Weighted Mov-ing Average) chart, was presented by Ross et al. in [2]. It is similar to thedrift detection method (DDM) described previously, but uses an exponentiallyweighted moving average chart to update the estimate of error faster.
This method updates the following statistics for each point t in the sequence:
pt = pt−1(t− 1)/t+ εt/t, st =√pt(1− pt)
g0 = p0, gt = (1− λ)gt−1 + λεt, s(g)t = st
√λ(1 − (1− 2λ)2t)/(2− λ)
EWMA uses the following trigger conditions:
– gt > hw for the warning level, where hw = pt + 0.5Lts(g)t .
– gt > hd for the drift level, where hd = pt + Lts(g)t .
The values of Lt are computed using a different polynomial for each choice ofMTFA of the form L(pt) = c0+c1pt+· · ·+cmpmt using a Monte Carlo approach.A value of λ = 0.2 is recommended by the authors of this method.
CD-MOA: Change Detection Framework for Massive Online Analysis 99
2.6 ADWIN: ADaptive Sliding WINdow Algorithm
ADWIN[12] is a change detector and estimator that solves in a well-specified waythe problem of tracking the average of a stream of bits or real-valued numbers.ADWIN keeps a variable-length window of recently seen items, with the prop-erty that the window has the maximal length statistically consistent with thehypothesis “there has been no change in the average value inside the window”.
More precisely, an older fragment of the window is dropped if and only ifthere is enough evidence that its average value differs from that of the rest ofthe window. This has two consequences: one, that change can reliably be declaredwhenever the window shrinks; and two, that at any time the average over theexisting window can be reliably taken as an estimate of the current average in thestream (barring a very small or very recent change that is still not statisticallyvisible). These two points appears in [12] in a formal theorem.
ADWIN is data parameter- and assumption-free in the sense that it automat-ically detects and adapts to the current rate of change. Its only parameter is aconfidence bound δ, indicating how confident we want to be in the algorithm’soutput, inherent to all algorithms dealing with random processes.
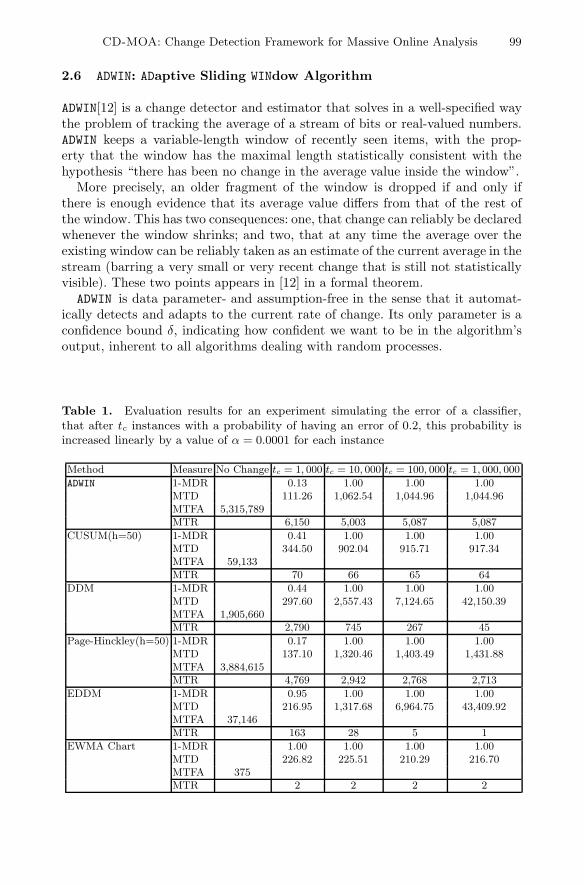
Table 1. Evaluation results for an experiment simulating the error of a classifier,that after tc instances with a probability of having an error of 0.2, this probability isincreased linearly by a value of α = 0.0001 for each instance
Method Measure No Change tc = 1, 000 tc = 10, 000 tc = 100, 000 tc = 1, 000, 000
ADWIN 1-MDR 0.13 1.00 1.00 1.00MTD 111.26 1,062.54 1,044.96 1,044.96MTFA 5,315,789MTR 6,150 5,003 5,087 5,087
CUSUM(h=50) 1-MDR 0.41 1.00 1.00 1.00MTD 344.50 902.04 915.71 917.34MTFA 59,133MTR 70 66 65 64
DDM 1-MDR 0.44 1.00 1.00 1.00MTD 297.60 2,557.43 7,124.65 42,150.39MTFA 1,905,660MTR 2,790 745 267 45
Page-Hinckley(h=50) 1-MDR 0.17 1.00 1.00 1.00MTD 137.10 1,320.46 1,403.49 1,431.88MTFA 3,884,615MTR 4,769 2,942 2,768 2,713
EDDM 1-MDR 0.95 1.00 1.00 1.00MTD 216.95 1,317.68 6,964.75 43,409.92MTFA 37,146MTR 163 28 5 1
EWMA Chart 1-MDR 1.00 1.00 1.00 1.00MTD 226.82 225.51 210.29 216.70MTFA 375MTR 2 2 2 2
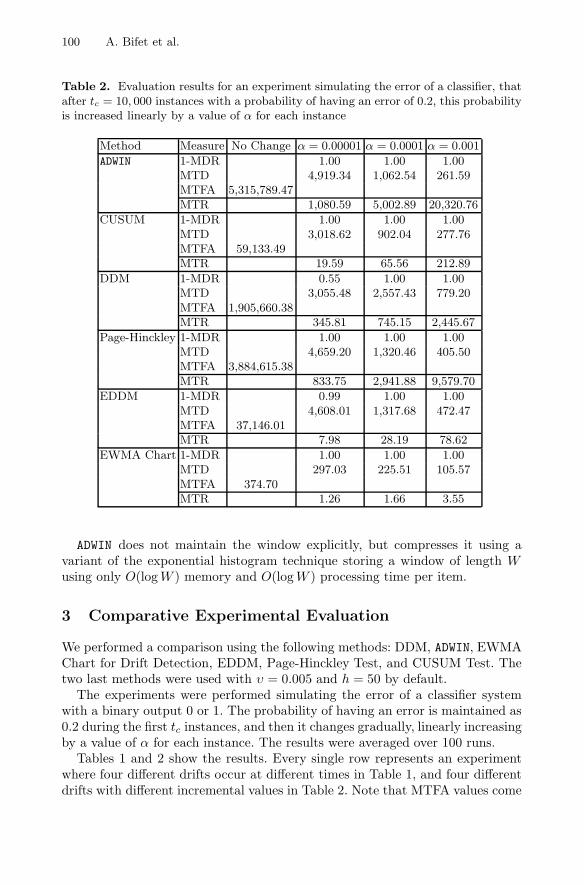
100 A. Bifet et al.
Table 2. Evaluation results for an experiment simulating the error of a classifier, thatafter tc = 10, 000 instances with a probability of having an error of 0.2, this probabilityis increased linearly by a value of α for each instance
Method Measure No Change α = 0.00001 α = 0.0001 α = 0.001
ADWIN 1-MDR 1.00 1.00 1.00MTD 4,919.34 1,062.54 261.59MTFA 5,315,789.47MTR 1,080.59 5,002.89 20,320.76
CUSUM 1-MDR 1.00 1.00 1.00MTD 3,018.62 902.04 277.76MTFA 59,133.49MTR 19.59 65.56 212.89
DDM 1-MDR 0.55 1.00 1.00MTD 3,055.48 2,557.43 779.20MTFA 1,905,660.38MTR 345.81 745.15 2,445.67
Page-Hinckley 1-MDR 1.00 1.00 1.00MTD 4,659.20 1,320.46 405.50MTFA 3,884,615.38MTR 833.75 2,941.88 9,579.70
EDDM 1-MDR 0.99 1.00 1.00MTD 4,608.01 1,317.68 472.47MTFA 37,146.01MTR 7.98 28.19 78.62
EWMA Chart 1-MDR 1.00 1.00 1.00MTD 297.03 225.51 105.57MTFA 374.70MTR 1.26 1.66 3.55
ADWIN does not maintain the window explicitly, but compresses it using avariant of the exponential histogram technique storing a window of length Wusing only O(logW ) memory and O(logW ) processing time per item.
3 Comparative Experimental Evaluation
We performed a comparison using the following methods: DDM, ADWIN, EWMAChart for Drift Detection, EDDM, Page-Hinckley Test, and CUSUM Test. Thetwo last methods were used with υ = 0.005 and h = 50 by default.
The experiments were performed simulating the error of a classifier systemwith a binary output 0 or 1. The probability of having an error is maintained as0.2 during the first tc instances, and then it changes gradually, linearly increasingby a value of α for each instance. The results were averaged over 100 runs.
Tables 1 and 2 show the results. Every single row represents an experimentwhere four different drifts occur at different times in Table 1, and four differentdrifts with different incremental values in Table 2. Note that MTFA values come

CD-MOA: Change Detection Framework for Massive Online Analysis 101
Table 3. Evaluation results of a prequential evaluation using an adaptive NaiveBayes classifier on Electricity and Forest Covertype datasets: accuracy, κ, and numberof changes detected
Forest Covertype ElectricityChange Detector Warning Accuracy κ Changes Accuracy κ Changes
ADWIN No 83.24 73.25 1,151 81.03 60.79 88CUSUM No 81.55 70.66 286 79.21 56.83 28DDM Yes 88.03 80.78 4,634 81.18 61.14 143Page-Hinckley No 80.06 68.40 117 78.04 54.43 10
EDDM Yes 86.08 77.67 2,416 84.83 68.96 203EWMA Chart Yes 90.16 84.20 6,435 86.76 72.93 426
from the no-change scenario. We observe the tradeoff between faster detectionand smaller number of false alarms. Page Hinckley with h = 50 and ADWIN arethe methods with fewer false positives, however CUSUM is faster at detectingchange for some change values. Using the new measure MTR, ADWIN seems tobe the algorithm with the best results.
We use the EWMA Chart for Drift Detection with Lt values computed fora MTFA of 400. However it seems that this is a very low value compared withother change detectors. EDDM has a high number of false positives, and performsworse than DDM using the new measure MTR.
This type of test, has the property that by increasing h we can reduce thenumber of false positives, at the expense of increasing the detection delay.
Finally, we use the change detector algorithms inside the MOA Frameworkin a real data classification task. The methodology is similar to the one in [1]:a classifier is built with a change detector monitoring its error. If this changedetector detects a warning, the classifier begins to store instances. After thechange detector detects change, the classifier is replaced with a new classifierbuilt with the instances stored. Note that this classifier is in fact similar to adata stream classification algorithm that exploits a window model. The size ofthis window model is not fixed and depends on the change detection mechanism.We test the change detectors with a Naive Bayes classifier, and the followingdatasets:
Forest Covertype Contains the forest cover type for 30 x 30 meter cells ob-tained from US Forest Service (USFS) Region 2 Resource Information Sys-tem (RIS) data. It contains 581, 012 instances and 54 attributes. It has beenused before, for example in [13,14].
Electricity Contains 45, 312 instances describing electricity demand. A classlabel identifies the change of the price relative to a moving average of thelast 24 hours. It was described by [3] and analysed also in [1].
The accuracy and κ statistic results using prequential evaluation are shownin Table 3. The classifier that uses the EWMA Chart detection method is themethod with the best performance on the two datasets. It seems that having

102 A. Bifet et al.
a large amount of false positives, detecting more changes, and rebuilding theclassifier more often with more recent data helps to improve accuracy for thesedatasets. For the classification setting, the fact that the detector has a warningsignal detection helps to improve results. Also, the success of EWMA Chart maybe due to the fact that Naive Bayes is a high-bias algorithm, which can attaingood performance from smaller batches of data.
However, as we have seen, the fact that a change detection algorithm produceshigh accuracy figures in a classification setting does not necessarily imply a lowfalse alarm rate or a high MTR value for that algorithm. It should be possible,for example, to tune all the detectors in the framework to produce better clas-sification results by deliberately raising their false positive rates. Additionally,it should be possible to demonstrate that under normal circumstances, low-biasalgorithms suffer high false positive rates.
4 Conclusions
Change detection is an important component of systems that need to adapt tochanges in their input data. We have presented a new framework for evaluationof change detection methods, and a new quality measure for change detection.Using this new experimental framework we demonstrated that classification per-formance is a poor proxy for change detection performance and provide furtherevidence that if high classification performance is a requirement then using achange detector that produces a high false positive rate can be beneficial forsome datasets. We hope that the new framework presented here will help theresearch community and industry data analysts to experimentally compare andbenchmark change detection techniques.
Acknowledgements. I. Zliobaite’s research has been supported by theAcademy of Finland grant 118653 (ALGODAN).
References
1. Gama, J., Medas, P., Castillo, G., Rodrigues, P.: Learning with drift detection.In: Bazzan, A.L.C., Labidi, S. (eds.) SBIA 2004. LNCS (LNAI), vol. 3171, pp.286–295. Springer, Heidelberg (2004)
2. Ross, G.J., Adams, N.M., Tasoulis, D.K., Hand, D.J.: Exponentially weighted mov-ing average charts for detecting concept drift. Pattern Recognition Letters 33(2),191–198 (2012)
3. Harries, M.: Splice-2 comparative evaluation: Electricity pricing. Technical report,The University of South Wales (1999)
4. Bifet, A., Holmes, G., Kirkby, R., Pfahringer, B.: MOA: Massive online analysis.Journal of Machine Learning Research 11, 1601–1604 (2010)
5. Gustafsson, F.: Adaptive Filtering and Change Detection. Wiley (2000)6. Basseville, M., Nikiforov, I.V.: Detection of abrupt changes: theory and application.
Prentice-Hall, Inc., Upper Saddle River (1993)

CD-MOA: Change Detection Framework for Massive Online Analysis 103
7. Kobayashi, H., Mark, B.L., Turin, W.: Probability, Random Processes, and Statis-tical Analysis. Cambridge University Press (2011)
8. Takeuchi, J., Yamanishi, K.: A unifying framework for detecting outliers andchange points from time series. IEEE Transactions on Knowledge and Data Engi-neering 18(4), 482–492 (2006)
9. Bifet, A., Gavalda, R.: Adaptive learning from evolving data streams. In: Adams,N.M., Robardet, C., Siebes, A., Boulicaut, J.-F. (eds.) IDA 2009. LNCS, vol. 5772,pp. 249–260. Springer, Heidelberg (2009)
10. Page, E.S.: Continuous inspection schemes. Biometrika 41(1/2), 100–115 (1954)11. Baena-Garcıa, M., del Campo-Avila, J., Fidalgo, R., Bifet, A., Gavalda, R.,
Morales-Bueno, R.: Early drift detection method. In: Fourth International Work-shop on Knowledge Discovery from Data Streams (2006)
12. Bifet, A., Gavalda, R.: Learning from time-changing data with adaptive windowing.In: SIAM International Conference on Data Mining (2007)
13. Gama, J., Rocha, R., Medas, P.: Accurate decision trees for mining high-speed datastreams. In: ACM SIGKDD International Conference on Knowledge Discovery andData Mining, pp. 523–528 (2003)
14. Oza, N.C., Russell, S.J.: Experimental comparisons of online and batch versions ofbagging and boosting. In: ACM SIGKDD International Conference on KnowledgeDiscovery and Data Mining, pp. 359–364 (2001)