ccs system modelling
TRANSCRIPT

© 2014 Process Systems Enterprise Limited
Mario Calado – Consultant Engineer
CCS System Modelling Impact of power plant flexibility on CCS networks
INTERNATIONAL FORUM ON RECENT DEVELOPMENTS OF CCS IMPLEMENTATION
Session 3: Process Optimisation and Techno-economic Considerations
26st March, 2015
Authors: Mario Calado, Elton Dias, Adekola Lawal, Javier Rodriguez, Nouri Samsatli, Gerardo Sanchis and Alfredo Ramos

© 2014 Process Systems Enterprise Limited
Overview
Challenges to the commercial viability of CCS
Systems modelling for CCS
Case Study – CCS networks
Why CCS networks?
Conclusions

© 2014 Process Systems Enterprise Limited
Challenges to the commercial viability of CCS
CCS
Business case
Cost
Public acceptance
Policy

© 2014 Process Systems Enterprise Limited
Challenges to the commercial viability of CCS
Cost
Current cost of abatement of CCS too high with respect to other low-carbon technologies/ renewables
Substantial challenges in moving from FOAK to NOAK owing to “uniqueness” of each CCS project
CO2 sources
Topography / pipeline layout
CO2 stores

© 2014 Process Systems Enterprise Limited
Challenges to the commercial viability of CCS
Policy – creating an “even playfield”
Intermittency of renewables needs to be balanced
Benefits of flexibility in generation of ‘clean electricity’ through CCS
How to ‘reward’ this flexibility in generation?
2010
2030

© 2014 Process Systems Enterprise Limited
Why is dynamic simulation of CCS important?
To achieve carbon reduction targets in the UK, electricity must be effectively decarbonised by ~2030
Therefore to meet these targets fossil plants must have CO2 capture and sequestration to eliminate their emissions
Fossil plant currently provides the on-demand flexible generation to meet changes in demand over the day
Inflexible intermittent generation (e.g. wind & solar) means fossil plant will be required to change load around less predictable changes in green supply
Source:

© 2014 Process Systems Enterprise Limited
Grid demand Flexibility Efficiency Fuel mix Trip scenarios
Sizing Flexibility Buffer storage Amine loading Capital cost optimisation Energy sacrifice Heat integration Solvent issues
Optimal operating point Efficiency New design Impurities Control Safety
Composition effects Phase behavior Capacity Buffering / packing Routing Safety Depressurisation Control Leak detection
Tools PROATES GTPro Ebsilon Dymola Aspen Plus …
Tools gPROMS PROMAX Aspen Plus …
Tools Various in-house
Tools OLGA PIPESIM …
CCS chains
Existing technology in a new configuration
Government Policy Strategic Infrastructure development H&S
Compression Supply variability Composition Thermodynamics Temperatures / hydrates Well performance Long-term storage dynamics Back-pressures
Injection/storage
…new technology required to address the new challenges posed by integrated CCS system
Tools OLGA Prosper/Gap …

© 2014 Process Systems Enterprise Limited
The CCS System modelling Tool-kit Project 2011-2014
Energy Technologies Institute (ETI)
gPROMS modelling platform & expertise
Project Management
~$5m project commissioned & co-funded by the ETI
Objective: “end-to-end” CCS modelling tool

© 2014 Process Systems Enterprise Limited
System-wide modelling Key enabling technology for CCS
Explore complex decision space rapidly based on high-fidelity, technically realistic models
resolve own technical and economic issues
take into account upstream & downstream behaviour
Manage interactions and trade-offs
Evaluate technology – existing and next-generation
judge relative merits of emerging technologies
support consistent, future-proof choices
Integrating platform for
working with other stakeholders in chain
collaborative R&D, working with academia

© 2014 Process Systems Enterprise Limited
Case Study: CCS network

© 2014 Process Systems Enterprise Limited
Why is CCS networks?

© 2014 Process Systems Enterprise Limited
Why is CCS networks?
Source: “Industrial CCS & CCU - View from the UK”: IEAGHG workshop in “CCS in Process Industries State-of- the-Art and Future Opportunities” – 10/03/2015 Lisbon (Portugal)
Industrial sources typically too small for dedicated pipeline for CO2 transport
Need for pipeline network for industrial clusters, like Tees Valley

© 2014 Process Systems Enterprise Limited
Why is CCS networks?
Source: “Industrial CCS & CCU - View from the UK”: IEAGHG workshop in “CCS in Process Industries State-of- the-Art and Future Opportunities” – 10/03/2015 Lisbon (Portugal)
Capture cost significantly varies with CO2 source
Greatest cost reduction potential relies in CO2 transport network optimisation

© 2014 Process Systems Enterprise Limited
CCS network configuration
St Fergus beach crossing
Captain reservoir
Goldeneye reservoir
Peterhead
Grangemouth
11km
280km
1km
80km
101km

© 2014 Process Systems Enterprise Limited
System overview
Offshore dense-phase injection
(acknowledgement: CO2DeepStore)
~ 500km of pipeline Onshore and Offshore ~800MWe
Supercritical Pulverized coal (acknowledgement: E.ON)
Chemical absorption MEA solvent 90% CO2 capture
~740MWe Combined Cycle Gas Turbine (acknowledgement: EDF)
4 and 2 compression trains 2 frames per train Surge control (acknowledgement: Rolls-Royce)
5 injection wells 2.6km reservoir depth
3 injection wells 2km reservoir depth

© 2014 Process Systems Enterprise Limited
CCS network configuration – Pipeline topography
8
Kingsnorth FEED study

© 2014 Process Systems Enterprise Limited
Load disturbance in CCGT

© 2014 Process Systems Enterprise Limited
Load change effects
An increase of about 62% in the CCGT onshore pipe flowrate only increases 1.8% the inlet flowrate of the onshore pipe

© 2014 Process Systems Enterprise Limited
Dynamic analysis of CCS Networks
St Fergus beach crossing
Captain reservoir
Goldeneye reservoir
11km
280km
1km
80km
101km
79.2
79.4
79.6
79.8
80.0
80.2
0 20 40 60 80 100 120
Mass f
low
rate
(kg/s
)
Time (hours)
CO2 injected at Goldeneye
79.2
79.4
79.6
79.8
80.0
80.2
0 20 40 60 80 100 120
Mass f
low
rate
(kg/s
)
Time (hours)
CO2 injected at Goldeneye
200
400
600
800
0 20 40 60 80 100 120
Pow
er
(MW
e)
Time
Net Power
200
400
600
800
0 20 40 60 80 100 120
Pow
er
(MW
e)
Time
Net Power
79.2
79.4
79.6
79.8
80.0
80.2
0 20 40 60 80 100 120
Mass f
low
rate
(kg/s
)
Time (hours)
CO2 injected at Goldeneye
79.2
79.4
79.6
79.8
80.0
80.2
0 20 40 60 80 100 120
Mass f
low
rate
(kg/s
)
Time (hours)
CO2 injected at Goldeneye

© 2014 Process Systems Enterprise Limited
Other commercial applications

© 2014 Process Systems Enterprise Limited
Conclusions

© 2014 Process Systems Enterprise Limited
Conclusions
System modelling is an essential tool explore complex decision space resolve
own technical and economic issues
inform and aid the design of safe control systems and operating procedures
identify areas requiring additional attention when designing for dynamic operation
Evaluate technology – existing and next-generation
Integrating platform for working with other stakeholders in chain collaborative R&D, working with academia
gCCS - an integrated Advanced Process Modelling tool Capture, formalise & deploy existing
knowledge on CCS technology
Common language for communication
Open architecture allow incorporation of future technology


© 2014 Process Systems Enterprise Limited
gCCS initial scope (2014/Q2)
Process models
Power generation
Conventional: pulverised-coal, CCGT
Non-conventional: oxy-fuelled, IGCC
Solvent-based CO2 capture
CO2 compression & liquefaction
CO2 transportation
CO2 injection in sub-sea storage
Materials models
cubic EoS (PR 78)
flue gas in power plant
Corresponding States Model
water/steam streams
SAFT-VR SW/ SAFT- Mie
amine-containing streams in CO2 capture
SAFT- Mie
near-pure post-capture CO2 streams
Open architecture allows incorporation of 3rd party models (e.g. E.ON’s PROATES)
© 2014 Process Systems Enterprise Limited
Back-up slides (case study 1)

© 2014 Process Systems Enterprise Limited
Scenario Description Power plant operation
(% of nominal load) Capture plant operation
(CO2 % captured)
SS1.1 (a,b,c) Base Load Power Plant (a) 100%; (b) 75%; (c) 50% 0% (no capture)
SS1.2 (a, b) Base load CCS Chain 100% (a) 90%; (b) 50%
SS1.3 (a, b) Part Load Analysis (a) 75%; (b) 50% 90%
SS1.4 Extreme Weather: Max Summer
100% 90%
SS1.5 Extreme Weather: Max Winter 100% 90%
Steady-state scenarios
used for model calibration (e.g. Stodola constants for steam turbines; HTA for feed water heaters, etc.)
Temperatures
(oC)
Affected sub-systems Base Case
Extreme Summer
ExtremeWinter
Cooling water Power, Capture, Compression 18 22 7
Air Power, Transmission, Injection
15 30 -15
Sea water Transmission, Injection 9 14 4
NB. Geothermal gradient of +27.5oC / km

© 2014 Process Systems Enterprise Limited
Steady-state analysis
Power generation
100% 0%
75% 0%
50% 0%
100% 90%
100% 50%
75% 90%
50% 90%
100% 90%
Summer
100% 90%
Winter
: coal milling + power plant auxiliaries
: coal milling + power plant auxiliaries + CO2 compression
: capture plant steam + CO2 compression

© 2014 Process Systems Enterprise Limited
Steady-state analysis
CO2 compression power
100% 90%
100% 50%
75% 90%
50% 90%
100% 90%
Summer
100% 90%
Winter
Differences primarily due to changes in viscosity of fluid in pipeline

© 2014 Process Systems Enterprise Limited
3 4 5 6 7 8 9 107
7.5
8
Pow
er
requirem
ent
(MW
e)
3 4 5 6 7 8 9 10400
500
600
700
800
Net
Pow
er
(MW
e)
(a) Electric drive 1 power requirement
DS 1.1
DS 1.2
3 4 5 6 7 8 9 103
3.5
4
4.5
5
Pow
er
requirem
ent
(MW
e)
3 4 5 6 7 8 9 10400
500
600
700
800
Net
Pow
er
(MW
e)
(b) Electric drive 2 power requirement
3 4 5 6 7 8 9 1038
38.1
38.2
38.3
38.4
Pre
ssure
(bara
)
3 4 5 6 7 8 9 10400
500
600
700
800
Net
Pow
er
(MW
e)
(c) Dehydrator inlet pressure
3 4 5 6 7 8 9 1096
97
98
99
100
Time (hours)
Pre
ssure
(bara
)
3 4 5 6 7 8 9 10400
500
600
700
800
Net
Pow
er
(MW
e)
(d) Compressor discharge pressure
Dynamic analysis
CO2 compression plant
Drive #1 power
Drive #2 power
Dehydrator inlet pressure
Compressor discharge pressure
3 4 5 6 7 8 9 100
10
20
30
40
50
Surg
e m
arg
in (
%)
3 4 5 6 7 8 9 10400
500
600
700
800
Net
Pow
er
(MW
e)
(a) Compressor section 1 surge margin
3 4 5 6 7 8 9 100
10
20
30
40
50
Surg
e m
arg
in (
%)
3 4 5 6 7 8 9 10400
500
600
700
800
Net
Pow
er
(MW
e)
(b) Compressor section 2 surge margin
3 4 5 6 7 8 9 100
10
20
30
40
50
Surg
e m
arg
in (
%)
3 4 5 6 7 8 9 10400
500
600
700
800
Net
Pow
er
(MW
e)
(c) Compressor section 3 surge margin
3 4 5 6 7 8 9 100
10
20
30
40
50
Surg
e m
arg
in (
%)
3 4 5 6 7 8 9 10400
500
600
700
800
Net
Pow
er
(MW
e)
(d) Compressor section 4 surge margin
3 4 5 6 7 8 9 100
10
20
30
40
50
Surg
e m
arg
in (
%)
3 4 5 6 7 8 9 10400
500
600
700
800
Net
Pow
er
(MW
e)
(e) Compressor section 5 surge margin
3 4 5 6 7 8 9 100
10
20
30
40
50
Time (hours)
Surg
e m
arg
in (
%)
3 4 5 6 7 8 9 10400
500
600
700
800
Net
Pow
er
(MW
e)
(f) Compressor section 6 surge margin
Surge margins
Drive #1, Section #1
Drive #1, Section #3
Drive #1, Section #2
Drive #2, Section #1
Drive #2, Section #2
Drive #2, Section #3
Compressor surge control

© 2014 Process Systems Enterprise Limited
Offshore dense-phase injection; 4 injection wells
~2km reservoir depth (acknowledgement:
CO2DeepStore)
220km pipeline Dense phase CO2 Onshore and Offshore
~800MWe Supercritical Pulverized coal (acknowledgement: E.ON)
4 parallel compression trains 2 frames per train Surge control (acknowledgement: Rolls-Royce)
Chemical absorption MEA solvent 90% CO2 capture
System overview

© 2014 Process Systems Enterprise Limited
Power
Load
5 mins
5 mins 75%
100%
Time
1 hour
5 hours 23.5 hours
Dynamic analysis
Scheduled changes in power plant load
Scenario DS1.1

© 2014 Process Systems Enterprise Limited
3 4 5 6 7 8 9 1036
37
38
39
40
41
Net
Eff
icie
ncy (
%)
3 4 5 6 7 8 9 1080
100
120
Reboile
r ste
am
dem
and (
kg/s
)(b) Power plant net efficiency vs reboiler steam demand
Time (hours)
3 4 5 6 7 8 9 10600
700
800
Mass f
low
rate
(kg/s
)
3 4 5 6 7 8 9 10400
500
600
700
800
Net
Pow
er
(MW
e)
(a) Flue gas mass flowrate
Dynamic analysis
Power/CO2 capture two-way coupling
Flue gas flowrate
Power plant net efficiency vs. reboiler steam demand

© 2014 Process Systems Enterprise Limited
0 5 10 15 20 25 3090
92
94
96
98
100
Pre
ssur
e (b
ara)
0 5 10 15 20 25 30400
500
600
700
800
Net
Pow
er (
MW
e)
(a) Pipeline inlet pressure
0 5 10 15 20 25 30100
102
104
106
108
110
Pre
ssur
e (b
ara)
0 5 10 15 20 25 30400
500
600
700
800
Net
Pow
er (
MW
e)
(b) Pipeline outlet pressure
0 5 10 15 20 25 307
7.5
8
8.5
9
Pre
ssur
e di
ffer
ence
(ba
r)
0 5 10 15 20 25 30400
500
600
700
800
Net
Pow
er (
MW
e)
(c) Pipeline pressure difference
0 5 10 15 20 25 30100
110
120
130
140
150
Mas
s flo
wra
te (
kg/s
)0 5 10 15 20 25 30
400
500
600
700
800
Net
Pow
er (
MW
e)
(d) Pipeline inlet mass flowrate
0 5 10 15 20 25 30100
110
120
130
140
150
Time (hours)
Mas
s flo
wra
te (
kg/s
)
0 5 10 15 20 25 30400
500
600
700
800
Net
Pow
er (
MW
e)
(e) Pipeline outlet mass flowrate
DS 1.1
DS 1.2
Dynamic analysis
CO2 transmission pipelines
Buffer potential for flexible operation
5 10 15 20 25 30 35 40 45 50100
110
120
130
140
150
160
Time (hours)
Mass f
low
rate
(kg/s
)
Pipeline inlet
At landfall valve
At 100km
Pipeline outlet

© 2014 Process Systems Enterprise Limited
Back-up slides (case study 2)

© 2014 Process Systems Enterprise Limited
gCCS Transmission & Injection Library
CO2 transmission networks

© 2014 Process Systems Enterprise Limited
Load change effects
Load disturbance increases the CO2 injected flowrate by only 0.5%

© 2014 Process Systems Enterprise Limited
Back-up slides (power generation)

© 2014 Process Systems Enterprise Limited
Governor valve
Feed Water Heaters
Deaerator Condenser
Generator
Coal
Air
Boiler
Turbine sections
Flue gas treatment
> 10 recycles & closed water/steam loop
Sub-system #1
Supercritical pulverized coal power plant

© 2014 Process Systems Enterprise Limited
CO2 inlet
Absorber
Direct Contact Cooler (DCC)
Buffer Tank
Stripper
Reboiler
Condenser
CO2 capture rate controler
Solvent /water make-up controlers
Sub-system #2
CO2 capture plant
© 2014 Process Systems Enterprise Limited
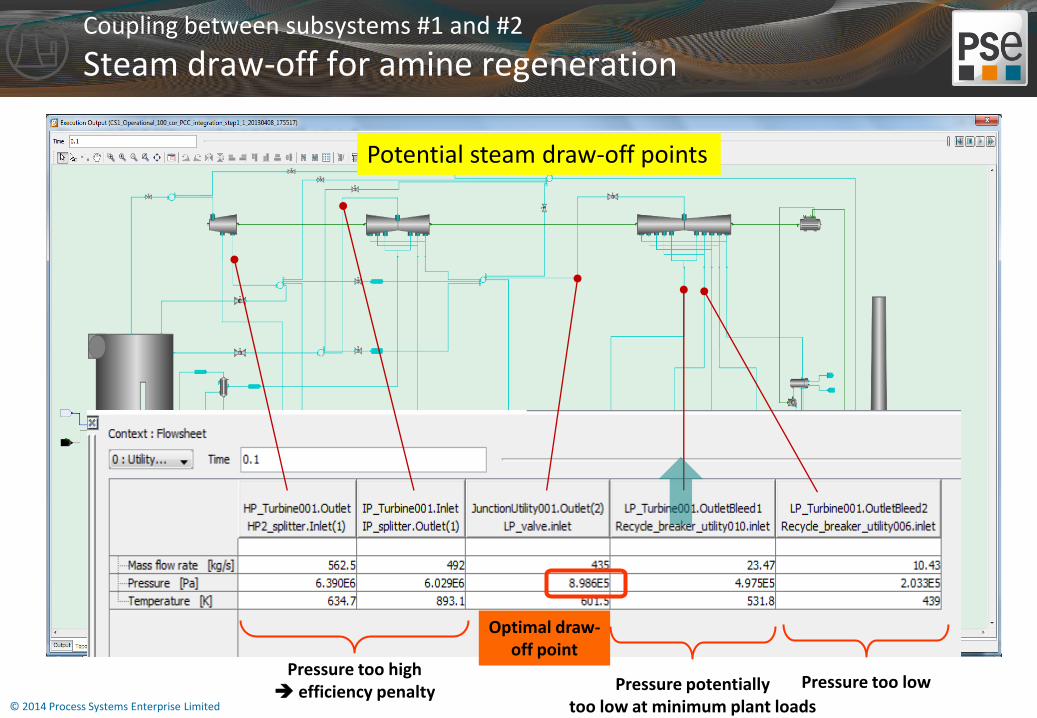
Coupling between subsystems #1 and #2
Steam draw-off for amine regeneration
Potential steam draw-off points
Optimal draw-off point
Pressure too high efficiency penalty
Pressure too low Pressure potentially too low at minimum plant loads

© 2014 Process Systems Enterprise Limited
Sub-system #3
CO2 compression plant
Fixed speed electric drive
Variable speed electric drive
Dehydration unit
Cooler KO drum
Compression section
(Frame #1: 4 ; Frame #22)
Surge valve

© 2014 Process Systems Enterprise Limited
Process side
Sub-system #1 – other power technologies considered
Oxyfuel power plant
Ste
am c
ycle

© 2014 Process Systems Enterprise Limited
Steam Cycle
Sub-system #1 – other power technologies considered
Oxyfuel power plant P
roce
ss s
ide

© 2014 Process Systems Enterprise Limited
Integrated Gasification Combined Cycle power plant (IGCC)
Air separation unit
(ASU) and compression
Gasification and
syngas cooling
Syngas conditioning
Acid gas removal
(AGR) and
sulphur recovery
unit (SRU)
Gas turbine
HRSG and steam
turbines
Sub-system #1 – other power technologies considered
IGCC power plant

© 2014 Process Systems Enterprise Limited
gCCS Power Plant library – conventional power generation
CCGT power plant
Gas Turbine
Condenser
Generator
Steam turbines
Steam drums
Economisers, superheaters, evaporators
Input flexibility: Total power output or natural gas flowrate specified
Air
Natural Gas
Steam to Capture Plant
Condensate return
Stack

© 2014 Process Systems Enterprise Limited
Back-up slides (Interfaces)

© 2014 Process Systems Enterprise Limited
Tool-kit components Interfaces to 3rd party modelling tools
Direct interfacing / co-simulation – based on gPROMS’s Foreign Object (FO) interface
Steady-state modelling and simulation packages (E.ON’s PROATES)
Equipment design tools (Rolls-Royce’s CompPerform/CompSelect)
Model fitting
Incorporate reduced-order models of high-fidelity equipment models

© 2014 Process Systems Enterprise Limited
gCCS Whole-chain CCS systems modelling
Deployment of 3rd party models
Integration of PROATES power plant model in gCCS for whole chain studies

© 2014 Process Systems Enterprise Limited
Back-up slides (solvent-based CO2 Capture)

© 2014 Process Systems Enterprise Limited
Tool-kit components Model libraries – CO2 Capture (chemical and physical absorption)

© 2014 Process Systems Enterprise Limited
Tool-kit components Model libraries – CO2 Capture
Non-equilibrium models
Models distributed in axial direction and in the direction of the liquid and vapour films
Energy balance and V/L equilibrium at the interface
Phase behaviour and chemical equilibrium currently calculated by OLI thermodynamic package
to be replaced by gSAFT
Transport properties
Obtained from correlations and Multiflash
( ', )f
gT z
',f
iy z
',f
lT z
( ', )f
ix z
z’ L G
z’
'b
iy z
'b
lT z 'b
gT z
'b
ix z
( ')I
ix z
( ')I
iy z
High-fidelity column model

© 2014 Process Systems Enterprise Limited
Medium-fidelity column model
Based on two-film theory
Enhancement factors account for effect of reactions
Vapour/Liquid equilibrium at interface
z L G
𝑥𝑖𝑏 𝑧
𝑥𝑖𝐼 𝑧
𝑦𝑖𝐼 𝑧
𝑦𝑖𝑏 𝑧
𝑇𝑙𝑏 𝑧
𝑇𝑔𝑏 𝑧
𝑇𝑙,𝑔𝑏 𝑧
V_film L_film Bulk_L Bulk_V
Interface
Enh
Tool-kit components Model libraries – CO2 Capture (chemical and physical absorption)

© 2014 Process Systems Enterprise Limited
Pipelines Schedule 40, 18’’
Emergency shutdown valves
(ESD) Gate valve
Vertical riser from sea bed
CO2 flowmeter
Sub-system #4
CO2 transmission pipelines
20km
16
0m
200km
-20
0m

© 2014 Process Systems Enterprise Limited
Wells 7’’, 2km
Distribution header
Choke valves
Reservoir ~250 bar
Wellhead connections
20m above water, 70m submerged
Sub-system #5
CO2 injection & storage in reservoir

© 2014 Process Systems Enterprise Limited
gCCS Transmission & Injection Library
Reversible flow in CO2 transmission networks
Reversible flow scenarios
Normal: pipe expected to allow flow in either direction
depending on the operation of the connected networks
Abnormal: unexpected transient event upstream or
downstream causes temporary flow reversal in part of one
pipeline

© 2014 Process Systems Enterprise Limited
Back-up slides (Physical Properties)

© 2014 Process Systems Enterprise Limited
Different material/species within the same sub-system
e.g. in power plant: coal, water, flue gas
Different materials/species in different sub-systems
e.g. MEA in CO2 capture plant
Need different thermodynamic models for different materials, e.g.
cubic EoS (PR 78) for flue gas in power plant
Corresponding States (Steam Tables) for pure water
SAFT for amine-containing streams in CO2 capture
SAFT for near-pure post-capture CO2 streams
Transport properties obtained from gPROMS Properties
models/ correlations
gPROMS Properties (Multiflash®)
Tool-kit components Physical properties

© 2014 Process Systems Enterprise Limited
applied to mixtures of CO2, CO, H2O, Ar…..
small molecules single group each
Physical properties for compression/transmission in CCS
Challenges
Impurities
Wide range of conditions
Limited experimental data
A predictive equation of state
is required

© 2014 Process Systems Enterprise Limited
gSAFT for compression/transmission in CCS
Comparisons: Binary mixture H2O + CO2
Isotherms:
T=323.2 K (red)
T=333.2 K (yellow)
T=353.1 K (green)
CPA: Cubic+Association EoS
CO2 rich phase

© 2014 Process Systems Enterprise Limited
Why gSAFT? Accurate prediction of phase envelope for near-pure CO2 mixtures
(Chapoy et al, 2011)
Impurities can substantially impact
phase boundary. Owing to the lack
of experimental data, a predictive
Equation of State is required.
Note that GERG’s predictions of
vapour pressure still deviate by 4-5
bar from experimental data.

© 2014 Process Systems Enterprise Limited
gPROMS product family
The gPROMS platform Equation-oriented modelling & solution engine
Sector-focused modelling tools
CCS system modelling
Power & CCS
Flare networks & depressurisation
Oil & Gas
Solids process optimisation
Crystallization process optimisation
Oral absorption
Life Sciences, Consumer, Food, Spec & Agrochem
Materials modelling
Fuel cell stack & system design
Fuel Cells & Batteries
Wastewater systems optimisation
Wastewater Treatment
Model deployment tools
Deploy models in common engineering software
Enterprise Objects
General mathematical modelling
gPROMS ModelBuilder Advanced process modelling environment
Chemicals & Petrochemicals
Advanced model libraries for reaction & separation
gPROMS ProcessBuilder Advanced process simulation

© 2014 Process Systems Enterprise Limited
Logos & icons
Corporate Products Sector icons
gPROMS Objects
Enterprise APM Forum