ccqm-k125 elements in infant formula
TRANSCRIPT
CCQM-K125
Elements in Infant Formula
Final Report Authors: Jeffrey Merrick and David Saxby (NMIA)1, Emily Silva Dutra, Rodrigo Caciano de Sena, Thiago de Oliveira Araújo and Marcelo Dominguez de Almeida (INMETRO)2, Lu Yang, Indu Gedara Pihillagawa and Zoltan Mester (NRC)3, Soraya Sandoval (ISP)4, Chao Wei (NIM)5, M. Estela Del Castillo, Caroline Oster and Paola Fisicaro (LNE)6, Olaf Rienitz, Carola Pape, Ursula Schulz, Reinhard Jährling and Volker Görlitz (PTB)7, Evgenia Lampi and Elias Kakoulides (EXHM)8, Della Wai-mei Sin, Yiu-chung Yip and Yuk-tai Tsoi (GLHK)9, Yanbei Zhu (NMIJ)10, Tom Oduor Okumu (KEBS)11, Yong-Hyeon Yim, Sung Woo Heo, Myungsub Han and Youngran Lim (KRISS)12, Mariana Arce Osuna and Laura Regalado (CENAM)13, Christian Uribe (INACAL)14, Mirella Maria Buzoianu and Steluta Duta (INM)15, Leonid Konopelko and Anatoli Krylov (VNIIM)16, Richard Shin (HSA)17, Maré Linsky and Angelique Botha (NMISA)18, Bertil Magnusson and Conny Haraldsson (SP)19, Usana Thiengmanee (NIMT)20, Hanen Klich (INRAP)21, Suleyman Z. Can, F. Gonca Coskun and Murat Tunc (TUBITAK UME)22, John Entwisle, Jennifer O’Reilly, Sarah Hill and Heidi Goenaga-Infante (LGC)23, Michael Winchester and Savelas A. Rabb (NIST)24, Ramiro Pérez-Zambra (LATU)25 1 National Measurement Institute (NMIA), Australia 2 National Institute of Metrology, Quality and Technology (INMETRO), Brazil 3 National Research Council (NRC), Canada 4 Public Health Institute of Chile (ISP), Chile 5 National Institute of Metrology (NIM), China 6 Laboratorie national de metrologie et d’essais (LNE), France 7 Physikalisch-Technische Bundesanstalt (PTB), Germany 8 Chemical Metrology Laboratory / General Chemical State Laboratory –
Hellenic Metrology Institute (EXHM), Greece 9 Government Laboratory (GLHK), Hong Kong, China 10 National Metrology Institute of Japan (NMIJ), Japan 11 Kenya Bureau of Standards (KEBS), Kenya 12 Korea Research Institute of Standards & Science (KRISS), Korea 13 Centro Nacional de Metrología (CENAM), Mexico 14 National Institute for Quality (INACAL), Peru 15 National Institute of Metrology (INM), Romania 16 D.I. Mendeleyev Institute for Metrology (VNIIM), Russia 17 Health Sciences Authority (HSA), Singapore 18 National Metrology Institute of South Africa (NMISA), South Africa 19 SP Technical Research Institute of Sweden (SP), Sweden 20 National Institute of Metrology (Thailand) (NIMT), Thailand 21 National Institute for Research and Physical and Chemical analysis (INRAP), Tunisia 22 National Metrology Institute of Turkey (TUBITAK UME), Turkey 23 LGC Limited (LGC), UK 24 National Institute of Standard and Technology (NIST), USA 25 Laboratorio Tecnológico del Uruguay (LATU), Uruguay
Abstract The Key Comparison CCQM-K125 “Elements in Infant Formula” was undertaken to demonstrate the capability of participating national metrology institutes (NMIs) and designated institutes (DIs) in measuring the mass fraction the analytes at mg/kg levels in a test sample of infant formula by various analytical techniques. According to the Inorganic Analysis Working Group’s (IAWG’s) five-year plan, it was recommended to have a key comparison under the measurement service category of food for the year 2015. In this regards, the Government Laboratory, Hong Kong (GLHK) proposed to coordinate a new key comparison and a parallel-run pilot study (CCQM-K125 and CCQM-P159) for the determination of elements in infant formula. At the CCQM IAWG Meeting held in October 2014, the proposed study was agreed by IAWG members to be organised as the fifth benchmarking exercise. It was important for benchmarking to select two exemplary elements which were reasonably easy for many IAWG members to measure. Having further discussed with concerned IAWG members, potassium and copper were selected as the exemplary elements for examination, whereas iodine was an optional element for analysis. This key comparison facilitates claims by participants on the Calibration and Measurement Capabilities (CMCs) as listed in Appendix C of the Key Comparison Database (KCDB) under the Mutual Recognition Arrangement of the International Committee for Weights and Measures (CIPM MRA). Participants are requested to complete the pertinent Inorganic Core Capabilities Tables as a means of providing evidence for their CMC claims. For registration of CCQM-K125, total 25 institutes registered for the examination of the exemplary analytes of potassium and copper, while 12 institutes registered for the optional analyte of iodine. For submission of results, 25 institutes submitted the results for potassium, 24 institutes submitted the results for copper and 8 institutes submitted the results for iodine. The information about registration and submission of participants’ results is summarised in Table A.
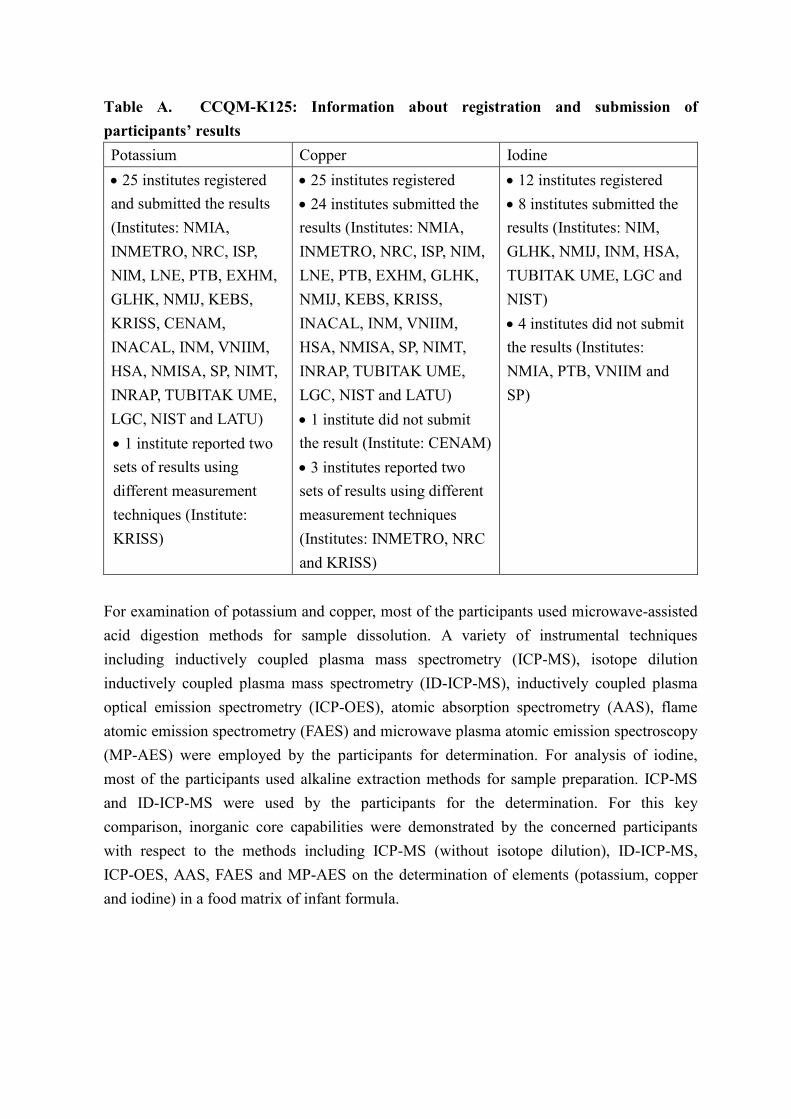
Table A. CCQM-K125: Information about registration and submission of participants’ results Potassium Copper Iodine • 25 institutes registered and submitted the results (Institutes: NMIA, INMETRO, NRC, ISP, NIM, LNE, PTB, EXHM, GLHK, NMIJ, KEBS, KRISS, CENAM, INACAL, INM, VNIIM, HSA, NMISA, SP, NIMT, INRAP, TUBITAK UME, LGC, NIST and LATU) • 1 institute reported two sets of results using different measurement techniques (Institute: KRISS)
• 25 institutes registered • 24 institutes submitted the results (Institutes: NMIA, INMETRO, NRC, ISP, NIM, LNE, PTB, EXHM, GLHK, NMIJ, KEBS, KRISS, INACAL, INM, VNIIM, HSA, NMISA, SP, NIMT, INRAP, TUBITAK UME, LGC, NIST and LATU) • 1 institute did not submit the result (Institute: CENAM) • 3 institutes reported two sets of results using different measurement techniques (Institutes: INMETRO, NRC and KRISS)
• 12 institutes registered • 8 institutes submitted the results (Institutes: NIM, GLHK, NMIJ, INM, HSA, TUBITAK UME, LGC and NIST) • 4 institutes did not submit the results (Institutes: NMIA, PTB, VNIIM and SP)
For examination of potassium and copper, most of the participants used microwave-assisted acid digestion methods for sample dissolution. A variety of instrumental techniques including inductively coupled plasma mass spectrometry (ICP-MS), isotope dilution inductively coupled plasma mass spectrometry (ID-ICP-MS), inductively coupled plasma optical emission spectrometry (ICP-OES), atomic absorption spectrometry (AAS), flame atomic emission spectrometry (FAES) and microwave plasma atomic emission spectroscopy (MP-AES) were employed by the participants for determination. For analysis of iodine, most of the participants used alkaline extraction methods for sample preparation. ICP-MS and ID-ICP-MS were used by the participants for the determination. For this key comparison, inorganic core capabilities were demonstrated by the concerned participants with respect to the methods including ICP-MS (without isotope dilution), ID-ICP-MS, ICP-OES, AAS, FAES and MP-AES on the determination of elements (potassium, copper and iodine) in a food matrix of infant formula.
Page 1 of 57
Table of Contents Page
1 Introduction 2 2 Participating Institutes 3 3 Samples and Instructions to Participants 5 3.1 Materials 5 3.2 Homogeneity and Stability Study 5 3.3 Instructions to Participants 7 4 Methods of Measurement 8 5 Results and Discussion 15 5.1 General 15 5.2 Calculation of reference mass fraction values and associated
uncertainties 19
5.3 Equivalence statements 28 6 Demonstration of Core Capabilities 35 7 Conclusion
Acknowledgements 35 36
References 36 Appendix 37
Page 2 of 57
1. Introduction
Infants need optimal nutrition from their diet to grow and stay healthy. The benefits of breastfeeding in ensuring physical and psychosocial health and well-being of mother and child, in particular, the long term health of infants, are widely recognised. Where breastfeeding is not feasible, infant formula is the alternative processed foodstuff which fulfils the nutritional requirements of infants during the first months of life until the introduction of appropriate complementary feeding. To protect the health of infants, many countries have laboratories that carry out the examination of elements in infant formula for regulatory compliance. Analysis of these elements is also performed for nutritional studies (e.g. iodine deficiency in some infant formulae) and quality assurance purpose.
According to the IAWG’s five-year plan, it is recommended to have a key comparison under the measurement service category of food for the year 2015. In this regard, the Government Laboratory, Hong Kong (GLHK) proposed to coordinate a new key comparison and a parallel-run pilot study (CCQM-K125 and CCQM-P159) for the determination of elements in infant formula. At the CCQM IAWG Meeting held in October 2014, the proposed study was agreed by IAWG members to be organised as the fifth benchmarking exercise. It is important for benchmarking to select two exemplary elements which are reasonably easy for many IAWG members to measure. Having further discussed with concerned IAWG members, potassium and copper have been selected as the exemplary elements for examination, whereas iodine is an optional element for analysis. The study is based on the analysis of potassium and copper (exemplary analytes) and iodine (optional analyte) in infant formula. Its aim is to demonstrate the capability of participating national metrology institutes (NMIs) and designated institutes (DIs) in measuring the mass fractions of the analytes at mg/kg levels in a test sample of infant formula by various analytical techniques. The mass fractions of the analytes reported on a dry mass basis will be used for the purpose of comparability. This key comparison facilitates claims by participants on the Calibration and Measurement Capabilities (CMCs) as listed in Appendix C of the Key Comparison Database (KCDB) under the Mutual Recognition Arrangement of the International Committee for Weights and Measures (CIPM MRA). Participants were requested to complete the pertinent Inorganic Core Capabilities Tables as a means of providing evidence for their CMC claims.
Page 3 of 57
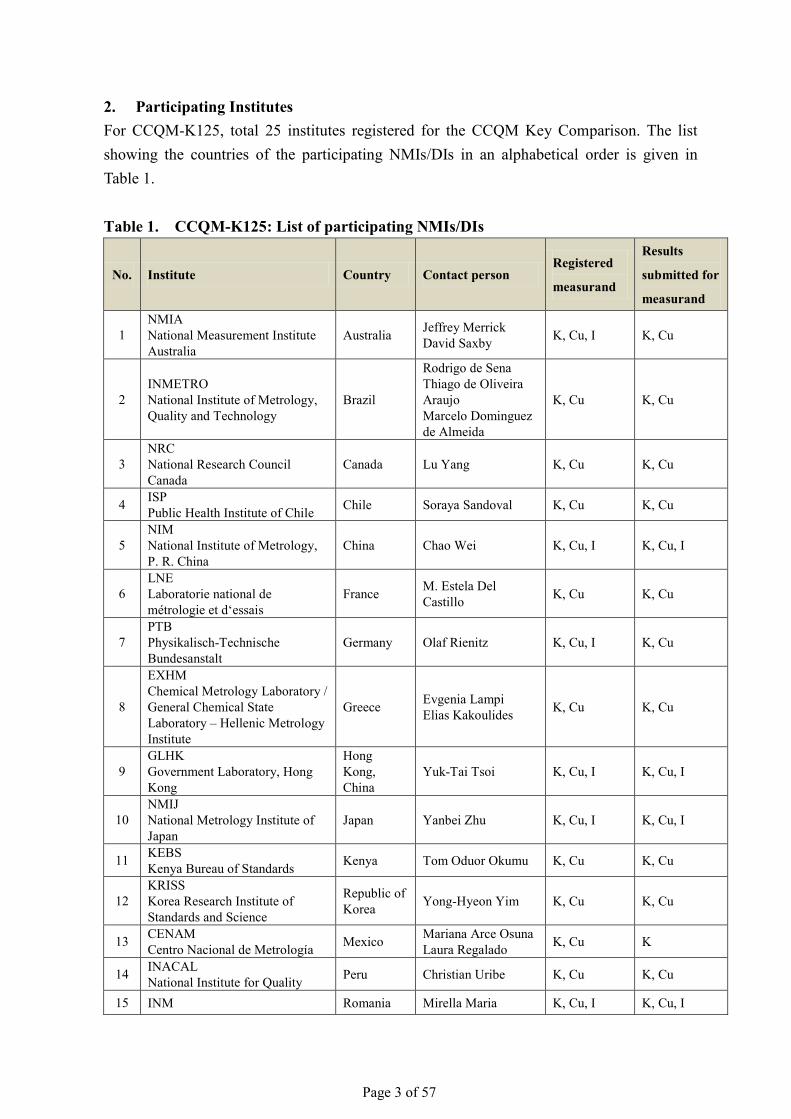
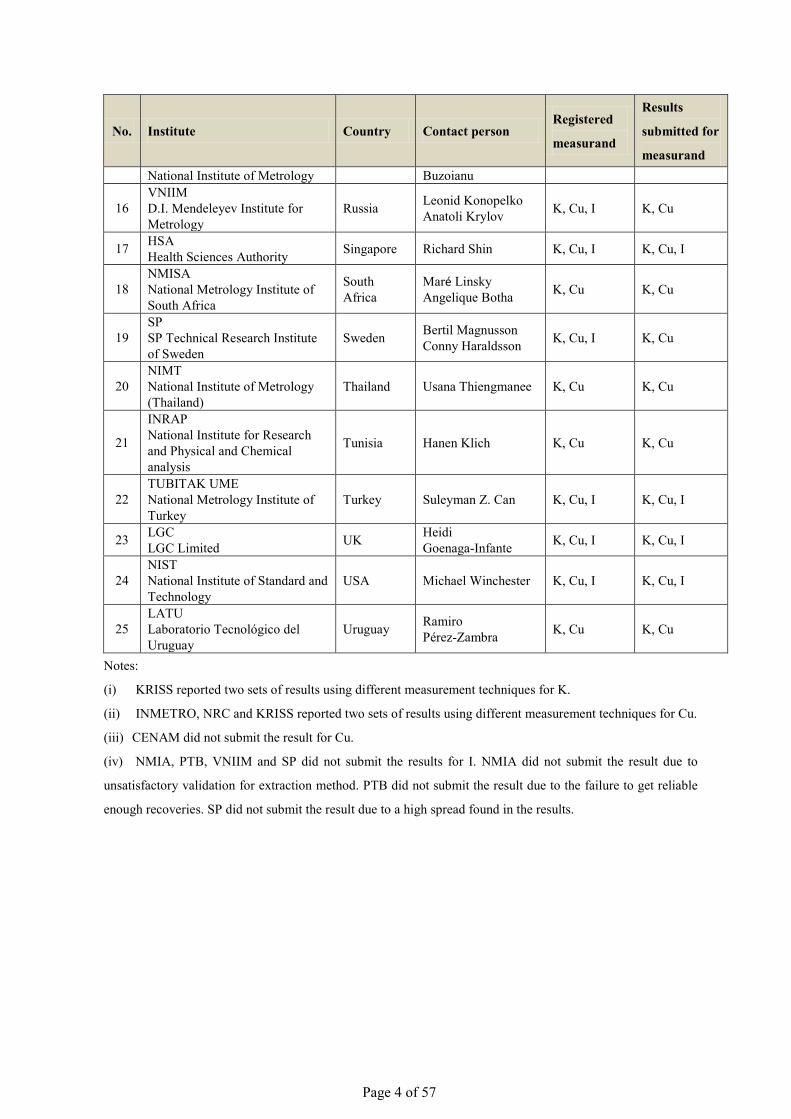
2. Participating Institutes For CCQM-K125, total 25 institutes registered for the CCQM Key Comparison. The list showing the countries of the participating NMIs/DIs in an alphabetical order is given in Table 1.
Table 1. CCQM-K125: List of participating NMIs/DIs
No. Institute Country Contact person Registered
measurand
Results
submitted for
measurand
1 NMIA National Measurement Institute Australia
Australia Jeffrey Merrick David Saxby K, Cu, I K, Cu
2 INMETRO National Institute of Metrology, Quality and Technology
Brazil
Rodrigo de Sena Thiago de Oliveira Araujo Marcelo Dominguez de Almeida
K, Cu K, Cu
3 NRC National Research Council Canada
Canada Lu Yang K, Cu K, Cu
4 ISP Public Health Institute of Chile Chile Soraya Sandoval K, Cu K, Cu
5 NIM National Institute of Metrology, P. R. China
China Chao Wei K, Cu, I K, Cu, I
6 LNE Laboratorie national de métrologie et dʻessais
France M. Estela Del Castillo K, Cu K, Cu
7 PTB Physikalisch-Technische Bundesanstalt
Germany Olaf Rienitz K, Cu, I K, Cu
8
EXHM Chemical Metrology Laboratory / General Chemical State Laboratory – Hellenic Metrology Institute
Greece Evgenia Lampi Elias Kakoulides K, Cu K, Cu
9 GLHK Government Laboratory, Hong Kong
Hong Kong, China
Yuk-Tai Tsoi K, Cu, I K, Cu, I
10 NMIJ National Metrology Institute of Japan
Japan Yanbei Zhu K, Cu, I K, Cu, I
11 KEBS Kenya Bureau of Standards Kenya Tom Oduor Okumu K, Cu K, Cu
12 KRISS Korea Research Institute of Standards and Science
Republic of Korea Yong-Hyeon Yim K, Cu K, Cu
13 CENAM Centro Nacional de Metrología Mexico Mariana Arce Osuna
Laura Regalado K, Cu K
14 INACAL National Institute for Quality Peru Christian Uribe K, Cu K, Cu
15 INM Romania Mirella Maria K, Cu, I K, Cu, I
Page 4 of 57
No. Institute Country Contact person Registered
measurand
Results
submitted for
measurand National Institute of Metrology Buzoianu
16 VNIIM D.I. Mendeleyev Institute for Metrology
Russia Leonid Konopelko Anatoli Krylov K, Cu, I K, Cu
17 HSA Health Sciences Authority Singapore Richard Shin K, Cu, I K, Cu, I
18 NMISA National Metrology Institute of South Africa
South Africa
Maré Linsky Angelique Botha K, Cu K, Cu
19 SP SP Technical Research Institute of Sweden
Sweden Bertil Magnusson Conny Haraldsson K, Cu, I K, Cu
20 NIMT National Institute of Metrology (Thailand)
Thailand Usana Thiengmanee K, Cu K, Cu
21
INRAP National Institute for Research and Physical and Chemical analysis
Tunisia Hanen Klich K, Cu K, Cu
22 TUBITAK UME National Metrology Institute of Turkey
Turkey Suleyman Z. Can K, Cu, I K, Cu, I
23 LGC LGC Limited UK Heidi
Goenaga-Infante K, Cu, I K, Cu, I
24 NIST National Institute of Standard and Technology
USA Michael Winchester K, Cu, I K, Cu, I
25 LATU Laboratorio Tecnológico del Uruguay
Uruguay Ramiro Pérez-Zambra K, Cu K, Cu
Notes:
(i) KRISS reported two sets of results using different measurement techniques for K.
(ii) INMETRO, NRC and KRISS reported two sets of results using different measurement techniques for Cu.
(iii) CENAM did not submit the result for Cu.
(iv) NMIA, PTB, VNIIM and SP did not submit the results for I. NMIA did not submit the result due to
unsatisfactory validation for extraction method. PTB did not submit the result due to the failure to get reliable
enough recoveries. SP did not submit the result due to a high spread found in the results.
Page 5 of 57
3. Samples and Instructions to Participants
3.1. Materials
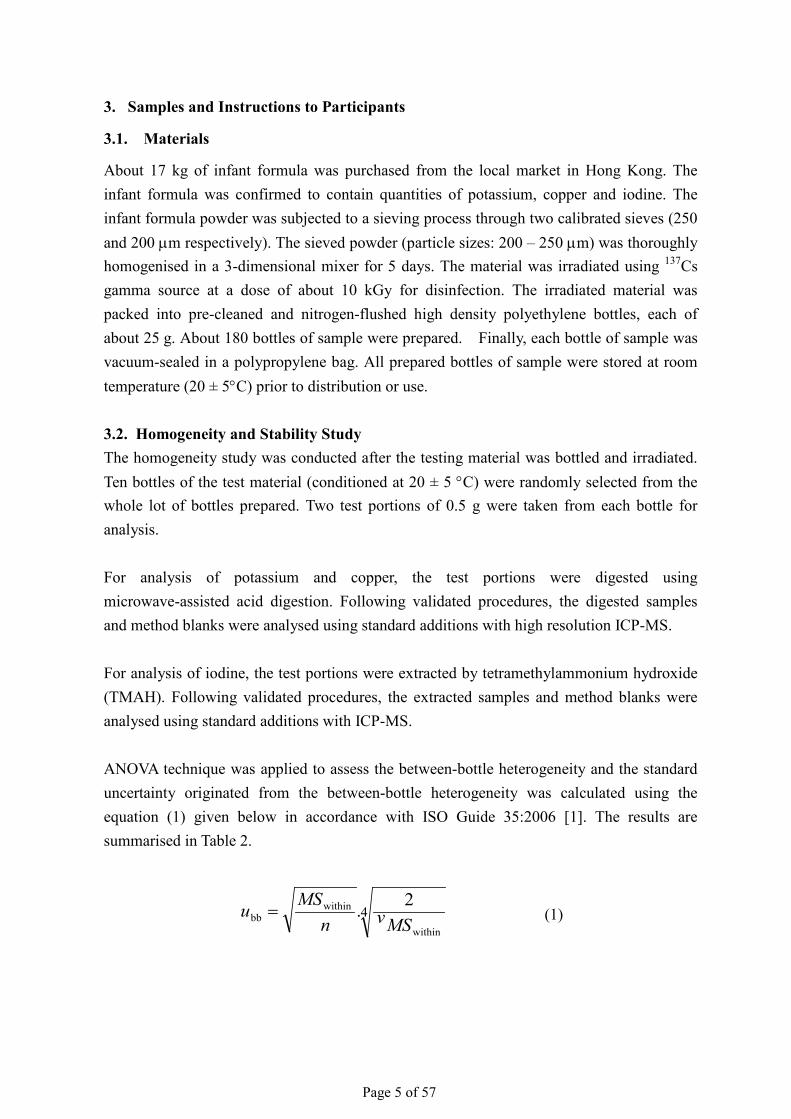
About 17 kg of infant formula was purchased from the local market in Hong Kong. The infant formula was confirmed to contain quantities of potassium, copper and iodine. The infant formula powder was subjected to a sieving process through two calibrated sieves (250 and 200 µm respectively). The sieved powder (particle sizes: 200 – 250 µm) was thoroughly homogenised in a 3-dimensional mixer for 5 days. The material was irradiated using 137Cs gamma source at a dose of about 10 kGy for disinfection. The irradiated material was packed into pre-cleaned and nitrogen-flushed high density polyethylene bottles, each of about 25 g. About 180 bottles of sample were prepared. Finally, each bottle of sample was vacuum-sealed in a polypropylene bag. All prepared bottles of sample were stored at room temperature (20 ± 5°C) prior to distribution or use. 3.2. Homogeneity and Stability Study The homogeneity study was conducted after the testing material was bottled and irradiated. Ten bottles of the test material (conditioned at 20 ± 5 °C) were randomly selected from the whole lot of bottles prepared. Two test portions of 0.5 g were taken from each bottle for analysis. For analysis of potassium and copper, the test portions were digested using microwave-assisted acid digestion. Following validated procedures, the digested samples and method blanks were analysed using standard additions with high resolution ICP-MS. For analysis of iodine, the test portions were extracted by tetramethylammonium hydroxide (TMAH). Following validated procedures, the extracted samples and method blanks were analysed using standard additions with ICP-MS. ANOVA technique was applied to assess the between-bottle heterogeneity and the standard uncertainty originated from the between-bottle heterogeneity was calculated using the equation (1) given below in accordance with ISO Guide 35:2006 [1]. The results are summarised in Table 2.
4within
withinbb
2.MSνn
MSu = (1)
Page 6 of 57
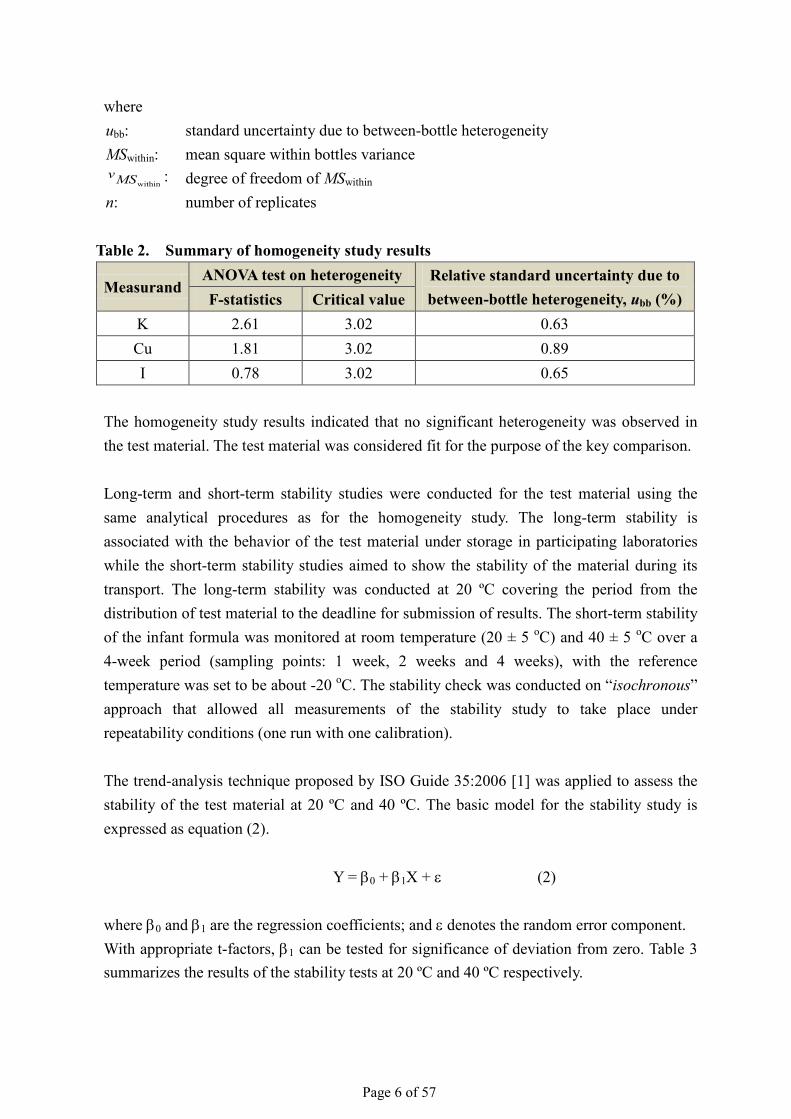
where ubb: standard uncertainty due to between-bottle heterogeneity MSwithin: mean square within bottles variance
withinMSν : degree of freedom of MSwithin n: number of replicates
Table 2. Summary of homogeneity study results
Measurand ANOVA test on heterogeneity Relative standard uncertainty due to
between-bottle heterogeneity, ubb (%) F-statistics Critical value K 2.61 3.02 0.63 Cu 1.81 3.02 0.89 I 0.78 3.02 0.65
The homogeneity study results indicated that no significant heterogeneity was observed in the test material. The test material was considered fit for the purpose of the key comparison. Long-term and short-term stability studies were conducted for the test material using the same analytical procedures as for the homogeneity study. The long-term stability is associated with the behavior of the test material under storage in participating laboratories while the short-term stability studies aimed to show the stability of the material during its transport. The long-term stability was conducted at 20 ºC covering the period from the distribution of test material to the deadline for submission of results. The short-term stability of the infant formula was monitored at room temperature (20 ± 5 oC) and 40 ± 5 oC over a 4-week period (sampling points: 1 week, 2 weeks and 4 weeks), with the reference temperature was set to be about -20 oC. The stability check was conducted on “isochronous” approach that allowed all measurements of the stability study to take place under repeatability conditions (one run with one calibration). The trend-analysis technique proposed by ISO Guide 35:2006 [1] was applied to assess the stability of the test material at 20 ºC and 40 ºC. The basic model for the stability study is expressed as equation (2).
Y = β0 + β1X + ε (2) where β0 and β1 are the regression coefficients; and ε denotes the random error component. With appropriate t-factors, β1 can be tested for significance of deviation from zero. Table 3 summarizes the results of the stability tests at 20 ºC and 40 ºC respectively.
Page 7 of 57
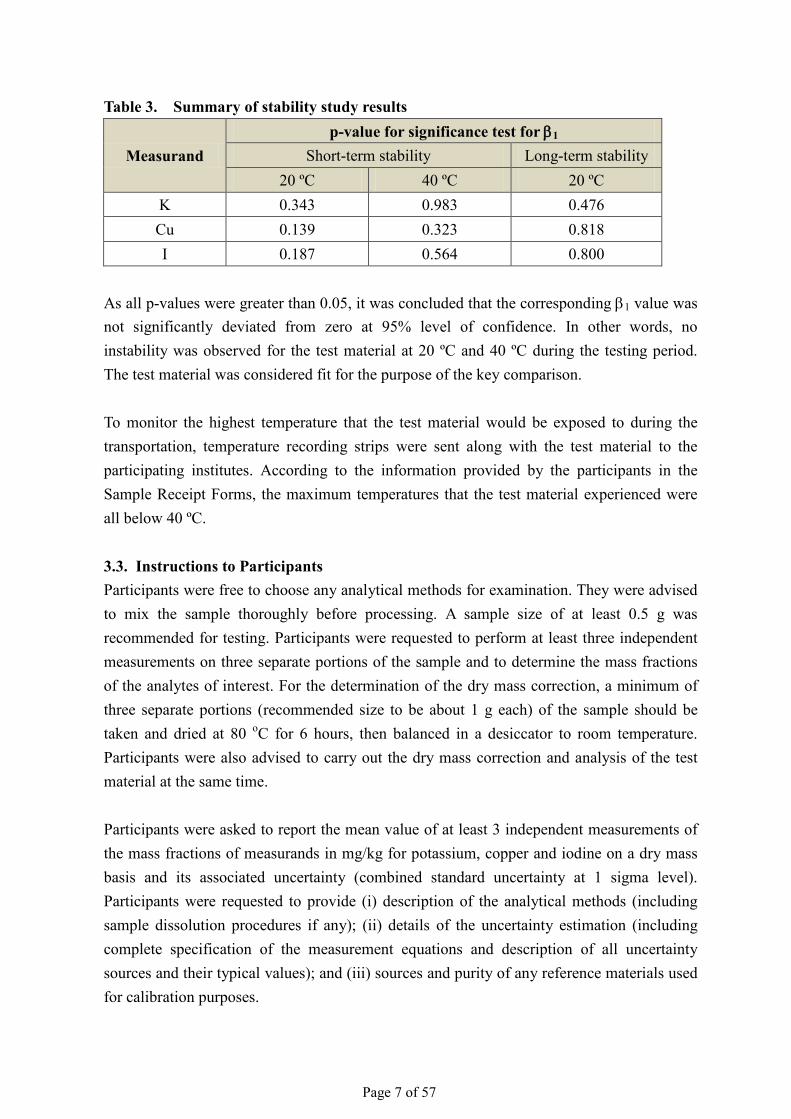
Table 3. Summary of stability study results
Measurand p-value for significance test for β1
Short-term stability Long-term stability 20 ºC 40 ºC 20 ºC
K 0.343 0.983 0.476 Cu 0.139 0.323 0.818 I 0.187 0.564 0.800
As all p-values were greater than 0.05, it was concluded that the corresponding β1 value was not significantly deviated from zero at 95% level of confidence. In other words, no instability was observed for the test material at 20 ºC and 40 ºC during the testing period. The test material was considered fit for the purpose of the key comparison. To monitor the highest temperature that the test material would be exposed to during the transportation, temperature recording strips were sent along with the test material to the participating institutes. According to the information provided by the participants in the Sample Receipt Forms, the maximum temperatures that the test material experienced were all below 40 ºC. 3.3. Instructions to Participants Participants were free to choose any analytical methods for examination. They were advised to mix the sample thoroughly before processing. A sample size of at least 0.5 g was recommended for testing. Participants were requested to perform at least three independent measurements on three separate portions of the sample and to determine the mass fractions of the analytes of interest. For the determination of the dry mass correction, a minimum of three separate portions (recommended size to be about 1 g each) of the sample should be taken and dried at 80 oC for 6 hours, then balanced in a desiccator to room temperature. Participants were also advised to carry out the dry mass correction and analysis of the test material at the same time. Participants were asked to report the mean value of at least 3 independent measurements of the mass fractions of measurands in mg/kg for potassium, copper and iodine on a dry mass basis and its associated uncertainty (combined standard uncertainty at 1 sigma level). Participants were requested to provide (i) description of the analytical methods (including sample dissolution procedures if any); (ii) details of the uncertainty estimation (including complete specification of the measurement equations and description of all uncertainty sources and their typical values); and (iii) sources and purity of any reference materials used for calibration purposes.
Page 8 of 57
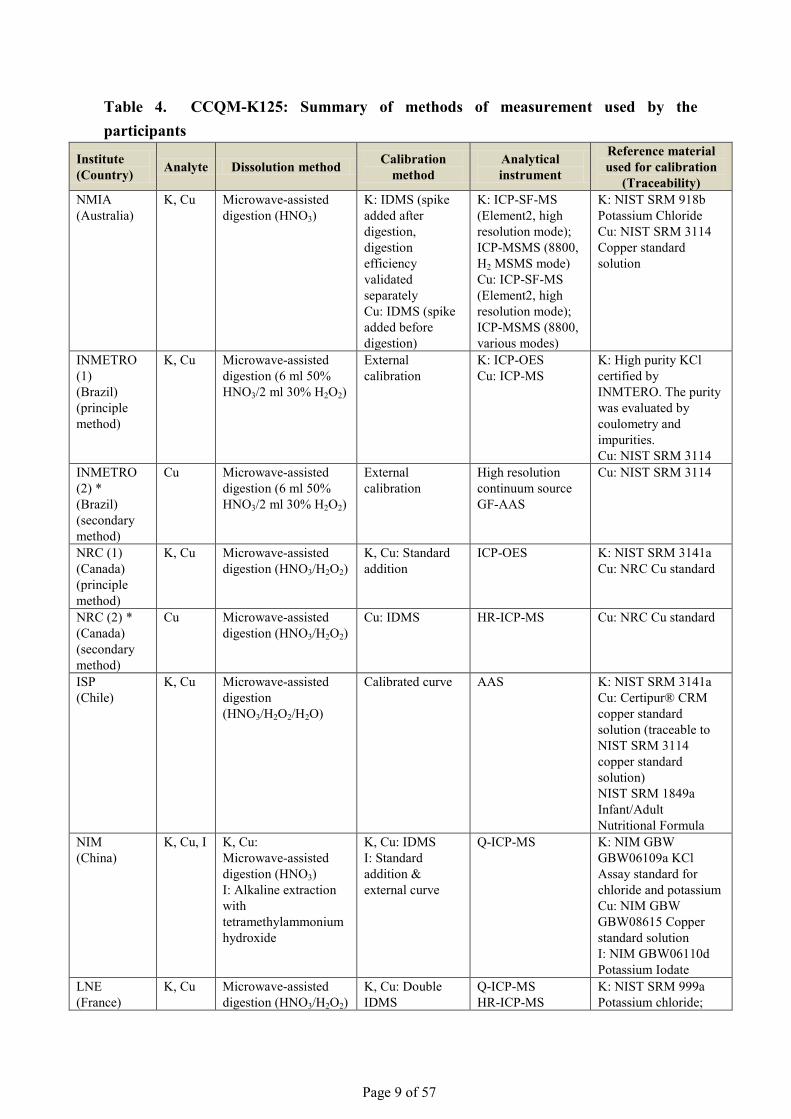
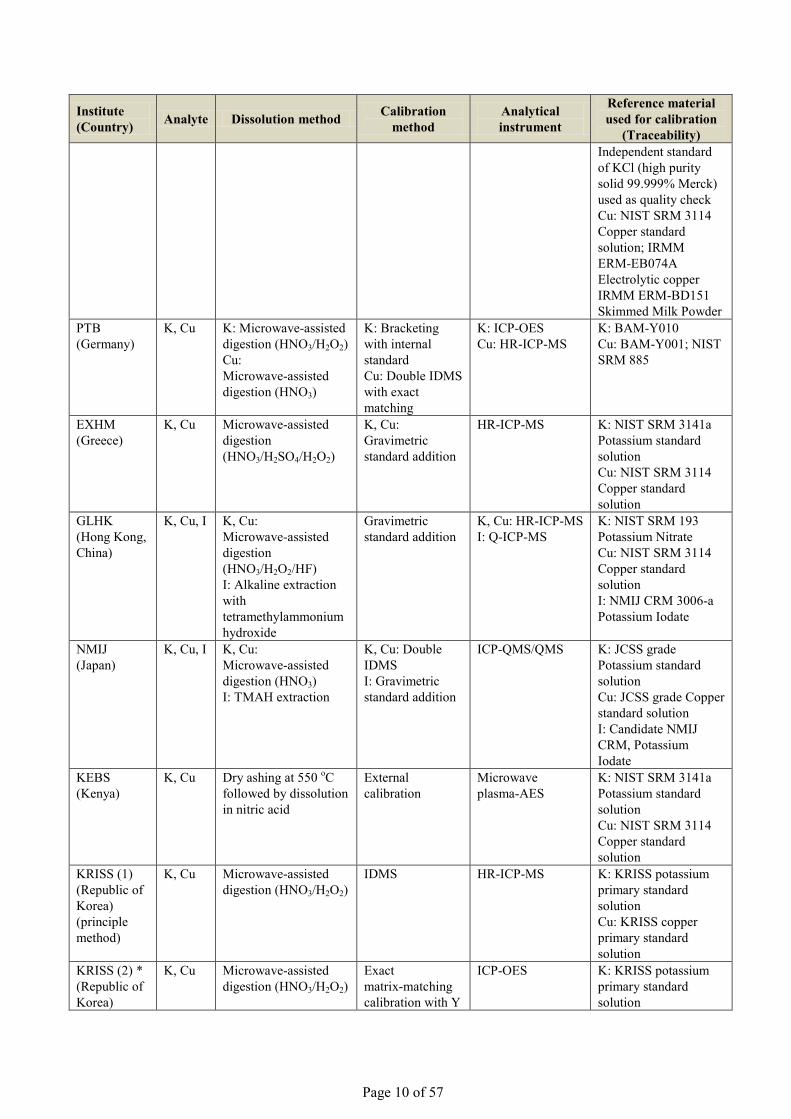
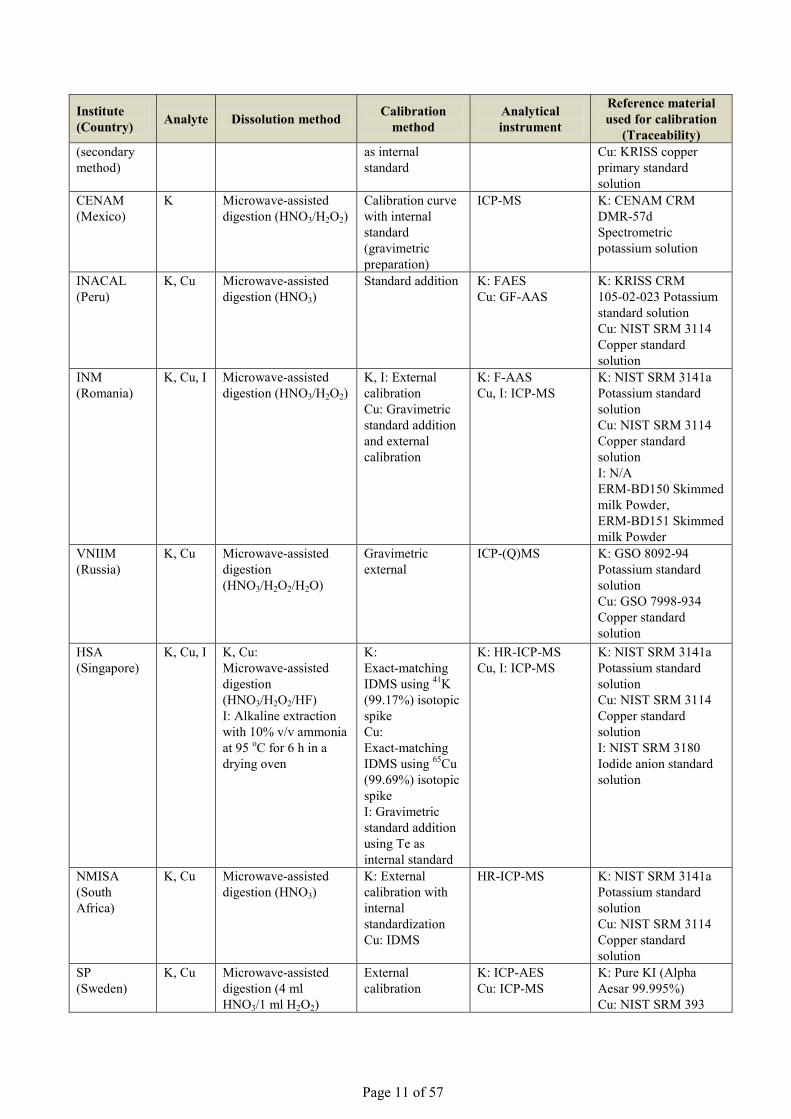
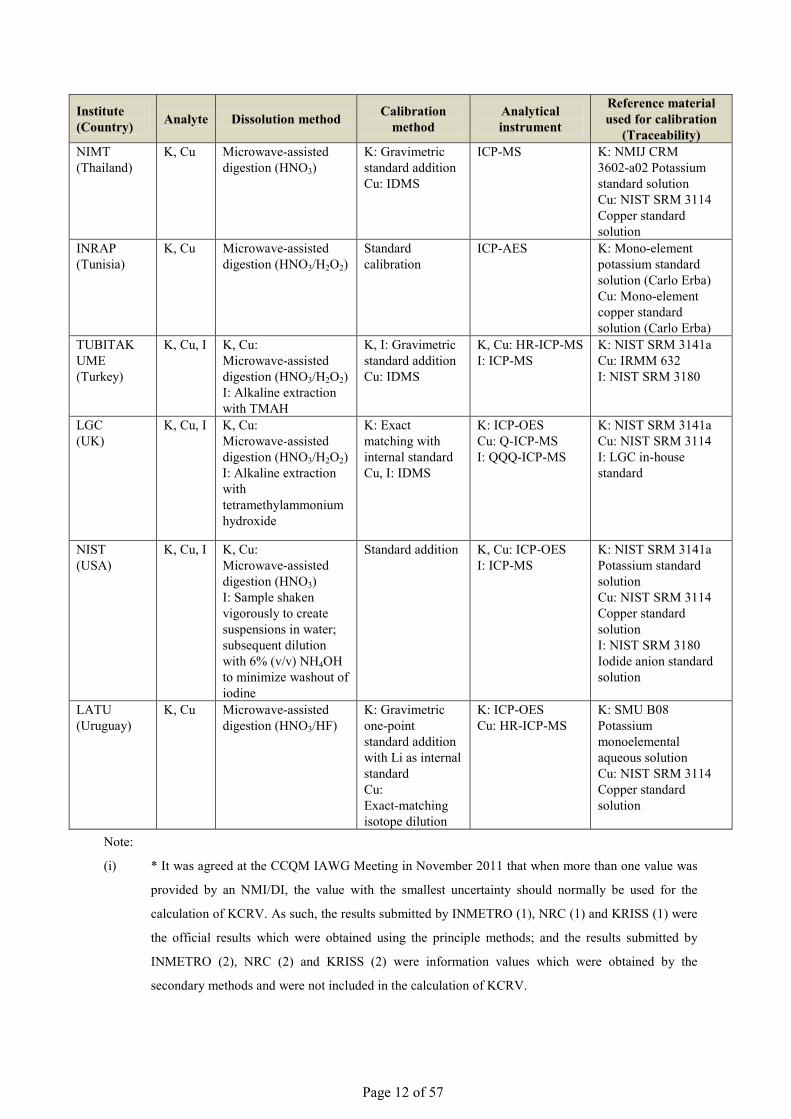
4. Methods of Measurement For examination of potassium and copper, most of the participants used microwave-assisted acid digestion methods for sample dissolution. A variety of instrumental techniques including inductively coupled plasma mass spectrometry (ICP-MS), isotope dilution inductively coupled plasma mass spectrometry (ID-ICP-MS), inductively coupled plasma optical emission spectrometry (ICP-OES), atomic absorption spectrometry (AAS), flame atomic emission spectrometry (FAES) and microwave plasma atomic emission spectroscopy (MP-AES) were employed by the participants for determination. For analysis of iodine, most of the participants used alkaline extraction methods for sample preparation. ICP-MS and ID-ICP-MS were used by the participants for determination. For CCQM-K125, the methods of measurement used by the participants are summarised in Table 4, and the information about dry mass correction is shown in Table 5.
Page 9 of 57
Table 4. CCQM-K125: Summary of methods of measurement used by the participants
Institute (Country) Analyte Dissolution method Calibration
method Analytical instrument
Reference material used for calibration
(Traceability) NMIA (Australia)
K, Cu Microwave-assisted digestion (HNO3)
K: IDMS (spike added after digestion, digestion efficiency validated separately Cu: IDMS (spike added before digestion)
K: ICP-SF-MS (Element2, high resolution mode); ICP-MSMS (8800, H2 MSMS mode) Cu: ICP-SF-MS (Element2, high resolution mode); ICP-MSMS (8800, various modes)
K: NIST SRM 918b Potassium Chloride Cu: NIST SRM 3114 Copper standard solution
INMETRO (1) (Brazil) (principle method)
K, Cu Microwave-assisted digestion (6 ml 50% HNO3/2 ml 30% H2O2)
External calibration
K: ICP-OES Cu: ICP-MS
K: High purity KCl certified by INMTERO. The purity was evaluated by coulometry and impurities. Cu: NIST SRM 3114
INMETRO (2) * (Brazil) (secondary method)
Cu Microwave-assisted digestion (6 ml 50% HNO3/2 ml 30% H2O2)
External calibration
High resolution continuum source GF-AAS
Cu: NIST SRM 3114
NRC (1) (Canada) (principle method)
K, Cu Microwave-assisted digestion (HNO3/H2O2)
K, Cu: Standard addition
ICP-OES
K: NIST SRM 3141a Cu: NRC Cu standard
NRC (2) * (Canada) (secondary method)
Cu Microwave-assisted digestion (HNO3/H2O2)
Cu: IDMS HR-ICP-MS
Cu: NRC Cu standard
ISP (Chile)
K, Cu Microwave-assisted digestion (HNO3/H2O2/H2O)
Calibrated curve AAS K: NIST SRM 3141a Cu: Certipur® CRM copper standard solution (traceable to NIST SRM 3114 copper standard solution) NIST SRM 1849a Infant/Adult Nutritional Formula
NIM (China)
K, Cu, I K, Cu: Microwave-assisted digestion (HNO3) I: Alkaline extraction with tetramethylammonium hydroxide
K, Cu: IDMS I: Standard addition & external curve
Q-ICP-MS K: NIM GBW GBW06109a KCl Assay standard for chloride and potassium Cu: NIM GBW GBW08615 Copper standard solution I: NIM GBW06110d Potassium Iodate
LNE (France)
K, Cu Microwave-assisted digestion (HNO3/H2O2)
K, Cu: Double IDMS
Q-ICP-MS HR-ICP-MS
K: NIST SRM 999a Potassium chloride;
Page 10 of 57
Institute (Country) Analyte Dissolution method Calibration
method Analytical instrument
Reference material used for calibration
(Traceability) Independent standard of KCl (high purity solid 99.999% Merck) used as quality check Cu: NIST SRM 3114 Copper standard solution; IRMM ERM-EB074A Electrolytic copper IRMM ERM-BD151 Skimmed Milk Powder
PTB (Germany)
K, Cu K: Microwave-assisted digestion (HNO3/H2O2) Cu: Microwave-assisted digestion (HNO3)
K: Bracketing with internal standard Cu: Double IDMS with exact matching
K: ICP-OES Cu: HR-ICP-MS
K: BAM-Y010 Cu: BAM-Y001; NIST SRM 885
EXHM (Greece)
K, Cu Microwave-assisted digestion (HNO3/H2SO4/H2O2)
K, Cu: Gravimetric standard addition
HR-ICP-MS K: NIST SRM 3141a Potassium standard solution Cu: NIST SRM 3114 Copper standard solution
GLHK (Hong Kong, China)
K, Cu, I K, Cu: Microwave-assisted digestion (HNO3/H2O2/HF) I: Alkaline extraction with tetramethylammonium hydroxide
Gravimetric standard addition
K, Cu: HR-ICP-MS I: Q-ICP-MS
K: NIST SRM 193 Potassium Nitrate Cu: NIST SRM 3114 Copper standard solution I: NMIJ CRM 3006-a Potassium Iodate
NMIJ (Japan)
K, Cu, I K, Cu: Microwave-assisted digestion (HNO3) I: TMAH extraction
K, Cu: Double IDMS I: Gravimetric standard addition
ICP-QMS/QMS K: JCSS grade Potassium standard solution Cu: JCSS grade Copper standard solution I: Candidate NMIJ CRM, Potassium Iodate
KEBS (Kenya)
K, Cu Dry ashing at 550 oC followed by dissolution in nitric acid
External calibration
Microwave plasma-AES
K: NIST SRM 3141a Potassium standard solution Cu: NIST SRM 3114 Copper standard solution
KRISS (1) (Republic of Korea) (principle method)
K, Cu Microwave-assisted digestion (HNO3/H2O2)
IDMS HR-ICP-MS
K: KRISS potassium primary standard solution Cu: KRISS copper primary standard solution
KRISS (2) * (Republic of Korea)
K, Cu Microwave-assisted digestion (HNO3/H2O2)
Exact matrix-matching calibration with Y
ICP-OES
K: KRISS potassium primary standard solution
Page 11 of 57
Institute (Country) Analyte Dissolution method Calibration
method Analytical instrument
Reference material used for calibration
(Traceability) (secondary method)
as internal standard
Cu: KRISS copper primary standard solution
CENAM (Mexico)
K Microwave-assisted digestion (HNO3/H2O2)
Calibration curve with internal standard (gravimetric preparation)
ICP-MS K: CENAM CRM DMR-57d Spectrometric potassium solution
INACAL (Peru)
K, Cu Microwave-assisted digestion (HNO3)
Standard addition K: FAES Cu: GF-AAS
K: KRISS CRM 105-02-023 Potassium standard solution Cu: NIST SRM 3114 Copper standard solution
INM (Romania)
K, Cu, I Microwave-assisted digestion (HNO3/H2O2)
K, I: External calibration Cu: Gravimetric standard addition and external calibration
K: F-AAS Cu, I: ICP-MS
K: NIST SRM 3141a Potassium standard solution Cu: NIST SRM 3114 Copper standard solution I: N/A ERM-BD150 Skimmed milk Powder, ERM-BD151 Skimmed milk Powder
VNIIM (Russia)
K, Cu Microwave-assisted digestion (HNO3/H2O2/H2O)
Gravimetric external
ICP-(Q)MS K: GSO 8092-94 Potassium standard solution Cu: GSO 7998-934 Copper standard solution
HSA (Singapore)
K, Cu, I K, Cu: Microwave-assisted digestion (HNO3/H2O2/HF) I: Alkaline extraction with 10% v/v ammonia at 95 oC for 6 h in a drying oven
K: Exact-matching IDMS using 41K (99.17%) isotopic spike Cu: Exact-matching IDMS using 65Cu (99.69%) isotopic spike I: Gravimetric standard addition using Te as internal standard
K: HR-ICP-MS Cu, I: ICP-MS
K: NIST SRM 3141a Potassium standard solution Cu: NIST SRM 3114 Copper standard solution I: NIST SRM 3180 Iodide anion standard solution
NMISA (South Africa)
K, Cu Microwave-assisted digestion (HNO3)
K: External calibration with internal standardization Cu: IDMS
HR-ICP-MS K: NIST SRM 3141a Potassium standard solution Cu: NIST SRM 3114 Copper standard solution
SP (Sweden)
K, Cu Microwave-assisted digestion (4 ml HNO3/1 ml H2O2)
External calibration
K: ICP-AES Cu: ICP-MS
K: Pure KI (Alpha Aesar 99.995%) Cu: NIST SRM 393
Page 12 of 57
Institute (Country) Analyte Dissolution method Calibration
method Analytical instrument
Reference material used for calibration
(Traceability) NIMT (Thailand)
K, Cu Microwave-assisted digestion (HNO3)
K: Gravimetric standard addition Cu: IDMS
ICP-MS K: NMIJ CRM 3602-a02 Potassium standard solution Cu: NIST SRM 3114 Copper standard solution
INRAP (Tunisia)
K, Cu Microwave-assisted digestion (HNO3/H2O2)
Standard calibration
ICP-AES K: Mono-element potassium standard solution (Carlo Erba) Cu: Mono-element copper standard solution (Carlo Erba)
TUBITAK UME (Turkey)
K, Cu, I K, Cu: Microwave-assisted digestion (HNO3/H2O2) I: Alkaline extraction with TMAH
K, I: Gravimetric standard addition Cu: IDMS
K, Cu: HR-ICP-MS I: ICP-MS
K: NIST SRM 3141a Cu: IRMM 632 I: NIST SRM 3180
LGC (UK)
K, Cu, I K, Cu: Microwave-assisted digestion (HNO3/H2O2) I: Alkaline extraction with tetramethylammonium hydroxide
K: Exact matching with internal standard Cu, I: IDMS
K: ICP-OES Cu: Q-ICP-MS I: QQQ-ICP-MS
K: NIST SRM 3141a Cu: NIST SRM 3114 I: LGC in-house standard
NIST (USA)
K, Cu, I K, Cu: Microwave-assisted digestion (HNO3) I: Sample shaken vigorously to create suspensions in water; subsequent dilution with 6% (v/v) NH4OH to minimize washout of iodine
Standard addition K, Cu: ICP-OES I: ICP-MS
K: NIST SRM 3141a Potassium standard solution Cu: NIST SRM 3114 Copper standard solution I: NIST SRM 3180 Iodide anion standard solution
LATU (Uruguay)
K, Cu Microwave-assisted digestion (HNO3/HF)
K: Gravimetric one-point standard addition with Li as internal standard Cu: Exact-matching isotope dilution
K: ICP-OES Cu: HR-ICP-MS
K: SMU B08 Potassium monoelemental aqueous solution Cu: NIST SRM 3114 Copper standard solution
Note:
(i) * It was agreed at the CCQM IAWG Meeting in November 2011 that when more than one value was
provided by an NMI/DI, the value with the smallest uncertainty should normally be used for the
calculation of KCRV. As such, the results submitted by INMETRO (1), NRC (1) and KRISS (1) were
the official results which were obtained using the principle methods; and the results submitted by
INMETRO (2), NRC (2) and KRISS (2) were information values which were obtained by the
secondary methods and were not included in the calculation of KCRV.
Page 13 of 57
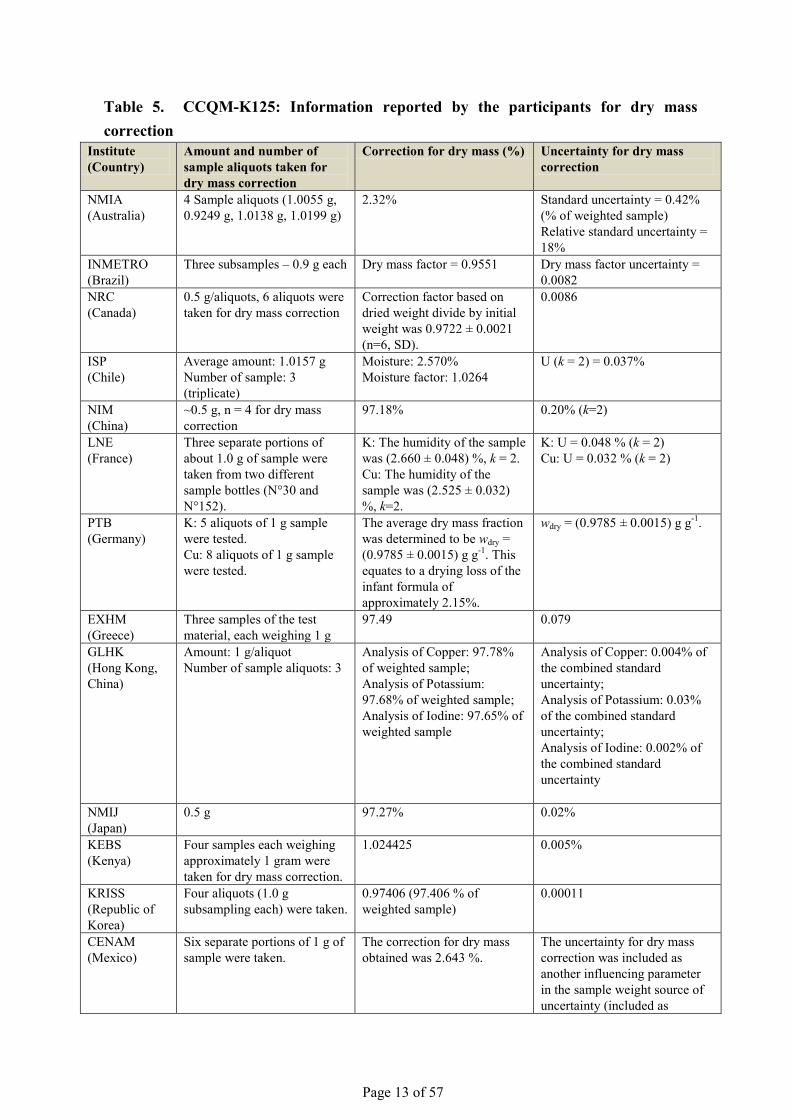
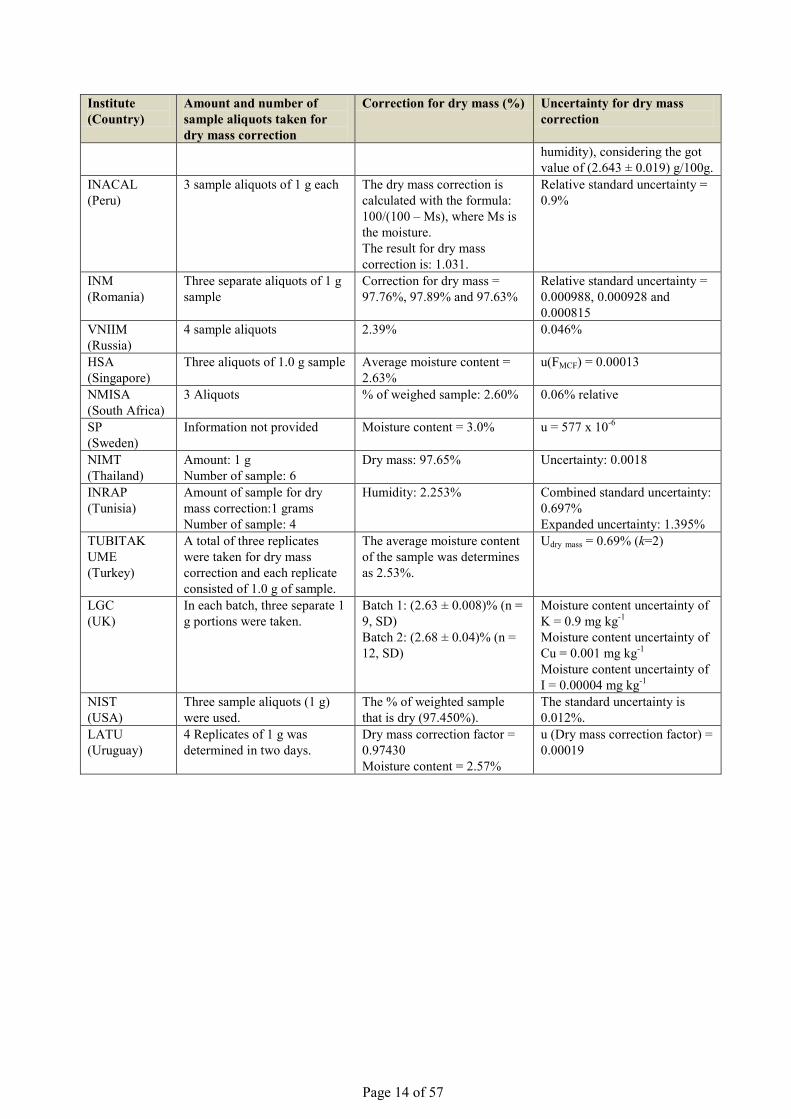
Table 5. CCQM-K125: Information reported by the participants for dry mass correction
Institute (Country)
Amount and number of sample aliquots taken for dry mass correction
Correction for dry mass (%) Uncertainty for dry mass correction
NMIA (Australia)
4 Sample aliquots (1.0055 g, 0.9249 g, 1.0138 g, 1.0199 g)
2.32% Standard uncertainty = 0.42% (% of weighted sample) Relative standard uncertainty = 18%
INMETRO (Brazil)
Three subsamples – 0.9 g each Dry mass factor = 0.9551 Dry mass factor uncertainty = 0.0082
NRC (Canada)
0.5 g/aliquots, 6 aliquots were taken for dry mass correction
Correction factor based on dried weight divide by initial weight was 0.9722 ± 0.0021 (n=6, SD).
0.0086
ISP (Chile)
Average amount: 1.0157 g Number of sample: 3 (triplicate)
Moisture: 2.570% Moisture factor: 1.0264
U (k = 2) = 0.037%
NIM (China)
~0.5 g, n = 4 for dry mass correction
97.18% 0.20% (k=2)
LNE (France)
Three separate portions of about 1.0 g of sample were taken from two different sample bottles (N°30 and N°152).
K: The humidity of the sample was (2.660 ± 0.048) %, k = 2. Cu: The humidity of the sample was (2.525 ± 0.032) %, k=2.
K: U = 0.048 % (k = 2) Cu: U = 0.032 % (k = 2)
PTB (Germany)
K: 5 aliquots of 1 g sample were tested. Cu: 8 aliquots of 1 g sample were tested.
The average dry mass fraction was determined to be wdry = (0.9785 ± 0.0015) g g-1. This equates to a drying loss of the infant formula of approximately 2.15%.
wdry = (0.9785 ± 0.0015) g g-1.
EXHM (Greece)
Three samples of the test material, each weighing 1 g
97.49 0.079
GLHK (Hong Kong, China)
Amount: 1 g/aliquot Number of sample aliquots: 3
Analysis of Copper: 97.78% of weighted sample; Analysis of Potassium: 97.68% of weighted sample; Analysis of Iodine: 97.65% of weighted sample
Analysis of Copper: 0.004% of the combined standard uncertainty; Analysis of Potassium: 0.03% of the combined standard uncertainty; Analysis of Iodine: 0.002% of the combined standard uncertainty
NMIJ (Japan)
0.5 g 97.27% 0.02%
KEBS (Kenya)
Four samples each weighing approximately 1 gram were taken for dry mass correction.
1.024425 0.005%
KRISS (Republic of Korea)
Four aliquots (1.0 g subsampling each) were taken.
0.97406 (97.406 % of weighted sample)
0.00011
CENAM (Mexico)
Six separate portions of 1 g of sample were taken.
The correction for dry mass obtained was 2.643 %.
The uncertainty for dry mass correction was included as another influencing parameter in the sample weight source of uncertainty (included as
Page 14 of 57
Institute (Country)
Amount and number of sample aliquots taken for dry mass correction
Correction for dry mass (%) Uncertainty for dry mass correction
humidity), considering the got value of (2.643 ± 0.019) g/100g.
INACAL (Peru)
3 sample aliquots of 1 g each The dry mass correction is calculated with the formula: 100/(100 – Ms), where Ms is the moisture. The result for dry mass correction is: 1.031.
Relative standard uncertainty = 0.9%
INM (Romania)
Three separate aliquots of 1 g sample
Correction for dry mass = 97.76%, 97.89% and 97.63%
Relative standard uncertainty = 0.000988, 0.000928 and 0.000815
VNIIM (Russia)
4 sample aliquots 2.39% 0.046%
HSA (Singapore)
Three aliquots of 1.0 g sample Average moisture content = 2.63%
u(FMCF) = 0.00013
NMISA (South Africa)
3 Aliquots % of weighed sample: 2.60% 0.06% relative
SP (Sweden)
Information not provided Moisture content = 3.0% u = 577 x 10-6
NIMT (Thailand)
Amount: 1 g Number of sample: 6
Dry mass: 97.65% Uncertainty: 0.0018
INRAP (Tunisia)
Amount of sample for dry mass correction:1 grams Number of sample: 4
Humidity: 2.253% Combined standard uncertainty: 0.697% Expanded uncertainty: 1.395%
TUBITAK UME (Turkey)
A total of three replicates were taken for dry mass correction and each replicate consisted of 1.0 g of sample.
The average moisture content of the sample was determines as 2.53%.
Udry mass = 0.69% (k=2)
LGC (UK)
In each batch, three separate 1 g portions were taken.
Batch 1: (2.63 ± 0.008)% (n = 9, SD) Batch 2: (2.68 ± 0.04)% (n = 12, SD)
Moisture content uncertainty of K = 0.9 mg kg-1
Moisture content uncertainty of Cu = 0.001 mg kg-1
Moisture content uncertainty of I = 0.00004 mg kg-1
NIST (USA)
Three sample aliquots (1 g) were used.
The % of weighted sample that is dry (97.450%).
The standard uncertainty is 0.012%.
LATU (Uruguay)
4 Replicates of 1 g was determined in two days.
Dry mass correction factor = 0.97430 Moisture content = 2.57%
u (Dry mass correction factor) = 0.00019
Page 15 of 57
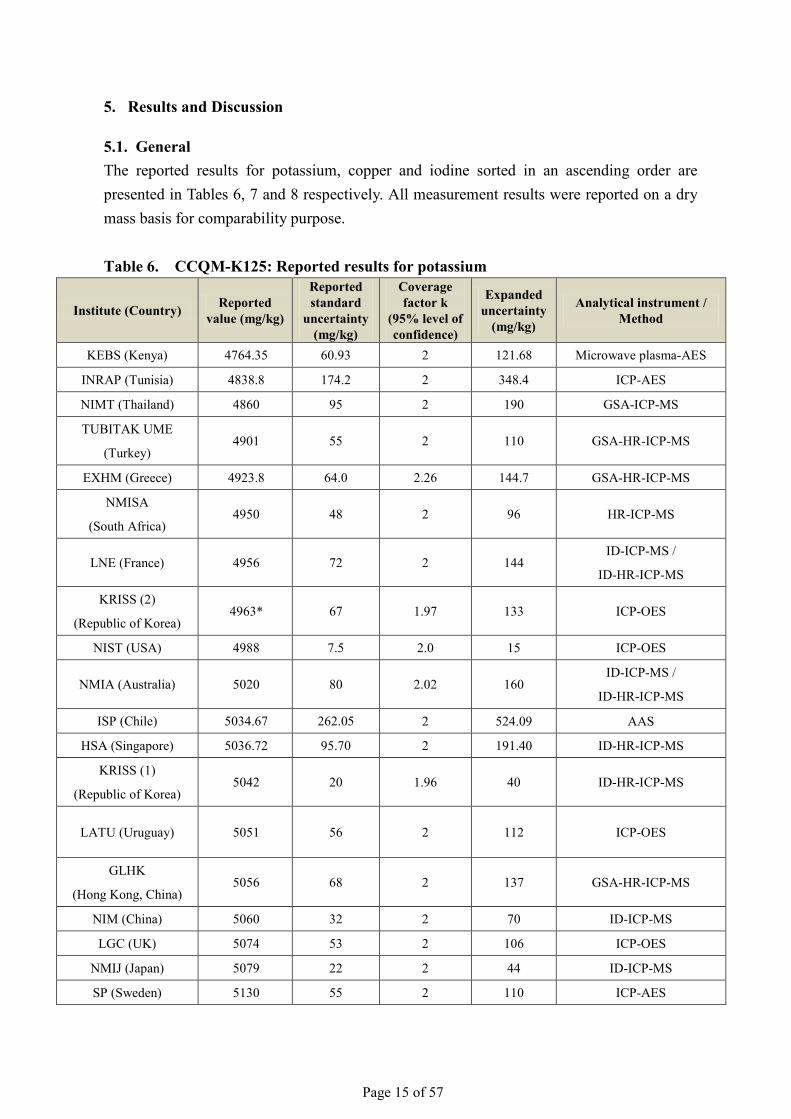
5. Results and Discussion
5.1. General The reported results for potassium, copper and iodine sorted in an ascending order are presented in Tables 6, 7 and 8 respectively. All measurement results were reported on a dry mass basis for comparability purpose. Table 6. CCQM-K125: Reported results for potassium
Institute (Country) Reported value (mg/kg)
Reported standard
uncertainty (mg/kg)
Coverage factor k
(95% level of confidence)
Expanded uncertainty
(mg/kg)
Analytical instrument / Method
KEBS (Kenya) 4764.35 60.93 2 121.68 Microwave plasma-AES
INRAP (Tunisia) 4838.8 174.2 2 348.4 ICP-AES
NIMT (Thailand) 4860 95 2 190 GSA-ICP-MS
TUBITAK UME
(Turkey) 4901 55 2 110 GSA-HR-ICP-MS
EXHM (Greece) 4923.8 64.0 2.26 144.7 GSA-HR-ICP-MS
NMISA
(South Africa) 4950 48 2 96 HR-ICP-MS
LNE (France) 4956 72 2 144 ID-ICP-MS /
ID-HR-ICP-MS
KRISS (2)
(Republic of Korea) 4963* 67 1.97 133 ICP-OES
NIST (USA) 4988 7.5 2.0 15 ICP-OES
NMIA (Australia) 5020 80 2.02 160 ID-ICP-MS /
ID-HR-ICP-MS
ISP (Chile) 5034.67 262.05 2 524.09 AAS
HSA (Singapore) 5036.72 95.70 2 191.40 ID-HR-ICP-MS
KRISS (1)
(Republic of Korea) 5042 20 1.96 40 ID-HR-ICP-MS
LATU (Uruguay) 5051 56 2 112 ICP-OES
GLHK
(Hong Kong, China) 5056 68 2 137 GSA-HR-ICP-MS
NIM (China) 5060 32 2 70 ID-ICP-MS
LGC (UK) 5074 53 2 106 ICP-OES
NMIJ (Japan) 5079 22 2 44 ID-ICP-MS
SP (Sweden) 5130 55 2 110 ICP-AES
Page 16 of 57
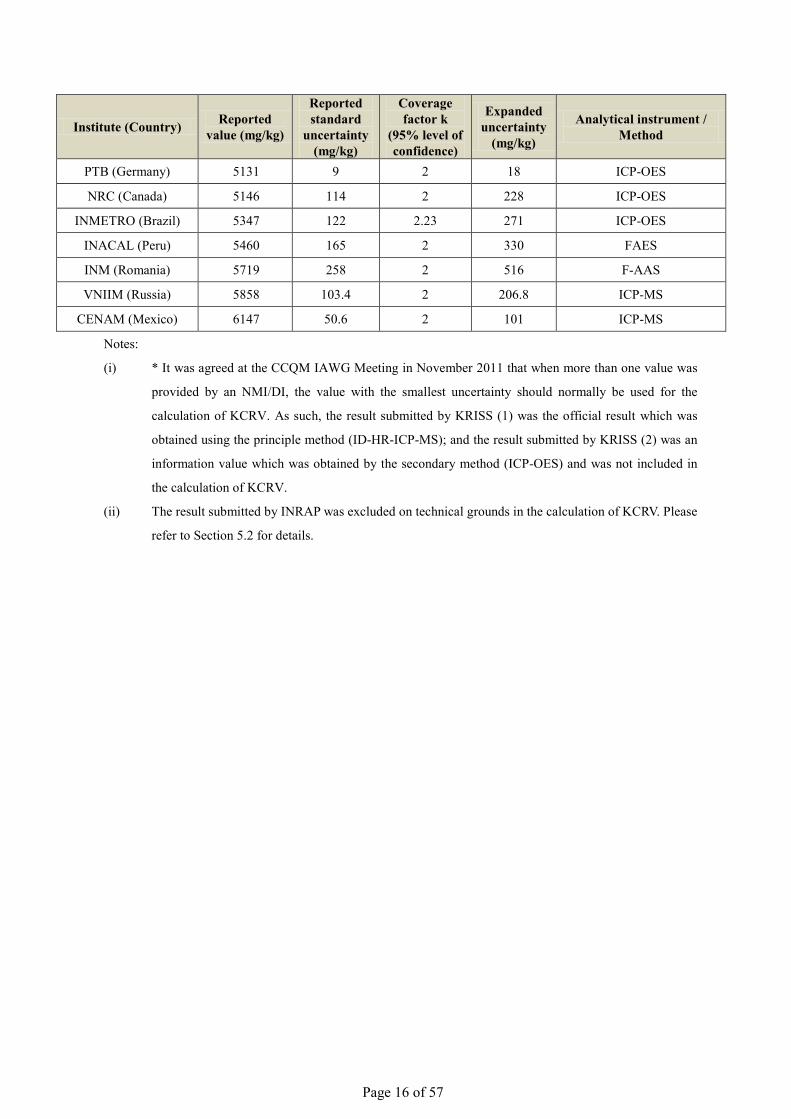
Institute (Country) Reported value (mg/kg)
Reported standard
uncertainty (mg/kg)
Coverage factor k
(95% level of confidence)
Expanded uncertainty
(mg/kg)
Analytical instrument / Method
PTB (Germany) 5131 9 2 18 ICP-OES
NRC (Canada) 5146 114 2 228 ICP-OES
INMETRO (Brazil) 5347 122 2.23 271 ICP-OES
INACAL (Peru) 5460 165 2 330 FAES
INM (Romania) 5719 258 2 516 F-AAS
VNIIM (Russia) 5858 103.4 2 206.8 ICP-MS
CENAM (Mexico) 6147 50.6 2 101 ICP-MS
Notes:
(i) * It was agreed at the CCQM IAWG Meeting in November 2011 that when more than one value was
provided by an NMI/DI, the value with the smallest uncertainty should normally be used for the
calculation of KCRV. As such, the result submitted by KRISS (1) was the official result which was
obtained using the principle method (ID-HR-ICP-MS); and the result submitted by KRISS (2) was an
information value which was obtained by the secondary method (ICP-OES) and was not included in
the calculation of KCRV.
(ii) The result submitted by INRAP was excluded on technical grounds in the calculation of KCRV. Please
refer to Section 5.2 for details.
Page 17 of 57
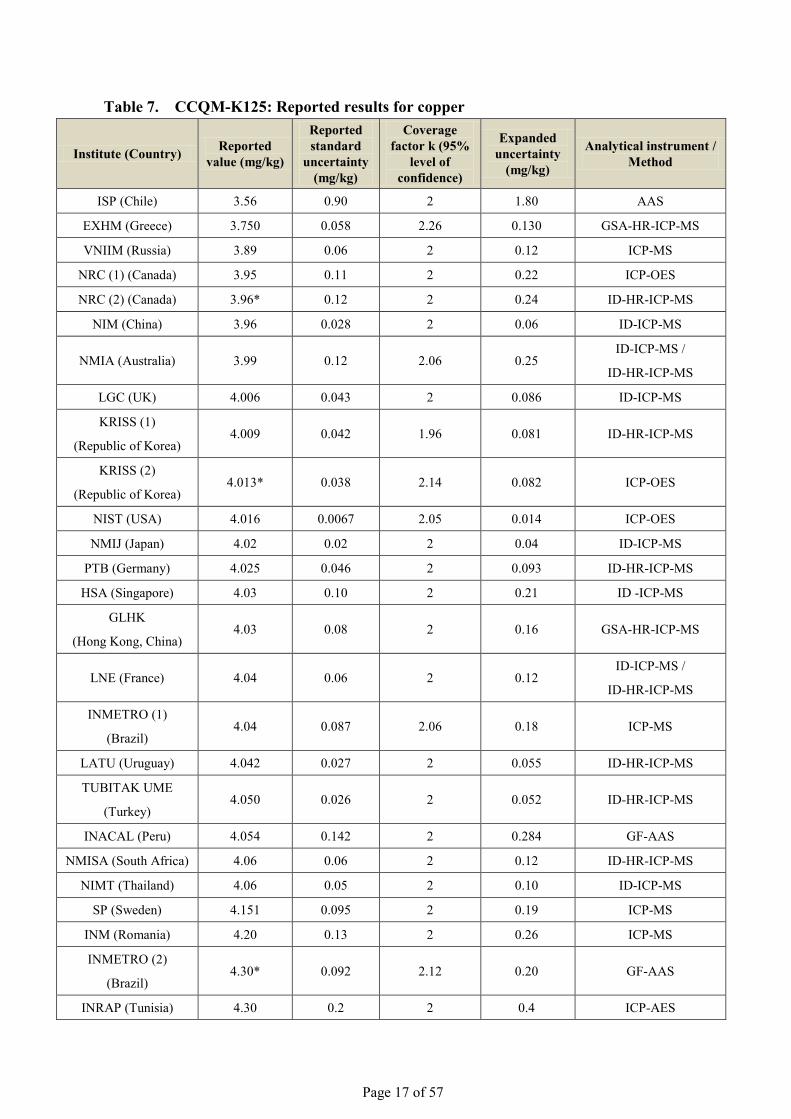
Table 7. CCQM-K125: Reported results for copper
Institute (Country) Reported value (mg/kg)
Reported standard
uncertainty (mg/kg)
Coverage factor k (95%
level of confidence)
Expanded uncertainty
(mg/kg)
Analytical instrument / Method
ISP (Chile) 3.56 0.90 2 1.80 AAS
EXHM (Greece) 3.750 0.058 2.26 0.130 GSA-HR-ICP-MS
VNIIM (Russia) 3.89 0.06 2 0.12 ICP-MS
NRC (1) (Canada) 3.95 0.11 2 0.22 ICP-OES
NRC (2) (Canada) 3.96* 0.12 2 0.24 ID-HR-ICP-MS
NIM (China) 3.96 0.028 2 0.06 ID-ICP-MS
NMIA (Australia) 3.99 0.12 2.06 0.25 ID-ICP-MS /
ID-HR-ICP-MS
LGC (UK) 4.006 0.043 2 0.086 ID-ICP-MS
KRISS (1)
(Republic of Korea) 4.009 0.042 1.96 0.081 ID-HR-ICP-MS
KRISS (2)
(Republic of Korea) 4.013* 0.038 2.14 0.082 ICP-OES
NIST (USA) 4.016 0.0067 2.05 0.014 ICP-OES
NMIJ (Japan) 4.02 0.02 2 0.04 ID-ICP-MS
PTB (Germany) 4.025 0.046 2 0.093 ID-HR-ICP-MS
HSA (Singapore) 4.03 0.10 2 0.21 ID -ICP-MS
GLHK
(Hong Kong, China) 4.03 0.08 2 0.16 GSA-HR-ICP-MS
LNE (France) 4.04 0.06 2 0.12 ID-ICP-MS /
ID-HR-ICP-MS
INMETRO (1)
(Brazil) 4.04 0.087 2.06 0.18 ICP-MS
LATU (Uruguay) 4.042 0.027 2 0.055 ID-HR-ICP-MS
TUBITAK UME
(Turkey) 4.050 0.026 2 0.052 ID-HR-ICP-MS
INACAL (Peru) 4.054 0.142 2 0.284 GF-AAS
NMISA (South Africa) 4.06 0.06 2 0.12 ID-HR-ICP-MS
NIMT (Thailand) 4.06 0.05 2 0.10 ID-ICP-MS
SP (Sweden) 4.151 0.095 2 0.19 ICP-MS
INM (Romania) 4.20 0.13 2 0.26 ICP-MS
INMETRO (2)
(Brazil) 4.30* 0.092 2.12 0.20 GF-AAS
INRAP (Tunisia) 4.30 0.2 2 0.4 ICP-AES
Page 18 of 57
Institute (Country) Reported value (mg/kg)
Reported standard
uncertainty (mg/kg)
Coverage factor k (95%
level of confidence)
Expanded uncertainty
(mg/kg)
Analytical instrument / Method
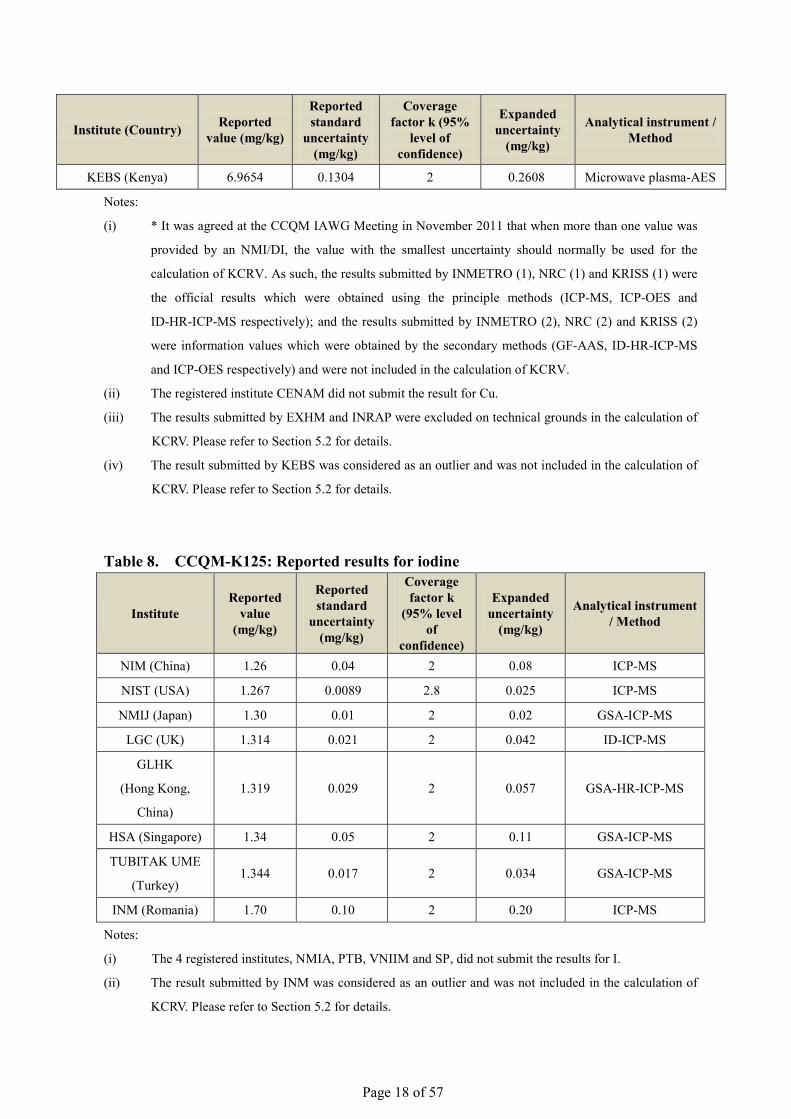
KEBS (Kenya) 6.9654 0.1304 2 0.2608 Microwave plasma-AES
Notes:
(i) * It was agreed at the CCQM IAWG Meeting in November 2011 that when more than one value was
provided by an NMI/DI, the value with the smallest uncertainty should normally be used for the
calculation of KCRV. As such, the results submitted by INMETRO (1), NRC (1) and KRISS (1) were
the official results which were obtained using the principle methods (ICP-MS, ICP-OES and
ID-HR-ICP-MS respectively); and the results submitted by INMETRO (2), NRC (2) and KRISS (2)
were information values which were obtained by the secondary methods (GF-AAS, ID-HR-ICP-MS
and ICP-OES respectively) and were not included in the calculation of KCRV.
(ii) The registered institute CENAM did not submit the result for Cu.
(iii) The results submitted by EXHM and INRAP were excluded on technical grounds in the calculation of
KCRV. Please refer to Section 5.2 for details.
(iv) The result submitted by KEBS was considered as an outlier and was not included in the calculation of
KCRV. Please refer to Section 5.2 for details.
Table 8. CCQM-K125: Reported results for iodine
Institute Reported
value (mg/kg)
Reported standard
uncertainty (mg/kg)
Coverage factor k
(95% level of
confidence)
Expanded uncertainty
(mg/kg)
Analytical instrument / Method
NIM (China) 1.26 0.04 2 0.08 ICP-MS
NIST (USA) 1.267 0.0089 2.8 0.025 ICP-MS
NMIJ (Japan) 1.30 0.01 2 0.02 GSA-ICP-MS
LGC (UK) 1.314 0.021 2 0.042 ID-ICP-MS
GLHK
(Hong Kong,
China)
1.319 0.029 2 0.057 GSA-HR-ICP-MS
HSA (Singapore) 1.34 0.05 2 0.11 GSA-ICP-MS
TUBITAK UME
(Turkey) 1.344 0.017 2 0.034 GSA-ICP-MS
INM (Romania) 1.70 0.10 2 0.20 ICP-MS
Notes:
(i) The 4 registered institutes, NMIA, PTB, VNIIM and SP, did not submit the results for I. (ii) The result submitted by INM was considered as an outlier and was not included in the calculation of
KCRV. Please refer to Section 5.2 for details.
Page 19 of 57
5.2. Calculation of the reference mass fraction values and associated uncertainties It was agreed at the CCQM IAWG Meeting in November 2011 that when more than one value was provided by an NMI/DI, the value with the smallest uncertainty should normally be used for this purpose as the key comparison reference value (KCRV) is supposed to be the best estimate of the true value. Moreover, all submitted results should be included in the comparison report and a degrees of equivalence (DoE) calculated for each one. In order to establish the DoE of the measurement results submitted by the participants of CCQM-K125, a KCRV was calculated for each measurand as a consensus value of the reported results [2]. GLHK, as the coordinating laboratory, prepared and circulated the Initial Result Summary to the participants on 14 March 2016 for checking any transcription and typographical errors. Participating institutes are requested to review their own results and inform the coordinating laboratory, together with reasons, if they identify any measurement problems which could explain errors on the reported results. GLHK discussed the measurement results shown in the Initial Result Summary at the CCQM IAWG Meeting (18-19 April 2016). As a follow-up on the circulation and discussion of the Initial Result Summary, the coordinating laboratory received additional information from some participants as detailed below.
On 15 March 2016, LNE (France) reported to the coordinator that some revisions should be made to the Initial Result Summary. The details are shown as follows: LNE requested to revise the contents of the following pages in the Initial Result Summary: (i) Pages 1 and 28, add the following people (Caroline Oster and Paola Fisicaro) in the Authors section of the report; (ii) Page 13, Table 5a, the value of the moisture change to %; K: (2.660 ± 0.048)%, k=2; Cu: (2.525 ± 0.032)%, k=2; (iii) Pages 15 and 17, Tables 6a and 7, remove “ID-HR-ICP-MS” from the column of analytical instrument.
On 15 March 2016, EXHM (Greece) reported to the coordinator that the result of Cu was not correct. The details are shown as follows:
EXHM reported that “We re-checked our calculations and we realized that they are not correct: the final results from the Cu standard addition experiments have not been multiplied by the intercept/slope ratio of the standard addition curves. We attach a revised results submission form for your information. Maybe you can include it as a comment in the report.” The revised result for copper was 3.994 ± 0.059 mg/kg. (Note: The original result for copper was 3.750 ± 0.058 mg/kg.)
Page 20 of 57
On 29 April and 10 May 2016, INRAP (Tunisia) informed the coordinator that the
results of K and Cu were not reported on a dry mass basis. The details are shown as follows:
INRAP reported that “Our laboratory did not perform the determination of dry mass correction and our results for Potassium and Copper are not reported on a dry mass basis. INRAP also reported that “Of course we understand and we agree that the INRAP’s results for Potassium and Copper are excluded on technical grounds in the calculation of KCRV, and we will provide you with our results after the determination of a dry mass correction as soon as possible.” The revised results for potassium and copper were 4950.32 ± 363.04 mg/kg and 4.40 ± 0.4 mg/kg respectively. (Note: The original results for potassium and copper were 4838.8 ± 348.4 mg/kg and 4.30 ± 0.4 mg/kg respectively.)
In this regard, the results submitted by EXHM (Cu) and INRAP (K and Cu) were excluded on technical grounds in the calculation of KCRV. Besides, the results submitted by KEBS (Cu) and INM (I) were considered as outliers and were not included in the calculation of KCRV. For those NMIs/DIs who reported two sets of results using different measurement techniques for the same measurand in CCQM-K125, the measurement result with a smaller uncertainty would be used in the statistical calculation. KRISS (Republic of Korea) reported two sets of results using different measurement techniques for K, and INMETRO (Brazil), NRC (Canada) and KRISS reported two sets of results using different measurement techniques for Cu. As such, the measurement results [Potassium: KRISS (2); Copper: INMETRO (2), NRC (2) and KRISS (2)] with larger uncertainties were not included in the calculation of KCRV.
Page 21 of 57
Based on the valid measurement results, GLHK prepared and circulated the Draft A Report to the participants on 14 September 2016 for checking and comments. The coordinating laboratory received one participant’s reply as detailed below.
On 14 September 2016, LNE (France) reported to the coordinator that some revisions should be made to the Draft A Report. The details are shown as follows:
LNE reported that they would like to confirm that their results were obtained from “HR-ICP-MS + ICP-MS” for both K and Cu analysis.
GLHK discussed the measurement results shown in the Draft A Report at the CCQM IAWG Meeting (4-6 October 2016). With reference to the “Key Decisions and Action” of CCQM IAWG dated 19 October 2016, GLHK prepared and circulated the Draft B Report to the participants on 21 November 2016 for further checking and comments. The coordinating laboratory received one participant’s reply as detailed below. On 23 and 30 November 2015, NIST (USA) reported to the coordinator that some
revisions should be made to the Draft B Report. The details are shown as follows: NIST requested to include another co-author (Savelas A. Rabb) and make some editorial amendments to the report.
Page 22 of 57
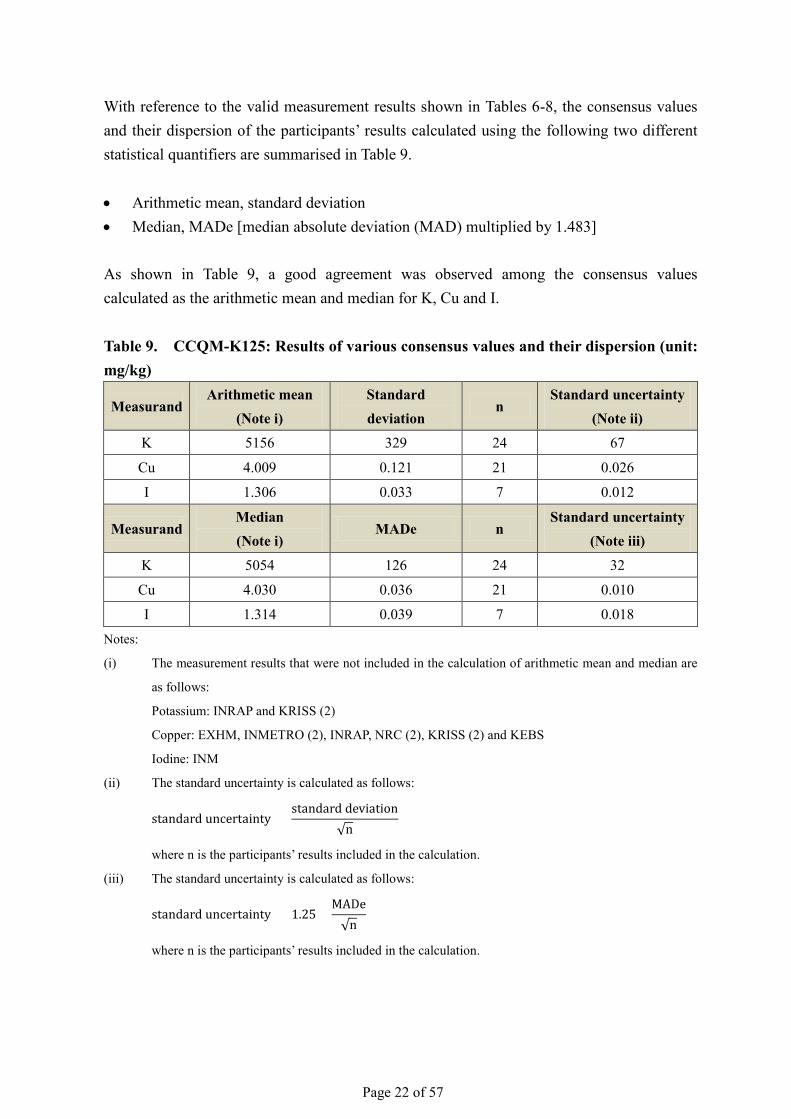
With reference to the valid measurement results shown in Tables 6-8, the consensus values and their dispersion of the participants’ results calculated using the following two different statistical quantifiers are summarised in Table 9. • Arithmetic mean, standard deviation • Median, MADe [median absolute deviation (MAD) multiplied by 1.483] As shown in Table 9, a good agreement was observed among the consensus values calculated as the arithmetic mean and median for K, Cu and I. Table 9. CCQM-K125: Results of various consensus values and their dispersion (unit: mg/kg)
Measurand Arithmetic mean
(Note i) Standard deviation
n Standard uncertainty
(Note ii) K 5156 329 24 67
Cu 4.009 0.121 21 0.026
I 1.306 0.033 7 0.012
Measurand Median (Note i)
MADe n Standard uncertainty
(Note iii) K 5054 126 24 32
Cu 4.030 0.036 21 0.010
I 1.314 0.039 7 0.018
Notes:
(i) The measurement results that were not included in the calculation of arithmetic mean and median are
as follows:
Potassium: INRAP and KRISS (2)
Copper: EXHM, INMETRO (2), INRAP, NRC (2), KRISS (2) and KEBS
Iodine: INM
(ii) The standard uncertainty is calculated as follows:
standard uncertainty = standard deviation
√n
where n is the participants’ results included in the calculation.
(iii) The standard uncertainty is calculated as follows:
standard uncertainty = 1.25 ×MADe√n
where n is the participants’ results included in the calculation.
Page 23 of 57
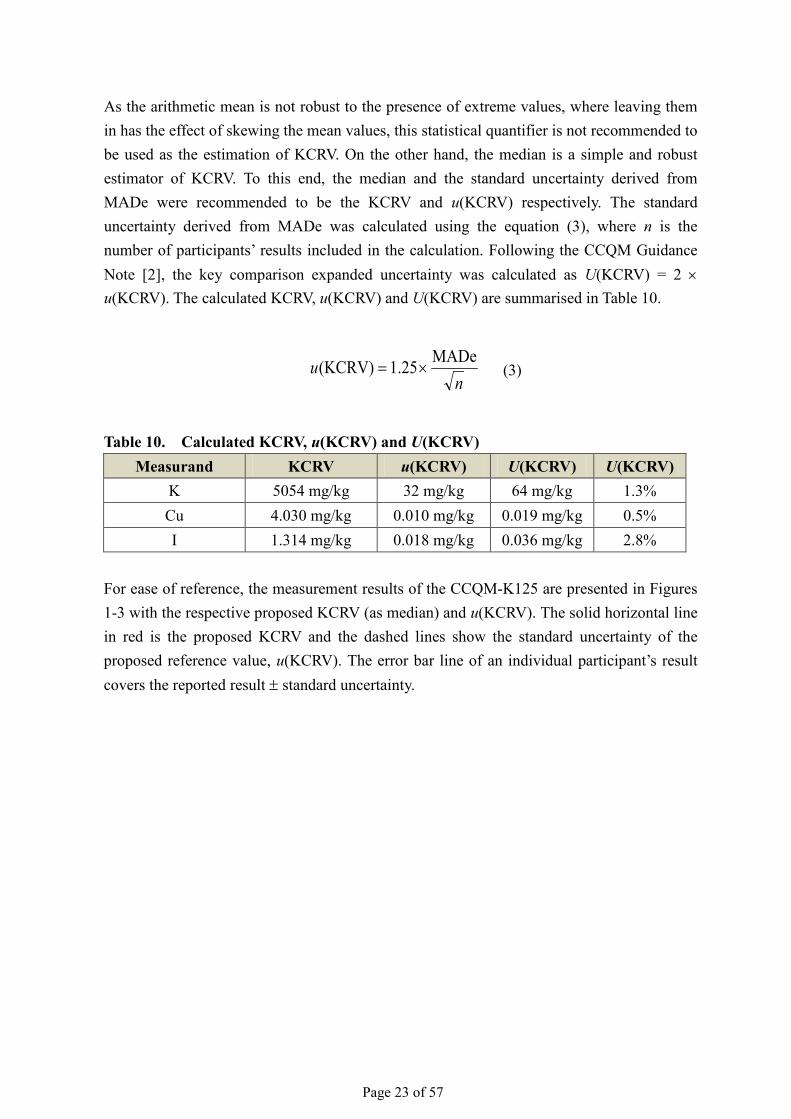
As the arithmetic mean is not robust to the presence of extreme values, where leaving them in has the effect of skewing the mean values, this statistical quantifier is not recommended to be used as the estimation of KCRV. On the other hand, the median is a simple and robust estimator of KCRV. To this end, the median and the standard uncertainty derived from MADe were recommended to be the KCRV and u(KCRV) respectively. The standard uncertainty derived from MADe was calculated using the equation (3), where n is the number of participants’ results included in the calculation. Following the CCQM Guidance Note [2], the key comparison expanded uncertainty was calculated as U(KCRV) = 2 × u(KCRV). The calculated KCRV, u(KCRV) and U(KCRV) are summarised in Table 10.
nu MADe25.1(KCRV) ×= (3)
Table 10. Calculated KCRV, u(KCRV) and U(KCRV)
Measurand KCRV u(KCRV) U(KCRV) U(KCRV) K 5054 mg/kg 32 mg/kg 64 mg/kg 1.3% Cu 4.030 mg/kg 0.010 mg/kg 0.019 mg/kg 0.5% I 1.314 mg/kg 0.018 mg/kg 0.036 mg/kg 2.8%
For ease of reference, the measurement results of the CCQM-K125 are presented in Figures 1-3 with the respective proposed KCRV (as median) and u(KCRV). The solid horizontal line in red is the proposed KCRV and the dashed lines show the standard uncertainty of the proposed reference value, u(KCRV). The error bar line of an individual participant’s result covers the reported result ± standard uncertainty.
Page 24 of 57
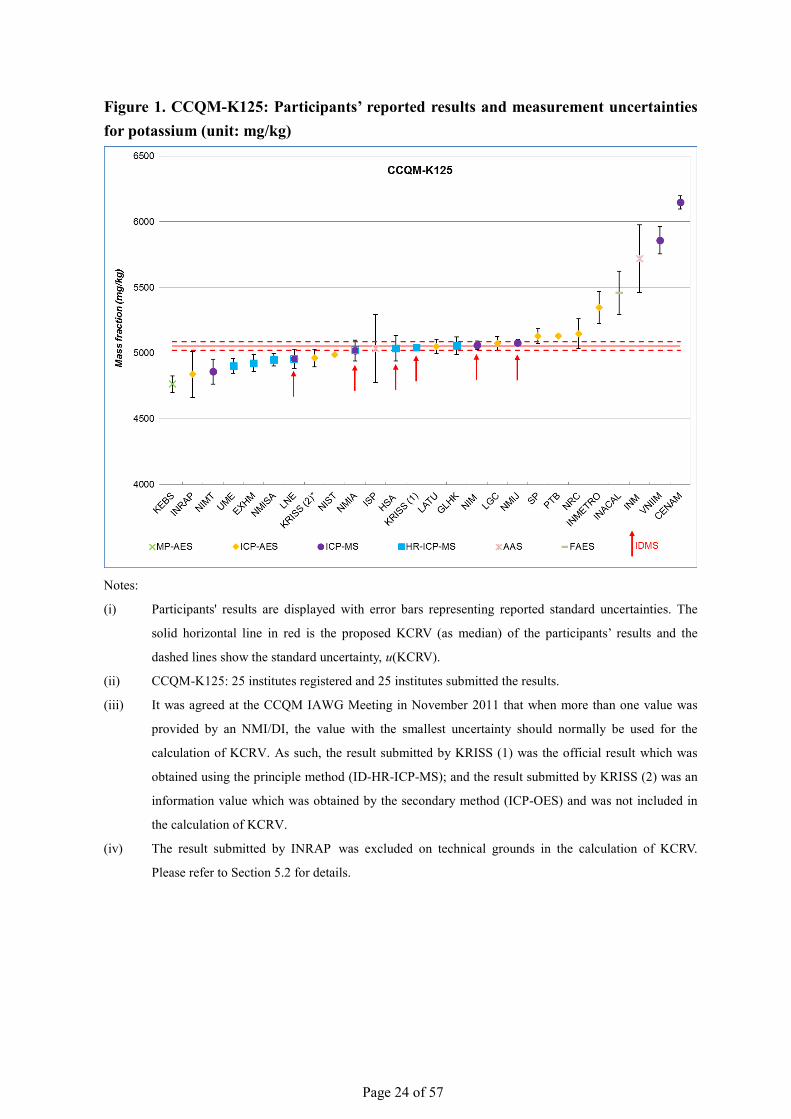
Figure 1. CCQM-K125: Participants’ reported results and measurement uncertainties for potassium (unit: mg/kg)
Notes:
(i) Participants' results are displayed with error bars representing reported standard uncertainties. The
solid horizontal line in red is the proposed KCRV (as median) of the participants’ results and the
dashed lines show the standard uncertainty, u(KCRV).
(ii) CCQM-K125: 25 institutes registered and 25 institutes submitted the results.
(iii) It was agreed at the CCQM IAWG Meeting in November 2011 that when more than one value was
provided by an NMI/DI, the value with the smallest uncertainty should normally be used for the
calculation of KCRV. As such, the result submitted by KRISS (1) was the official result which was
obtained using the principle method (ID-HR-ICP-MS); and the result submitted by KRISS (2) was an
information value which was obtained by the secondary method (ICP-OES) and was not included in
the calculation of KCRV.
(iv) The result submitted by INRAP was excluded on technical grounds in the calculation of KCRV. Please refer to Section 5.2 for details.
Page 25 of 57
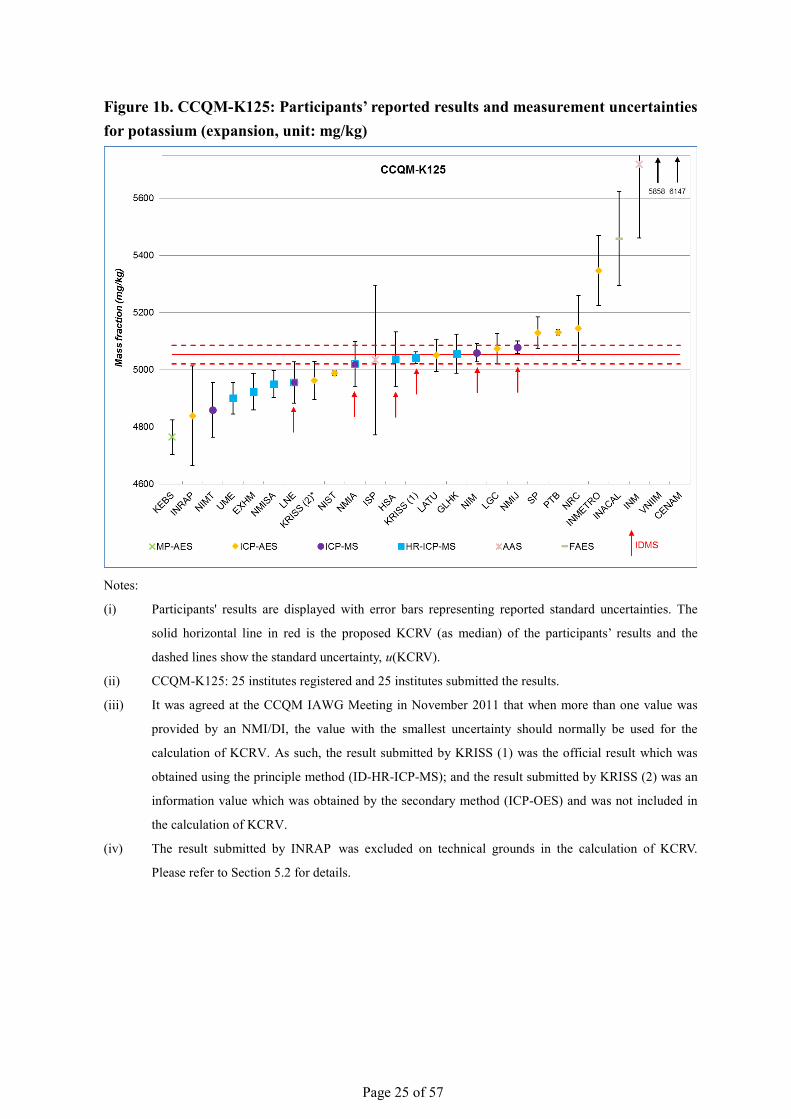
Figure 1b. CCQM-K125: Participants’ reported results and measurement uncertainties for potassium (expansion, unit: mg/kg)
Notes:
(i) Participants' results are displayed with error bars representing reported standard uncertainties. The
solid horizontal line in red is the proposed KCRV (as median) of the participants’ results and the
dashed lines show the standard uncertainty, u(KCRV).
(ii) CCQM-K125: 25 institutes registered and 25 institutes submitted the results.
(iii) It was agreed at the CCQM IAWG Meeting in November 2011 that when more than one value was
provided by an NMI/DI, the value with the smallest uncertainty should normally be used for the
calculation of KCRV. As such, the result submitted by KRISS (1) was the official result which was
obtained using the principle method (ID-HR-ICP-MS); and the result submitted by KRISS (2) was an
information value which was obtained by the secondary method (ICP-OES) and was not included in
the calculation of KCRV.
(iv) The result submitted by INRAP was excluded on technical grounds in the calculation of KCRV. Please refer to Section 5.2 for details.
Page 26 of 57
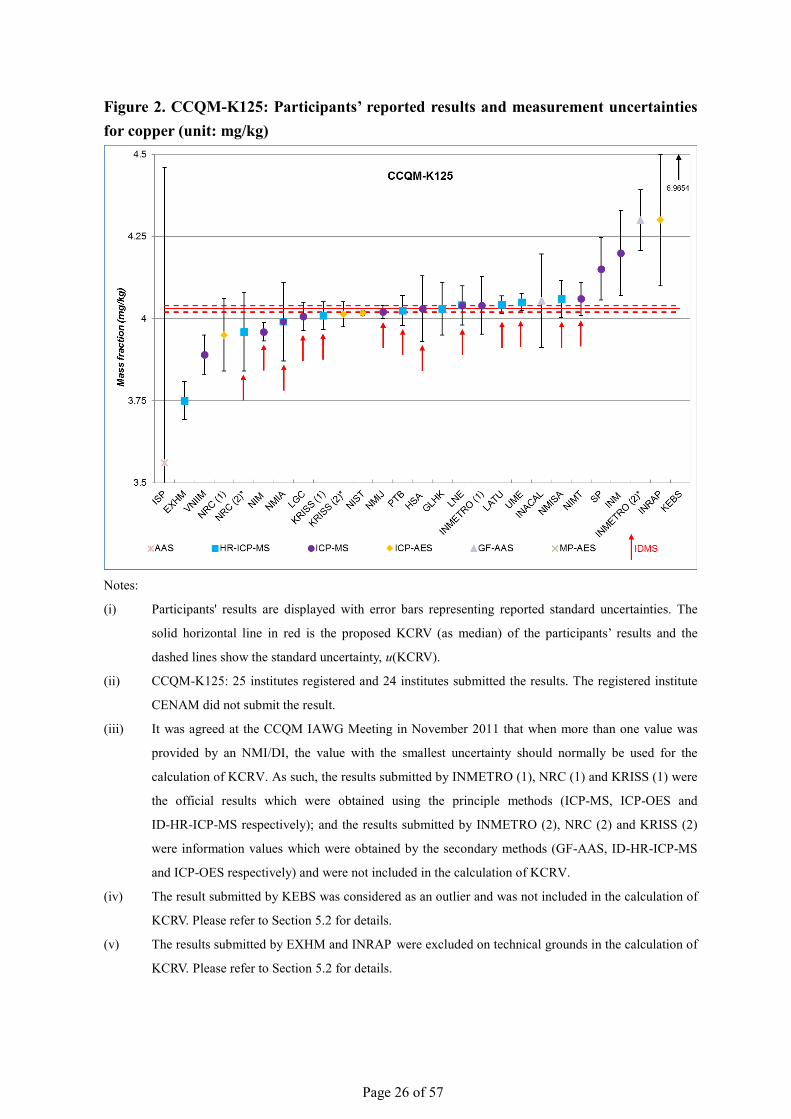
Figure 2. CCQM-K125: Participants’ reported results and measurement uncertainties for copper (unit: mg/kg)
Notes:
(i) Participants' results are displayed with error bars representing reported standard uncertainties. The
solid horizontal line in red is the proposed KCRV (as median) of the participants’ results and the
dashed lines show the standard uncertainty, u(KCRV).
(ii) CCQM-K125: 25 institutes registered and 24 institutes submitted the results. The registered institute
CENAM did not submit the result.
(iii) It was agreed at the CCQM IAWG Meeting in November 2011 that when more than one value was
provided by an NMI/DI, the value with the smallest uncertainty should normally be used for the
calculation of KCRV. As such, the results submitted by INMETRO (1), NRC (1) and KRISS (1) were
the official results which were obtained using the principle methods (ICP-MS, ICP-OES and
ID-HR-ICP-MS respectively); and the results submitted by INMETRO (2), NRC (2) and KRISS (2)
were information values which were obtained by the secondary methods (GF-AAS, ID-HR-ICP-MS
and ICP-OES respectively) and were not included in the calculation of KCRV. (iv) The result submitted by KEBS was considered as an outlier and was not included in the calculation of
KCRV. Please refer to Section 5.2 for details. (v) The results submitted by EXHM and INRAP were excluded on technical grounds in the calculation of
KCRV. Please refer to Section 5.2 for details.
Page 27 of 57
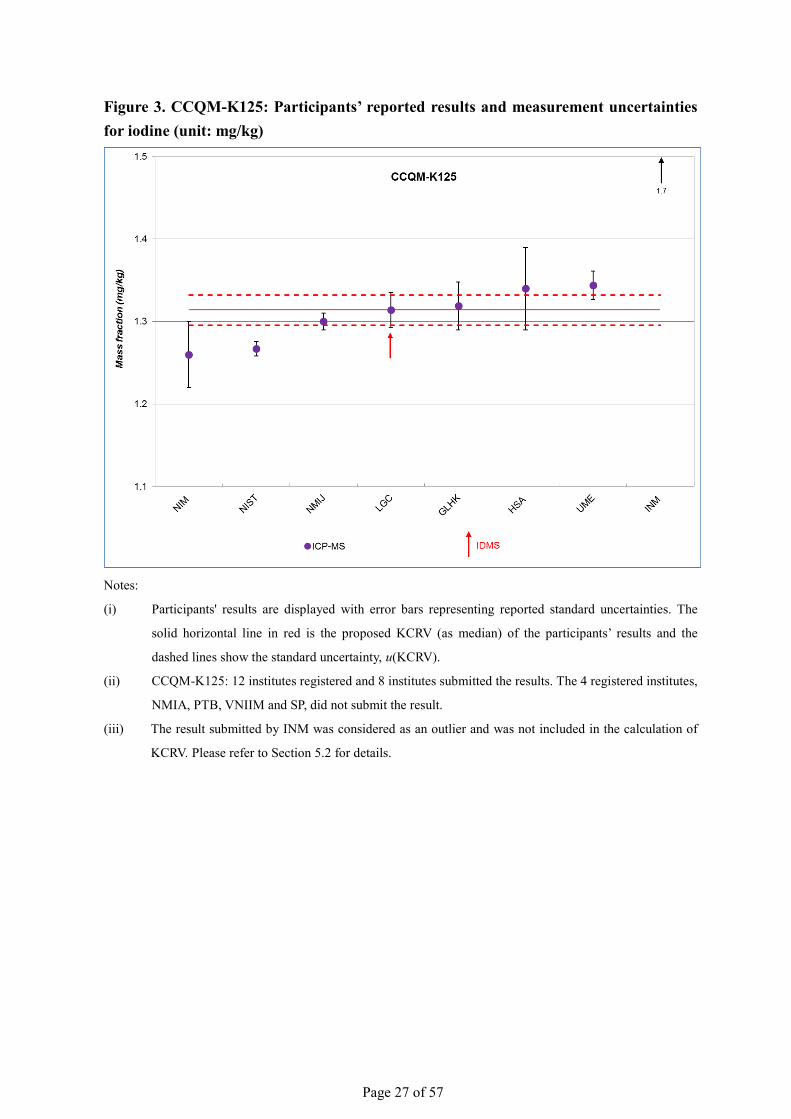
Figure 3. CCQM-K125: Participants’ reported results and measurement uncertainties for iodine (unit: mg/kg)
Notes:
(i) Participants' results are displayed with error bars representing reported standard uncertainties. The
solid horizontal line in red is the proposed KCRV (as median) of the participants’ results and the
dashed lines show the standard uncertainty, u(KCRV).
(ii) CCQM-K125: 12 institutes registered and 8 institutes submitted the results. The 4 registered institutes,
NMIA, PTB, VNIIM and SP, did not submit the result.
(iii) The result submitted by INM was considered as an outlier and was not included in the calculation of
KCRV. Please refer to Section 5.2 for details.

Page 28 of 57
5.3. Equivalence statements According to the CCQM Guidance Note [2], the degree of equivalence (DoE) and its uncertainty of a measurement result reported by a participating NMI/DI with respect to the KCRV can be calculated using the following equations (4)-(5):
)KCRV( −= ii xd (4)
22 )KCRV()(2)( uxudU ii +⋅= (5)
where xi is the reported value from the ith participant (i = 1 to n); di is the difference between the reported value and the KCRV; and U(di) is the expanded uncertainty (k = 2) of the difference di at a 95% level of confidence. It is possible for the values of di and U(di) published in this report to differ slightly from the values of di and U(di) that can be calculated using the equations given in (4)-(5). These differences arise from the necessary rounding of the KCRV and u(KCRV) prior to their publication in Tables 11 to 13. The relative values of di and U(di) are expressed as percent of KCRV. The equivalence statements for CCQM-K125 based on the proposed KCRV are given in Tables 11 to 13 and are shown graphically in Figures 4 to 6.
Page 29 of 57
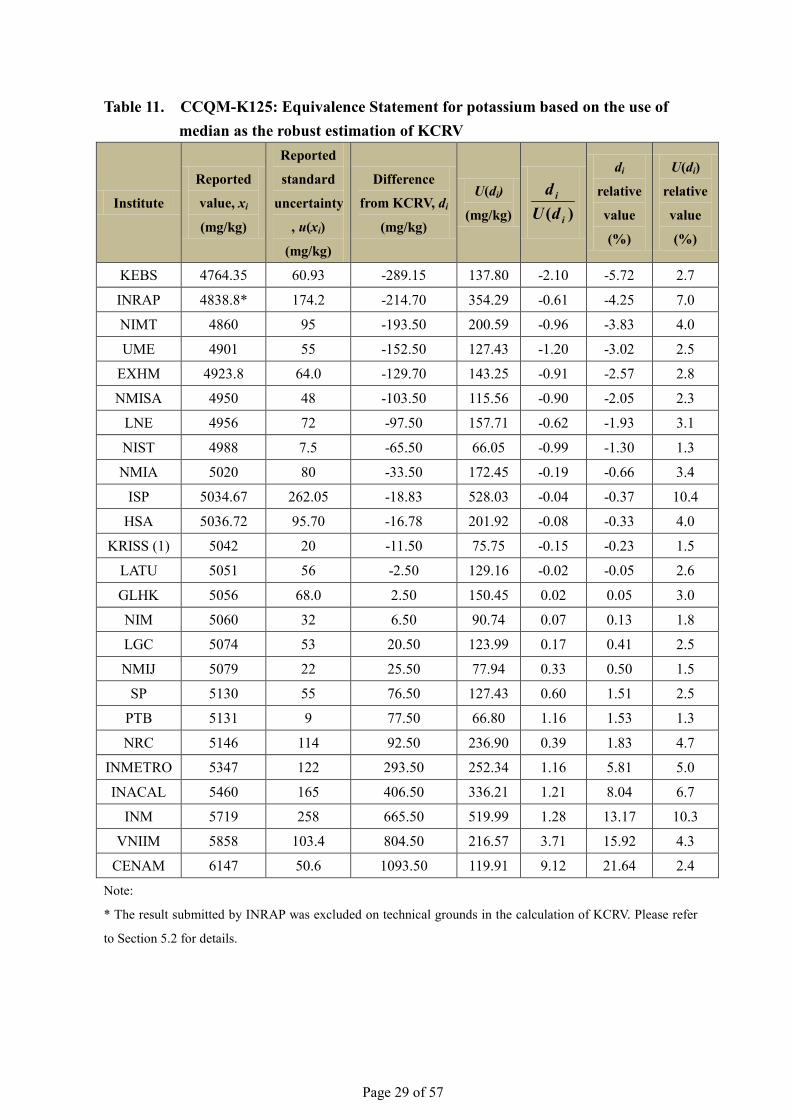
Table 11. CCQM-K125: Equivalence Statement for potassium based on the use of median as the robust estimation of KCRV
Institute
Reported
value, xi
(mg/kg)
Reported
standard
uncertainty
, u(xi)
(mg/kg)
Difference
from KCRV, di
(mg/kg)
U(di)
(mg/kg) )( i
i
dUd
di
relative
value
(%)
U(di)
relative
value
(%)
KEBS 4764.35 60.93 -289.15 137.80 -2.10 -5.72 2.7
INRAP 4838.8* 174.2 -214.70 354.29 -0.61 -4.25 7.0
NIMT 4860 95 -193.50 200.59 -0.96 -3.83 4.0
UME 4901 55 -152.50 127.43 -1.20 -3.02 2.5
EXHM 4923.8 64.0 -129.70 143.25 -0.91 -2.57 2.8
NMISA 4950 48 -103.50 115.56 -0.90 -2.05 2.3
LNE 4956 72 -97.50 157.71 -0.62 -1.93 3.1
NIST 4988 7.5 -65.50 66.05 -0.99 -1.30 1.3
NMIA 5020 80 -33.50 172.45 -0.19 -0.66 3.4
ISP 5034.67 262.05 -18.83 528.03 -0.04 -0.37 10.4
HSA 5036.72 95.70 -16.78 201.92 -0.08 -0.33 4.0
KRISS (1) 5042 20 -11.50 75.75 -0.15 -0.23 1.5
LATU 5051 56 -2.50 129.16 -0.02 -0.05 2.6
GLHK 5056 68.0 2.50 150.45 0.02 0.05 3.0
NIM 5060 32 6.50 90.74 0.07 0.13 1.8
LGC 5074 53 20.50 123.99 0.17 0.41 2.5
NMIJ 5079 22 25.50 77.94 0.33 0.50 1.5
SP 5130 55 76.50 127.43 0.60 1.51 2.5
PTB 5131 9 77.50 66.80 1.16 1.53 1.3
NRC 5146 114 92.50 236.90 0.39 1.83 4.7
INMETRO 5347 122 293.50 252.34 1.16 5.81 5.0
INACAL 5460 165 406.50 336.21 1.21 8.04 6.7
INM 5719 258 665.50 519.99 1.28 13.17 10.3
VNIIM 5858 103.4 804.50 216.57 3.71 15.92 4.3
CENAM 6147 50.6 1093.50 119.91 9.12 21.64 2.4
Note:
* The result submitted by INRAP was excluded on technical grounds in the calculation of KCRV. Please refer
to Section 5.2 for details.
Page 30 of 57
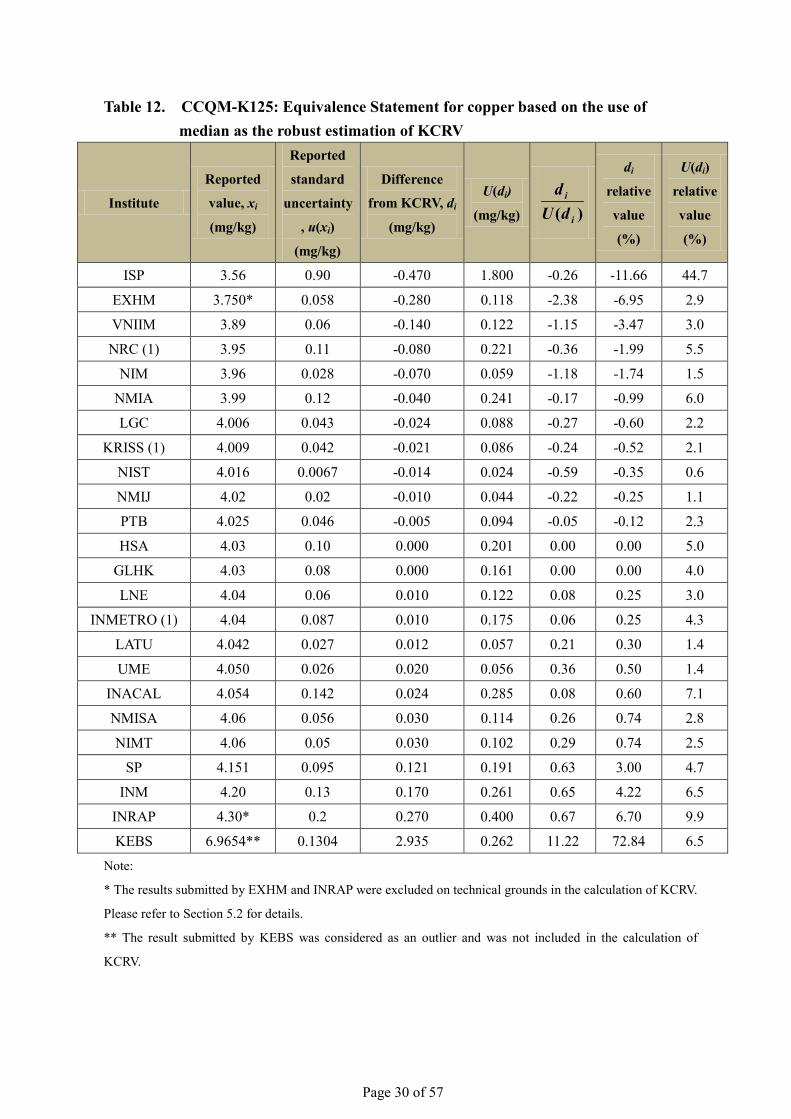
Table 12. CCQM-K125: Equivalence Statement for copper based on the use of median as the robust estimation of KCRV
Institute
Reported
value, xi
(mg/kg)
Reported
standard
uncertainty
, u(xi)
(mg/kg)
Difference
from KCRV, di
(mg/kg)
U(di)
(mg/kg) )( i
i
dUd
di
relative
value
(%)
U(di)
relative
value
(%)
ISP 3.56 0.90 -0.470 1.800 -0.26 -11.66 44.7
EXHM 3.750* 0.058 -0.280 0.118 -2.38 -6.95 2.9
VNIIM 3.89 0.06 -0.140 0.122 -1.15 -3.47 3.0
NRC (1) 3.95 0.11 -0.080 0.221 -0.36 -1.99 5.5
NIM 3.96 0.028 -0.070 0.059 -1.18 -1.74 1.5
NMIA 3.99 0.12 -0.040 0.241 -0.17 -0.99 6.0
LGC 4.006 0.043 -0.024 0.088 -0.27 -0.60 2.2
KRISS (1) 4.009 0.042 -0.021 0.086 -0.24 -0.52 2.1
NIST 4.016 0.0067 -0.014 0.024 -0.59 -0.35 0.6
NMIJ 4.02 0.02 -0.010 0.044 -0.22 -0.25 1.1
PTB 4.025 0.046 -0.005 0.094 -0.05 -0.12 2.3
HSA 4.03 0.10 0.000 0.201 0.00 0.00 5.0
GLHK 4.03 0.08 0.000 0.161 0.00 0.00 4.0
LNE 4.04 0.06 0.010 0.122 0.08 0.25 3.0
INMETRO (1) 4.04 0.087 0.010 0.175 0.06 0.25 4.3
LATU 4.042 0.027 0.012 0.057 0.21 0.30 1.4
UME 4.050 0.026 0.020 0.056 0.36 0.50 1.4
INACAL 4.054 0.142 0.024 0.285 0.08 0.60 7.1
NMISA 4.06 0.056 0.030 0.114 0.26 0.74 2.8
NIMT 4.06 0.05 0.030 0.102 0.29 0.74 2.5
SP 4.151 0.095 0.121 0.191 0.63 3.00 4.7
INM 4.20 0.13 0.170 0.261 0.65 4.22 6.5
INRAP 4.30* 0.2 0.270 0.400 0.67 6.70 9.9
KEBS 6.9654** 0.1304 2.935 0.262 11.22 72.84 6.5 Note:
* The results submitted by EXHM and INRAP were excluded on technical grounds in the calculation of KCRV.
Please refer to Section 5.2 for details.
** The result submitted by KEBS was considered as an outlier and was not included in the calculation of
KCRV.
Page 31 of 57
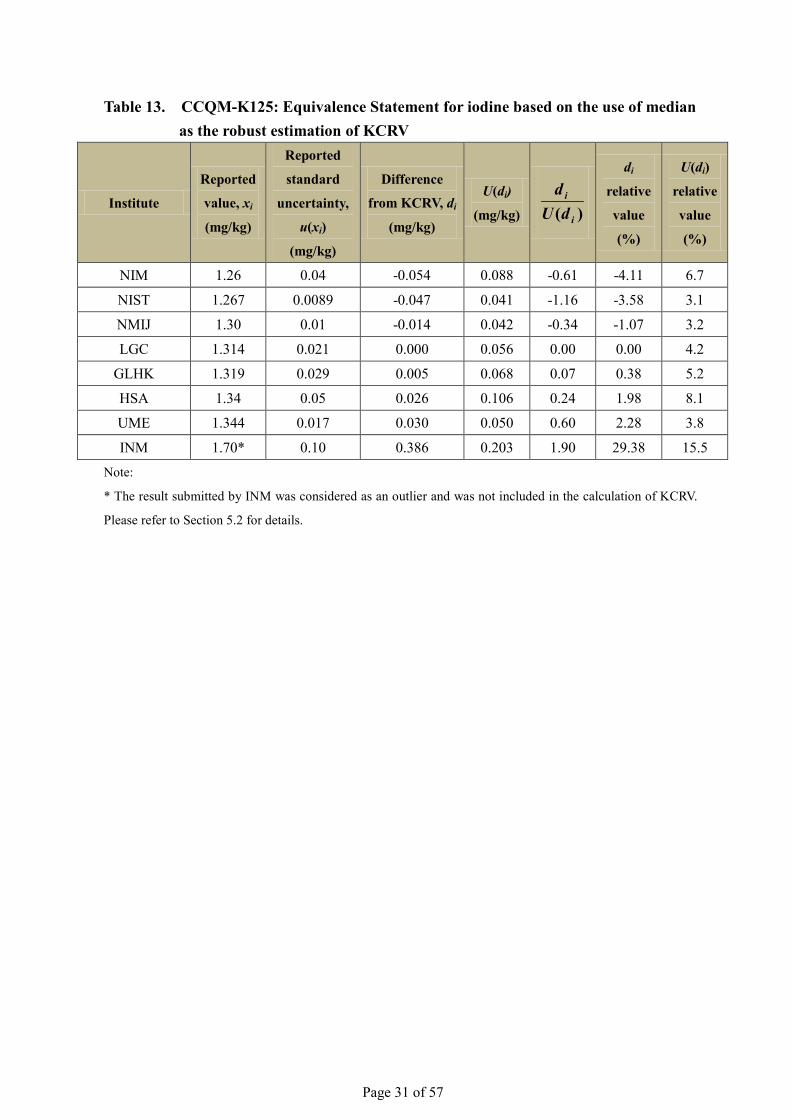
Table 13. CCQM-K125: Equivalence Statement for iodine based on the use of median as the robust estimation of KCRV
Institute
Reported
value, xi
(mg/kg)
Reported
standard
uncertainty,
u(xi)
(mg/kg)
Difference
from KCRV, di
(mg/kg)
U(di)
(mg/kg) )( i
i
dUd
di
relative
value
(%)
U(di)
relative
value
(%)
NIM 1.26 0.04 -0.054 0.088 -0.61 -4.11 6.7
NIST 1.267 0.0089 -0.047 0.041 -1.16 -3.58 3.1
NMIJ 1.30 0.01 -0.014 0.042 -0.34 -1.07 3.2
LGC 1.314 0.021 0.000 0.056 0.00 0.00 4.2
GLHK 1.319 0.029 0.005 0.068 0.07 0.38 5.2
HSA 1.34 0.05 0.026 0.106 0.24 1.98 8.1
UME 1.344 0.017 0.030 0.050 0.60 2.28 3.8
INM 1.70* 0.10 0.386 0.203 1.90 29.38 15.5 Note:
* The result submitted by INM was considered as an outlier and was not included in the calculation of KCRV.
Please refer to Section 5.2 for details.
Page 32 of 57
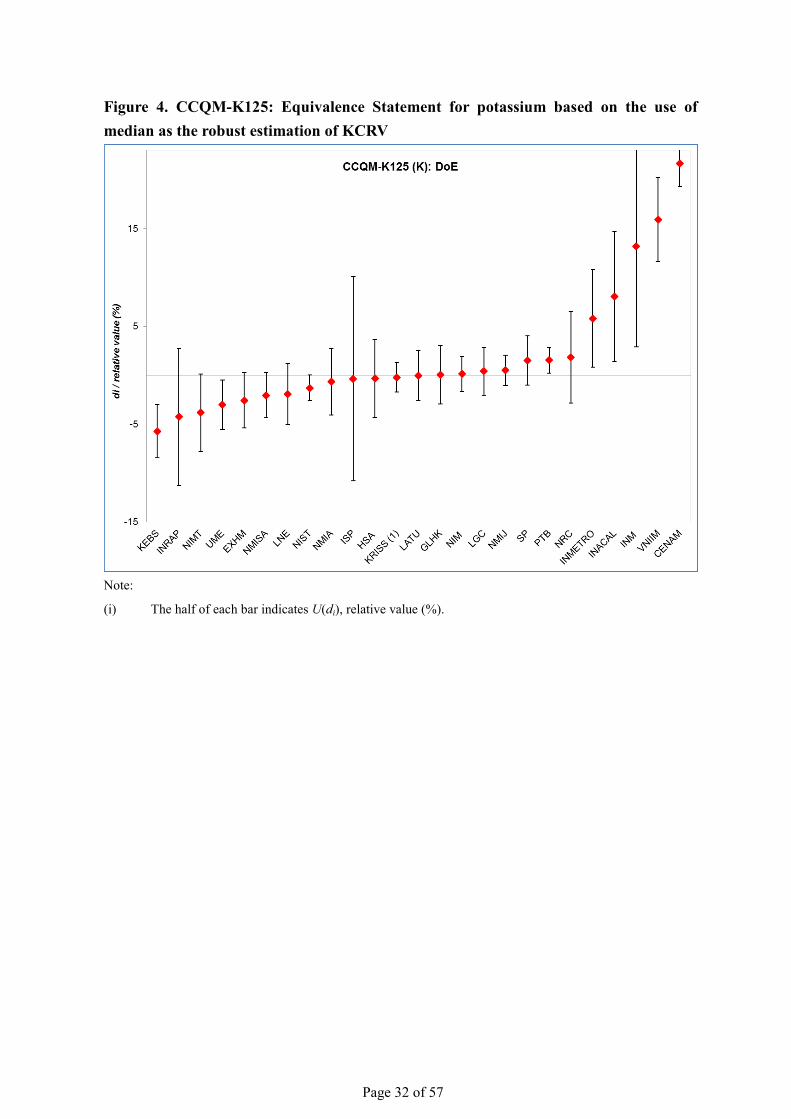
Figure 4. CCQM-K125: Equivalence Statement for potassium based on the use of median as the robust estimation of KCRV
Note:
(i) The half of each bar indicates U(di), relative value (%).
Page 33 of 57
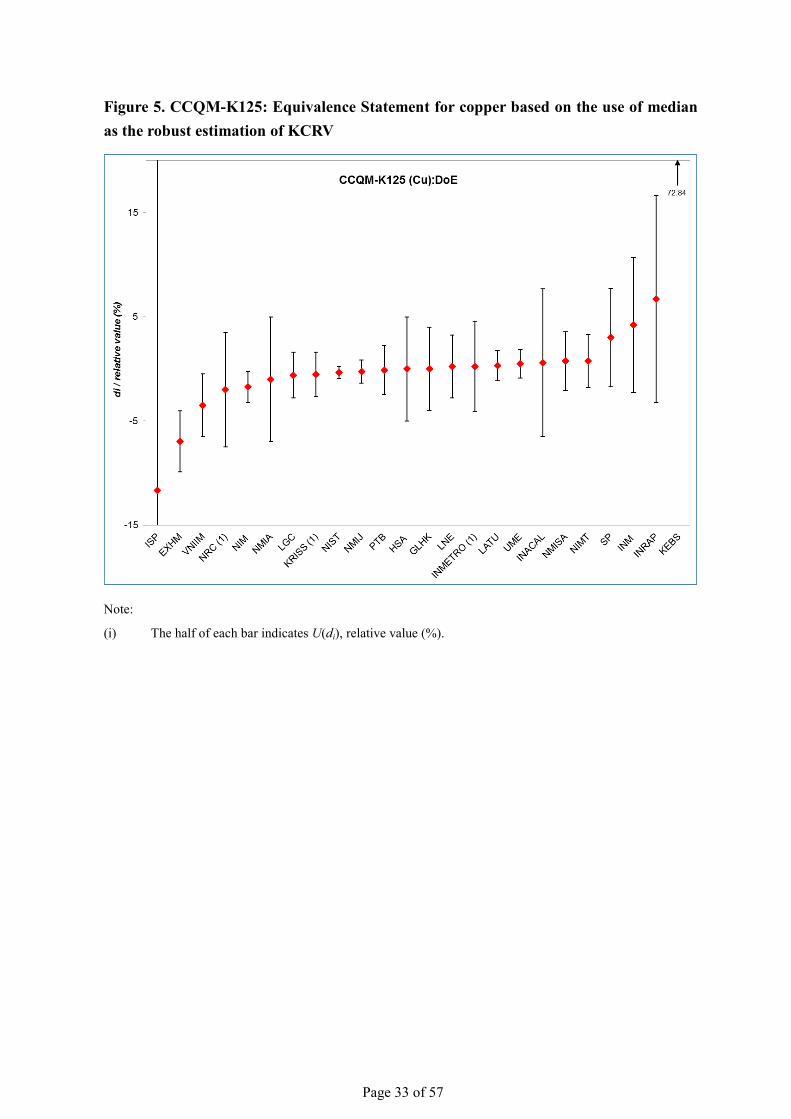
Figure 5. CCQM-K125: Equivalence Statement for copper based on the use of median as the robust estimation of KCRV
Note:
(i) The half of each bar indicates U(di), relative value (%).
Page 34 of 57
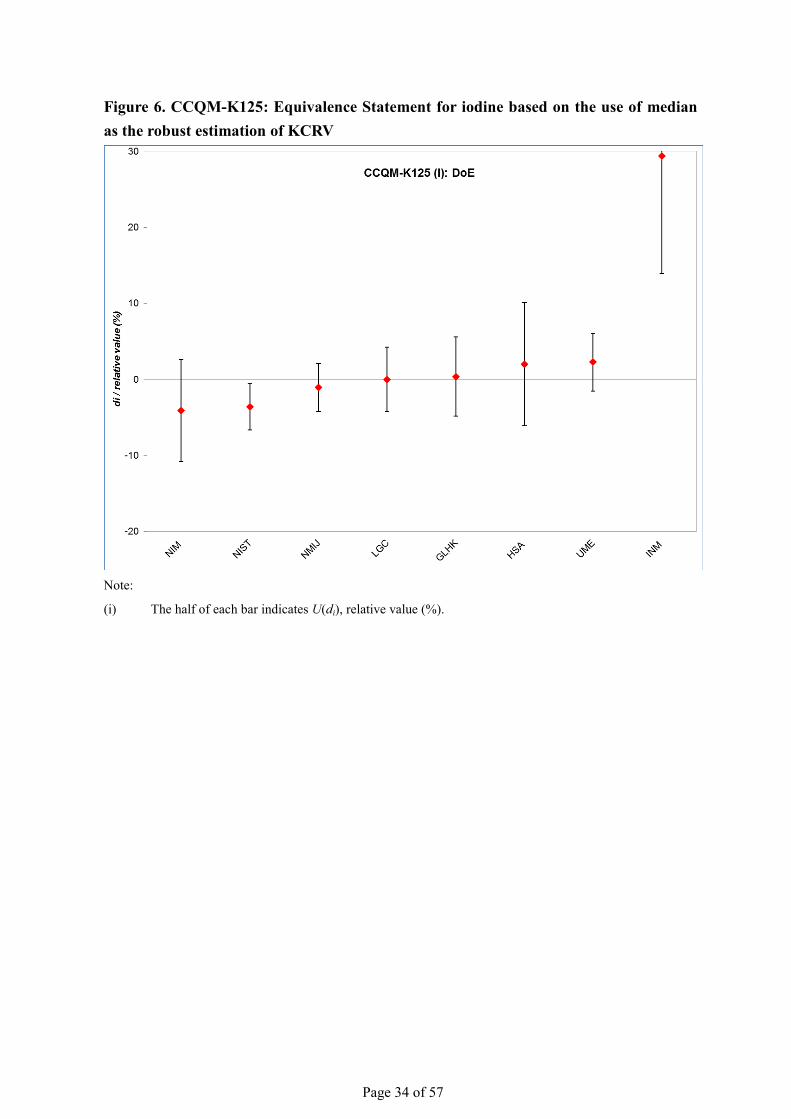
Figure 6. CCQM-K125: Equivalence Statement for iodine based on the use of median as the robust estimation of KCRV
Note:
(i) The half of each bar indicates U(di), relative value (%).
Page 35 of 57
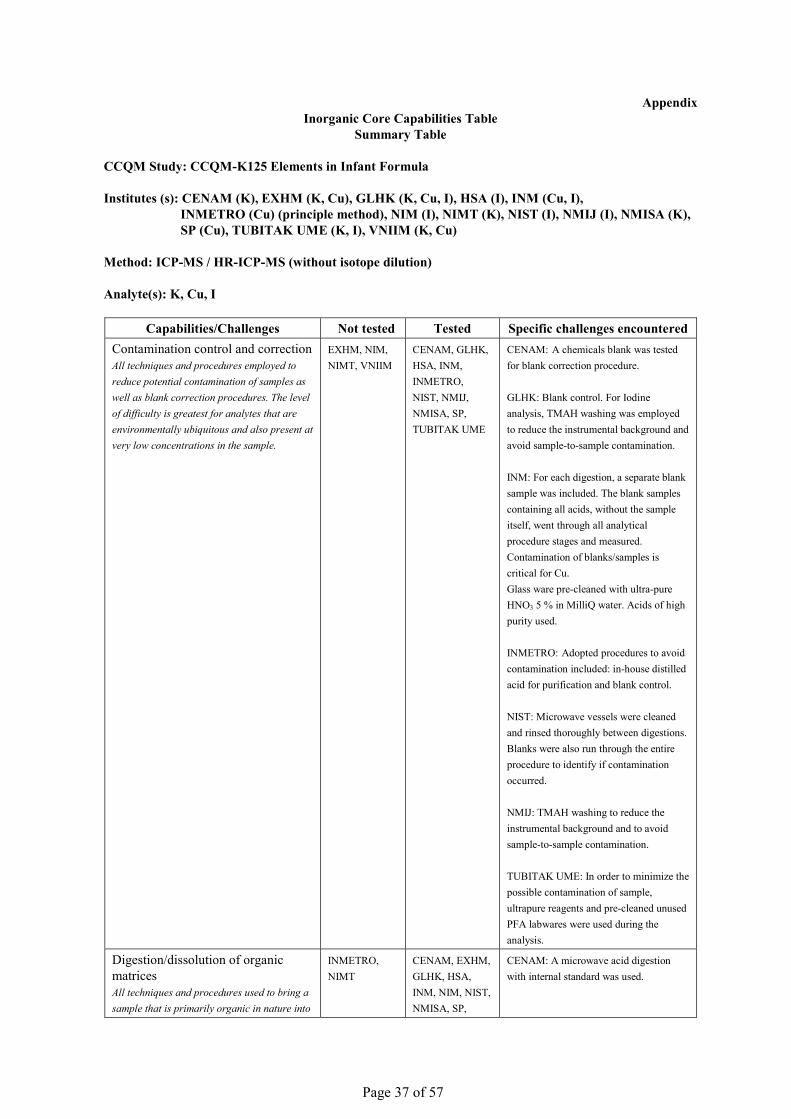
6. Demonstration of Core Capabilities As agreed in previous CCQM IAWG meetings, a system of Core-Capabilities for inorganic analysis would be employed in key/supplementary comparisons starting from CCQM-K75 onward. This strategy is to improve the efficiency and effectiveness of key/supplementary comparisons to support CMC claims. With the use of the system, new CMC claims can be supported by describing core capabilities that are required to deliver the claimed measurement service and by referencing core capabilities that were successfully demonstrated by participation in relevant key/supplementary comparisons. In this connection, all participants were requested to submit their Inorganic Core Capabilities (CCs) Tables to the coordinating laboratory for compilation. The returns are summarized in the Appendix. 7. Conclusion Generally, the participants’ results of CCQM-K125 were found consistent for all measurands according to their equivalence statements. Except with some extreme values, most of the participants obtained the values of di/U(di) within ± 1 for the measurands. For examination of potassium and copper, most of the participants used microwave-assisted acid digestion methods for sample dissolution. A variety of instrumental techniques including inductively coupled plasma mass spectrometry (ICP-MS), isotope dilution inductively coupled plasma mass spectrometry (ID-ICP-MS), inductively coupled plasma optical emission spectrometry (ICP-OES), atomic absorption spectrometry (AAS), flame atomic emission spectrometry (FAES) and microwave plasma atomic emission spectroscopy (MP-AES) were employed by the participants for determination. For analysis of iodine, most of the participants used alkaline extraction methods for sample preparation. ICP-MS and ID-ICP-MS were used by the participants for determination. For this key comparison, inorganic core capabilities have been demonstrated by the concerned participants with respect to methods including ICP-MS (without isotope dilution), ID-ICP-MS, ICP-OES, AAS, FAES and MP-AES on the determination of elements (potassium, copper and iodine) in a food matrix of infant formula.
Page 36 of 57
Acknowledgements The contributions from the contract persons and/or analysts of participating NMIs/DIs, as listed below, are highly appreciated and acknowledged.
Institute Contact person and/or analysts
NMIA Jeffrey Merrick, David Saxby
INMETRO Emily Silva Dutra, Rodrigo Caciano de Sena, Thiago de Oliveira Araújo, Marcelo Dominguez de Almeida
NRC Lu Yang, Indu Gedara Pihillagawa, Zoltan Mester ISPCH Soraya Sandoval NIM Chao Wei LNE M. Estela Del Castillo, Caroline Oster, Paola Fisicaro PTB Olaf Rienitz, Carola Pape, Ursula Schulz, Reinhard Jährling, Volker Görlitz EXHM Evgenia Lampi, Elias Kakoulides GLHK Yuk-Tai Tsoi, Ping-Yuk Cheung, Wai-Wing Chan NMIJ Yanbei Zhu KEBS Tom Oduor Okumu KRISS Yong-Hyeon Yim, Sung Woo Heo, Myungsub Han and Youngran Lim CENAM Mariana Arce Osuna, Laura Regalado INACAL Christian Uribe INM Mirella Maria Buzoianu, Steluta Duta VNIIM Leonid Konopelko, Anatoli Krylov HSA Richard Shin NMISA Maré Linsky, Angelique Botha SP Bertil Magnusson, Conny Haraldsson NIMT Usana Thiengmanee INRAP Hanen Klich TUBITAK UME Suleyman Z. Can, F. Gonca Coskun, Murat Tunc LGC John Entwisle, Jennifer O’Reilly, Sarah Hill, Heidi Goenaga-Infante NIST Michael Winchester, Savelas A. Rabb LATU Ramiro Pérez-Zambra
The coordinating laboratory would like to thank Dr. Mike Sargent for providing guidance throughout the course of the study. References 1. International Standards Organization, ISO Guide 35: Reference materials – General and
statistical principles for certification, Geneva, Switzerland, 2006.
2. CCQM Guidance Note: Estimation of a consensus KCRV and associated degrees of equivalence, Version 10, 2013.
Page 37 of 57
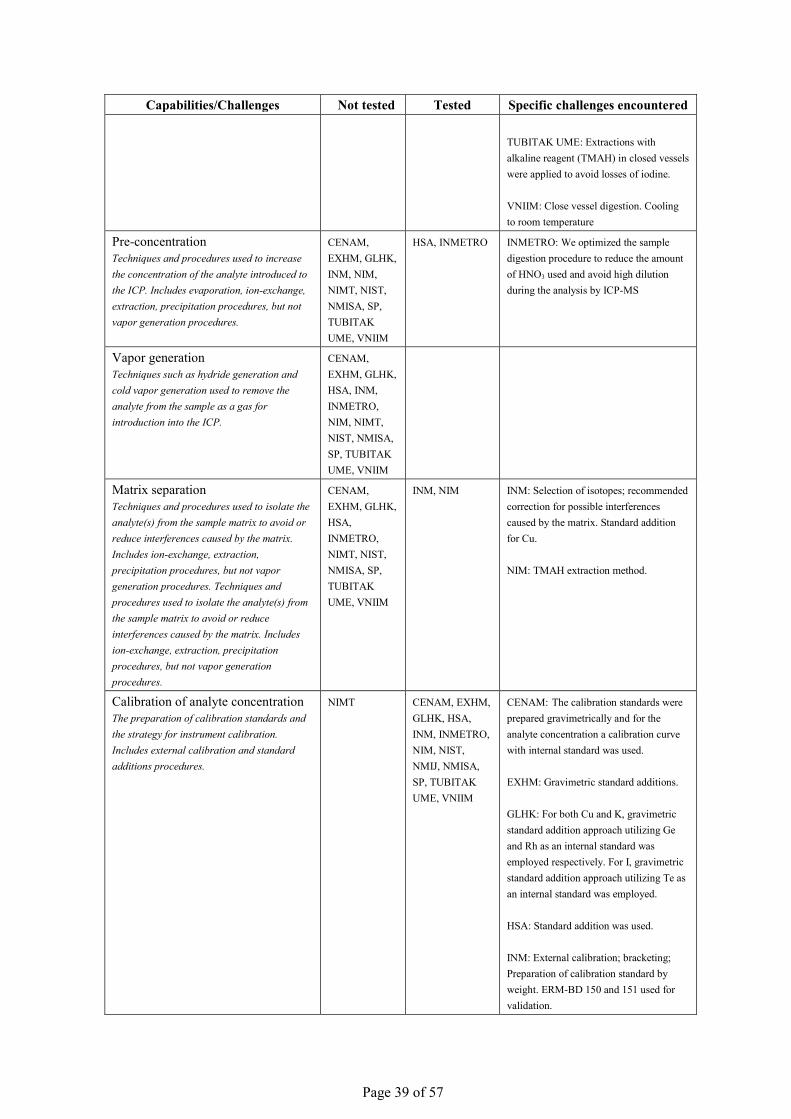
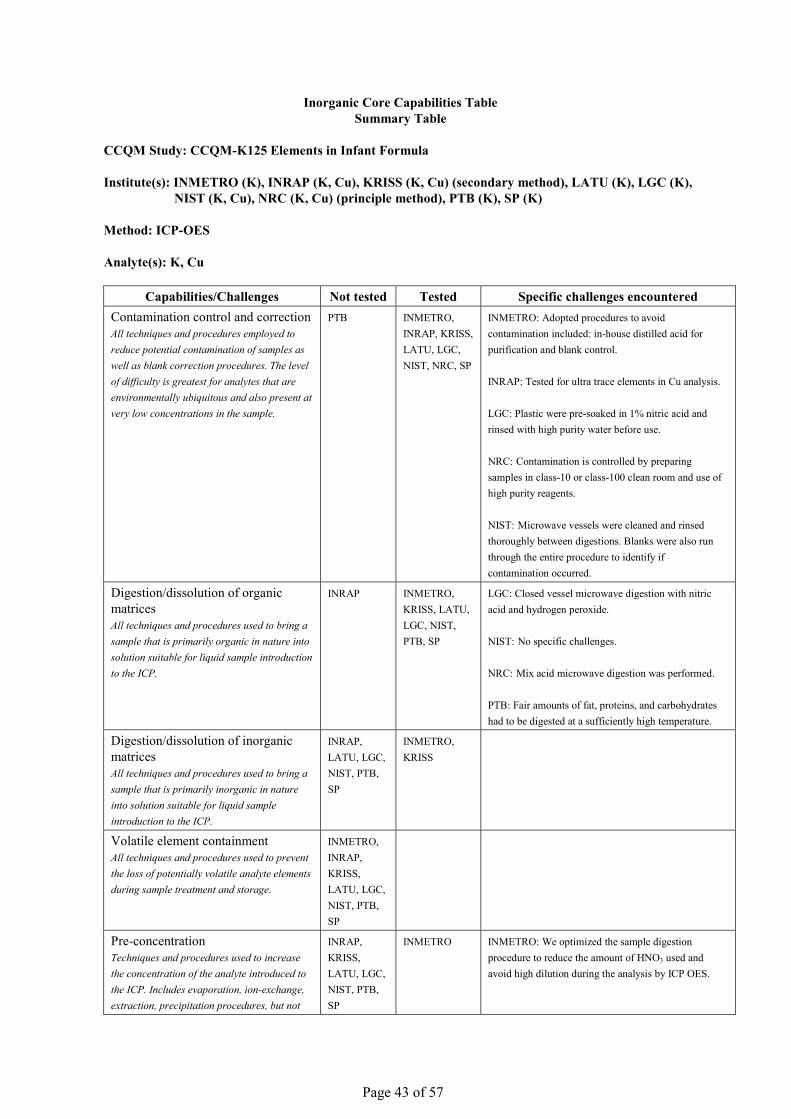
Appendix Inorganic Core Capabilities Table
Summary Table CCQM Study: CCQM-K125 Elements in Infant Formula Institutes (s): CENAM (K), EXHM (K, Cu), GLHK (K, Cu, I), HSA (I), INM (Cu, I),
INMETRO (Cu) (principle method), NIM (I), NIMT (K), NIST (I), NMIJ (I), NMISA (K), SP (Cu), TUBITAK UME (K, I), VNIIM (K, Cu)
Method: ICP-MS / HR-ICP-MS (without isotope dilution) Analyte(s): K, Cu, I
Capabilities/Challenges Not tested Tested Specific challenges encountered Contamination control and correction All techniques and procedures employed to reduce potential contamination of samples as well as blank correction procedures. The level of difficulty is greatest for analytes that are environmentally ubiquitous and also present at very low concentrations in the sample.
EXHM, NIM, NIMT, VNIIM
CENAM, GLHK, HSA, INM, INMETRO, NIST, NMIJ, NMISA, SP, TUBITAK UME
CENAM: A chemicals blank was tested for blank correction procedure. GLHK: Blank control. For Iodine analysis, TMAH washing was employed to reduce the instrumental background and avoid sample-to-sample contamination. INM: For each digestion, a separate blank sample was included. The blank samples containing all acids, without the sample itself, went through all analytical procedure stages and measured. Contamination of blanks/samples is critical for Cu. Glass ware pre-cleaned with ultra-pure HNO3 5 % in MilliQ water. Acids of high purity used. INMETRO: Adopted procedures to avoid contamination included: in-house distilled acid for purification and blank control. NIST: Microwave vessels were cleaned and rinsed thoroughly between digestions. Blanks were also run through the entire procedure to identify if contamination occurred. NMIJ: TMAH washing to reduce the instrumental background and to avoid sample-to-sample contamination. TUBITAK UME: In order to minimize the possible contamination of sample, ultrapure reagents and pre-cleaned unused PFA labwares were used during the analysis.
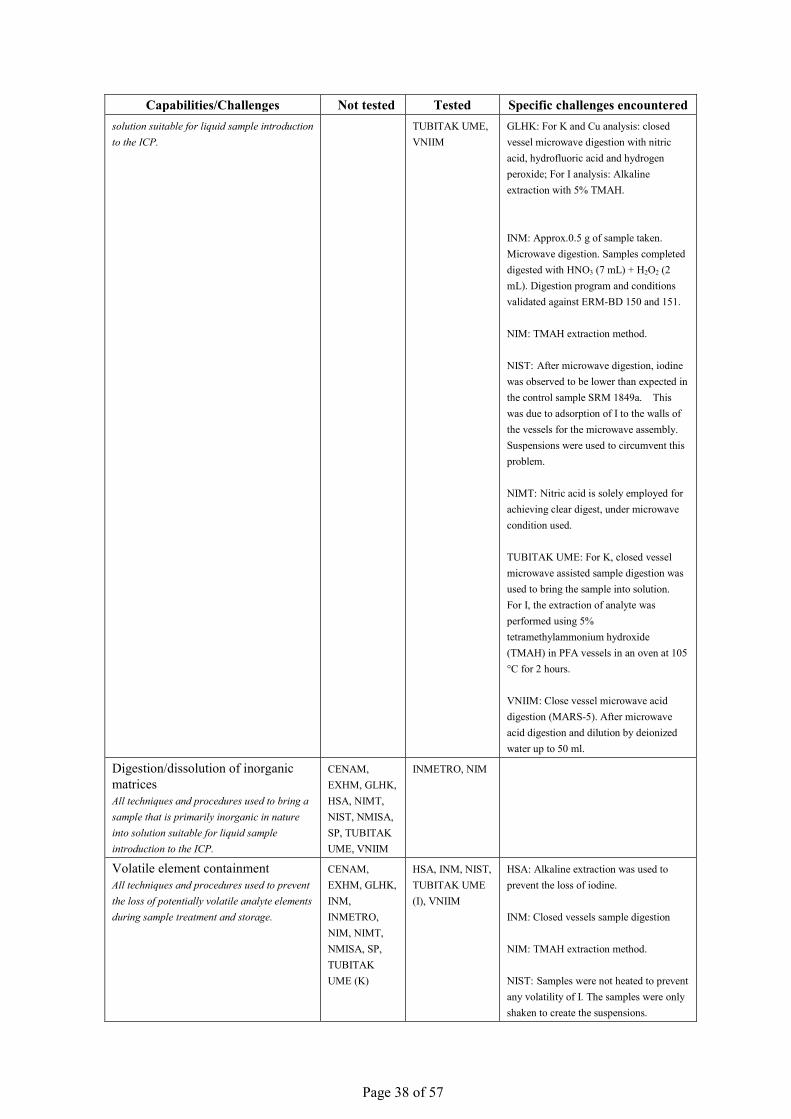
Digestion/dissolution of organic matrices All techniques and procedures used to bring a sample that is primarily organic in nature into
INMETRO, NIMT
CENAM, EXHM, GLHK, HSA, INM, NIM, NIST, NMISA, SP,
CENAM: A microwave acid digestion with internal standard was used.
Page 38 of 57
Capabilities/Challenges Not tested Tested Specific challenges encountered solution suitable for liquid sample introduction to the ICP.
TUBITAK UME, VNIIM
GLHK: For K and Cu analysis: closed vessel microwave digestion with nitric acid, hydrofluoric acid and hydrogen peroxide; For I analysis: Alkaline extraction with 5% TMAH. INM: Approx.0.5 g of sample taken. Microwave digestion. Samples completed digested with HNO3 (7 mL) + H2O2 (2 mL). Digestion program and conditions validated against ERM-BD 150 and 151. NIM: TMAH extraction method. NIST: After microwave digestion, iodine was observed to be lower than expected in the control sample SRM 1849a. This was due to adsorption of I to the walls of the vessels for the microwave assembly. Suspensions were used to circumvent this problem. NIMT: Nitric acid is solely employed for achieving clear digest, under microwave condition used. TUBITAK UME: For K, closed vessel microwave assisted sample digestion was used to bring the sample into solution. For I, the extraction of analyte was performed using 5% tetramethylammonium hydroxide (TMAH) in PFA vessels in an oven at 105 °C for 2 hours. VNIIM: Close vessel microwave acid digestion (MARS-5). After microwave acid digestion and dilution by deionized water up to 50 ml.
Digestion/dissolution of inorganic matrices All techniques and procedures used to bring a sample that is primarily inorganic in nature into solution suitable for liquid sample introduction to the ICP.
CENAM, EXHM, GLHK, HSA, NIMT, NIST, NMISA, SP, TUBITAK UME, VNIIM
INMETRO, NIM
Volatile element containment All techniques and procedures used to prevent the loss of potentially volatile analyte elements during sample treatment and storage.
CENAM, EXHM, GLHK, INM, INMETRO, NIM, NIMT, NMISA, SP, TUBITAK UME (K)
HSA, INM, NIST, TUBITAK UME (I), VNIIM
HSA: Alkaline extraction was used to prevent the loss of iodine. INM: Closed vessels sample digestion NIM: TMAH extraction method. NIST: Samples were not heated to prevent any volatility of I. The samples were only shaken to create the suspensions.
Page 39 of 57
Capabilities/Challenges Not tested Tested Specific challenges encountered TUBITAK UME: Extractions with alkaline reagent (TMAH) in closed vessels were applied to avoid losses of iodine. VNIIM: Close vessel digestion. Cooling to room temperature
Pre-concentration Techniques and procedures used to increase the concentration of the analyte introduced to the ICP. Includes evaporation, ion-exchange, extraction, precipitation procedures, but not vapor generation procedures.
CENAM, EXHM, GLHK, INM, NIM, NIMT, NIST, NMISA, SP, TUBITAK UME, VNIIM
HSA, INMETRO INMETRO: We optimized the sample digestion procedure to reduce the amount of HNO3 used and avoid high dilution during the analysis by ICP-MS
Vapor generation Techniques such as hydride generation and cold vapor generation used to remove the analyte from the sample as a gas for introduction into the ICP.
CENAM, EXHM, GLHK, HSA, INM, INMETRO, NIM, NIMT, NIST, NMISA, SP, TUBITAK UME, VNIIM
Matrix separation Techniques and procedures used to isolate the analyte(s) from the sample matrix to avoid or reduce interferences caused by the matrix. Includes ion-exchange, extraction, precipitation procedures, but not vapor generation procedures. Techniques and procedures used to isolate the analyte(s) from the sample matrix to avoid or reduce interferences caused by the matrix. Includes ion-exchange, extraction, precipitation procedures, but not vapor generation procedures.
CENAM, EXHM, GLHK, HSA, INMETRO, NIMT, NIST, NMISA, SP, TUBITAK UME, VNIIM
INM, NIM INM: Selection of isotopes; recommended correction for possible interferences caused by the matrix. Standard addition for Cu. NIM: TMAH extraction method.
Calibration of analyte concentration The preparation of calibration standards and the strategy for instrument calibration. Includes external calibration and standard additions procedures.
NIMT CENAM, EXHM, GLHK, HSA, INM, INMETRO, NIM, NIST, NMIJ, NMISA, SP, TUBITAK UME, VNIIM
CENAM: The calibration standards were prepared gravimetrically and for the analyte concentration a calibration curve with internal standard was used. EXHM: Gravimetric standard additions. GLHK: For both Cu and K, gravimetric standard addition approach utilizing Ge and Rh as an internal standard was employed respectively. For I, gravimetric standard addition approach utilizing Te as an internal standard was employed. HSA: Standard addition was used. INM: External calibration; bracketing; Preparation of calibration standard by weight. ERM-BD 150 and 151 used for validation.
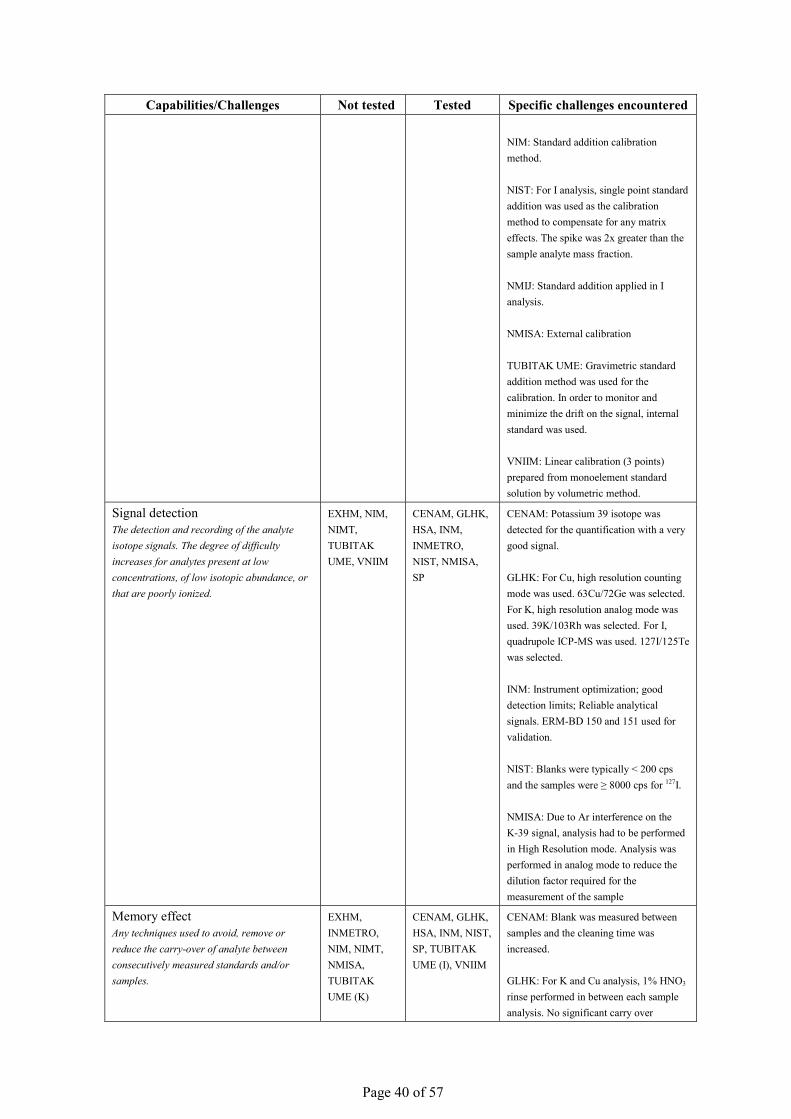
Page 40 of 57
Capabilities/Challenges Not tested Tested Specific challenges encountered NIM: Standard addition calibration method. NIST: For I analysis, single point standard addition was used as the calibration method to compensate for any matrix effects. The spike was 2x greater than the sample analyte mass fraction. NMIJ: Standard addition applied in I analysis. NMISA: External calibration TUBITAK UME: Gravimetric standard addition method was used for the calibration. In order to monitor and minimize the drift on the signal, internal standard was used. VNIIM: Linear calibration (3 points) prepared from monoelement standard solution by volumetric method.
Signal detection The detection and recording of the analyte isotope signals. The degree of difficulty increases for analytes present at low concentrations, of low isotopic abundance, or that are poorly ionized.
EXHM, NIM, NIMT, TUBITAK UME, VNIIM
CENAM, GLHK, HSA, INM, INMETRO, NIST, NMISA, SP
CENAM: Potassium 39 isotope was detected for the quantification with a very good signal. GLHK: For Cu, high resolution counting mode was used. 63Cu/72Ge was selected. For K, high resolution analog mode was used. 39K/103Rh was selected. For I, quadrupole ICP-MS was used. 127I/125Te was selected. INM: Instrument optimization; good detection limits; Reliable analytical signals. ERM-BD 150 and 151 used for validation. NIST: Blanks were typically < 200 cps and the samples were ≥ 8000 cps for 127I. NMISA: Due to Ar interference on the K-39 signal, analysis had to be performed in High Resolution mode. Analysis was performed in analog mode to reduce the dilution factor required for the measurement of the sample
Memory effect Any techniques used to avoid, remove or reduce the carry-over of analyte between consecutively measured standards and/or samples.
EXHM, INMETRO, NIM, NIMT, NMISA, TUBITAK UME (K)
CENAM, GLHK, HSA, INM, NIST, SP, TUBITAK UME (I), VNIIM
CENAM: Blank was measured between samples and the cleaning time was increased. GLHK: For K and Cu analysis, 1% HNO3 rinse performed in between each sample analysis. No significant carry over
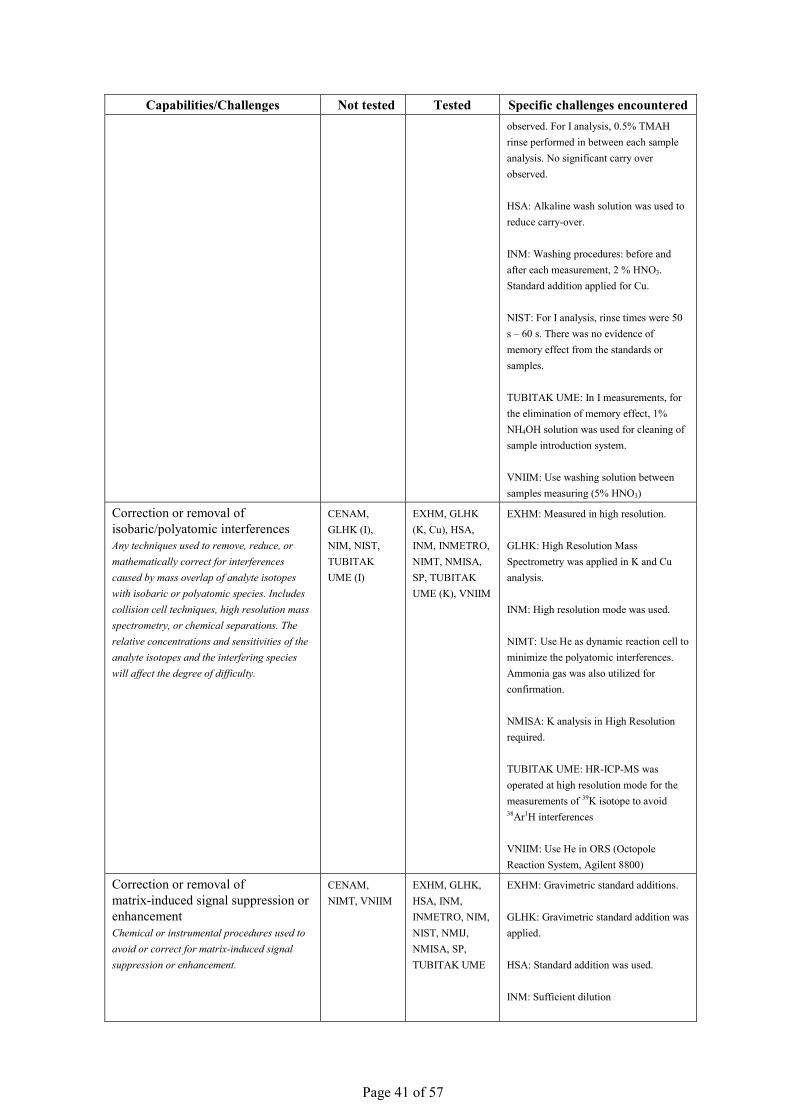
Page 41 of 57
Capabilities/Challenges Not tested Tested Specific challenges encountered observed. For I analysis, 0.5% TMAH rinse performed in between each sample analysis. No significant carry over observed. HSA: Alkaline wash solution was used to reduce carry-over. INM: Washing procedures: before and after each measurement, 2 % HNO3. Standard addition applied for Cu. NIST: For I analysis, rinse times were 50 s – 60 s. There was no evidence of memory effect from the standards or samples. TUBITAK UME: In I measurements, for the elimination of memory effect, 1% NH4OH solution was used for cleaning of sample introduction system. VNIIM: Use washing solution between samples measuring (5% HNO3)
Correction or removal of isobaric/polyatomic interferences Any techniques used to remove, reduce, or mathematically correct for interferences caused by mass overlap of analyte isotopes with isobaric or polyatomic species. Includes collision cell techniques, high resolution mass spectrometry, or chemical separations. The relative concentrations and sensitivities of the analyte isotopes and the interfering species will affect the degree of difficulty.
CENAM, GLHK (I), NIM, NIST, TUBITAK UME (I)
EXHM, GLHK (K, Cu), HSA, INM, INMETRO, NIMT, NMISA, SP, TUBITAK UME (K), VNIIM
EXHM: Measured in high resolution. GLHK: High Resolution Mass Spectrometry was applied in K and Cu analysis. INM: High resolution mode was used. NIMT: Use He as dynamic reaction cell to minimize the polyatomic interferences. Ammonia gas was also utilized for confirmation. NMISA: K analysis in High Resolution required. TUBITAK UME: HR-ICP-MS was operated at high resolution mode for the measurements of 39K isotope to avoid 38Ar1H interferences VNIIM: Use He in ORS (Octopole Reaction System, Agilent 8800)
Correction or removal of matrix-induced signal suppression or enhancement Chemical or instrumental procedures used to avoid or correct for matrix-induced signal suppression or enhancement.
CENAM, NIMT, VNIIM
EXHM, GLHK, HSA, INM, INMETRO, NIM, NIST, NMIJ, NMISA, SP, TUBITAK UME
EXHM: Gravimetric standard additions. GLHK: Gravimetric standard addition was applied. HSA: Standard addition was used. INM: Sufficient dilution
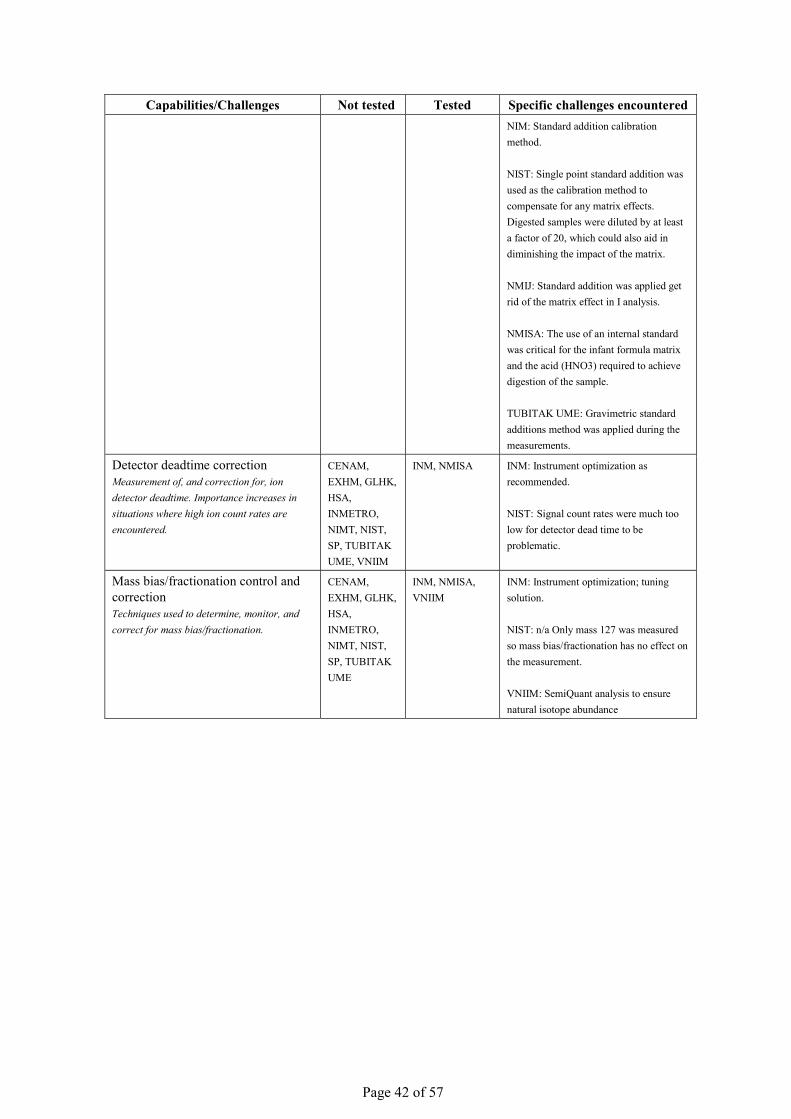
Page 42 of 57
Capabilities/Challenges Not tested Tested Specific challenges encountered NIM: Standard addition calibration method. NIST: Single point standard addition was used as the calibration method to compensate for any matrix effects. Digested samples were diluted by at least a factor of 20, which could also aid in diminishing the impact of the matrix. NMIJ: Standard addition was applied get rid of the matrix effect in I analysis. NMISA: The use of an internal standard was critical for the infant formula matrix and the acid (HNO3) required to achieve digestion of the sample. TUBITAK UME: Gravimetric standard additions method was applied during the measurements.
Detector deadtime correction Measurement of, and correction for, ion detector deadtime. Importance increases in situations where high ion count rates are encountered.
CENAM, EXHM, GLHK, HSA, INMETRO, NIMT, NIST, SP, TUBITAK UME, VNIIM
INM, NMISA INM: Instrument optimization as recommended. NIST: Signal count rates were much too low for detector dead time to be problematic.
Mass bias/fractionation control and correction Techniques used to determine, monitor, and correct for mass bias/fractionation.
CENAM, EXHM, GLHK, HSA, INMETRO, NIMT, NIST, SP, TUBITAK UME
INM, NMISA, VNIIM
INM: Instrument optimization; tuning solution. NIST: n/a Only mass 127 was measured so mass bias/fractionation has no effect on the measurement. VNIIM: SemiQuant analysis to ensure natural isotope abundance
Page 43 of 57
Inorganic Core Capabilities Table Summary Table
CCQM Study: CCQM-K125 Elements in Infant Formula Institute(s): INMETRO (K), INRAP (K, Cu), KRISS (K, Cu) (secondary method), LATU (K), LGC (K),
NIST (K, Cu), NRC (K, Cu) (principle method), PTB (K), SP (K) Method: ICP-OES Analyte(s): K, Cu
Capabilities/Challenges Not tested Tested Specific challenges encountered Contamination control and correction All techniques and procedures employed to reduce potential contamination of samples as well as blank correction procedures. The level of difficulty is greatest for analytes that are environmentally ubiquitous and also present at very low concentrations in the sample.
PTB INMETRO, INRAP, KRISS, LATU, LGC, NIST, NRC, SP
INMETRO: Adopted procedures to avoid contamination included: in-house distilled acid for purification and blank control. INRAP: Tested for ultra trace elements in Cu analysis. LGC: Plastic were pre-soaked in 1% nitric acid and rinsed with high purity water before use. NRC: Contamination is controlled by preparing samples in class-10 or class-100 clean room and use of high purity reagents. NIST: Microwave vessels were cleaned and rinsed thoroughly between digestions. Blanks were also run through the entire procedure to identify if contamination occurred.
Digestion/dissolution of organic matrices All techniques and procedures used to bring a sample that is primarily organic in nature into solution suitable for liquid sample introduction to the ICP.
INRAP INMETRO, KRISS, LATU, LGC, NIST, PTB, SP
LGC: Closed vessel microwave digestion with nitric acid and hydrogen peroxide. NIST: No specific challenges. NRC: Mix acid microwave digestion was performed. PTB: Fair amounts of fat, proteins, and carbohydrates had to be digested at a sufficiently high temperature.
Digestion/dissolution of inorganic matrices All techniques and procedures used to bring a sample that is primarily inorganic in nature into solution suitable for liquid sample introduction to the ICP.
INRAP, LATU, LGC, NIST, PTB, SP
INMETRO, KRISS
Volatile element containment All techniques and procedures used to prevent the loss of potentially volatile analyte elements during sample treatment and storage.
INMETRO, INRAP, KRISS, LATU, LGC, NIST, PTB, SP
Pre-concentration Techniques and procedures used to increase the concentration of the analyte introduced to the ICP. Includes evaporation, ion-exchange, extraction, precipitation procedures, but not
INRAP, KRISS, LATU, LGC, NIST, PTB, SP
INMETRO INMETRO: We optimized the sample digestion procedure to reduce the amount of HNO3 used and avoid high dilution during the analysis by ICP OES.
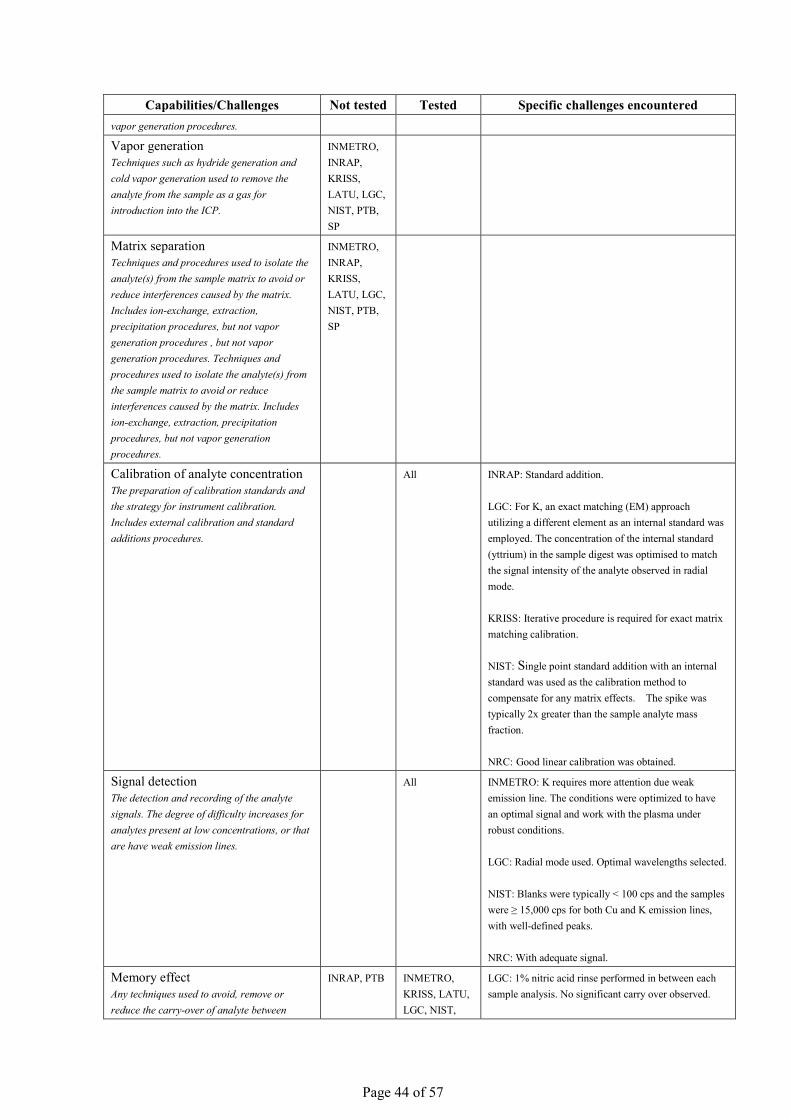
Page 44 of 57
Capabilities/Challenges Not tested Tested Specific challenges encountered vapor generation procedures.
Vapor generation Techniques such as hydride generation and cold vapor generation used to remove the analyte from the sample as a gas for introduction into the ICP.
INMETRO, INRAP, KRISS, LATU, LGC, NIST, PTB, SP
Matrix separation Techniques and procedures used to isolate the analyte(s) from the sample matrix to avoid or reduce interferences caused by the matrix. Includes ion-exchange, extraction, precipitation procedures, but not vapor generation procedures , but not vapor generation procedures. Techniques and procedures used to isolate the analyte(s) from the sample matrix to avoid or reduce interferences caused by the matrix. Includes ion-exchange, extraction, precipitation procedures, but not vapor generation procedures.
INMETRO, INRAP, KRISS, LATU, LGC, NIST, PTB, SP
Calibration of analyte concentration The preparation of calibration standards and the strategy for instrument calibration. Includes external calibration and standard additions procedures.
All INRAP: Standard addition. LGC: For K, an exact matching (EM) approach utilizing a different element as an internal standard was employed. The concentration of the internal standard (yttrium) in the sample digest was optimised to match the signal intensity of the analyte observed in radial mode. KRISS: Iterative procedure is required for exact matrix matching calibration. NIST: Single point standard addition with an internal standard was used as the calibration method to compensate for any matrix effects. The spike was typically 2x greater than the sample analyte mass fraction. NRC: Good linear calibration was obtained.
Signal detection The detection and recording of the analyte signals. The degree of difficulty increases for analytes present at low concentrations, or that are have weak emission lines.
All INMETRO: K requires more attention due weak emission line. The conditions were optimized to have an optimal signal and work with the plasma under robust conditions. LGC: Radial mode used. Optimal wavelengths selected. NIST: Blanks were typically < 100 cps and the samples were ≥ 15,000 cps for both Cu and K emission lines, with well-defined peaks. NRC: With adequate signal.
Memory effect Any techniques used to avoid, remove or reduce the carry-over of analyte between
INRAP, PTB INMETRO, KRISS, LATU, LGC, NIST,
LGC: 1% nitric acid rinse performed in between each sample analysis. No significant carry over observed.
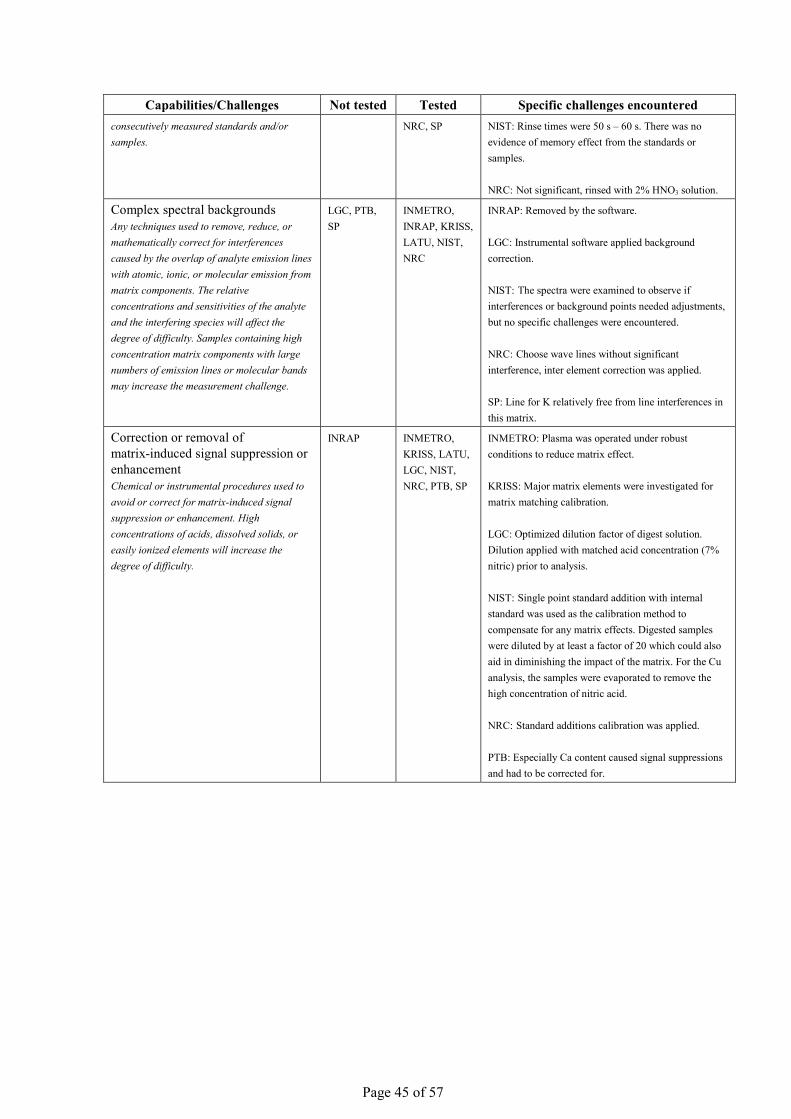
Page 45 of 57
Capabilities/Challenges Not tested Tested Specific challenges encountered consecutively measured standards and/or samples.
NRC, SP NIST: Rinse times were 50 s – 60 s. There was no evidence of memory effect from the standards or samples. NRC: Not significant, rinsed with 2% HNO3 solution.
Complex spectral backgrounds Any techniques used to remove, reduce, or mathematically correct for interferences caused by the overlap of analyte emission lines with atomic, ionic, or molecular emission from matrix components. The relative concentrations and sensitivities of the analyte and the interfering species will affect the degree of difficulty. Samples containing high concentration matrix components with large numbers of emission lines or molecular bands may increase the measurement challenge.
LGC, PTB, SP
INMETRO, INRAP, KRISS, LATU, NIST, NRC
INRAP: Removed by the software. LGC: Instrumental software applied background correction. NIST: The spectra were examined to observe if interferences or background points needed adjustments, but no specific challenges were encountered. NRC: Choose wave lines without significant interference, inter element correction was applied. SP: Line for K relatively free from line interferences in this matrix.
Correction or removal of matrix-induced signal suppression or enhancement Chemical or instrumental procedures used to avoid or correct for matrix-induced signal suppression or enhancement. High concentrations of acids, dissolved solids, or easily ionized elements will increase the degree of difficulty.
INRAP INMETRO, KRISS, LATU, LGC, NIST, NRC, PTB, SP
INMETRO: Plasma was operated under robust conditions to reduce matrix effect. KRISS: Major matrix elements were investigated for matrix matching calibration. LGC: Optimized dilution factor of digest solution. Dilution applied with matched acid concentration (7% nitric) prior to analysis. NIST: Single point standard addition with internal standard was used as the calibration method to compensate for any matrix effects. Digested samples were diluted by at least a factor of 20 which could also aid in diminishing the impact of the matrix. For the Cu analysis, the samples were evaporated to remove the high concentration of nitric acid. NRC: Standard additions calibration was applied. PTB: Especially Ca content caused signal suppressions and had to be corrected for.
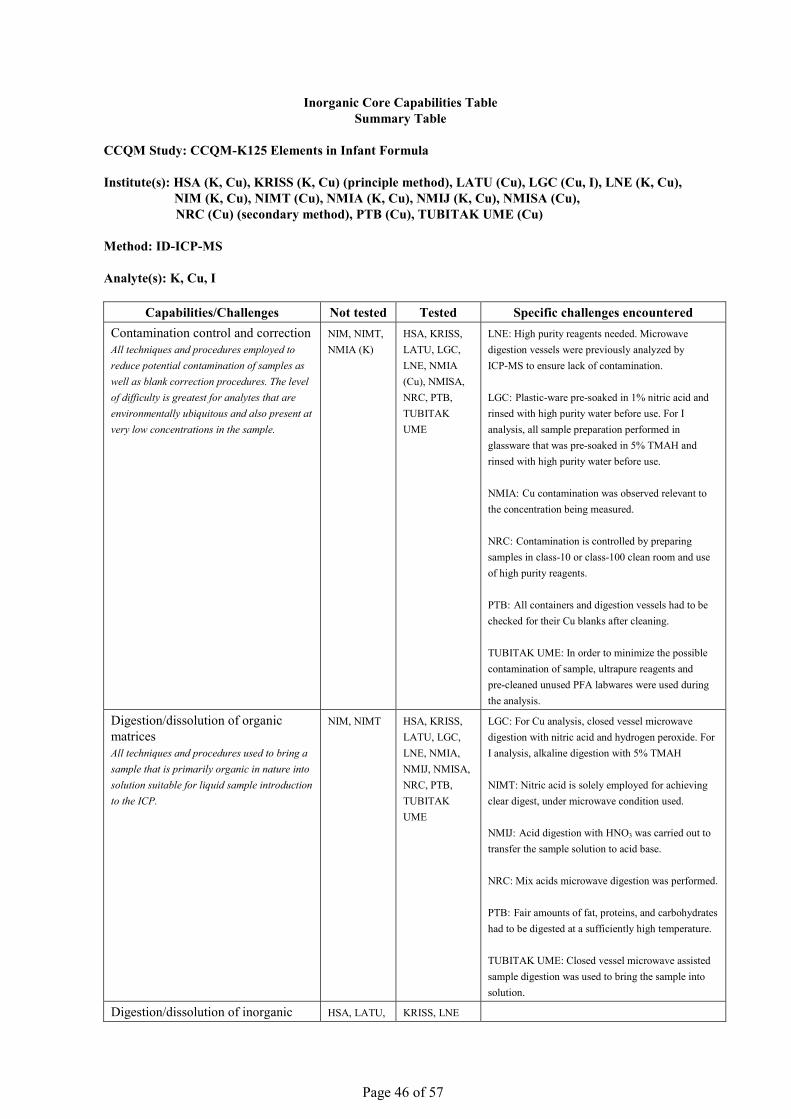
Page 46 of 57
Inorganic Core Capabilities Table Summary Table
CCQM Study: CCQM-K125 Elements in Infant Formula Institute(s): HSA (K, Cu), KRISS (K, Cu) (principle method), LATU (Cu), LGC (Cu, I), LNE (K, Cu), NIM (K, Cu), NIMT (Cu), NMIA (K, Cu), NMIJ (K, Cu), NMISA (Cu),
NRC (Cu) (secondary method), PTB (Cu), TUBITAK UME (Cu) Method: ID-ICP-MS Analyte(s): K, Cu, I
Capabilities/Challenges Not tested Tested Specific challenges encountered Contamination control and correction All techniques and procedures employed to reduce potential contamination of samples as well as blank correction procedures. The level of difficulty is greatest for analytes that are environmentally ubiquitous and also present at very low concentrations in the sample.
NIM, NIMT, NMIA (K)
HSA, KRISS, LATU, LGC, LNE, NMIA (Cu), NMISA, NRC, PTB, TUBITAK UME
LNE: High purity reagents needed. Microwave digestion vessels were previously analyzed by ICP-MS to ensure lack of contamination. LGC: Plastic-ware pre-soaked in 1% nitric acid and rinsed with high purity water before use. For I analysis, all sample preparation performed in glassware that was pre-soaked in 5% TMAH and rinsed with high purity water before use. NMIA: Cu contamination was observed relevant to the concentration being measured. NRC: Contamination is controlled by preparing samples in class-10 or class-100 clean room and use of high purity reagents. PTB: All containers and digestion vessels had to be checked for their Cu blanks after cleaning. TUBITAK UME: In order to minimize the possible contamination of sample, ultrapure reagents and pre-cleaned unused PFA labwares were used during the analysis.
Digestion/dissolution of organic matrices All techniques and procedures used to bring a sample that is primarily organic in nature into solution suitable for liquid sample introduction to the ICP.
NIM, NIMT HSA, KRISS, LATU, LGC, LNE, NMIA, NMIJ, NMISA, NRC, PTB, TUBITAK UME
LGC: For Cu analysis, closed vessel microwave digestion with nitric acid and hydrogen peroxide. For I analysis, alkaline digestion with 5% TMAH NIMT: Nitric acid is solely employed for achieving clear digest, under microwave condition used. NMIJ: Acid digestion with HNO3 was carried out to transfer the sample solution to acid base. NRC: Mix acids microwave digestion was performed. PTB: Fair amounts of fat, proteins, and carbohydrates had to be digested at a sufficiently high temperature. TUBITAK UME: Closed vessel microwave assisted sample digestion was used to bring the sample into solution.
Digestion/dissolution of inorganic HSA, LATU, KRISS, LNE
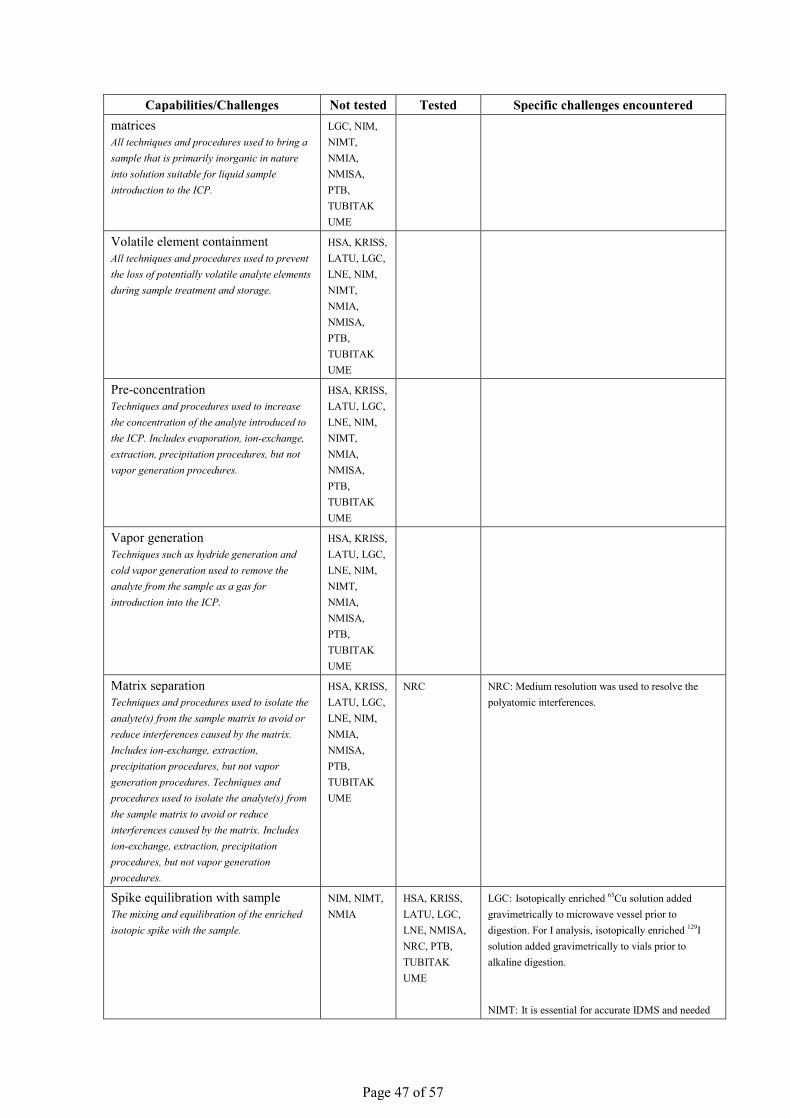
Page 47 of 57
Capabilities/Challenges Not tested Tested Specific challenges encountered matrices All techniques and procedures used to bring a sample that is primarily inorganic in nature into solution suitable for liquid sample introduction to the ICP.
LGC, NIM, NIMT, NMIA, NMISA, PTB, TUBITAK UME
Volatile element containment All techniques and procedures used to prevent the loss of potentially volatile analyte elements during sample treatment and storage.
HSA, KRISS, LATU, LGC, LNE, NIM, NIMT, NMIA, NMISA, PTB, TUBITAK UME
Pre-concentration Techniques and procedures used to increase the concentration of the analyte introduced to the ICP. Includes evaporation, ion-exchange, extraction, precipitation procedures, but not vapor generation procedures.
HSA, KRISS, LATU, LGC, LNE, NIM, NIMT, NMIA, NMISA, PTB, TUBITAK UME
Vapor generation Techniques such as hydride generation and cold vapor generation used to remove the analyte from the sample as a gas for introduction into the ICP.
HSA, KRISS, LATU, LGC, LNE, NIM, NIMT, NMIA, NMISA, PTB, TUBITAK UME
Matrix separation Techniques and procedures used to isolate the analyte(s) from the sample matrix to avoid or reduce interferences caused by the matrix. Includes ion-exchange, extraction, precipitation procedures, but not vapor generation procedures. Techniques and procedures used to isolate the analyte(s) from the sample matrix to avoid or reduce interferences caused by the matrix. Includes ion-exchange, extraction, precipitation procedures, but not vapor generation procedures.
HSA, KRISS, LATU, LGC, LNE, NIM, NMIA, NMISA, PTB, TUBITAK UME
NRC NRC: Medium resolution was used to resolve the polyatomic interferences.
Spike equilibration with sample The mixing and equilibration of the enriched isotopic spike with the sample.
NIM, NIMT, NMIA
HSA, KRISS, LATU, LGC, LNE, NMISA, NRC, PTB, TUBITAK UME
LGC: Isotopically enriched 65Cu solution added gravimetrically to microwave vessel prior to digestion. For I analysis, isotopically enriched 129I solution added gravimetrically to vials prior to alkaline digestion. NIMT: It is essential for accurate IDMS and needed
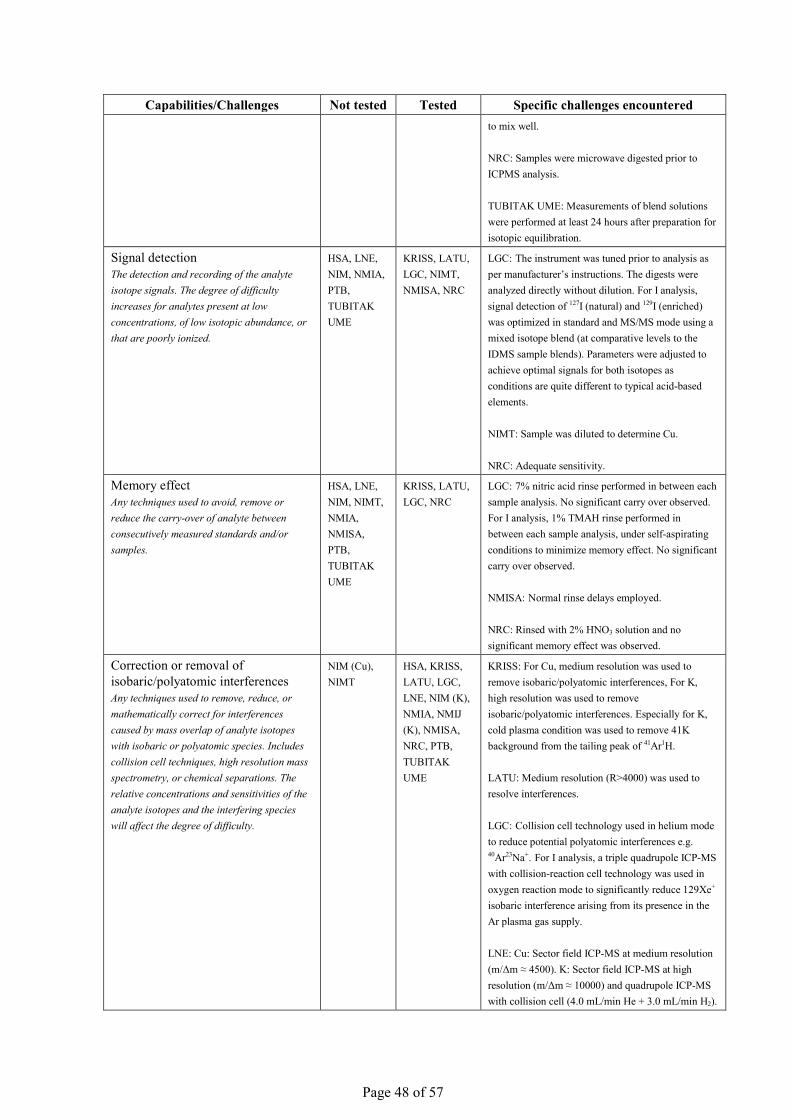
Page 48 of 57
Capabilities/Challenges Not tested Tested Specific challenges encountered to mix well. NRC: Samples were microwave digested prior to ICPMS analysis. TUBITAK UME: Measurements of blend solutions were performed at least 24 hours after preparation for isotopic equilibration.
Signal detection The detection and recording of the analyte isotope signals. The degree of difficulty increases for analytes present at low concentrations, of low isotopic abundance, or that are poorly ionized.
HSA, LNE, NIM, NMIA, PTB, TUBITAK UME
KRISS, LATU, LGC, NIMT, NMISA, NRC
LGC: The instrument was tuned prior to analysis as per manufacturer’s instructions. The digests were analyzed directly without dilution. For I analysis, signal detection of 127I (natural) and 129I (enriched) was optimized in standard and MS/MS mode using a mixed isotope blend (at comparative levels to the IDMS sample blends). Parameters were adjusted to achieve optimal signals for both isotopes as conditions are quite different to typical acid-based elements. NIMT: Sample was diluted to determine Cu. NRC: Adequate sensitivity.
Memory effect Any techniques used to avoid, remove or reduce the carry-over of analyte between consecutively measured standards and/or samples.
HSA, LNE, NIM, NIMT, NMIA, NMISA, PTB, TUBITAK UME
KRISS, LATU, LGC, NRC
LGC: 7% nitric acid rinse performed in between each sample analysis. No significant carry over observed. For I analysis, 1% TMAH rinse performed in between each sample analysis, under self-aspirating conditions to minimize memory effect. No significant carry over observed. NMISA: Normal rinse delays employed. NRC: Rinsed with 2% HNO3 solution and no significant memory effect was observed.
Correction or removal of isobaric/polyatomic interferences Any techniques used to remove, reduce, or mathematically correct for interferences caused by mass overlap of analyte isotopes with isobaric or polyatomic species. Includes collision cell techniques, high resolution mass spectrometry, or chemical separations. The relative concentrations and sensitivities of the analyte isotopes and the interfering species will affect the degree of difficulty.
NIM (Cu), NIMT
HSA, KRISS, LATU, LGC, LNE, NIM (K), NMIA, NMIJ (K), NMISA, NRC, PTB, TUBITAK UME
KRISS: For Cu, medium resolution was used to remove isobaric/polyatomic interferences, For K, high resolution was used to remove isobaric/polyatomic interferences. Especially for K, cold plasma condition was used to remove 41K background from the tailing peak of 41Ar1H. LATU: Medium resolution (R>4000) was used to resolve interferences. LGC: Collision cell technology used in helium mode to reduce potential polyatomic interferences e.g. 40Ar23Na+. For I analysis, a triple quadrupole ICP-MS with collision-reaction cell technology was used in oxygen reaction mode to significantly reduce 129Xe+ isobaric interference arising from its presence in the Ar plasma gas supply. LNE: Cu: Sector field ICP-MS at medium resolution (m/Δm ≈ 4500). K: Sector field ICP-MS at high resolution (m/Δm ≈ 10000) and quadrupole ICP-MS with collision cell (4.0 mL/min He + 3.0 mL/min H2).
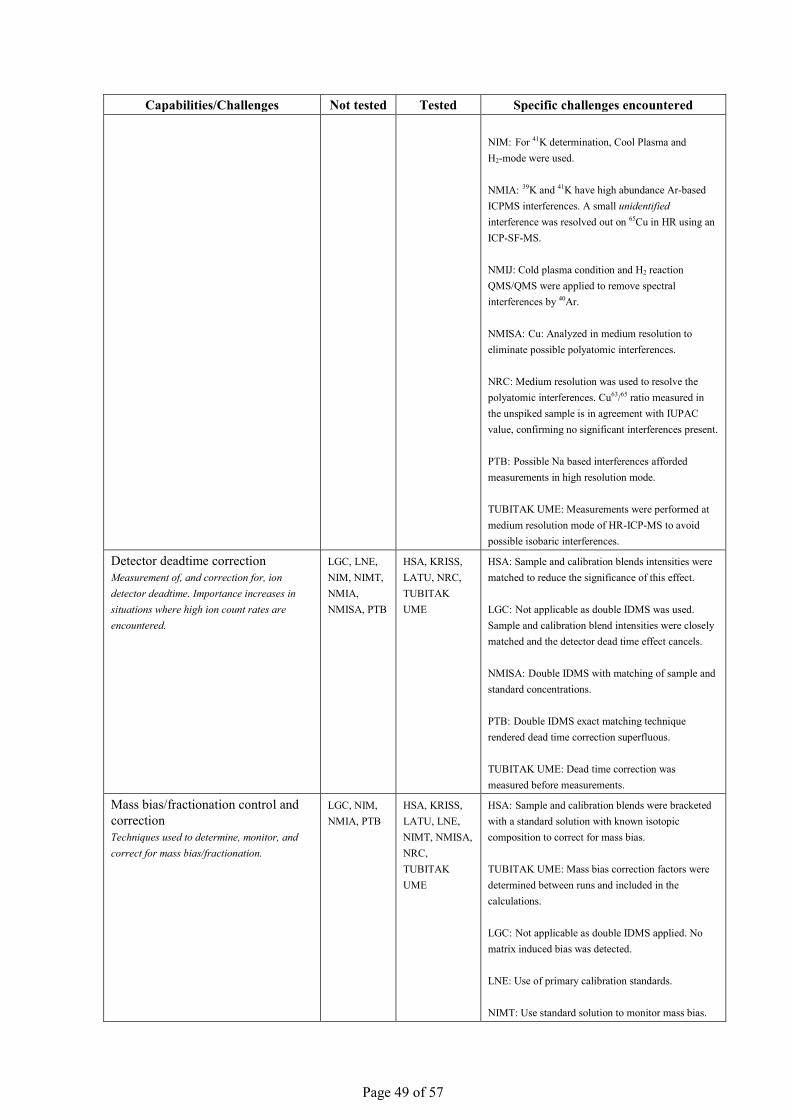
Page 49 of 57
Capabilities/Challenges Not tested Tested Specific challenges encountered NIM: For 41K determination, Cool Plasma and H2-mode were used. NMIA: 39K and 41K have high abundance Ar-based ICPMS interferences. A small unidentified interference was resolved out on 65Cu in HR using an ICP-SF-MS. NMIJ: Cold plasma condition and H2 reaction QMS/QMS were applied to remove spectral interferences by 40Ar. NMISA: Cu: Analyzed in medium resolution to eliminate possible polyatomic interferences. NRC: Medium resolution was used to resolve the polyatomic interferences. Cu63/65 ratio measured in the unspiked sample is in agreement with IUPAC value, confirming no significant interferences present. PTB: Possible Na based interferences afforded measurements in high resolution mode. TUBITAK UME: Measurements were performed at medium resolution mode of HR-ICP-MS to avoid possible isobaric interferences.
Detector deadtime correction Measurement of, and correction for, ion detector deadtime. Importance increases in situations where high ion count rates are encountered.
LGC, LNE, NIM, NIMT, NMIA, NMISA, PTB
HSA, KRISS, LATU, NRC, TUBITAK UME
HSA: Sample and calibration blends intensities were matched to reduce the significance of this effect. LGC: Not applicable as double IDMS was used. Sample and calibration blend intensities were closely matched and the detector dead time effect cancels. NMISA: Double IDMS with matching of sample and standard concentrations. PTB: Double IDMS exact matching technique rendered dead time correction superfluous. TUBITAK UME: Dead time correction was measured before measurements.
Mass bias/fractionation control and correction Techniques used to determine, monitor, and correct for mass bias/fractionation.
LGC, NIM, NMIA, PTB
HSA, KRISS, LATU, LNE, NIMT, NMISA, NRC, TUBITAK UME
HSA: Sample and calibration blends were bracketed with a standard solution with known isotopic composition to correct for mass bias. TUBITAK UME: Mass bias correction factors were determined between runs and included in the calculations. LGC: Not applicable as double IDMS applied. No matrix induced bias was detected. LNE: Use of primary calibration standards. NIMT: Use standard solution to monitor mass bias.
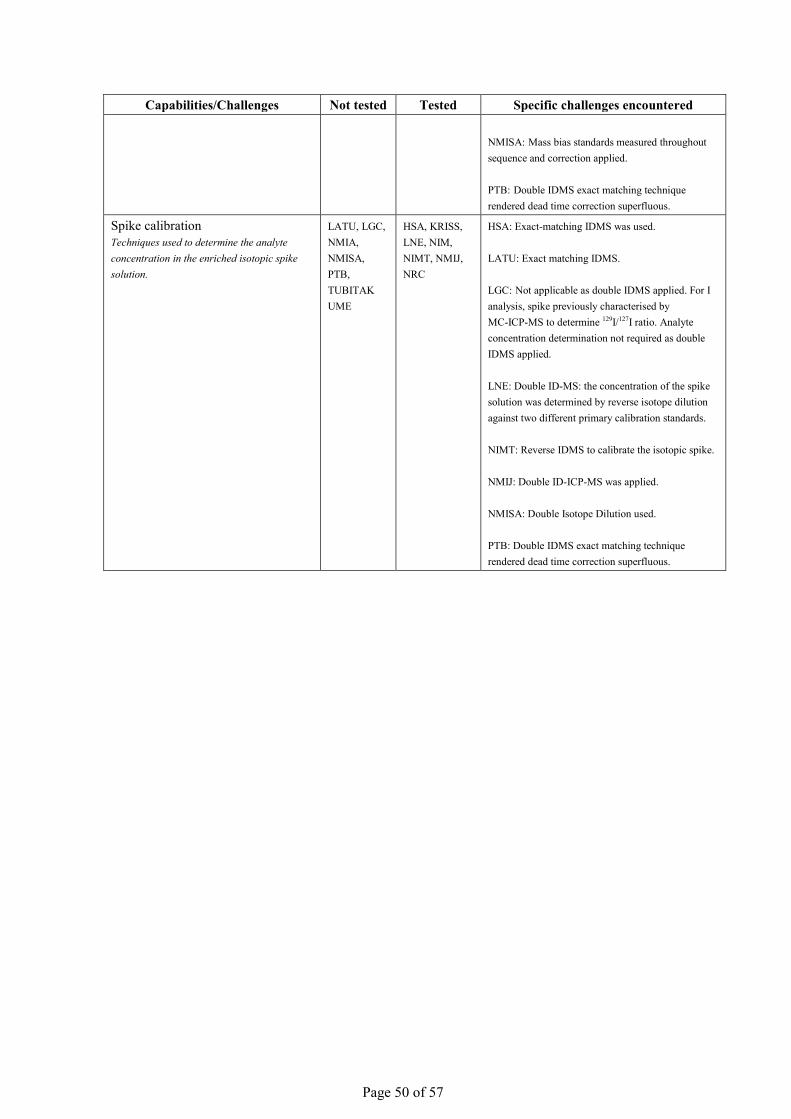
Page 50 of 57
Capabilities/Challenges Not tested Tested Specific challenges encountered NMISA: Mass bias standards measured throughout sequence and correction applied. PTB: Double IDMS exact matching technique rendered dead time correction superfluous.
Spike calibration Techniques used to determine the analyte concentration in the enriched isotopic spike solution.
LATU, LGC, NMIA, NMISA, PTB, TUBITAK UME
HSA, KRISS, LNE, NIM, NIMT, NMIJ, NRC
HSA: Exact-matching IDMS was used. LATU: Exact matching IDMS. LGC: Not applicable as double IDMS applied. For I analysis, spike previously characterised by MC-ICP-MS to determine 129I/127I ratio. Analyte concentration determination not required as double IDMS applied. LNE: Double ID-MS: the concentration of the spike solution was determined by reverse isotope dilution against two different primary calibration standards. NIMT: Reverse IDMS to calibrate the isotopic spike. NMIJ: Double ID-ICP-MS was applied. NMISA: Double Isotope Dilution used. PTB: Double IDMS exact matching technique rendered dead time correction superfluous.
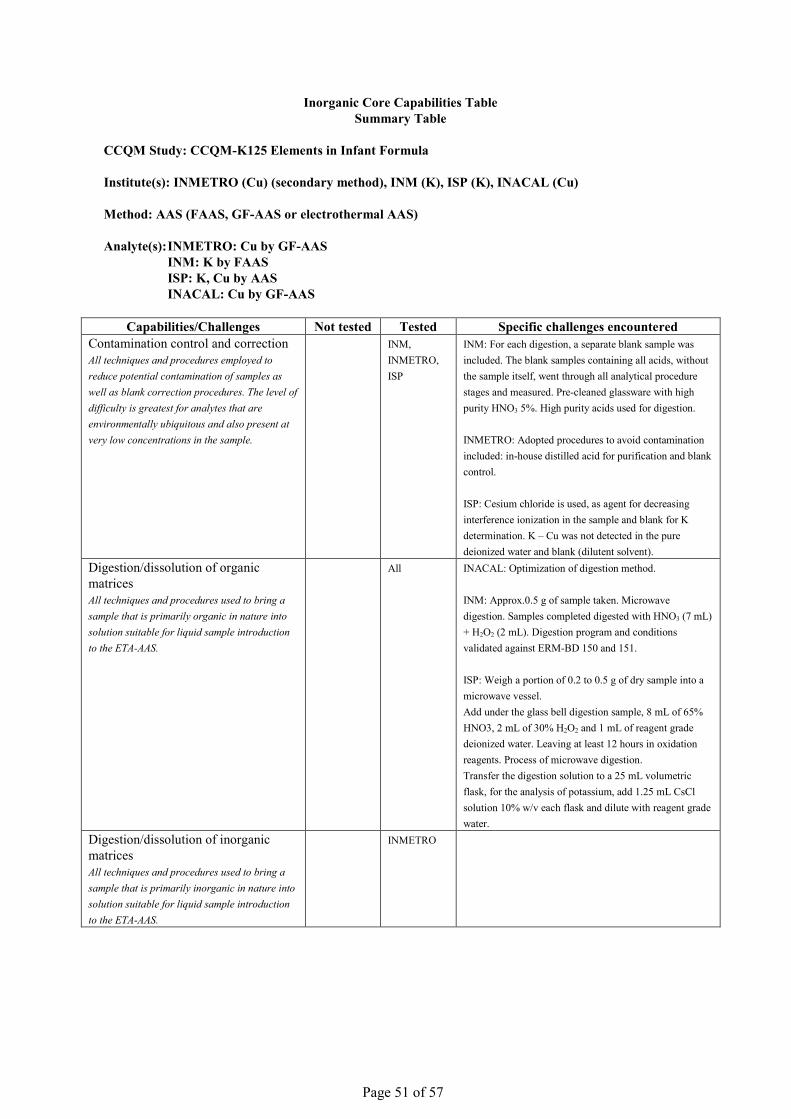
Page 51 of 57
Inorganic Core Capabilities Table Summary Table
CCQM Study: CCQM-K125 Elements in Infant Formula Institute(s): INMETRO (Cu) (secondary method), INM (K), ISP (K), INACAL (Cu) Method: AAS (FAAS, GF-AAS or electrothermal AAS) Analyte(s): INMETRO: Cu by GF-AAS
INM: K by FAAS ISP: K, Cu by AAS INACAL: Cu by GF-AAS
Capabilities/Challenges Not tested Tested Specific challenges encountered
Contamination control and correction All techniques and procedures employed to reduce potential contamination of samples as well as blank correction procedures. The level of difficulty is greatest for analytes that are environmentally ubiquitous and also present at very low concentrations in the sample.
INM, INMETRO, ISP
INM: For each digestion, a separate blank sample was included. The blank samples containing all acids, without the sample itself, went through all analytical procedure stages and measured. Pre-cleaned glassware with high purity HNO3 5%. High purity acids used for digestion. INMETRO: Adopted procedures to avoid contamination included: in-house distilled acid for purification and blank control. ISP: Cesium chloride is used, as agent for decreasing interference ionization in the sample and blank for K determination. K – Cu was not detected in the pure deionized water and blank (dilutent solvent).
Digestion/dissolution of organic matrices All techniques and procedures used to bring a sample that is primarily organic in nature into solution suitable for liquid sample introduction to the ETA-AAS.
All INACAL: Optimization of digestion method. INM: Approx.0.5 g of sample taken. Microwave digestion. Samples completed digested with HNO3 (7 mL) + H2O2 (2 mL). Digestion program and conditions validated against ERM-BD 150 and 151. ISP: Weigh a portion of 0.2 to 0.5 g of dry sample into a microwave vessel. Add under the glass bell digestion sample, 8 mL of 65% HNO3, 2 mL of 30% H2O2 and 1 mL of reagent grade deionized water. Leaving at least 12 hours in oxidation reagents. Process of microwave digestion. Transfer the digestion solution to a 25 mL volumetric flask, for the analysis of potassium, add 1.25 mL CsCl solution 10% w/v each flask and dilute with reagent grade water.
Digestion/dissolution of inorganic matrices All techniques and procedures used to bring a sample that is primarily inorganic in nature into solution suitable for liquid sample introduction to the ETA-AAS.
INMETRO
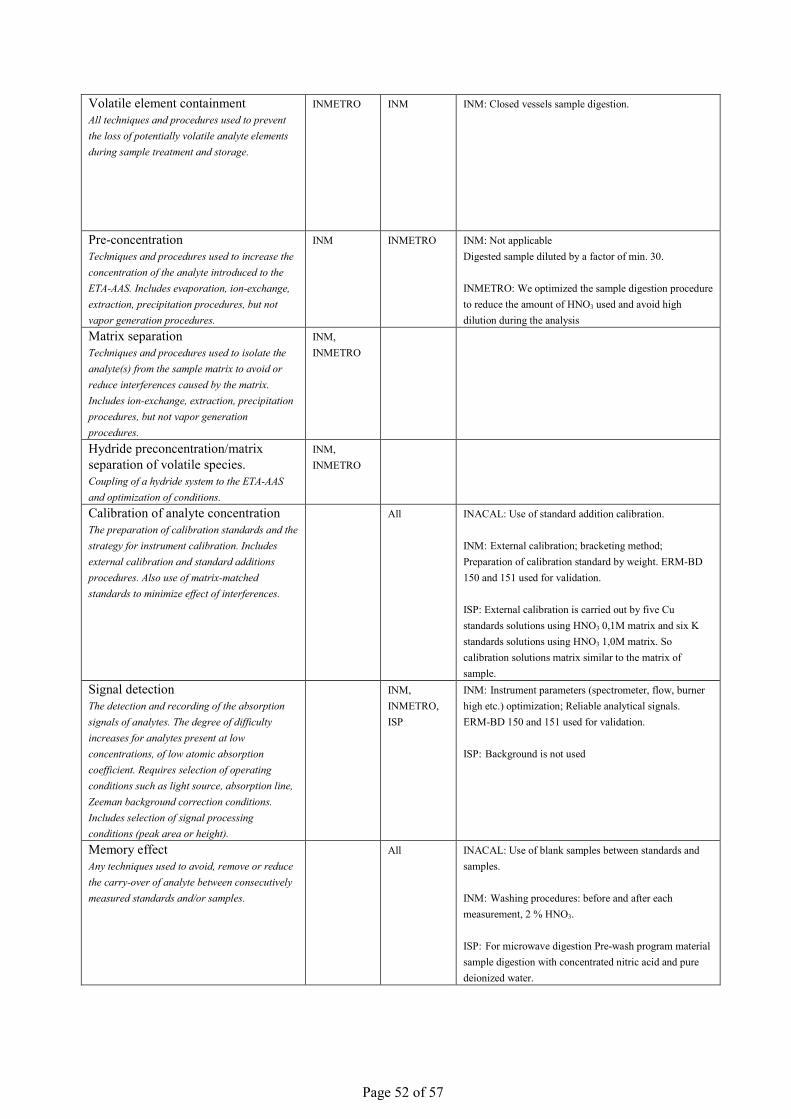
Page 52 of 57
Volatile element containment All techniques and procedures used to prevent the loss of potentially volatile analyte elements during sample treatment and storage.
INMETRO INM INM: Closed vessels sample digestion.
Pre-concentration Techniques and procedures used to increase the concentration of the analyte introduced to the ETA-AAS. Includes evaporation, ion-exchange, extraction, precipitation procedures, but not vapor generation procedures.
INM INMETRO INM: Not applicable Digested sample diluted by a factor of min. 30. INMETRO: We optimized the sample digestion procedure to reduce the amount of HNO3 used and avoid high dilution during the analysis
Matrix separation Techniques and procedures used to isolate the analyte(s) from the sample matrix to avoid or reduce interferences caused by the matrix. Includes ion-exchange, extraction, precipitation procedures, but not vapor generation procedures.
INM, INMETRO
Hydride preconcentration/matrix separation of volatile species. Coupling of a hydride system to the ETA-AAS and optimization of conditions.
INM, INMETRO
Calibration of analyte concentration The preparation of calibration standards and the strategy for instrument calibration. Includes external calibration and standard additions procedures. Also use of matrix-matched standards to minimize effect of interferences.
All INACAL: Use of standard addition calibration. INM: External calibration; bracketing method; Preparation of calibration standard by weight. ERM-BD 150 and 151 used for validation. ISP: External calibration is carried out by five Cu standards solutions using HNO3 0,1M matrix and six K standards solutions using HNO3 1,0M matrix. So calibration solutions matrix similar to the matrix of sample.
Signal detection The detection and recording of the absorption signals of analytes. The degree of difficulty increases for analytes present at low concentrations, of low atomic absorption coefficient. Requires selection of operating conditions such as light source, absorption line, Zeeman background correction conditions. Includes selection of signal processing conditions (peak area or height).
INM, INMETRO, ISP
INM: Instrument parameters (spectrometer, flow, burner high etc.) optimization; Reliable analytical signals. ERM-BD 150 and 151 used for validation. ISP: Background is not used
Memory effect Any techniques used to avoid, remove or reduce the carry-over of analyte between consecutively measured standards and/or samples.
All INACAL: Use of blank samples between standards and samples. INM: Washing procedures: before and after each measurement, 2 % HNO3. ISP: For microwave digestion Pre-wash program material sample digestion with concentrated nitric acid and pure deionized water.
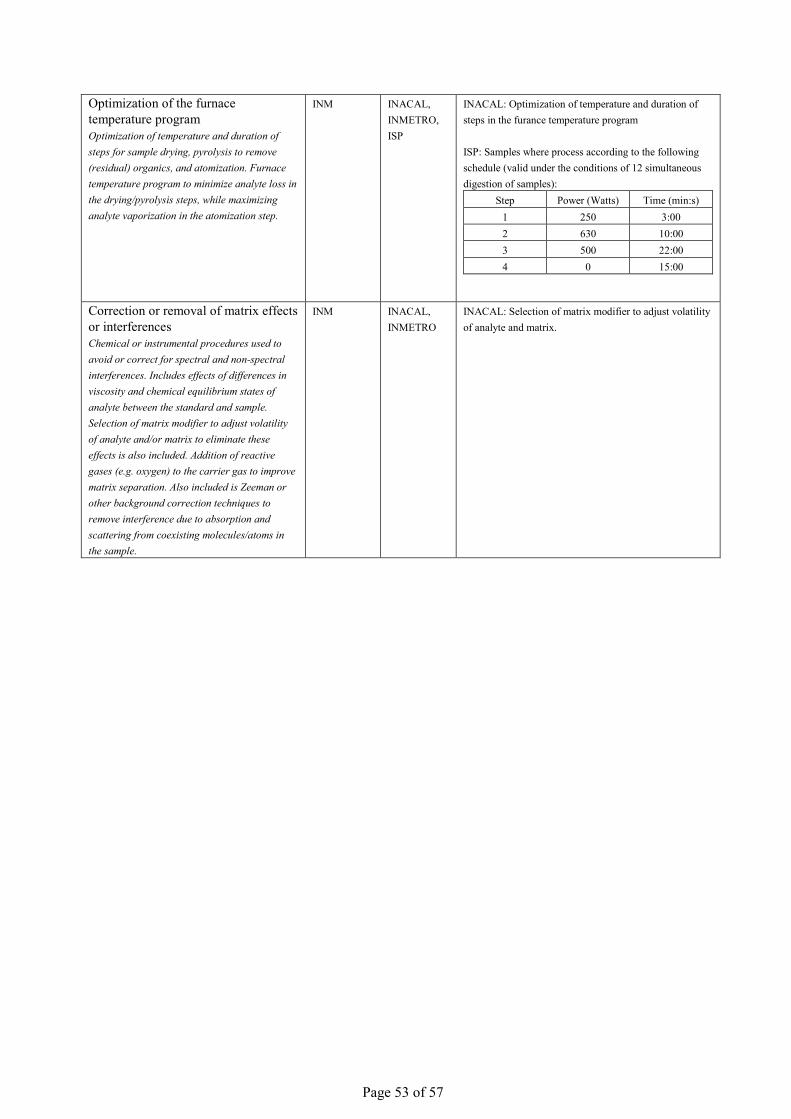
Page 53 of 57
Optimization of the furnace temperature program Optimization of temperature and duration of steps for sample drying, pyrolysis to remove (residual) organics, and atomization. Furnace temperature program to minimize analyte loss in the drying/pyrolysis steps, while maximizing analyte vaporization in the atomization step.
INM INACAL, INMETRO, ISP
INACAL: Optimization of temperature and duration of steps in the furance temperature program ISP: Samples where process according to the following schedule (valid under the conditions of 12 simultaneous digestion of samples):
Step Power (Watts) Time (min:s) 1 250 3:00 2 630 10:00 3 500 22:00 4 0 15:00
Correction or removal of matrix effects or interferences Chemical or instrumental procedures used to avoid or correct for spectral and non-spectral interferences. Includes effects of differences in viscosity and chemical equilibrium states of analyte between the standard and sample. Selection of matrix modifier to adjust volatility of analyte and/or matrix to eliminate these effects is also included. Addition of reactive gases (e.g. oxygen) to the carrier gas to improve matrix separation. Also included is Zeeman or other background correction techniques to remove interference due to absorption and scattering from coexisting molecules/atoms in the sample.
INM INACAL, INMETRO
INACAL: Selection of matrix modifier to adjust volatility of analyte and matrix.
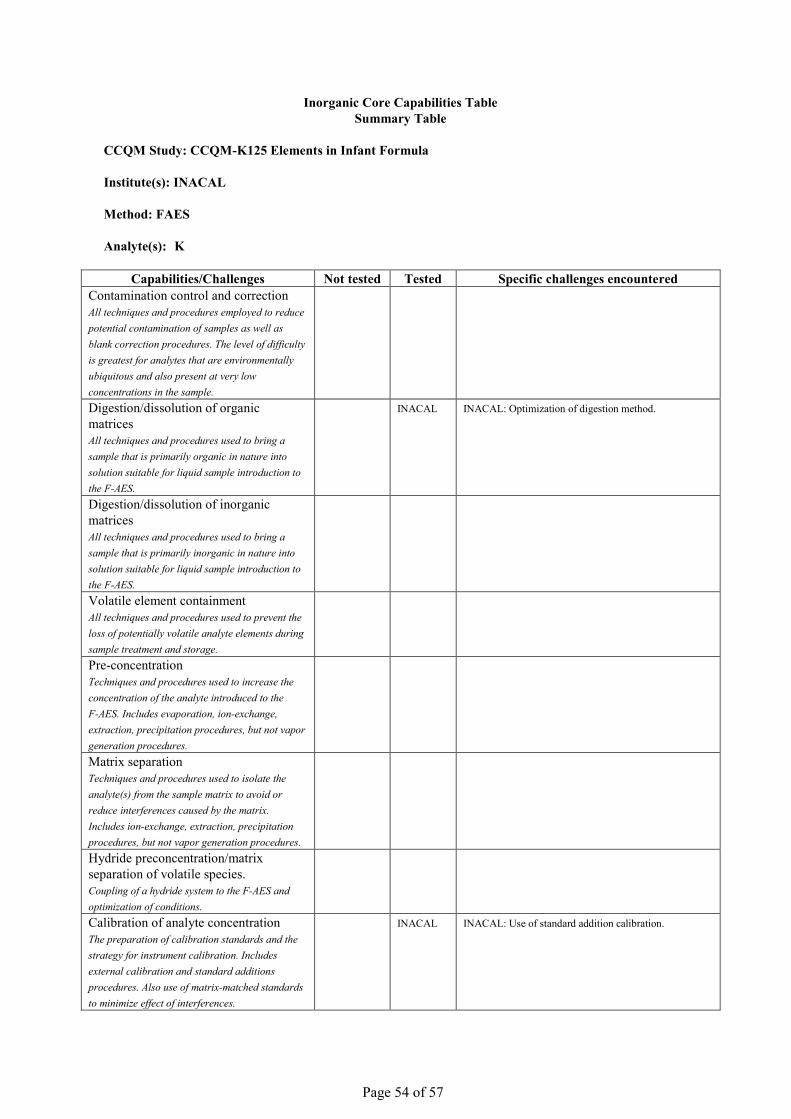
Page 54 of 57
Inorganic Core Capabilities Table Summary Table
CCQM Study: CCQM-K125 Elements in Infant Formula Institute(s): INACAL Method: FAES Analyte(s): K
Capabilities/Challenges Not tested Tested Specific challenges encountered Contamination control and correction All techniques and procedures employed to reduce potential contamination of samples as well as blank correction procedures. The level of difficulty is greatest for analytes that are environmentally ubiquitous and also present at very low concentrations in the sample.
Digestion/dissolution of organic matrices All techniques and procedures used to bring a sample that is primarily organic in nature into solution suitable for liquid sample introduction to the F-AES.
INACAL INACAL: Optimization of digestion method.
Digestion/dissolution of inorganic matrices All techniques and procedures used to bring a sample that is primarily inorganic in nature into solution suitable for liquid sample introduction to the F-AES.
Volatile element containment All techniques and procedures used to prevent the loss of potentially volatile analyte elements during sample treatment and storage.
Pre-concentration Techniques and procedures used to increase the concentration of the analyte introduced to the F-AES. Includes evaporation, ion-exchange, extraction, precipitation procedures, but not vapor generation procedures.
Matrix separation Techniques and procedures used to isolate the analyte(s) from the sample matrix to avoid or reduce interferences caused by the matrix. Includes ion-exchange, extraction, precipitation procedures, but not vapor generation procedures.
Hydride preconcentration/matrix separation of volatile species. Coupling of a hydride system to the F-AES and optimization of conditions.
Calibration of analyte concentration The preparation of calibration standards and the strategy for instrument calibration. Includes external calibration and standard additions procedures. Also use of matrix-matched standards to minimize effect of interferences.
INACAL INACAL: Use of standard addition calibration.
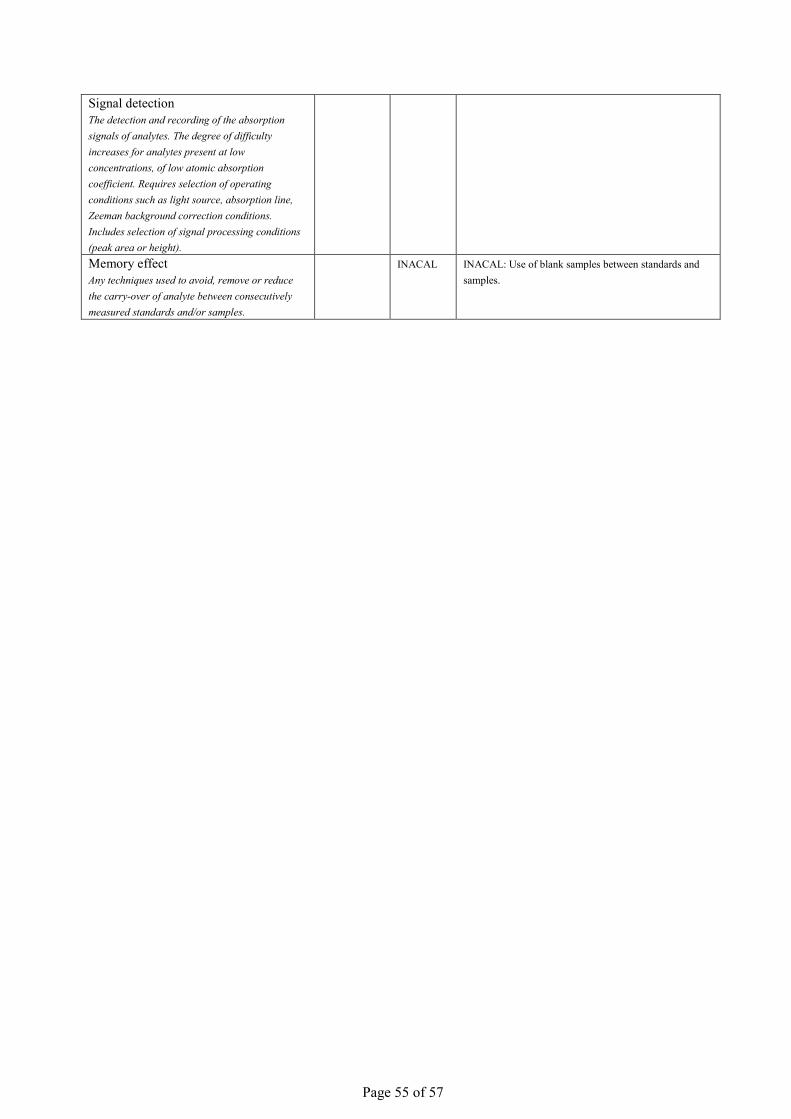
Page 55 of 57
Signal detection The detection and recording of the absorption signals of analytes. The degree of difficulty increases for analytes present at low concentrations, of low atomic absorption coefficient. Requires selection of operating conditions such as light source, absorption line, Zeeman background correction conditions. Includes selection of signal processing conditions (peak area or height).
Memory effect Any techniques used to avoid, remove or reduce the carry-over of analyte between consecutively measured standards and/or samples.
INACAL INACAL: Use of blank samples between standards and samples.
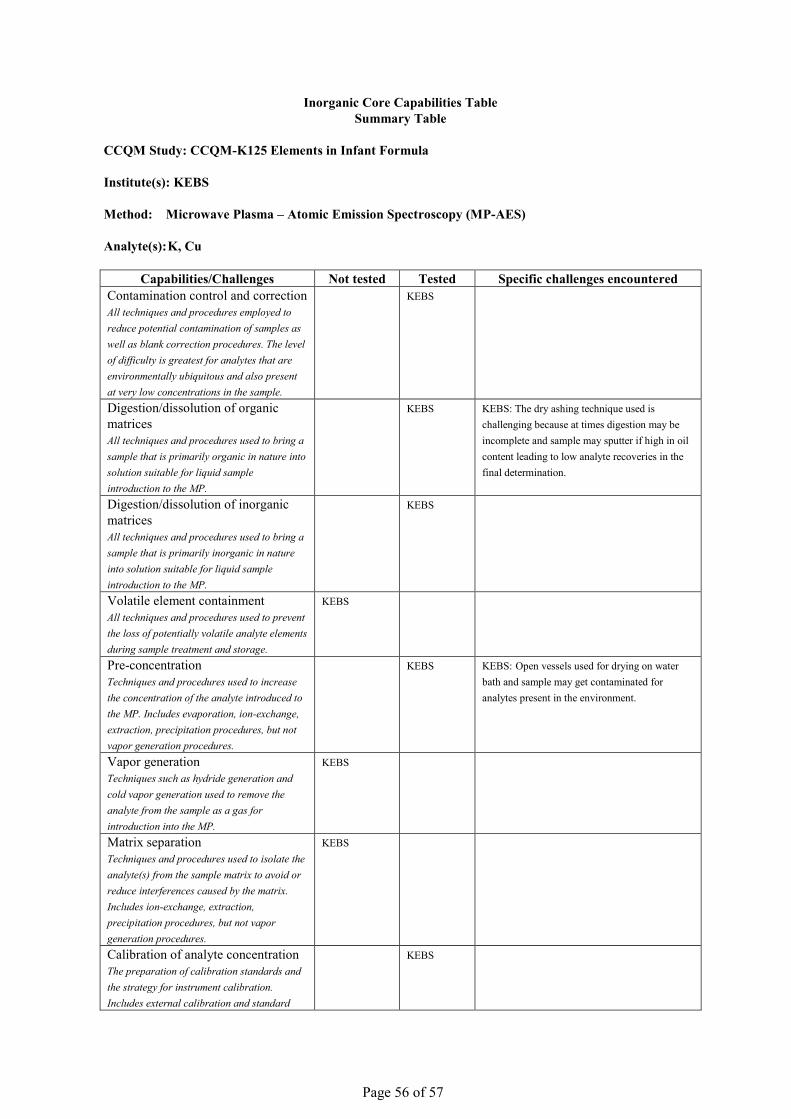
Page 56 of 57
Inorganic Core Capabilities Table Summary Table
CCQM Study: CCQM-K125 Elements in Infant Formula Institute(s): KEBS Method: Microwave Plasma – Atomic Emission Spectroscopy (MP-AES) Analyte(s): K, Cu
Capabilities/Challenges Not tested Tested Specific challenges encountered Contamination control and correction All techniques and procedures employed to reduce potential contamination of samples as well as blank correction procedures. The level of difficulty is greatest for analytes that are environmentally ubiquitous and also present at very low concentrations in the sample.
KEBS
Digestion/dissolution of organic matrices All techniques and procedures used to bring a sample that is primarily organic in nature into solution suitable for liquid sample introduction to the MP.
KEBS KEBS: The dry ashing technique used is challenging because at times digestion may be incomplete and sample may sputter if high in oil content leading to low analyte recoveries in the final determination.
Digestion/dissolution of inorganic matrices All techniques and procedures used to bring a sample that is primarily inorganic in nature into solution suitable for liquid sample introduction to the MP.
KEBS
Volatile element containment All techniques and procedures used to prevent the loss of potentially volatile analyte elements during sample treatment and storage.
KEBS
Pre-concentration Techniques and procedures used to increase the concentration of the analyte introduced to the MP. Includes evaporation, ion-exchange, extraction, precipitation procedures, but not vapor generation procedures.
KEBS KEBS: Open vessels used for drying on water bath and sample may get contaminated for analytes present in the environment.
Vapor generation Techniques such as hydride generation and cold vapor generation used to remove the analyte from the sample as a gas for introduction into the MP.
KEBS
Matrix separation Techniques and procedures used to isolate the analyte(s) from the sample matrix to avoid or reduce interferences caused by the matrix. Includes ion-exchange, extraction, precipitation procedures, but not vapor generation procedures.
KEBS
Calibration of analyte concentration The preparation of calibration standards and the strategy for instrument calibration. Includes external calibration and standard
KEBS
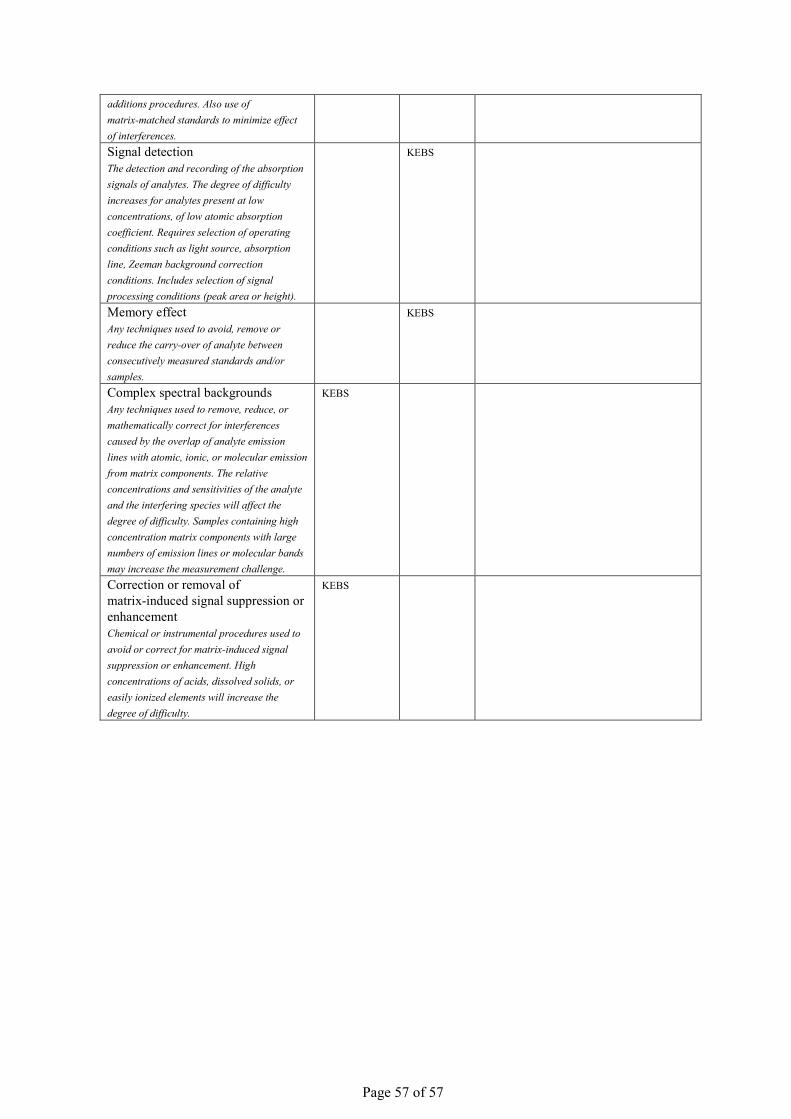
Page 57 of 57
additions procedures. Also use of matrix-matched standards to minimize effect of interferences. Signal detection The detection and recording of the absorption signals of analytes. The degree of difficulty increases for analytes present at low concentrations, of low atomic absorption coefficient. Requires selection of operating conditions such as light source, absorption line, Zeeman background correction conditions. Includes selection of signal processing conditions (peak area or height).
KEBS
Memory effect Any techniques used to avoid, remove or reduce the carry-over of analyte between consecutively measured standards and/or samples.
KEBS
Complex spectral backgrounds Any techniques used to remove, reduce, or mathematically correct for interferences caused by the overlap of analyte emission lines with atomic, ionic, or molecular emission from matrix components. The relative concentrations and sensitivities of the analyte and the interfering species will affect the degree of difficulty. Samples containing high concentration matrix components with large numbers of emission lines or molecular bands may increase the measurement challenge.
KEBS
Correction or removal of matrix-induced signal suppression or enhancement Chemical or instrumental procedures used to avoid or correct for matrix-induced signal suppression or enhancement. High concentrations of acids, dissolved solids, or easily ionized elements will increase the degree of difficulty.
KEBS