ccounting for stormwater wasteload a … recommendation ... this document standardizes procedures...
TRANSCRIPT

GGUUIIDDAANNCCEE FFOORR NNAATTIIOONNAALL PPOOLLLLUUTTAANNTT DDIISSCCHHAARRGGEE EELLIIMMIINNAATTIIOONN SSYYSSTTEEMM
SSTTOORRMMWWAATTEERR PPEERRMMIITTSS
JJUUNNEE ((DDRRAAFFTT)) 22001111
AAACCCCCCOOOUUUNNNTTTIIINNNGGG FFFOOORRR SSSTTTOOORRRMMMWWWAAATTTEEERRR
WWWAAASSSTTTEEELLLOOOAAADDD AAALLLLLLOOOCCCAAATTTIIIOOONNNSSS AAANNNDDD
IIIMMMPPPEEERRRVVVIIIOOOUUUSSS AAACCCRRREEESSS TTTRRREEEAAATTTEEEDDD

Table of Contents
I. Introduction ................................................................................................................................ 1
II. Modeling Methods .................................................................................................................... 2
1. Model Selection ..................................................................................................................... 2
2. CBP Loading Rates................................................................................................................ 2
3. BMP Efficiency Matrices ...................................................................................................... 2
III. Establishing Baselines ............................................................................................................. 3
1. Municipal Separate Storm Sewer System.............................................................................. 3
2. Land Use Data........................................................................................................................ 3
3. Stormwater WLA................................................................................................................... 3
4. Impervious Cover................................................................................................................... 4
5. Water Quality Facilities ......................................................................................................... 4
6. Stormwater Management by Era ........................................................................................... 4 a. Local Data Gaps................................................................................................................. 5 b. Reconciling Local and CBP Scale Data............................................................................. 5
7. New Development ................................................................................................................. 7
IV. Structural Restoration Credits.................................................................................................. 8
1. ESD and BMP Retrofits......................................................................................................... 8 a. Individual Project Credit .................................................................................................... 8 b. Watershed Implementation Credit ..................................................................................... 8
2. Redevelopment ...................................................................................................................... 8
3. Existing Roads and Subdivisions........................................................................................... 9
4. Step Pool Storm Conveyance................................................................................................. 9
5. Recording Structural BMP Retrofits...................................................................................... 9
V. Alternative Restoration Credits............................................................................................... 11
1. Street Sweeping ................................................................................................................... 11 a. Mass Loading Approach .................................................................................................. 11 b. Street Lane Approach ...................................................................................................... 11
2. Catch Basin Cleaning and Storm Drain Vacuuming ........................................................... 12
3. Impervious Surface Elimination .......................................................................................... 12
4. Tree Planting and Reforestation........................................................................................... 12
5. Stream Restoration............................................................................................................... 13 a. Local Monitoring Studies................................................................................................. 13
i

ii
b. Literature Review............................................................................................................. 14 c. Stream Restoration Design Criteria ................................................................................. 14 d. Accounting Recommendation.......................................................................................... 14
6. Shoreline Stabilization ......................................................................................................... 16
7. Nutrient Management .......................................................................................................... 17
8. Septic Systems ..................................................................................................................... 17
9. Alternative BMPs for Consideration ................................................................................... 17
10. New Technology/Innovative Practices .............................................................................. 17
VI. An Equivalent Impervious Acre ............................................................................................ 19
VII. Alternative Urban BMP Matrix............................................................................................ 21
Appendix A -- Stormwater Model Weblinks................................................................................ 26
Appendix B -- Maryland's Urban BMP Database ........................................................................ 27
Appendix C -- Maryland's NPDES Stormwater Restoration Database ........................................ 28
Appendix D -- Maryland's NPDES Urban BMP Index of Practices ............................................ 29
Appendix E -- CBP Stream Restoration Guidance ....................................................................... 31

Index of Tables Table 1. CBP Annual Urban Runoff Loads Per Acre.................................................................... 2 Table 2. Stormwater Management by Era Accounting Approach................................................. 5 Table 3. Retrofit of a Dry Pond Constructed Circa 1985 .............................................................. 8 Table 4. Structural BMP Retrofit Matrix..................................................................................... 10 Table 5. Street Sweeping Pollutant Removal Efficiencies .......................................................... 12 Table 6. Pollutant Reduction Efficiencies Associated with Impervious Surface Elimination .... 12 Table 7. Tree Planting and Reforestation Pollutant Load Reduction Efficiencies ...................... 13 Table 8. Stream Restoration Credits ............................................................................................ 15 Table 9. Annual Shoreline Stabilization Credit ........................................................................... 16 Table 10. Pollutant Loads for Impervious and Forest Cover....................................................... 19 Table 11. Estimated Pollutant Load Reductions from Mechanical Street Sweeping .................. 19 Table 12. Equivalent Impervious Acre Analyses for Street Sweeping........................................ 20 Table 13. An Equivalent Impervious Acre .................................................................................. 20 Table 14. Matrix of Alternative Urban BMPs ............................................................................. 22
iii

1
I. Introduction National Pollutant Discharge Elimination System (NPDES) municipal separate storm sewer system permits in Maryland require the restoration of a certain percent of a jurisdiction's impervious surface area, e.g., 20%, that has little or no stormwater management. How to calculate impervious surface requirements and treatment credits has generated numerous questions. This document standardizes procedures for the reporting of traditional, new, and alternative best management practices (BMPs) and the impervious area they control. With the inclusion of total maximum daily loads (TMDLs) and specifically the Chesapeake Bay TMDL in municipal stormwater permits, the answer to "what constitutes restoration?" becomes fairly easy to answer. This means meeting TMDL requirements and water quality criteria. This document provides information on how to calculate stormwater baseline loads and BMP pollutant removal efficiencies for showing progress toward meeting stormwater waste load allocations (WLA) for NPDES accounting purposes. Implementing water quality improvement projects on a certain percent of a locality's impervious surface area each permit term sets the schedule for meeting the Chesapeake Bay TMDL.
A primary goal of this guidance is to expand the list of traditional urban BMPs with a suite of alternative water quality practices. By developing a comprehensive matrix of practices and consistent accounting measures, the Maryland Department of the Environment (MDE) brings greater certainty to the local planning and budgeting processes. Local governments can weigh the cost associated with implementing different practices and choose the most efficient option for meeting pollutant load reductions. Also included in this document is a method for translating the pollutant load reductions associated with alternative stormwater practices into equivalent impervious acres treated. This will tie the implementation of these BMPs and meeting stormwater WLAs and impervious area restoration requirements together under one permit. This guidance will continue to evolve as stormwater science, program implementation, and Chesapeake Bay modeling improve. Maryland counties, municipalities, and agencies are encouraged to participate fully in this endeavor by exploring and monitoring alternative approaches to stormwater management. The data gathered may be used to update and improve Maryland's stormwater management matrix of options for achieving water quality. Finally, while the principles and methods presented here are primarily geared toward meeting NPDES permit impervious surface requirements and Chesapeake Bay stormwater WLAs, they are relevant and applicable for use for any EPA approved TMDL.

2
II. Modeling Methods 1. Model Selection: Computer models can aid local jurisdictions in establishing stormwater baseline pollutant loads, planning restoration work, and showing progress toward meeting WLAs. Maryland's Assessment and Scenario Tool (MAST) developed for the Chesapeake Bay Program (CBP) and the Hydrological Simulation Program -- Fortran (HSPF), the Stormwater Management Model (SWMM), and spreadsheet versions like the Watershed Treatment Model (WTM) are acceptable for use by Maryland's NPDES localities. MAST is the only model that relates directly to the CBP model and where pollutant removal credits may be assured under the Bay's TMDL. Other models and results can be compared to the Bay model on a proportional basis for NPDES accounting purposes. For example, while different models will likely generate different baseline pollutant loads in pounds, the reductions from implementing water quality improvement projects will be comparable on a percent reduction basis. In order to develop greater consistency among the models, local governments will need to use the same pollutant loading rates that were used to develop the Bay TMDL. Also, consistent BMP pollutant removal efficiencies need to be used to ensure equitable accounting among jurisdictions. Websites with documentation on the use of various models may be found in Appendix A. 2. CBP Loading Rates: Jurisdictions shall use the pollutant loading rates derived from the CBP Model, Version 5.3.0, for total nitrogen (TN), total phosphorus (TP), and total suspended sediment (TSS) along with land use data to calculate the stormwater loads discharged from municipal storm drain systems. These rates, found in Table 1, were used for developing stormwater WLAs in the Chesapeake Bay TMDL, and local use of these data will ensure consistency. For ease in modeling, Maryland used a weighted pollutant load average for all CBP urban land covers (impervious high density, impervious low density, pervious high density, and pervious low density) in its Watershed Implementation Plan (WIP). Table 1. CBP Annual Urban Runoff Loads Per Acre
Urban Impervious Urban Pervious All Urban Parameter high
density low
density average high density
low density average weighted
average TN (lbs) 10.48 11.22 10.85 9.10 9.76 9.43 9.96 TP (lbs) 2.01 2.06 2.04 0.55 0.58 0.57 0.97 TSS (tons) 0.44 0.47 0.46 0.07 0.07 0.07 0.18
(Adapted from CBP Model, Version 5.3.0, 2011) These pollutant loads are specific to the Chesapeake Bay TMDL. Other water bodies are likely to have different pollutant loads than those used for Chesapeake Bay. A jurisdiction's analysis needs to be consistent with the loads found in each particular TMDL. 3. BMP Efficiency Matrices: This guidance provides two BMP efficiency matrices for computer model input values. One contains traditional stormwater retrofits, i.e., wet ponds, bioretention, and filtering practices, and efficiencies provided in the CBP Model. A second matrix contains alternate urban practices, i.e., stream restoration, street sweeping, and septic
3
system upgrades, that can be used to meet stormwater WLAs. Together these matrices provide local governments with numerous options for meeting NPDES stormwater WLAs and impervious cover restoration requirements.
III. Establishing Baselines 1. Municipal Separate Storm Sewer System: Local jurisdictions need to account for and map the storm drain system that they own or operate. Title 40 of the Code of Federal Regulations (CFR), 122.26 (b) (8) defines a municipal separate storm sewer system as "a conveyance or system of conveyances (including roads with drainage systems, municipal streets, catch basins, curbs, gutters, ditches, man-made channels, or storm drains) owned or operated by a State, city, town, borough, county, parish, district, association, or other public body." Emphasis added.
The storm drain system within a jurisdiction's boundary is typically a mix of ownership, which includes parts of local, State, and federal systems. How a locality accounts for these various entities when defining what it "owns or operates" is important. Because stormwater management for private property in Maryland is locally administered for plan approval, inspection, and enforcement, these facilities are inherently a part of a locality's storm drain system. Some State and federal property, certain small municipalities, and industrial facilities are regulated under other NPDES stormwater permits and the storm drain systems in these entities may be excluded from a locality's responsibility. Any stormwater discharge, however, that passes through a county or municipal storm drain system or appurtenance becomes, at the very least, the shared responsibility of that locality.
2. Land Use Data are integral for estimating stormwater WLAs and assessing impervious surfaces for restoration. Local governments should use the best land use data that are available to them and can be generated from the same source from year to year. This will ensure consistent annual analysis regarding imperviousness, acres treated, retrofit goals, and permit compliance. An exception to this may be when technology allows for the current land use data to be further refined or improved. For example, some jurisdictions use local land use maps along with impervious surface coefficients to estimate impervious cover. If in the future, more accurate data can be derived from aerial views and geographic information system (GIS) application, then the more accurate data should be used. Because this may cause slight increases or decreases in reported impervious acres, local governments will need to document any changes to baseline data. When it comes to the Chesapeake Bay TMDL, there will be scale issues that may cause urban land cover to be over or under-estimated. These differences can be reconciled through the use of the stormwater management by era approach described later in this document. 3. Stormwater WLA: Urban land use data shall be used in conjunction with the approved TMDL pollutant loading rates to calculate local baseline stormwater pollutant loads. Typically, the year in which the monitoring data were gathered to support the TMDL should be used as the baseline year. Local stormwater program and restoration efforts implemented after the baseline year, and the associated pollutant load reductions, can then be measured against the stormwater WLAs to determine if benchmarks and water quality criteria are being met. EPA approved TMDLs may be found at http://www.mde. State.md.us/programs/Water/TMDL/Pages/Programs/ WaterPrograms/tmdl/index.aspx.

4
4. Impervious Cover: Jurisdictions will need to determine the total impervious surface area that they are legally responsible for and delineate the portions that are either treated to the maximum extent practicable (MEP), partially treated, or untreated and available for retrofit. This assessment will provide the baseline from which the 20% restoration requirement may be calculated. A good place to start is 2002 because this is when Maryland regulations and local ordinances began requiring BMPs to address a specific suite of volumes [recharge (Rev), water quality (WQv), and channel protection (Cpv)] and it can therefore be justified that water quality treatment has been provided to the MEP. Development after 2002 should not be counted toward impervious surfaces that need to be restored. BMPs from this stormwater program era are deemed state-of-the-art and need to be maintained, but will provide limited opportunity for water quality improvement. Hence, the regular implementation of stormwater management since 2002 may not be used for fulfilling restoration requirements. When local data for 2002 do not exist, jurisdictions should use the most appropriate land use year and document how it reflects the implementation of state-of-the-art BMPs according to the 2000 Maryland Stormwater Design Manual (the Manual). 5. Water Quality Facilities: Stormwater BMPs implemented before 2002 that provide water quality treatment will need to be considered. For example, commonly used BMPs during this time included infiltration trenches and basins, wetlands facilities, and extended-detention structures, which all provide some water quality benefits. On the other hand, detentions facilities (dry ponds) that were designed primarily for flood control provide very little water quality. Structural BMPs implemented prior to 2002 can be credited for treatment of impervious area based on the volume treated in relation to the Manual's WQv, or one inch of rainfall. If BMPs were designed to a criterion less than the WQv, impervious area credits should be pro-rated based on the proportion of the volume treated. These areas may provide significant retrofit opportunities, where meeting the full WQv will increase the jurisdiction's impervious area treatment credit. In order to claim credit, local jurisdictions will need to document how BMPs implemented before 2002 provide water quality. Documentation may include State or local policies and ordinances established to implement water quality BMPs in conjunction with Maryland's Urban BMP database (Appendix B), which may be used to verify BMP type and maintenance status. An example of how a locality may use State policy in this regard would be to reference, Design Procedures for Stormwater Management Extended Detention Structures (MDE, 1987). By delaying one inch of rainfall over 24 hours, extended detention facilities improve the settling of pollutants and provide channel protection. If a local jurisdiction can document the use of this approach before 2002 for individual BMPs and each has been properly maintained, then the full WQv may be claimed for these facilities. Each jurisdiction should provide MDE with specific information on the policies or local ordinances used to account for water quality BMPs implemented before 2002 and the impervious acres treated. 6. Stormwater Management by Era: Maryland's Urban BMP Database has records for over 33,000 facilities statewide, yet only 22,000 have complete information on drainage area and year built. The under-counting of BMPs has contributed to a flawed analysis regarding Maryland's

5
stormwater management programs that have been implemented since the early 1980's. To better reflect actual program implementation, BMPs may be recorded in four stormwater management eras when facility data are incomplete. Based on distinct regulatory eras in Maryland with known BMP performance criteria, pollutant removal efficiencies have been developed that directly correlate to these eras (MDE, 2009). By combining these era efficiencies with the CBP's annual estimate for urban land cover, a better representation of program implementation can be achieved. The stormwater management by era approach was used in the development of Maryland's WIP for meeting Chesapeake Bay TMDLs and will be valuable for local planning and analysis as well. The major stormwater management eras and associated pollutant load reduction efficiencies are depicted in Figure 1. a. Local Data Gaps: Local governments should use the information reported on Maryland's Urban BMP Database (Appendix B) for TMDL assessments. This database has been in use since the inception of stormwater management in Maryland and contains valuable empirical data on BMPs implemented across the State. Jurisdictions should further concentrate efforts to gather specific drainage area and other pertinent data during routine program updates and BMP maintenance inspections. Because individual BMP efficiencies tend to be greater than the conservatively estimated efficiencies for Maryland's early regulatory eras, there is a strong incentive for local governments to compile more accurate BMP data. Where these data are lacking however, counties and municipalities may use the CBP's annual estimate for urban land cover along with the stormwater management by era efficiencies to reflect the local implementation of BMPs. b. Reconciling Local and CBP Scale Data: CBP methods for estimating urban land cover are based on a larger scale analysis than local data. While the CBP data are continually being improved to better reflect local land cover data, they tend to over or under-estimate actual urban land and impervious cover. When an over-estimation occurs, local jurisdictions can use the CBP annual data for land developed and the stormwater management by era efficiencies to reconcile these differences. Table 2 shows hypothetical CBP data for 1995 and 1996. In each year, urban land cover grew by 1,000 acres. The local urban BMP database for those same years however, shows 900 and 950 acres of BMP implementation, respectively. In this case, the stormwater management by era BMP category may be used to reconcile the difference between the CBP urban land cover and local land use. For 1995, 100 acres were added to this category and for 1996, 50 acres were added. Table 2. Stormwater Management by Era Accounting Approach
Local Urban BMP Database Acres Year
CBP Urban Acres
Extended Detention
Wet Ponds Filtering Infiltration Local
Total
SWM by Era Acres
Total Local Acres
1995 1,000 300 400 100 100 900 100 1,000 1996 1,000 300 400 100 150 950 50 1,000
(Adapted from MDE Stormwater Management by Era, 2009) To obtain the latest available CBP Model land cover data for each jurisdiction by year, local governments may contact MDE or the Bay Program.

Figure 1. Stormwater Management by Era
Urban Land Use Developed Prior to 1985 Developed Between 1985-2002 Developed Between 2002-2010 Developed Post 2010
SW Regs: Required Reduction Efficiencies: TSS – 80% TP – 40% TN – 30%
SW Regs: No Required Reduction Efficiencies; Estimated: TSS – 40% TP – 30% TN – 17%
Retrofits: TSS – 65% TP – 35% TN – 25%
SW Regs: No BMPs Required; No Reductions.
Retrofits: TSS – 65% TP – 35% TN – 25%
SW Regs: ESD to the MEP Required Reduction Efficiencies: TSS – 90% TP – 60% TN – 50%
BMP 2: Acreage: X Reductions: TSS – 40% TP – 30% TN – 17%
BMP 4: Acreage: X Reductions: TSS – 90% TP – 60% TN – 50%
BMP 3: Acreage: X Reductions: TSS – 80% TP – 40% TN – 30%
BMP 1: Acreage: X Reductions: TSS – 65% TP – 35% TN – 25%
6

7. New Development: As stated above, impervious area caused by development after 2002 will not be required to be restored provided that current State regulations are met. This is because the design criteria in the Manual results in more than sufficient stormwater management and there will be limited opportunity for improving water quality through retrofitting. Moreover, Maryland’s Stormwater Management Act of 2007 requires implementation of environmental site design (ESD) to the MEP. ESD is a performance-based approach mandating the control of the one-year frequency storm event, about 2.6” per 24 hours. The goal of the MEP standard is to replicate the runoff characteristics of “woods in good conditions” and stormwater systems meeting current requirements are considered sufficient to off-set pollutant load increases caused by land use changes. From a data management perspective, ESD to the MEP should be viewed as a systems-approach for meeting volume requirements. Where the MEP standard is met using ESD, each development site should be recorded as a single entry in MDE’s Urban BMP database. There will however, be some instances where a combination of ESD techniques and conventional stormwater management practices are used to control new development runoff. In those cases, localities should take care to avoid double accounting for each new development by keeping track of the drainage area and impervious acreage unique to ESD and structural BMPs.
7

IV. Structural Restoration Credits
1. ESD and BMP Retrofits The water quality objective for stormwater retrofit design is to manage the largest volume of runoff possible. Numerous constraints inherent to the urban environment, though, make full ESD implementation impractical. Meeting the design standards for structural BMPs specified in the Manual can be difficult as well. Subsequent to discussion within the State's NPDES stormwater community, structural BMP retrofits shall be designed to meet the Manual's WQv criteria. The WQv criteria has been a fundamental regulatory requirement for stormwater management in Maryland since 2000. Additionally, many of the CBP approved BMP efficiencies are based upon designs that treat the volume from one inch of rainfall. Retrofit opportunities that achieve less than the WQv should be pursued where they make sense. These retrofits, however, will need to be pro-rated based on the WQv treated. Structural stormwater retrofit credits can be applied individually or across an entire watershed. a. Individual Project Credit: Retrofits shall be credited according to the following criteria: • An acre for acre impervious credit will be given when a structural BMP is specifically
designed to provide treatment for the full WQv (one inch), or • A proportional acreage of credit will be given when less than the WQv is provided:
(percent of the WQv achieved) x (drainage area impervious acres) Table 3. Retrofit of a Dry Pond Constructed Circa 1985
original design = 2 and 10 year peak management impervious acre drainage area = 15 acres retrofit design = 1 inch, or WQv impervious acre credit = 15 acres retrofit design = 0.5 inch impervious acre credit = 7.5 acres, (50% of WQv * 15 acres)
(Adapted from the 2000 Maryland Stormwater Design Manual) b. Watershed Implementation Credit: There will be instances where BMP retrofits provide greater than one inch of volume control. These BMPs should receive additional credit. One way to do this is to calculate the one inch rainfall volume over an entire watershed. Using a larger watershed perspective, structural BMPs above and below one inch of rainfall management can be equitably credited toward the overall goal of treating the watershed to the MEP. 2. Redevelopment can play a significant role in reducing stormwater pollutants. First, redevelopment limits the expansion of Maryland's urban footprint, preserving undeveloped resource lands. Second, redevelopment usually occurs in older urban environments, replacing unmanaged impervious surfaces with the controls mandated in the Manual. Stormwater 8

9
management requirements for redevelopment are outlined in the Code of Maryland Regulations (COMAR 26.17.02.05D), and discussed in the Manual (Supplement 1, pages 5.117 – 5.120). These specify that some combination of impervious area reduction and water quality treatment needs to be provided. When water quality treatment practices are provided for redevelopment, the existing impervious area treated may be credited toward restoration requirements. In most cases the credit will be equivalent to 50% of the existing impervious area for the project (per COMAR). However, when additional volume above the regulatory requirements is provided, additional credit will be accepted on a proportional basis as described in Section IV.1. above. Also, if new development results in the management of existing impervious area, i.e. < 40% according to the Manual, then these formerly unmanaged areas may be credited toward the impervious acre restoration requirement. 3. Existing Roads and Subdivisions: Many roads and subdivisions, including those built before 1985, have vegetated swale systems or sheetflow conditions that filter and treat stormwater runoff. Many of these existing features approximate the ESD designs found in Maryland's Manual. Each jurisdiction should conduct a systematic review of existing roads and subdivisions to determine the extent of water quality treatment already provided and to identify opportunities for retrofitting. Land use designation may play a significant role in selecting areas that may already be adequately managed. For example, public roads and subdivisions in predominantly rural areas with low population densities, e.g., 1 dwelling unit per 5 acres or greater, will be more likely to have water quality design features equivalent to those defined in the Manual. If these areas can be shown to provide adequate water quality and sufficient documentation is provided to MDE, then the impervious acres can be excluded from the jurisdiction's total impervious area requiring management. 4. Step Pool Storm Conveyance: There are several stormwater management practices, such as the Step Pool Storm Conveyance system (SPSC), used for retrofitting that are not listed in the Manual. According to Anne Arundel County’s Design Guidelines for SPSC (2010), these are “open-channel conveyance structures that convert, through attenuation ponds and a sand seepage filter, surface storm flow to shallow groundwater flow.” When these practices are used as retrofits to capture the runoff from one inch of rainfall, the pollutant removal efficiencies from the most similar BMP type may be used. In this case, the SPSC performs very similar to a filtration practice, and therefore, the pollutant removal efficiencies for micro-bioretention can be applied to the drainage area treated. Other innovative practices that capture one inch of rainfall may also be considered for MDE approval pending further study and results of field implementation. 5. Recording Structural BMP Retrofits: NPDES stormwater permits require that all stormwater retrofit data be recorded on a stormwater restoration database (Appendix C). A comprehensive list of structural BMPs can be found in Table 4. All BMP efficiencies are derived from the CBP unless otherwise noted. BMP definitions and design criteria can be found in Maryland's Manual, materials that support the CBP's approved BMP efficiencies, and within the body of this guidance document. Impervious acres treated shall be calculated from the approved plans for each retrofit. BMP drainage areas need to be GIS-mapped as polygon shape files and linked to the restoration database. The GIS mapping of these retrofits shall be used by
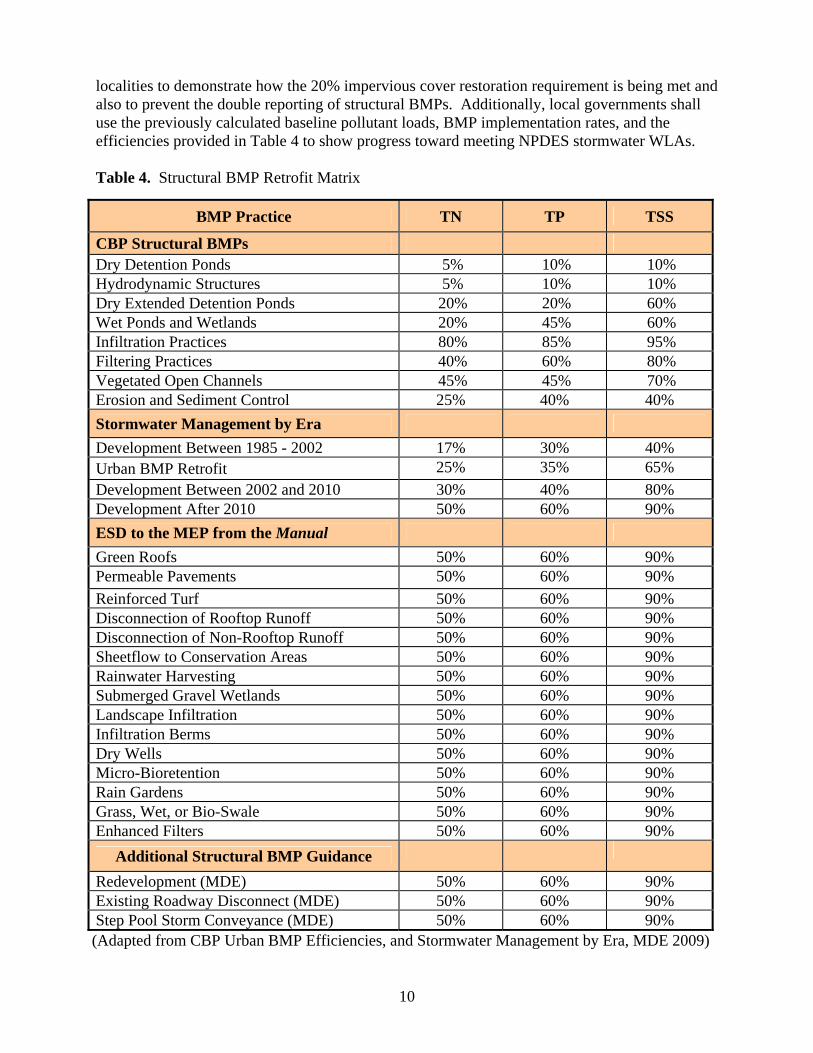
localities to demonstrate how the 20% impervious cover restoration requirement is being met and also to prevent the double reporting of structural BMPs. Additionally, local governments shall use the previously calculated baseline pollutant loads, BMP implementation rates, and the efficiencies provided in Table 4 to show progress toward meeting NPDES stormwater WLAs. Table 4. Structural BMP Retrofit Matrix
(Adapted from CBP Urban BMP Efficiencies, and Stormwater Management by Era, MDE 2009)
BMP Practice TN TP TSS
CBP Structural BMPs Dry Detention Ponds 5% 10% 10% Hydrodynamic Structures 5% 10% 10% Dry Extended Detention Ponds 20% 20% 60% Wet Ponds and Wetlands 20% 45% 60% Infiltration Practices 80% 85% 95% Filtering Practices 40% 60% 80% Vegetated Open Channels 45% 45% 70% Erosion and Sediment Control 25% 40% 40% Stormwater Management by Era Development Between 1985 - 2002 17% 30% 40% Urban BMP Retrofit 25% 35% 65% Development Between 2002 and 2010 30% 40% 80% Development After 2010 50% 60% 90% ESD to the MEP from the Manual Green Roofs 50% 60% 90% Permeable Pavements 50% 60% 90% Reinforced Turf 50% 60% 90% Disconnection of Rooftop Runoff 50% 60% 90% Disconnection of Non-Rooftop Runoff 50% 60% 90% Sheetflow to Conservation Areas 50% 60% 90% Rainwater Harvesting 50% 60% 90% Submerged Gravel Wetlands 50% 60% 90% Landscape Infiltration 50% 60% 90% Infiltration Berms 50% 60% 90% Dry Wells 50% 60% 90% Micro-Bioretention 50% 60% 90% Rain Gardens 50% 60% 90% Grass, Wet, or Bio-Swale 50% 60% 90% Enhanced Filters 50% 60% 90%
Additional Structural BMP Guidance
Redevelopment (MDE) 50% 60% 90% Existing Roadway Disconnect (MDE) 50% 60% 90% Step Pool Storm Conveyance (MDE) 50% 60% 90%
10

V. Alternative Restoration Credits This section presents alternative BMPs that will give jurisdictions greater flexibility toward meeting stormwater permit requirements. These BMPs can be grouped into four main categories. First are stormwater practices that have been recently approved by the CBP, e.g., street sweeping, stream restoration, and nutrient management. Second are practices that can be derived easily from documenting changes in land use and CBP loading rates, e.g., impervious surface reduction, tree planting, and reforestation. Third are practices not traditionally used for stormwater management, but will be allowed as an option for mitigating the effects from uncontrolled development, e.g., septic system upgrades and shoreline erosion control. The fourth category includes alternative BMPs that have been proposed by Maryland's NPDES municipalities for further examination like education, sub-soiling, trash removal, pet waste management, outfall stabilization, floodplain restoration, river bank stabilization, disconnection of illicit discharges, and bio-reactor carbon filter. These options may be used for fulfilling NPDES stormwater restoration requirements when clear performance criteria are set and monitoring data documenting pollutant removal capability are submitted to MDE for approval. 1. Street Sweeping removes the buildup of pollutants that have been deposited along the street or curb, using mechanical or vacuum-assisted sweeper trucks. Localities can use one of two methods to compute the projected nutrient and sediment reductions associated with street sweeping. a. Mass Loading Approach: For the mass loading approach, the street dirt collected is measured in tons at the landfill or ultimate point of disposal and converted to pounds. The TSS load is then estimated by multiplying the total particulate dry mass collected by 30%, or the fraction of material reflecting the particle size that dominates TSS (Law et al., 2008). The pounds of TN and TP can be calculated by multiplying the TSS load by 0.0025 and 0.001, respectively. b. Street Lane Approach: For the street lane approach, a jurisdiction reports the number of lane miles they have swept during the course of the year. The following formula is used to convert lane miles swept into acres:
(miles swept) x (5,280 ft/mile) x (lane width ft) 43,560 ft/acre.
The total acres swept is multiplied by the annual nutrient and sediment load for impervious surfaces, or 10.85 lbs/acre for TN, 2.04 lbs/acre for TP, and 0.46 tons/acre for TSS to arrive at a baseline load. The baseline load can be multiplied by the pollutant removal efficiencies shown in Table 5 to determine the load reduction associated with street sweeping. The sediment and nutrient reductions are based on the sweeping technology in use, with lower reductions for mechanical sweeping and higher reductions for vacuum-assisted or regenerative air sweeping technologies. The reductions only apply to an enhanced street sweeping program
11

Table 5. Street Sweeping Pollutant Removal Efficiencies
Technology TN TP TSS
Mechanical 4% 4% 10% Regenerative/Vacuum 5% 6% 25%
(CBP Street Sweeping Efficiencies, 2011) where the streets are located in commercial, industrial, central business district, or high density residential neighborhoods and they are swept on a regular basis, e.g., twice per month.
2. Catch Basin Cleaning and Storm Drain Vacuuming are systematic water quality based storm drain programs where routine cleanouts are performed on targeted infrastructure that have high accumulation rates. Municipal inspections of the storm drain system can be used to identify priority areas. The projected nutrient reduction associated with enhanced storm drain cleanout programs are calculated using the mass loading approach described above for street sweeping. 3. Impervious Surface Elimination: Eliminating impervious surfaces and replacing them with vegetation will greatly improve urban hydrology and water quality. A credit for this practice is based on the pollutant load reduction expected when land cover is converted from impervious to pervious or forest. Two scenarios are shown in Table 6. One is the conversion of urban impervious to pervious, and the other is the conversion of urban impervious to forest. The difference in pollutant loads between land covers can be used to calculate pollutant load reduction efficiencies that may be used for NPDES stormwater permit accounting. Table 6. Pollutant Reduction Efficiencies Associated with Impervious Surface Elimination
(Adapted from CBP Model, Version 5.3.0, 2011)
Conversion from TN (lbs/acre/yr) TP (lbs/acre/yr) TSS (tons/acre/yr) Urban Impervious 10.85 2.04 0.44 Pervious 9.43 0.57 0.07 Efficiency 13% 72% 84% Conversion from TN (lbs/acre/yr) TP (lbs/acre/yr) TSS (tons/acre/yr) Urban Impervious 10.85 2.04 0.44 Forest 3.16 0.13 0.03 Efficiency 71% 94% 93%
4. Tree Planting and Reforestation: When localities convert urban land to forest, significant hydrologic and water quality benefits accrue. Tree planting typically occurs piecemeal across the urban landscape whereas reforestation usually occurs on a much larger scale. In either case, to claim these credits a survival rate of 100 trees per acre or greater is necessary with at least 50% of the trees being 2 inches or greater in diameter at 4 ½ feet above ground level. (Maryland Department of Natural Resources, 2009). Because contiguous parcels of one acre or greater may be difficult to locate for an urban tree planting program, an aggregate of smaller sites may be used.
12

The same method described above for impervious surface elimination can be used for tree planting and reforestation. For example, a credit is based on the pollutant load reduction expected when land cover is converted from urban to forest. Examples of converting urban pervious and impervious land cover to forest are shown in Table 7 along with the expected pollutant reduction efficiencies. These efficiencies will be accepted for NPDES stormwater permit accounting. Table 7. Tree Planting and Reforestation Pollutant Load Reduction Efficiencies Conversion from TN (lbs/acre/yr) TP (lbs/acre/yr) TSS (tons/acre/yr) Urban Pervious 9.43 0.57 0.07 Forest 3.16 0.13 0.03 Efficiency 66% 77% 57% Conversion from TN (lbs/acre/yr) TP (lbs/acre/yr) TSS (tons/acre/yr) Urban Impervious 10.85 2.04 0.44 Forest 3.16 0.13 0.03 Efficiency 71% 94% 93%
(Adapted from CBP Model, Version 5.3.0, 2011) 5. Stream Restoration has been used throughout Maryland to address a wide range of problems observed in urban streams. As a watershed is developed, changes in the natural flow regime contribute to stream instability, erosion and sediment pollution, and degraded water quality. Stream restoration techniques are used to address these impacts and re-establish a healthy aquatic ecosystem. Stream restoration includes a number of different approaches that recognize complex interactions within the stream ecosystem in order to contribute to a wide array of watershed benefits. An individual project will utilize the most appropriate practices to address site conditions and local constraints. These practices may include: physical grading to re-establish a stable channel pattern and reconnect the stream with the floodplain; introducing habitat features such as step-pools, woody debris, or riparian vegetation; and integrating structural approaches such as rock walls or riprap. Stream restoration projects that enhance ecosystem functions and environmental benefits will qualify for pollutant removal and impervious area treatment credit. a. Local Monitoring Studies: Some of Maryland’s local jurisdictions have monitored to quantify pollutant removal benefits from stream restoration projects. The most notable of these is the Spring Branch Stream Study by Baltimore County. In addition, Baltimore City and Maryland State Highway Administration (SHA) have used empirical methods for estimating pollutant load reductions for site specific situations. The method used for the Baltimore City and SHA monitoring included bank pin data and sediment samples for pre-restoration conditions to predict bank erosion and nutrient loading rates. The Spring Branch Study however, is the only project known to quantify both sediment and nutrient reductions based on pre and post-restoration monitoring. These efficiencies were used as the basis for the CBP approved stream restoration credits. The erosion problems observed in the Spring Branch were significant and are typical of many of Maryland’s urban streams.
13

Therefore, MDE will allow the efficiencies approved by the CBP to be used for other stream restoration projects in Maryland. b. Literature Review: The literature review and the CBP guidance on stream restoration (Appendix E) emphasize that restoration projects should be planned within broader watershed goals. Walsh and Kunapo, 2009, and Booth, 2005 describe the importance of dispersing stormwater controls within a watershed to mimic natural flow attenuation to improve the success of stream restoration. Further, Palmer, 2008, emphasized the importance of focusing on replacing hydrology and other watershed processes when planning restoration projects. The credit system established by MDE includes the consideration of the research on this topic and recognizes the importance of planning stream restoration with other activities to replace natural hydrology. The information provided in the stream restoration design criteria will support these goals and provide the basis for any credit given. c. Stream Restoration Design Criteria: CBP accounting principles from Appendix E have been incorporated in the criteria below. It is recognized that there are numerous methods and design strategies that may be utilized for a given stream restoration project. In addition, each project is subject to a regulatory process that requires detailed evaluation and reporting. Therefore, it will be important to consider the level of analysis and the basis for the proposed management strategy when jurisdictions use stream restoration for credit. At a minimum, each jurisdiction should report a summary of the following information as part of NPDES required watershed assessments: • A stream stability evaluation for restoration projects • An evaluation of upstream impacts and a description of how these may be addressed • A description of the watershed and stream restoration strategy • A description of maintenance and inspection activities or planned monitoring to
determine the effectiveness of the project d. Accounting Recommendation: The three methods described below provide options for applying credit to stream restoration projects. These methods are based on approved CBP efficiencies. As further research is developed, these numbers may be modified. Method I: Baseline Stream Restoration Credit TN = 0.02 lb/linear foot/year TP = 0.0035 lb/linear foot/year TSS = 2.55 lb/linear foot/year In recognizing that stream restoration projects provide some benefit, a baseline credit may be applied toward pollutant removal rates and impervious area restored. MDE will not require intensive physical, chemical, and biological monitoring for these projects. However, inspection and maintenance is recommended to ensure that the goals of the project are met.
Impervious acreage treated = 1 acre / 100 linear feet stream restored
14

The impervious area credit of 1 acre restored for every 100 linear feet of stream restoration is based on the pollutant removal efficiencies for TN, TP, and TSS. MDE has developed a method for determining an equivalent impervious area credit based on the approved CBP numbers. Section VI. of this document will describe how this credit is derived for all practices. Method II: Stream Restoration using ESD and Structural BMPs The credit granted in Method I above assumes that BMPs or ESD practices have not been implemented in the uplands. Additional credit will be available when structural BMPs and ESD practices are provided in combination with a stream restoration project. Each BMP will receive credit for pollutant removal (according to that BMP type) and impervious acreage treated for its corresponding drainage area. All BMPs must meet the criteria outlined under Section IV.1. of this document. ESD disconnection practices provide additional opportunity to receive credit on untreated impervious areas. In order to maximize the area that may be used for disconnections, field surveys may be necessary to confirm runoff drainage patterns. Local jurisdictions should use outreach efforts with private property owners to explore opportunities for using landscaped areas to establish disconnections and small scale ESD practices. The example below illustrates how these credits are applied in conjunction with stream restoration. The data are based on a stream restoration project on 1,000 linear feet of channel. The total drainage area to the downstream point of the restored stream is 90 acres and the total impervious area is 30 acres. Table 8. Stream Restoration Credits
BMP Credit Contributing Drainage Area (Acres)
Impervious Area to BMP (Acres)
Wet Pond 5.8 3.6 Infiltration 2.2 1.6 Wet Extended Detention 7.4 3.4 Filtration 2.4 1.0 Existing Impervious Surface Disconnections 2.0 2.0 Private Property Disconnects 2.0 2.0
Upland BMP Sub Total: 13.6 Stream Restoration Credit 1000 linear feet 90 10.0
Stream Restoration Sub Total: 10.0 Grand Total: 23.6
In this example, a certain level of management is provided using upland BMPs (13.6 acres of impervious area treatment). This includes 2 acres of disconnection credit where field observations confirm that runoff from impervious surfaces will sheetflow onto vegetated areas and provide water quality treatment. Another 2 acres of disconnection practices are implemented
15

by working with residential property owners. Because the baseline credit is available, the upland BMPs combined with stream restoration result in a credit for a significant portion of the watershed impervious area. Incorporating these strategies together in small watersheds provides an advantage toward achieving impervious area restoration credit. As a general rule, whether Methods I or II is used, the impervious area credit for stream restoration shall not be greater than the total impervious area within the drainage for that project. Method III: Local Monitoring for Stream Restoration Credits
A local jurisdiction may choose to provide more detailed monitoring for pre and post-restoration conditions in order to justify greater credit. In these situations, the jurisdiction should work closely with MDE to ensure that the monitoring program will be acceptable. Application of stream restoration credits will be based on individual review and approval and will be determined on a case by case basis. Further application to other projects within a jurisdiction may be considered. However, until more research is done toward stream restoration efficiencies and credits across Maryland, MDE does not recommend applying monitoring data across jurisdictions until the CBP accepts those data. 6. Shoreline Stabilization: These practices apply to the shoreline of the Chesapeake and Atlantic Coastal Bays and tidal rivers. Proper stabilization techniques can reduce shoreline erosion and improve water quality. MDE and Maryland’s Chesapeake and Coastal Bays Critical Area Protection Program encourage the use of nonstructural practices or living shorelines. These include tidal marsh creation and beach nourishment. Structural practices include stone revetments, breakwaters, or groins. Further information on the design and construction of these practices can be found in MDE’s Shoreline Erosion Control Guidelines for Waterfront Property Owners (MDE, 2008). The Maryland Department of Natural Resources (DNR) provides a website tool, Maryland Shorelines Online (MSO), to determine shoreline erosion rates. Using this computer-driven tool and some field measurements, the cubic feet of soil lost can be estimated for an unprotected shoreline. The nutrient composition of eroding banks along the Bay shoreline is documented in the study, Eroding Bank Nutrient Verification Study for the Lower Chesapeake Bay (Ibison et al, 1992). Table 9. Annual Shoreline Stabilization Credit
Practice Type TN (lbs/linear ft)
TP (lbs/linear ft)
TSS (lbs/linear ft)
Structural 0.16 0.11 451 Nonstructural 0.16 0.11 451
Baltimore County used the MSO tool and the results from Ibison to estimate the pounds retained for 23 shoreline restoration projects, structural and nonstructural. MDE analyzed these data to establish nutrient and sediment removal rates that would be applicable for use in other jurisdictions, see Table 9. Because there are many factors that effect shoreline erosion and pollutant reduction can vary, a median analysis was used to prevent the influence of data
16

extremes. The pollutant load reduction rates provided by MDE for shoreline stabilization may be used for NPDES stormwater permit accounting. 7. Nutrient Management plans specify the rate, timing, and application of fertilizers to urban turf grass. Soil disturbed during the development process is required to be stabilized with grass seed and mulch according to approved erosion and sediment control plans. Soil tests are required for determining the appropriate amount of fertilizer to be applied to ensure a healthy stand of grass that will prevent further soil erosion. Once a site is stabilized, i.e. > 95%, soil tests can be used as part of a comprehensive nutrient management plan for reducing and or eliminating fertilizer use. On government-owned land, localities may claim this credit when nutrient management policies have been recently established and receipts from the jurisdiction can be used to show a commensurate reduction in the pounds of fertilizer bought. 8. Septic Systems are accounted for in the CBP model as a nonpoint source load allocation (LA). When describing pollutant sectors the CBP often refers to an urban load, which is actually a combination of stormwater WLAs and septic system LAs. Because these two sources are often intertwined, localities can investigate opportunities to improve septic system discharges in urban areas, which may be used for achieving reductions under NPDES stormwater permits. The CBP estimates that septic systems, per unit, deliver 12 pounds of TN annually to the Bay. Also, the Bay Program estimates that the pollutant removal efficiency for septic system pumping is 5%, or 0.6 pounds of TN annually, and enhanced denitrification units reduce nitrogen by 50%, or 6 pounds annually. MDE estimates that when septic systems are connected to WWTP with enhanced nitrogen removal capability, then the net unit reduction is 9 pounds of TN annually. Load reductions associated with septic system maintenance, enhancements, and conversions can be used by local governments as alternative practices for meeting NPDES stormwater permit requirements. 9. Alternative BMPs for Consideration: The following alternative BMPs have been recommended by Maryland's NPDES municipalities for further examination: education, sub-soiling, trash removal, pet waste management, outfall stabilization, floodplain restoration, river bank stabilization, disconnection of illicit discharges, and bio-reactor carbon filter. These options may be used for fulfilling NPDES stormwater restoration requirements when clear performance criteria are set and monitoring data documenting pollutant removal capability are submitted to MDE for approval. Additionally, routine inspection and maintenance procedures for these practices shall be established to ensure longevity and performance. MDE will work collaboratively with Maryland's NPDES stormwater community and the CBP in order to determine the proper recording of any alternative BMP that appears to work well. 10. New Technology/Innovative Practices: MDE recognizes that new and innovative approaches to stormwater management are being developed on a continuous basis. These practices are currently allowed for redevelopment, infill development, pretreatment, and retrofit projects provided that they are accepted locally. In order to foster further innovative approaches for achieving watershed restoration goals and meeting stormwater requirements for new development projects, MDE offers the following guidelines:
17

18
• The use of any BMP must be documented in the jurisdiction's TMDL implementation plan. Documentation must include all relevant data related to the expected pollutant reduction efficiencies of the practice and describe life-cycle maintenance requirements and costs.
• Jurisdictions shall provide independently verified assessment data or propose a monitoring plan to evaluate the effectiveness of the practice.
• MDE will evaluate all monitoring data and approve any credit toward meeting pollutant reduction targets under established TMDL's.
• Jurisdictions shall submit the practice to the Bay Program's Urban Stormwater Workgroup for consideration as an EPA recognized stormwater BMP.

VI. An Equivalent Impervious Acre While structural BMPs have a clearly defined drainage area and imperviousness, the task of relating an impervious area controlled by alternative stormwater management practices such as street sweeping, reforestation, and stream restoration becomes more difficult. Alternative stormwater management practices however, do provide significant pollutant load reductions and should receive a credit toward NPDES restoration requirements. MDE has developed a method for relating the reduction in pollutant loads from alternative practices into an equivalent impervious acre. Table 10. Pollutant Loads for Impervious and Forest Cover
(MDE derived from CBP Model, Version 5.3.0, 2011)
Parameter Impervious (lbs/acre/yr)
Forest (lbs/acre/yr)
Delta (lbs/acre/yr)
TN 10.85 3.16 7.69 TP 2.04 0.13 1.91 TSS (tons) 0.46 0.03 0.43
Fundamental to this approach is knowing the pollutant loads associated with runoff from an acre of impervious land cover and an acre of forest. The CBP estimates that the TN load in runoff from an impervious acre is 10.85 lbs annually while the load from an acre of forest is 3.16 lbs annually. The difference between the two land covers is 7.69 lbs of TN per year. The Delta for TP and TSS loads are shown in Table 10. These differences can be used to set a level of implementation that alternative practices would need to meet to mimic forest conditions. Table 11. Estimated Pollutant Load Reductions from Mechanical Street Sweeping
Parameter Implementation Units
Urban Impervious (lbs/acre/yr)
Reduction Efficiency
Pollutant Load Reduction
(lbs/acre/yr) TN 1 acre 10.85 4% 0.43 TP 1 acre 2.04 4% 0.08 TSS (tons) 1 acre 0.46 10% 0.05
(MDE derived from CBP Model, Version 5.3.0, 2011) Next, using the BMP efficiencies for street sweeping and a unit rate of implementation, a pollutant load reduction in pounds can be determined as shown in Table 11. These are based on enhanced, bi-monthly sweeping. If the Delta between impervious and forest land cover is divided into the pounds reduced as a result of street sweeping, then an equivalent impervious acre factor can be derived. Because Chesapeake Bay's TMDLs are based on TN, TP, and TSS, the equivalent impervious acre analyses for all three pollutants are averaged together to determine a single weighted equivalent impervious acre conversion factor as shown in Table 12.
19

Table 12. Equivalent Impervious Acre Analyses for Street Sweeping
Parameter Implementation Units
Treatment Delta (lbs)
BMP Load Reduction (lbs)
Impervious Acre Conversion Factor
TN 1 acre 7.69 0.43 0.06 TP 1 acre 1.91 0.08 0.04 TSS (tons) 1 acre 0.43 0.05 0.12
Average for Nutrients and Sediment: 0.07
Examples are presented in Table 13 using the equivalent impervious acre conversion factor for street sweeping, or 0.07, along with various drainage areas, e.g., 2, 50, and 100 acres, to calculate an equivalent impervious acre. An equivalent impervious acre analysis has been conducted by MDE for each alternative stormwater management practice presented in this document and listed in Table 14, Matrix of Alternative Urban BMPs. Table 13. An Equivalent Impervious Acre
Implementation Units Conversion Factor for Street Sweeping
Impervious Acre Equivalent
2 acres 0.07 0.14 50 acres 0.07 3.5 100 acre 0.07 7.0
20

VII. Alternative Urban BMP Matrix NPDES stormwater permits require that alternative urban BMPs be recorded on a stormwater restoration database (Appendix C). MDE has expanded the list of acceptable alternative BMPs for reporting and the appropriate abbreviations for coding (Appendix D). All BMPs need to be GIS-mapped as point or polygon shape files and linked to the restoration database. BMP efficiencies and impervious acre equivalencies in Table 14 are calculated per acre of practice implementation, except where noted otherwise. For example, the pounds reduced and impervious acre equivalency for stream restoration need to be multiplied by the linear feet of the project. Catch basin cleaning needs to be multiplied by the tons of dry material removed. And, septic system pumping or treatment system changes need to be multiplied by the number of units improved. BMP definitions and design criteria can be found in Maryland's Manual, materials that support the CBP's approved BMP efficiencies, and within the body of this guidance document. All BMP efficiencies are derived from the CBP unless otherwise noted, e.g., MDE. Local governments shall use the BMP efficiencies and impervious acre equivalencies in this guidance to show progress toward meeting the NPDES 20% impervious cover restoration requirement, water quality benchmarks, and stormwater WLAs. Some of the alternative stormwater management practices, including reforestation, shoreline stabilization, and septic system upgrades may be claimed by other agencies in pursuit of the Chesapeake Bay TMDL. To prevent the double counting of BMPs, any practice used for meeting stormwater WLAs and NPDES stormwater permit conditions cannot be claimed by another program or government agency. Because local governments maintain the responsibility for various environmental regulatory programs and are the organizational structure for implementing the Chesapeake Bay Phase II WIP, it will be incumbent upon localities to prevent the double reporting of BMPs.
21

Table 14. Matrix of Alternative Urban BMPs
* Only nutrient values were used to derive impervious acre equivalent
Efficiency Per Acre
BMP Practice
TN TP TSS
Impervious Acre
Equivalent Mechanical Street Sweeping 4% 4% 10% 0.07 Regenerative/Vacuum Street Sweeping 5% 6% 25% 0.13 Nutrient Management 17% 22% 0% 0.09 Grass/Meadow Buffers 30% 40% 55% 0.27 Forest Buffers 45% 40% 55% 0.34 Impervious Urban to Pervious (MDE) 13% 72% 84% 0.62 Impervious Urban to Forest (MDE) 71% 94% 93% 1.00 Planting Trees on Pervious Urban (MDE) 66% 77% 57% 0.38 Planting Trees on Impervious Urban (MDE) 71% 94% 93% 1.00 Reforestation on Pervious Urban (MDE) 66% 77% 57% 0.38 Reforestation on Impervious Urban (MDE) 71% 94% 93% 1.00
Pounds Reduced per Ton of Collected Dry Material
BMP Practice
TN TP TSS
Impervious Acre
Equivalent Catch Basin Cleaning 1.5 0.6 600 0.40 Storm Drain Vacuuming 1.5 0.6 600 0.40 Mechanical Street Sweeping 1.5 0.6 600 0.40 Regenerative/Vacuum Street Sweeping 1.5 0.6 600 0.40
Pounds Reduced per Linear Foot BMP Practice
TN TP TSS
Impervious Acre
Equivalent Stream Restoration 0.02 0.035 2.55 0.01 Shoreline Stabilization (MDE) 0.16 0.11 451 0.04*
Pounds Reduced per Unit BMP Practice
TN TP TSS
Impervious Acre
Equivalent Septic Pumping 0.6 0 0 0.03 Septic Denitrification 6.0 0 0 0.26 Septic Connections to WWTP (MDE) 9.0 0 0 0.39 Alternative BMPs for Consideration Education Sub-Soiling Trash Removal Pet Waste Management Outfall Stabilization Floodplain Restoration River Bank Stabilization Bio-Reactor Carbon Filter Disconnection of Illicit Discharges
22

VIII. Bibliography Anne Arundel County Department of Public Works. 2010. Stormwater National Pollutant Discharge Elimination System, 2009, Annual Report for Anne Arundel County. Anne Arundel County Department of Public Works. Annapolis, MD. Anne Arundel County Department of Public Works. 2010. Step Pool Storm Conveyance (SPSC) Design Guidelines (Revisions 1 and 2). Anne Arundel County Department of Public Works. Annapolis, MD. http://www.aacounty.org/DPW/Watershed/StepPoolStormConveyance.cfm. Baish, A.S. and Caliri, M.J. 2009. Average Nutrient and Sediment Effluent Removal Efficiencies for Stormwater Best Management Practices in Maryland from 1984-2002. Johns Hopkins University, School of Engineering. Baltimore, MD. Baltimore City Department of Public Works. 2006. NPDES Stormwater Permit Program, 2005 Annual Report. Baltimore City Department of Public Works. Baltimore, MD. Baltimore County Department of Environmental Protection and Resource Management. 2008. Spring Branch – Small Watershed Action Plan. Volume I and II. Baltimore County Department of Environmental Protection and Resource Management. Towson, MD. Baltimore County Department of Environmental Protection and Resource Management. 2010. NPDES Municipal Stormwater Permit, 2010 Annual Report. Baltimore County Department of Environmental Protection and Resource Management. Towson, MD. Baltimore County Department of Environmental Protection and Resource Management. 2010. Stream Restoration Impervious Surface Credits and Pollutant Load Removal. Presentation by Steve Stewart at November 17, 2010 NPDES Stormwater Workgroup Meeting. Baltimore, MD. Booth, D.B. 2005. Challenges and Prospects for Restoring Urban Streams: A Perspective from the Pacific Northwest of North America. Journal of North American Benthological Society. 24(3): 724-737. Center for Watershed Protection. 2008. Deriving Reliable Pollutant Removal Rates for Municipal Street Sweeping and Storm Drain Cleanout Programs in the Chesapeake Bay Basin. Center for Watershed Protection. Ellicott City, MD. Chesapeake Bay Program. 2010. Protocol for Development, Review, and Approval of Loading and Effectiveness Estimates for Nutrient and Sediment Controls in the Chesapeake Bay Model. Chesapeake Bay Program Water Quality Goal Implementation Team. Chesapeake Bay Program. Urban Stormwater Workgroup – Current Projects and Info. http://www.chesapeakebay.net/committee_urbanworkgroup_projects.aspx?menuitem=16750. Chesapeake Bay Program. BMP Definitions. http://archive.chesapeakebay.net/pubs/subcommittee/nsc/uswg/BMP_Definitions.PDF (accessed February 1, 2011).
23
Chesapeake Bay Program. BMP Guidance for the States and the District. http://archive.chesapeakebay.net/pubs/subcommittee/nsc/uswg/BMP_Guidance_for_States_and_the_District.PDF (accessed February 1, 2011). Chesapeake Bay Program. BMP Pollutant Removal Efficiencies. http://archive.chesapeakebay.net/pubs/subcommittee/nsc/uswg/BMP_Pollutant_Removal_Efficiencies.PDF (accessed February 1, 2011). Chesapeake Bay Program. BMP Stream Restoration in Urban Areas, Crediting Jurisdictions for Pollutant Load Reductions. http://archive.chesapeakebay.net/pubs/subcommittee/nsc/uswg/BMP_Stream_Restoration_and_Pollutant_Load_Reductions.PDF (accessed February 1, 2011). Chesapeake Bay Program. Modeling Team. http://www.chesapeakebay.net/committee_msc_info.aspx. Claytor, R., and Schueler, T.R., 1997. Technical Support Document for the State of Maryland Stormwater Design Manual Project. Water Management Administration. Maryland Department of the Environment, Baltimore, MD. Code of Federal Regulation (CFR), Title 40 – Protection of Environment, Chapter 1 – U.S. Environmental Protection Agency, Part 122.26 Stormwater Discharges. Code of Maryland Regulations (COMAR), Title 26 Department of the Environment, Subtitle 17, Water Management Administration, Chapter 02 Stormwater Management. Hassett, B., Palmer, M.A., Bernherdt, E., Smith, S., Carr, J., Hart, D. 2005. Restoring Watersheds Project by Project, Trends in Chesapeake Bay Tributary Restoration. Frontiers in Ecology and Environment. 3(5): 259-267. Ibison, N.A., Baumer, J.C., Hill, C.L., Burger, N.H., and Frye, J.E. 1992. Eroding Bank Nutrient Verification Study for the Lower Chesapeake Bay. Virginia Department of Conservation and Recreation, Division of Soil and Water Conservation. Gloucester Point, VA. Kaushal, S.S., Groffman, P.M., Mayer, P.M., Striz, E., and Gold, A.J. 2008. Effects of Stream Restoration on Denitrification in an Urbanizing Watershed. Ecological Applications. 18(3): 789-804. Maryland Department of the Environment. 1987. Design Procedures for Stormwater Management Extended Detention Structures. Maryland Department of the Environment. Baltimore, MD. Maryland Department of the Environment. 2000 and 2008. 2000 Maryland Stormwater Design Manual, Volume I and II (including Supplement 1). Maryland Department of the Environment. Baltimore, MD.
24

25
Maryland Department of the Environment. 2008. Shore Erosion Control Guidelines for Waterfront Property Owners, 2nd Edition. Maryland Department of the Environment. Baltimore, MD. Maryland Department of the Environment. 2008. Maryland Policy for Nutrient Cap Management and Trading in Maryland's Chesapeake Bay Watershed. Maryland Department of the Environment. Baltimore, MD. Maryland Department of the Environment. 2009. Maryland’s Urban Stormwater Best Management Practices by Era Proposal. Maryland Department of the Environment. Baltimore, MD. Maryland Department of the Environment. 2010. NPDES Stormwater Workgroup Survey. September 16, 2010 NPDES Stormwater Workgroup Meeting Handout. Maryland Department of the Environment. Baltimore, MD. Maryland Department of Natural Resources. Maryland Shorelines Online. http://www.dnr.state.md.us/ccp/coastalatlas/shorelines.asp. Maryland Department of Natural Resources. 2009. No Net Loss of Forest Task Force. Maryland Department of Natural Resources. Annapolis, MD. Maryland State Highway Administration. 2010. Methodology for Pollutant Removal and Impervious Acre Accounting. Presentation by Dana Havlik at November 17, 2010 NPDES Stormwater Workgroup Meeting. Baltimore, MD. Montgomery County Department of Environmental Protection. 2003. Countywide Stream Protection Strategy. Montgomery County, Rockville, MD. Palmer, M.A. 2008. Reforming Watershed Restoration: Science in Need of Application and Applications in Need of Science. Estuaries and Coasts. 32(1): 1559-2723. Rosgen, D. 1996. Applied River Morphology. Wildland Hydrology. Pagosa Springs, CO. Walsh, C.J., and Kunapo, J. 2009. The Importance of Upland Flow Paths in Determining Urban Effects on Stream Ecosystems. Journal of North American Benthological Society. 28 (4): 977–990. Weammert, S.E. 2007. The Mid-Atlantic Water Program (MAWP), BMP Efficiencies Reported by the Chesapeake Bay Watershed Jurisdictions prior to 2003. University of Maryland. College Park, MD. Yetman, K.T. 2001. Stream Corridor Assessment Survey, SCA Survey Protocols. Maryland Department of Natural Resources. Annapolis, MD.

Appendix A -- Stormwater Model Weblinks Stormwater management computer models can aid local jurisdictions in establishing baseline pollutant loads, planning restoration work, and showing progress toward meeting waste load allocations (WLAs). Maryland's Assessment and Scenario Tool (MAST) developed for the Chesapeake Bay Program (CBP) and the Hydrological Simulation Program -- Fortran (HSPF), the Stormwater Management Model (SWMM), and spreadsheet versions like the Watershed Treatment Model (WTM) are acceptable for use by Maryland's NPDES localities. MAST is the only model that relates directly to the CBP model and where pollutant removal credits may be assured under the Bay's TMDL. Other models and results can be compared to the Bay model on a proportional basis for NPDES accounting purposes. 1. Maryland Assessment and Scenario Tool http://www.mde.state.md.us/programs/Water/TMDL/TMDLImplementation/Documents/Webinars/April/WIP_Webinar_2011-04-13_MAST.pdf 2. Hydrological Simulation Program -- Fortran: http://water.usgs.gov/software/HSPF/ 3. Stormwater Management Model http://www.epa.gov/ednnrmrl/models/swmm/index.htm 4. Watershed Treatment Model http://www.stormwatercenter.net/monitoring%20and%20assessment/WTM_Users_Notes.htm
26

Appendix B -- Maryland's Urban BMP Database
Column Name Data Type Length Description YEAR NUMBER 4 Annual report year STRU_ID TEXT 4 Unique structure ID PERMIT_NO TEXT 10 Unique permit number STRU_NAME TEXT 60 Structure name ADDRESS TEXT 50 Structure address CITY TEXT 15 Structure address STATE TEXT 2 Structure address ZIP NUMBER 10 Structure address MD_NORTH NUMBER 8 Maryland grid coordinate (NAD 83 meters) Northing MD_EAST NUMBER 8 Maryland grid coordinate (NAD 83 meters) Easting
ADC_MAP TEXT 5 ADC map book coordinate (optional if BMP has MD Northing\Easting)
WATERSHED_CODE NUMBER 20 Maryland 12-digit hydrologic unit code STRU_TYPE TEXT 10 Identify structure or BMP type3
RESTORATION TEXT 3 Is this a stormwater restoration practice? Answer Yes or No LAND_USE NUMBER 3 Predominant land use2 DRAIN_AREA NUMBER 8 Structure drainage area (acres)1 IMP_DRAIN NUMBER 8 Structure impervious drainage area (acres) TOT_DRAIN NUMBER 8 Total site area (acres) RCN NUMBER 5 Runoff curve number (weighted) ON_OFF_SITE TEXT 3 On or offsite structure APPR_DATE DATE/TIME 8 Permit approval date BUILT_DATE DATE/TIME 8 Construction completion date INSP_DATE DATE/TIME 8 Record most recent inspection date GEN_COMNT TEXT 60 General comments (e.g., redundant controls) LAST_CHANGE DATE/TIME 8 Date last change made to this record
1 GIS shapefile required 2 Use Maryland Office of Planning land use codes 3 Use urban BMP type code
27

Appendix C -- Maryland's NPDES Stormwater Restoration Database
Column Name Data Type Length Description YEAR TEXT 4 Annual report year STRU_ID TEXT 10 Unique structure ID STRU_NAME TEXT 60 Structure name STRU_TYPE TEXT 10 Identify structure or BMP type3
DESCRIPTION TEXT 60 Brief description of the project LAND_USE TEXT 3 Predominant land use2 DRAIN_AREA NUMBER 8 Structure drainage area (acres)1 IMP_AREA NUMBER 8 Imperviousness in drainage area (acres)1 MD_NORTH NUMBER 9 Maryland grid coordinate (NAD 83 meters) Northing MD_EAST NUMBER 9 Maryland grid coordinate (NAD 83 meters) Easting WATERSHED_CODE TEXT 20 Maryland 12-digit hydrologic unit code
PROJ_STAT TEXT 2 Enter P for Proposed, UC for Under Construction, and C for Complete
APPR_DATE DATE/TIME 8 Permit approval date BUILT_DATE DATE/TIME 8 Construction completion date INSP_DATE DATE/TIME 8 Maintenance inspection date GEN_COMNT TEXT 60 General comments (e.g., experimental BMP) LAST_CHANGE DATE/TIME 8 Date last change made to this record
1 GIS shapefile required 2 Use Maryland Office of Planning land use codes. 3 Use urban BMP type code.
28

Appendix D -- Maryland's NPDES Urban BMP Index of Practices
BMP Practice Code
CBP Structural BMPs Dry Detention Ponds DP Hydrodynamic Structures OGS Dry Extended Detention Ponds ED Wet Ponds and Wetlands WP Infiltration Practices IP Filtering Practices FP Vegetated Open Channels VOC Erosion and Sediment Control E&S Stormwater Management by Era Development Between 1985 - 2002 ERA1 Urban BMP Retrofit ERA2 Development Between 2002 and 2010 ERA3 Development After 2010 ERA4 ESD to the MEP from the Manual Green Roofs ESD Permeable Pavements ESD Reinforced Turf ESD Disconnection of Rooftop Runoff ESD Disconnection of Non-Rooftop Runoff ESD Sheetflow to Conservation Areas ESD Rainwater Harvesting ESD Submerged Gravel Wetlands ESD Landscape Infiltration ESD Infiltration Berms ESD Dry Wells ESD Micro-Bioretention ESD Rain Gardens ESD Grass, Wet, or Bio-Swale ESD Enhanced Filters ESD Additional Structural BMP Guidance Redevelopment RED Existing Roadway Disconnect ERD Regenerative Stormwater Conveyance RSC
29

Appendix D -- Maryland's NPDES Urban BMP Index of Practices
Alternative Practice Type Code
Mechanical Street Sweeping MSS Regenerative/Vacuum Street Sweeping VSS Nutrient Management NM Grass/Meadow Buffers GMB Forest Buffers FB Impervious Urban to Pervious IMPP Impervious Urban to Forest IMPF Planting Trees on Pervious Urban PTPU Planting Trees on Impervious Urban PTIU Reforestation on Pervious Urban RPU Reforestation on Impervious Urban RIU Catch Basin Cleaning CBC Storm Drain Vacuuming SDV Stream Restoration STRE Shoreline Stabilization SHST Septic Pumping SEPP Septic Denitrification SEPD Septic Connections to WWTP SEPC Alternative BMPs for Consideration Education EDU
Sub-Soiling SUB
Trash Removal TRA Pet Waste Management PET Outfall Stabilization OUTS Floodplain Restoration FPRES River Bank Stabilization RBS Bio-Reactor Carbon Filter BRCF Disconnection of Illicit Discharges DID
30

Appendix E -- CBP Stream Restoration Guidance
Stream Restoration in Urban Areas Crediting Jurisdictions for Pollutant Load Reductions
The Chesapeake Bay Program will credit jurisdictions for reducing pollutant loads to the Bay and its tidal rivers, resulting from stream restoration in urban areas (including suburban areas). This document provides guidance to the jurisdictions regarding the stream restoration actions in urban areas that will be credited in the watershed model. Stream Restoration in Urban Areas Land cover changes in the contributing watersheds disrupt the existing natural balance between the water flow regime and sediment flux, destabilize stream channels, and increase the loadings of pollutants to downstream areas. The objectives, opportunities, and measures for stream restoration may differ in urban and rural areas. The objectives for stream restoration in urban areas include, but are not limited to, reducing stream channel erosion, promoting physical channel stability, reducing the transport of pollutants downstream, and working towards a stable habitat with a self-sustaining, diverse aquatic community. Stream restoration activities should result in a stable stream channel that experiences no net aggradation or degradation over time. In addition to these in-stream restoration activities, addressing upland sources of stream impacts (for example, reducing watershed runoff and associated pollutant loads, or encouraging groundwater recharge) is critical to ensuring the success of stream restoration projects in urban areas. Projects should be planned in the context of a comprehensive watershed assessment or inventory, where upland sources of the problem are considered in the project design. Smaller stream restoration projects on isolated stretches of a stream can be counted as long as upland sources of impacts are considered in some way. To ensure the success of a stream restoration project in an urban area, the project must have adequate watershed controls of upstream sources of urban runoff or be designed to accommodate the current and future urban runoff volume and velocity from upstream sources. Just like with other best management practices in the Chesapeake Bay watershed, it is important to track and monitor the effectiveness of stream restoration projects in urban areas. All projects should either have a monitoring component or regular inspection and maintenance program to ensure ongoing stability of the urban stream. What Types of Projects are Credited as Stream Restoration in Urban Areas? Pollutant load reductions associated with stream restoration projects in urban areas can be credited in the Chesapeake Bay Watershed model if they meet the following criteria: • Projects must meet multiple objectives of stream restoration in urban areas. • Project must be set within the context of a watershed assessment that considers the effect of upland sources to the viability of the stream restoration project. • Project must have a monitoring component and/or regular inspections to demonstrate ongoing stability of the urban stream.
31

32
The Chesapeake Bay watershed jurisdictions will annually report the number of urban stream miles restored in each Chesapeake Bay Watershed Model county segment to the Chesapeake Bay Program Office. Pollutant Load Reductions Associated with Stream Restoration in Urban Areas In addition to localized benefits, stream restoration in urban areas can result in reductions of pollutant loads entering the Bay and its tidal rivers. There is only one known study that quantifies the pollutant load reductions associated with stream restoration in an urban area. Although data are lacking, the Chesapeake Bay Program decided it was important to account for load reductions resulting from stream restoration. The Chesapeake Bay Program will refine these efficiencies as additional data become available. Reductions in pollutant loads entering the Bay and its tidal rivers from stream restoration in urban areas will be calculated based on the following pollutant removal efficiencies (Baltimore County, Maryland, Spring Branch Stream Study, 2002): • TN = 0.02 lb/linear foot/year • TP = 0.0035 lb/linear foot/year • TSS = 2.55 lb/linear foot/year