cchapter 8 hapter 8 rresource mastersesource masters
TRANSCRIPT
PDF Pass
Chapter 8 Chapter 8 Resource MastersResource Masters
ContentsChapter Resources• Family Letter • Are You Ready Worksheets• Diagnostic Test • Pretest
Language Arts Resources• Student Glossary
Practice and Reinforcement• Facts Practice
Leveled Lesson Resources• Explore• Reteach• Skills Practice• Homework Practice• Problem-Solving Practice• Enrich
Technology Resources• Graphing Calculator Activity• Scientific Calculator Activity• Spreadsheet Activity
Assessment Resources• Reflecting on the Chapter• Chapter Quizzes• Vocabulary Test• Chapter Tests• Standardized Test Practice• Extended-Response Test• Student Recording Sheet• Chapter Project Rubric
Answer Pages
ChapterResource Masters
are provided forevery chapter in both
print and digitalformats.
MC'11_CRM3_c8_FL_892307-7.indd 1MC'11_CRM3_c8_FL_892307-7.indd 1 2/11/09 11:57:34 PM2/11/09 11:57:34 PM

Copyright © by the McGraw-Hill Companies, Inc. All rights reserved. Permission is granted to reproduce the material contained herein on the condition that such materials be reproduced only for classroom use; be provided to students, teachers, and families without charge; and be used solely in conjunction with Math Connects, Course 3. Any other reproduction, for use or sale, is expressly prohibited without prior written permission of the publisher.
Send all inquiries to:Glencoe/McGraw-Hill8787 Orion PlaceColumbus, OH 43240
ISBN: 978-0-07-892307-4MHID: 0-07-892307-7 Math Connects, Course 3
Printed in the United States of America.
2 3 4 5 6 7 8 9 10 032 18 17 16 15 14 13 12 11 10 09
PDF Pass0ii_FLCRMC3C08_892307.indd ii0ii_FLCRMC3C08_892307.indd ii 7/25/09 11:56:34 AM7/25/09 11:56:34 AM
Cop
yrig
ht ©
Gle
ncoe
/McG
raw
-Hill
, a d
ivis
ion
of T
he M
cGra
w-H
ill C
ompa
nies
, Inc
.CONTENTSCONTENTS
Teacher’s Guide . . . . . . . . . . . . . . . . . . . . . . . . . . . v
Chapter 8 ResourcesFamily Letter . . . . . . . . . . . . . . . . . . . . . . 1Are You Ready?
Practice Worksheet . . . . . . . . . . . . . . . . . . . . . 5
AL Review Worksheet . . . . . . . . . . . . . . . . . . 6
BL Apply Worksheet . . . . . . . . . . . . . . . . . . . 7
Diagnostic Test . . . . . . . . . . . . . . . . . . . . . . 8
Pretest . . . . . . . . . . . . . . . . . . . . . . . . . . . . . . 9
Language Arts ResourcesStudent Glossary . . . . . . . . . . . . . . . . . . . . . . 10
Practice and Reinforcement Facts Practice . . . . . . . . . . . . . . . . . . . . . . . . . 11
Lesson Resources
A Measures of Central TendencyAL Reteach . . . . . . . . . . . . . . . . . . . . . . . 13
Skills Practice . . . . . . . . . . . . . . . . . . . . . . 14Homework Practice . . . . . . . . . . . . . . . . . . 15Problem-Solving Practice . . . . . . . . . . . . . 16BL Enrich. . . . . . . . . . . . . . . . . . . . . . . . . 17
Scientific Calculator Activity . . . . . . . . . . 18
C Changes in DataAL Reteach . . . . . . . . . . . . . . . . . . . . . . . 19
Skills Practice . . . . . . . . . . . . . . . . . . . . . . 20Homework Practice . . . . . . . . . . . . . . . . . . 21Problem-Solving Practice . . . . . . . . . . . . . 22BL Enrich. . . . . . . . . . . . . . . . . . . . . . . . . 23
Lesson Resources
A Measures of VariationAL Reteach . . . . . . . . . . . . . . . . . . . . . . . 24
Skills Practice . . . . . . . . . . . . . . . . . . . . . . 25Homework Practice . . . . . . . . . . . . . . . . . . 26Problem-Solving Practice . . . . . . . . . . . . . 27BL Enrich. . . . . . . . . . . . . . . . . . . . . . . . . 28
B Box-and-Whisker PlotsAL Reteach . . . . . . . . . . . . . . . . . . . . . . . 29
Skills Practice . . . . . . . . . . . . . . . . . . . . . . 30Homework Practice . . . . . . . . . . . . . . . . . . 31Problem-Solving Practice . . . . . . . . . . . . . 32BL Enrich. . . . . . . . . . . . . . . . . . . . . . . . . 33
TI-84 Plus Activity . . . . . . . . . . . . . . . . . 34
C Double Box-and-Whisker PlotsAL Reteach . . . . . . . . . . . . . . . . . . . . . . . 35
Skills Practice . . . . . . . . . . . . . . . . . . . . . . 36Homework Practice . . . . . . . . . . . . . . . . . . 37Problem-Solving Practice . . . . . . . . . . . . . 38BL Enrich. . . . . . . . . . . . . . . . . . . . . . . . . 39
Lesson Resources
A PSI: Use a GraphAL Reteach . . . . . . . . . . . . . . . . . . . . . . . 40
Skills Practice . . . . . . . . . . . . . . . . . . . . . . 41Homework Practice . . . . . . . . . . . . . . . . . . 42Problem-Solving Practice . . . . . . . . . . . . . 43
B : Scatter PlotsExplore . . . . . . . . . . . . . . . . . . . . . . . . . . . 44
C Scatter PlotsAL Reteach . . . . . . . . . . . . . . . . . . . . . . . 45
Skills Practice . . . . . . . . . . . . . . . . . . . . . . 46Homework Practice . . . . . . . . . . . . . . . . . . 47Problem-Solving Practice . . . . . . . . . . . . . 48
AL = Approaching Level BL = Beyond Level
Lesson
8-1
Lesson
8-2
Lesson
8-3
iii
PDF passiii_viii_FLCRMC3C08_892307.indd iiiiii_viii_FLCRMC3C08_892307.indd iii 12/31/08 9:49:34 AM12/31/08 9:49:34 AM
Copyright ©
Glencoe/M
cGraw
-Hill, a division of T
he McG
raw-H
ill Com
panies, Inc.
iv
BL Enrich. . . . . . . . . . . . . . . . . . . . . . . . . 49TI-73 Activity . . . . . . . . . . . . . . . . . . . . . 50
D : Lines of Best FitExplore . . . . . . . . . . . . . . . . . . . . . . . . . . . 51
E Lines of Best FitAL Reteach . . . . . . . . . . . . . . . . . . . . . . . 52
Skills Practice . . . . . . . . . . . . . . . . . . . . . . 53Homework Practice . . . . . . . . . . . . . . . . . . 54Problem-Solving Practice . . . . . . . . . . . . . 55BL Enrich. . . . . . . . . . . . . . . . . . . . . . . . . 56
TI-nspire Activity . . . . . . . . . . . . . . . . . . . 57
G Select an Appropriate DisplayAL Reteach . . . . . . . . . . . . . . . . . . . . . . . 58
Skills Practice . . . . . . . . . . . . . . . . . . . . . . 59Homework Practice . . . . . . . . . . . . . . . . . . 60Problem-Solving Practice . . . . . . . . . . . . . 61BL Enrich. . . . . . . . . . . . . . . . . . . . . . . . . 62
Assessment ResourcesReflecting on Chapter 8 . . . . . . . . . . . . . . . . 63
Chapter Quizzes . . . . . . . . . . . . . . . . . . . . . . 64
Vocabulary Test . . . . . . . . . . . . . . . . . . . . . . . 66
Chapter Tests
AL 1A . . . . . . . . . . . . . . . . . . . . . . . . . . . . . . 67
AL 1B . . . . . . . . . . . . . . . . . . . . . . . . . . . . . . 69
2A . . . . . . . . . . . . . . . . . . . . . . . . . . . . . . 71
2B . . . . . . . . . . . . . . . . . . . . . . . . . . . . . . 73
BL 3A . . . . . . . . . . . . . . . . . . . . . . . . . . . . . . 75
BL 3B . . . . . . . . . . . . . . . . . . . . . . . . . . . . . . 77
Standardized Test Practice . . . . . . . . . . . . . . 79
Extended-Response Test . . . . . . . . . . . . . . . . 81
Extended-Response Rubric . . . . . . . . . . . . . . 82
Student Recording Sheet . . . . . . . . . . . . . . . 83
Chapter Project Rubric . . . . . . . . . . . . . . . . . 84
Answers . . . . . . . . . . . . . . . . . . . . . . . . . . . . . . .A1
PDF passiii_viii_FLCRMC3C08_892307.indd iviii_viii_FLCRMC3C08_892307.indd iv 12/31/08 9:49:44 AM12/31/08 9:49:44 AM
Cop
yrig
ht ©
Gle
ncoe
/McG
raw
-Hill
, a d
ivis
ion
of T
he M
cGra
w-H
ill C
ompa
nies
, Inc
.
v
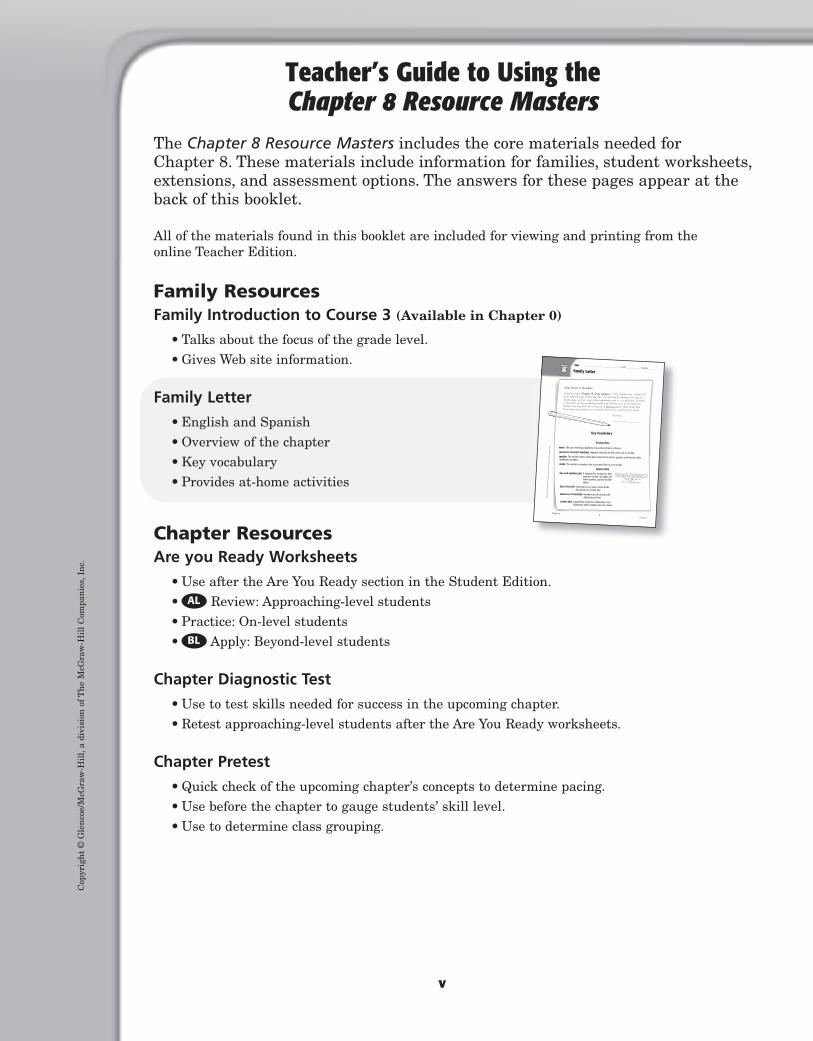
Teacher’s Guide to Using theChapter 8 Resource Masters
The Chapter 8 Resource Masters includes the core materials needed forChapter 8. These materials include information for families, student worksheets, extensions, and assessment options. The answers for these pages appear at the back of this booklet.
All of the materials found in this booklet are included for viewing and printing from the online Teacher Edition.
Family ResourcesFamily Introduction to Course 3 (Available in Chapter 0)
• Talks about the focus of the grade level. • Gives Web site information.
Family Letter • English and Spanish • Overview of the chapter • Key vocabulary • Provides at-home activities
Chapter ResourcesAre you Ready Worksheets • Use after the Are You Ready section in the Student Edition. • AL Review: Approaching-level students • Practice: On-level students • BL Apply: Beyond-level students
Chapter Diagnostic Test • Use to test skills needed for success in the upcoming chapter. • Retest approaching-level students after the Are You Ready worksheets.
Chapter Pretest • Quick check of the upcoming chapter’s concepts to determine pacing. • Use before the chapter to gauge students’ skill level. • Use to determine class grouping.
NAME ________________________________________ DATE _____________ PERIOD _____
Chapter 8 1
Course 3
Cop
yrig
ht
© G
len
coe/
McG
raw
-Hil
l, a
divi
sion
of T
he
McG
raw
-Hil
l C
ompa
nie
s, I
nc.
Family Letter
Key Vocabulary
Dear Parent or Guardian:
Today we began Chapter 8: Data Analysis. In this chapter, your student will learn different ways to describe data. We will also be learning new ways to display data, such as using a box-and-whisker plot or a scatter plot. Included in this letter are key vocabulary words and activities you can do with your student. You may also wish to log on to glencoe.com for other study help. If you have any questions or comments, feel free to contact me at school.
Sincerely,
Analyze Data
mean The sum of the data divided by the number of items in the set.measures of central tendency Numbers that describe the center of a set of data.median The middle number of the data ordered from least to greatest, or the mean of the middle two numbers.
mode The number or numbers that occur most often in a set of data.
Display Databox-and-whisker plot A diagram that summarizes data
using the median, the upper andlower quartiles, and the extremevalues.
line of best fit A line that is very close to most of the data points on a scatter plot.
measures of variation Numbers used to describe the distribution of data.
scatter plot A graph that shows the relationship, if any relationship exists, between two sets of data.
8Chapter
10 15 20 25 30
Minimumvalue
Lowerquartile Median Upper
quartileMaximumnon-outlier Outlier
001_011_FLCRMC3C08_892307.indd 1001 011 FLCRMC3C
12/30/08 8:14:53 PM
Pdf Crxiii_viii_FLCRMC3C08_892307.indd viii_viii_FLCRMC3C08_892307.indd v 2/12/09 10:08:20 PM2/12/09 10:08:20 PM
Copyright ©
Glencoe/M
cGraw
-Hill, a division of T
he McG
raw-H
ill Com
panies, Inc.
vi
Language Arts ResourcesStudent Glossary • Includes key vocabulary terms from the chapter. • Students record definitions and/or examples for each term. • Students can use the page as a bookmark as they study the chapter.
Practice and ReinforcementFacts Practice • Quick recall of concepts needed in the upcoming chapter. • Use as a timed test to gauge student mastery of prior concepts.
Lesson Resources
Explore • Provides additional practice for the activities and exercises
found in the Student Edition. • Use as homework for same-day teaching.
Reteach • Provides vocabulary, key concepts, additional worked-out
examples, and exercises. • Use for students who have been absent.
Skills Practice • Focuses on the computational nature of the lesson. • Use as an additional practice. • Use as homework for second-day teaching.
Homework Practice • Mimics the types of problems found in the Practice
and Problem Solving of the Student Edition. • Use as an additional practice. • Use as homework for second-day teaching.
Problem-Solving Practice • Includes word problems that apply the concepts of the lesson. • Use as an additional practice. • Use as homework for second-day teaching.
NAME ________________________________________ DATE _____________ PERIOD _____
Cop
yrig
ht
© G
len
coe/
McG
raw
-Hil
l, a
divi
sion
of T
he
McG
raw
-Hil
l C
ompa
nie
s, I
nc.
8-1
Chapter 8 15
Course 3
Find the mean, median and mode of each data set. Round to the nearest tenth if necessary. 1. prices, in dollars, of day packs 2. points on quizzes 37, 43, 41, 36, 43 13, 6, 9, 8, 14, 5, 10, 7
3.
0 5 10 15
� �� � � � � � � � �
4.
0 0.5 1.0
�� ��
� �
�
� � � �
For Exercises 5 and 6, select the appropriate measure of central tendency to describe the data in each table. Justify your reasoning. 5. Known Mountains on MarsMountain Height (km)Alba Patera 3Arsia Mons 9Ascraeus Mons 11Olympus Mons 27Pavonis Mons 7
6. Average Lengths of Wildcats
Cat Length Cat LengthCheetah 50.5 in. Lion 102 in.Eurasian Wildcat
24.3 in. Puma 60 in.
Jaguar 57.5 in. Serval 33.5 in.Leopard 57 in. Tiger 128 in.
7. MARS Refer to the table of mountains on Mars in Exercise 5. Describe how the mean, median and mode are each affected if the data for Olympus Mons is not included.
Homework PracticeMeasures of Central Tendency
Get ConnectedGet Connected For more examples, go to glencoe.com.
A
012_023_FLCRMC3C08_892307.indd 15012 023 FLCRMC3C
12/30/08 8:13:43 PM
NAME ________________________________________ DATE _____________ PERIOD _____
Cop
yrig
ht
© G
len
coe/
McG
raw
-Hil
l, a
divi
sion
of T
he
McG
raw
-Hil
l C
ompa
nie
s, I
nc.
8-3D
Chapter 8 51
Course 3
Lines of Best FitPOPULATION Wayne found the following information on the U.S. Census Bureau’s Web site. The data in the table displays the population of Florida at the beginning of each decade, in millions of people. The x-axis in the table is the number of years since 1990. So, “0” represents 1900, “10” represents 1910, and so on. He wants to know if he can predict Florida’s population in 2030.
Florida’s Population in Years Since 1900 (millions)0 10 20 30 40 50 60 70 80 90 100 1100.53 0.75 0.97 1.47 1.90 2.77 4.95 6.79 9.75 12.94 15.98 19.31** projected
ACTIVITYStep 1 Make a scatter plot for the data.
Flor
ides
Pop
ulat
ions
(mill
ions
)
63
0
129
2427
211815
20 40 60 80 100 120Years Since 1990
y
x
Step 2 Use a piece of uncooked spaghetti to make a line that goes through most of the data points.Step 3 Look at the point where the spaghetti has an x-value of 130 (year 2030). When the x-value is 130, the y-value is 21.5.A prediction for Florida’s population in 2030 is 21,500,000.Analyze the Results
1. Is it possible to use this kind of scatter plot to predict the population of each of the 50 states in 2030? Explain.
2. Refer to the scatter plot above. Is this method always valid when making a prediction? Explain.
3. Research and collect a set of data that has a positive or negative relationship. Display your data in a scatter plot. Use the method in the activity to make a prediction about the data in the scatter plot.
051_057_FLCRMC3C08_892307.indd 51051 057 FLCRMC3C
12/30/08 8:10:14 PM
PDF passiii_viii_FLCRMC3C08_892307.indd viiii_viii_FLCRMC3C08_892307.indd vi 12/31/08 9:49:56 AM12/31/08 9:49:56 AM

Cop
yrig
ht ©
Gle
ncoe
/McG
raw
-Hill
, a d
ivis
ion
of T
he M
cGra
w-H
ill C
ompa
nies
, Inc
.
vii
Enrich • Provides an extension of the concepts, offers a historical or
multicultural look at the concepts, or widens students’ perspectives on the mathematics.
• For use with all levels of students.
Technology Activities • Presents ways in which technology can be used with the
concepts in some of the lessons. • Use as an alternative approach to teaching the concept. • Use as part of the lesson presentation.
Assessment Resources
Reflecting on Chapter 8 • Three open-ended questions • Allows students to write about mathematics.
Chapter Quizzes • Free-response questions • One quiz for each multi-part lesson
Vocabulary Test • Includes a list of vocabulary words and questions to assess students’ knowledge of
those words. • Use in conjunction with one of the Chapter Tests.
Chapter Tests • AL 1A-1B Approaching-level students • Contains multiple-choice questions. • 2A-2B On-level students • Contains both multiple-choice and free-response questions. • BL 3A-3B Beyond-level students • Contains free-response questions. • Tests A and B are the same format with different numbers. • Use when students are absent or for different rows.
Standardized Test Practice • Test is cumulative. • Includes multiple-choice and short-response questions.
NAME ________________________________________ DATE _____________ PERIOD _____
SCORE _____
Chapter 8 79
Course 3
Cop
yrig
ht
© G
len
coe/
McG
raw
-Hil
l, a
divi
sion
of T
he
McG
raw
-Hil
l C
ompa
nie
s, I
nc.
8Chapter
1. A B C D
2.
3. F G H I
4.
Read each question. Then fill in the correct answer. 1. TRAVEL Tanya is going to visit her parents, who live 90 minutes away. On the way she plans to make three stops. She estimates the first stop will take 45 minutes, the second 60 minutes, and the third 20 minutes. If she wants to arrive at her parents’ house at 4:00 P.M., when does she have to leave from home? A. 11:25 A.M. B. 11:35 A.M. C. 12:25 P.M. D. 12:35 P.M. 2. Find the distance between the two given points.
(2, 5) and (2, –9)
3. If a square has a perimeter of 100 feet and a second square has a perimeter of 140 feet, what is the scale factor of the two squares? F. 35 G. 25 H. 5 − 7 I. 1 − 2 4. TEAM Ten players are on Shawn’s basketball team but only five can play at any one time. How many different combinations of players are there?
Standardized Test Practice(Chapters 1–8)
075_084_FLCRMC3C08_892307.indd 79075 084 FLCRMC3C
1/23/09 9:38:14 AM
NAME ________________________________________ DATE _____________ PERIOD _____
Cop
yrig
ht
© G
len
coe/
McG
raw
-Hil
l, a
divi
sion
of T
he
McG
raw
-Hil
l C
ompa
nie
s, I
nc.
1. Where have you used the measures of central tendency and the measures of variation? Explain.
2. When graphing a scatter plot, the x and y variables
are related in one of three ways. Identify each of
these relationships. Explain in your own words
what each relationship means.
3. Name one idea that still confuses you. Why are
you confused?
Chapter 8 63
Course 3
063_074_FLCRMC3C08_892307.indd 63063 074 FLCRMC3C
12/30/08 8:12:27 PM
NAME ________________________________________ DATE _____________ PERIOD _____
Cop
yrig
ht
© G
len
coe/
McG
raw
-Hil
l, a
divi
sion
of T
he
McG
raw
-Hil
l C
ompa
nie
s, I
nc.
8-1
Chapter 8 17
Course 3
Median and Mean of Grouped DataTo find the median, add a column for the cumulativefrequency. This is the total of the frequencies up to and including the frequency in a given row.The last number in the cumulative frequency column will equal the number of data items. In this example, there are 75 data items. So, the median will be the 38th item. The median age is in the interval 30–39.To find the mean, multiply the frequency of each interval by the midpoint of the interval. Then, divide by the total number of data items.
(20 × 14.5) + (17 × 24.5) + (23 × 34.5) + (15 × 44.5) −−− 75
= 28.9 Find the interval for the median and the mean to the nearest tenth. 1. Add this data to the chart in the example: ages 50–59, 11 people; ages 60–69, 16 people; ages 70–79, 19 people; ages 80–89, 4 people.
2. People Who Prefer “All Talk” Radio Age 10–19 20–29 30–39 40–49 50–59 60–69 70–79 80–89Frequency 4 10 14 5 6 5 4 2
3. People who Listen to Radio While 4. People who Listen to Radio Doing Homework While Driving to Work
0 2 4 6 8
10–1920–2930–3940–4950–5960–6970–7980–89
Frequency (Number of People)
Age
0 4 8
10–1920–2930–3940–4950–5960–6970–7980–89
Frequency (Number of People)
Age
16 2012
People Responding to Radio Station SurveyAges Frequency Cumulative
Frequency10–19 20 2020–29 17 3730–39 23 6040–49 15 75
EnrichA
012_023_FLCRMC3C08_892307.indd 17012 023 FLCRMC3C
12/30/08 8:13:49 PM
Pdf Crxiii_viii_FLCRMC3C08_892307.indd viiiii_viii_FLCRMC3C08_892307.indd vii 2/9/09 2:28:03 PM2/9/09 2:28:03 PM
Copyright ©
Glencoe/M
cGraw
-Hill, a division of T
he McG
raw-H
ill Com
panies, Inc.
Extended-Response Test • Contains performance-assessment tasks • Sample answers are included.
Extended-Response Rubric • The scoring rubric for the Extended-Response Test.
Student Recording Sheet • Corresponds with the Test Practice at the end of the
Student Edition chapter.
Chapter Project Rubric • The scoring rubric for the Chapter Project found in the
Teacher Edition.
Answers
Chapter and Lesson Resources • Chapter Resources, Facts Practice, and Lesson Resources are provided as reduced
pages with answers appearing in black.
Assessments • Full-size answer keys are provided for the assessment masters.
viii
NAME ________________________________________ DATE _____________ PERIOD _____
Chapter 8 83
Course 3
Cop
yrig
ht
© G
len
coe/
McG
raw
-Hil
l, a
divi
sion
of T
he
McG
raw
-Hil
l C
ompa
nie
s, I
nc.
Use this recording sheet with pages 508–509 of the Student Edition.Fill in the correct answer. For gridded-response questions, write your answers in the boxes on the answer grid and fill in the bubbles to match your answers.
Extended ResponseRecord your answers for Exercise 10 on the back of this paper.
Student Recording Sheet
1. A B C D
2. F G H I
3.
4. A B C D
5.
6. F G H I
7. A B C D
8.
9. F G H I
8Chapter
075_085_FLCRMC3C08_892307.indd 83075 085 FLCRMC3C
12/30/08 8:16:22 PM
PDF passiii_viii_FLCRMC3C08_892307.indd viiiiii_viii_FLCRMC3C08_892307.indd viii 12/31/08 9:50:13 AM12/31/08 9:50:13 AM
NAME ________________________________________ DATE _____________ PERIOD _____
PDF pass
Chapter 8 1 Course 3
Cop
yrig
ht ©
Gle
ncoe
/McG
raw
-Hill
, a d
ivis
ion
of T
he M
cGra
w-H
ill C
ompa
nies
, Inc
.Family Letter
Key Vocabulary
Dear Parent or Guardian:
Today we began Chapter 8: Data Analysis. In this chapter, your student will
learn different ways to describe data. We will also be learning new ways to
display data, such as using a box-and-whisker plot or a scatter plot. Included
in this letter are key vocabulary words and activities you can do with your
student. You may also wish to log on to glencoe.com for other study help.
If you have any questions or comments, feel free to contact me at school.
Sincerely,
Analyze Data
mean The sum of the data divided by the number of items in the set.
measures of central tendency Numbers that describe the center of a set of data.
median The middle number of the data ordered from least to greatest, or the mean of the
middle two numbers.
mode The number or numbers that occur most often in a set of data.
Display Data
box-and-whisker plot A diagram that summarizes data
using the median, the upper and
lower quartiles, and the extremevalues.
line of best fit A line that is very close to most of the
data points on a scatter plot.
measures of variation Numbers used to describe the distribution of data.
scatter plot A graph that shows the relationship, if any
relationship exists, between two sets of data.
8Chapter
10 15 20 25 30
Minimumvalue
Lowerquartile Median Upper
quartileMaximumnon-outlier Outlier
001_011_FLCRMC3C08_892307.indd 1001_011_FLCRMC3C08_892307.indd 1 12/30/08 8:14:53 PM12/30/08 8:14:53 PM
NAME ________________________________________ DATE _____________ PERIOD _____
PDF 4th
Chapter 8 2 Course 3
Copyright ©
Glencoe/M
cGraw
-Hill, a division of T
he McG
raw-H
ill Com
panies, Inc.At-Home Activities8
Chapter
Materials: 2 number cubes, pencil, paper
• Roll the number cubes and add the resulting two numbers.
• Write down the sum.
• Repeat the first two steps 10 more times.
• Add the resulting eleven numbers and divide by 11. The answer is called the mean of the numbers.
• Order the sums from least to greatest and choose the middle number. The number you chose is called the median of the numbers.
Hands-On Activity
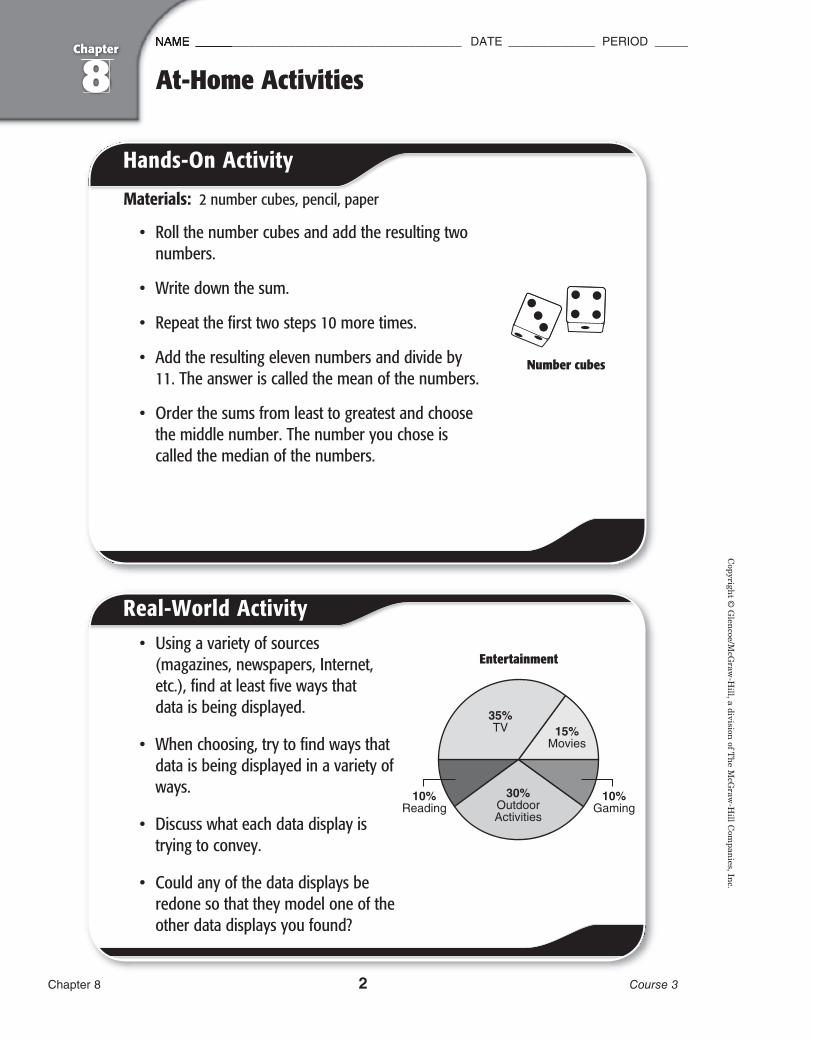
• Using a variety of sources (magazines, newspapers, Internet, etc.), find at least five ways that data is being displayed.
• When choosing, try to find ways that data is being displayed in a variety of ways.
• Discuss what each data display is trying to convey.
• Could any of the data displays be redone so that they model one of the other data displays you found?
Real-World Activity
Number cubes
Entertainment
001_011_FLCRMC3C08_892307.indd 2001_011_FLCRMC3C08_892307.indd 2 2/9/09 10:03:05 AM2/9/09 10:03:05 AM

NOMBRE ______________________________________ FECHA ____________ PERÍODO ____
Pdf Crx
Cop
yrig
ht ©
Gle
ncoe
/McG
raw
-Hill
, a d
ivis
ion
of T
he M
cGra
w-H
ill C
ompa
nies
, Inc
.8
Capítulo
Carta a la familia
Estimado padre o apoderado:
Hoy comenzamos el Capítulo 8: Análisis de datos. En este capítulo, su
estudiante aprenderá distintas maneras de describir datos. Además,
aprenderemos formas nuevas de representar datos, usando diagramas de caja y
patillas o diagramas de dispersión. En esta carta se incluyen palabras del
vocabulario clave y actividades que pueden realizar con su estudiante. Si desean
obtener más ayuda para el estudio, visiten glencoe.com. Si tienen alguna
pregunta o desean hacer algún comentario, pueden contactarme en la escuela.
Sinceramente,
Vocabulario clave
Análisis de datos
media Suma de los datos dividida entre el número de datos en el conjunto.
medidas de tendencia central Números que describen el centro de un conjunto de datos.
mediana Número del medio de un conjunto de datos ordenados de menor a mayor o la media
de los dos números del medio.
moda Número o números que ocurren con mayor frecuencia en un conjunto de datos.
Representa datos
diagrama de caja y patilla Diagrama que resume losdatos usando la mediana, los cuartiles inferior y superior y los valores extremos.
recta de ajuste Recta muy cercana a la mayoría de los puntos
de los datos en un diagrama de dispersión.
medidas de variación Números que se usan para describir
la distribución de los datos.
diagrama de dispersión Gráfica que muestra la relación, si existe, entre dos conjuntos de
datos.
Capítulo 8 3 Curso 3
10 15 20 25 30
Valormínimo
Cuartilinferior Mediana Cuartil
superiorValor máximo
no atípicoValor
atípico
001_011_FLCRMC3C08_892307.indd 3001_011_FLCRMC3C08_892307.indd 3 1/23/09 8:03:26 AM1/23/09 8:03:26 AM
NOMBRE ______________________________________ FECHA ____________ PERÍODO ____
Pdf Crx
Copyright ©
Glencoe/M
cGraw
-Hill, a division of T
he McG
raw-H
ill Com
panies, Inc.8
Capítulo
Actividades para el hogar
Actividad manual
Actividad concreta
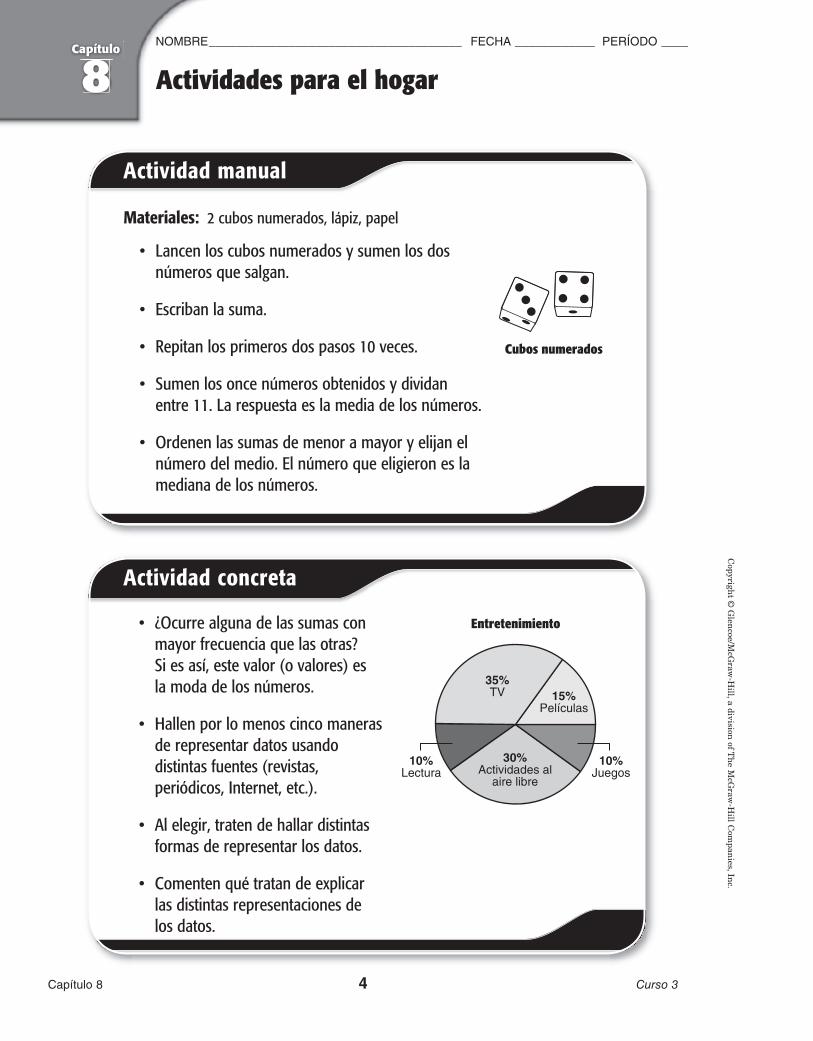
Materiales: 2 cubos numerados, lápiz, papel
• Lancen los cubos numerados y sumen los dos números que salgan.
• Escriban la suma.
• Repitan los primeros dos pasos 10 veces.
• Sumen los once números obtenidos y dividan entre 11. La respuesta es la media de los números.
• Ordenen las sumas de menor a mayor y elijan el número del medio. El número que eligieron es la mediana de los números.
Capítulo 8 4 Curso 3
Cubos numerados
Entretenimiento • ¿Ocurre alguna de las sumas con mayor frecuencia que las otras? Si es así, este valor (o valores) es la moda de los números.
• Hallen por lo menos cinco maneras de representar datos usando distintas fuentes (revistas, periódicos, Internet, etc.).
• Al elegir, traten de hallar distintas formas de representar los datos.
• Comenten qué tratan de explicar las distintas representaciones de los datos.
001_011_FLCRMC3C08_892307.indd 4001_011_FLCRMC3C08_892307.indd 4 1/23/09 7:59:29 PM1/23/09 7:59:29 PM
NAME ________________________________________ DATE _____________ PERIOD _____
Pdf Crx
Chapter 8 5 Course 3
Cop
yrig
ht ©
Gle
ncoe
/McG
raw
-Hill
, a d
ivis
ion
of T
he M
cGra
w-H
ill C
ompa
nies
, Inc
.
Practice
Are You ReadyAre You Readyfor Chapter 8?for Chapter 8?
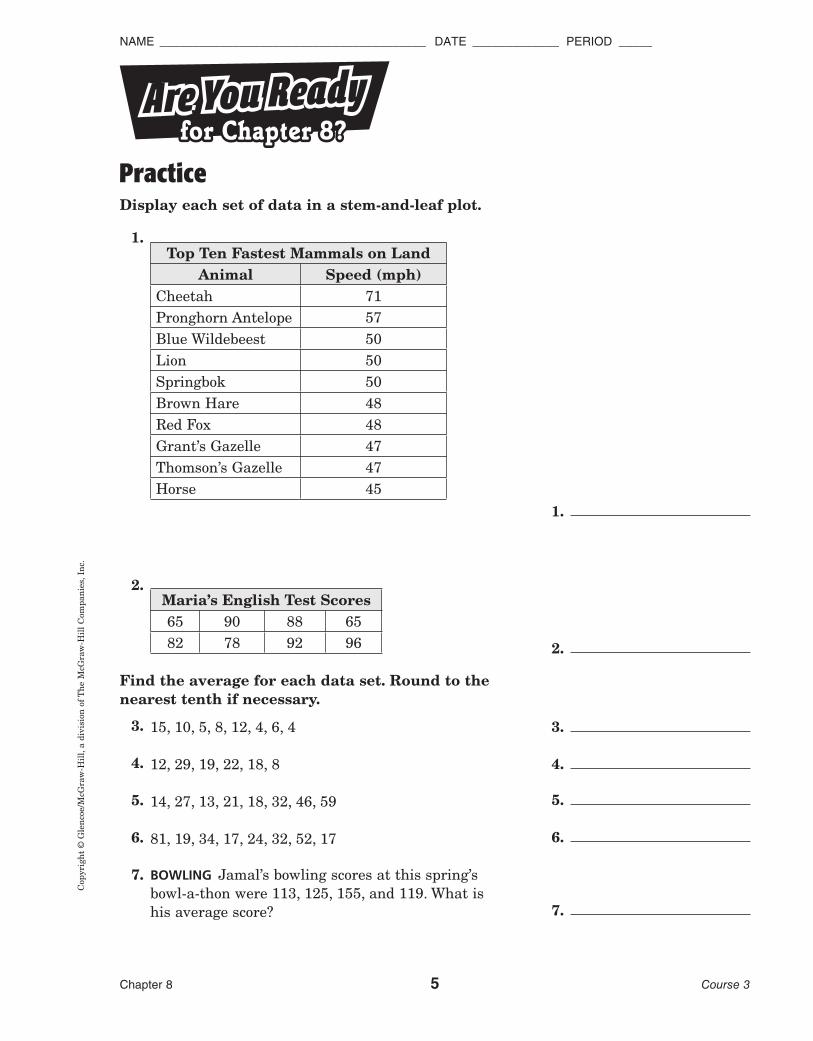
Display each set of data in a stem-and-leaf plot.
1.Top Ten Fastest Mammals on Land
Animal Speed (mph)Cheetah 71Pronghorn Antelope 57Blue Wildebeest 50Lion 50Springbok 50Brown Hare 48Red Fox 48Grant’s Gazelle 47Thomson’s Gazelle 47Horse 45
2.Maria’s English Test Scores65 90 88 6582 78 92 96
Find the average for each data set. Round to the nearest tenth if necessary.
3. 15, 10, 5, 8, 12, 4, 6, 4
4. 12, 29, 19, 22, 18, 8
5. 14, 27, 13, 21, 18, 32, 46, 59
6. 81, 19, 34, 17, 24, 32, 52, 17
7. BOWLING Jamal’s bowling scores at this spring’s bowl-a-thon were 113, 125, 155, and 119. What is his average score?
1.
2.
3.
4.
5.
6.
7.
001_011_FLCRMC3C08_892307.indd 5001_011_FLCRMC3C08_892307.indd 5 1/23/09 8:03:41 AM1/23/09 8:03:41 AM
NAME ________________________________________ DATE _____________ PERIOD _____
Pdf Crx
Chapter 8 6 Course 3
Copyright ©
Glencoe/M
cGraw
-Hill, a division of T
he McG
raw-H
ill Com
panies, Inc.
Review
Are You ReadyAre You Readyfor Chapter 8?for Chapter 8?
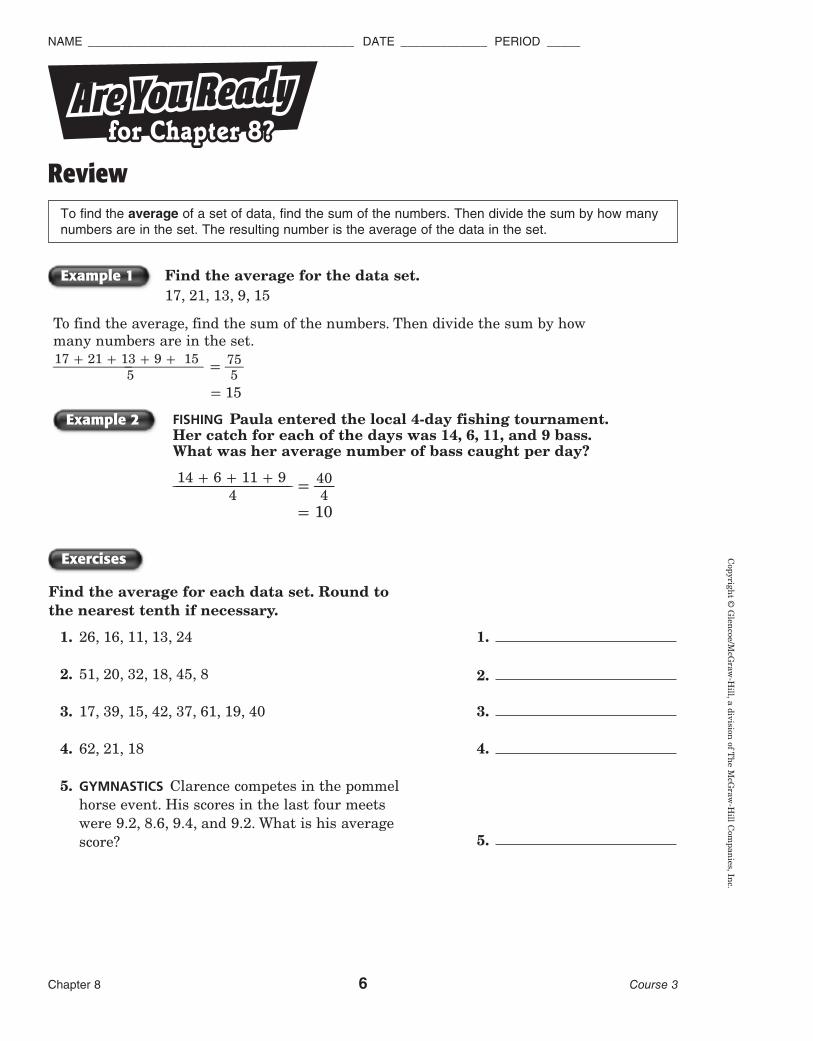
Find the average for each data set. Round to the nearest tenth if necessary.
1. 26, 16, 11, 13, 24
2. 51, 20, 32, 18, 45, 8
3. 17, 39, 15, 42, 37, 61, 19, 40
4. 62, 21, 18
5. GYMNASTICS Clarence competes in the pommel horse event. His scores in the last four meets were 9.2, 8.6, 9.4, and 9.2. What is his average score?
1.
2.
3.
4.
5.
Find the average for the data set.17, 21, 13, 9, 15
To find the average, find the sum of the numbers. Then divide the sum by how many numbers are in the set.
17 + 21 + 13 + 9 + 15 −− 5
= 75 − 5
= 15
Example 2 FISHING Paula entered the local 4-day fishing tournament. Her catch for each of the days was 14, 6, 11, and 9 bass. What was her average number of bass caught per day?
14 + 6 + 11 + 9 − 4 = 40 −
4
= 10
Example 1
To find the average of a set of data, find the sum of the numbers. Then divide the sum by how many numbers are in the set. The resulting number is the average of the data in the set.
Exercises
001_011_FLCRMC3C08_892307.indd 6001_011_FLCRMC3C08_892307.indd 6 1/23/09 4:26:18 PM1/23/09 4:26:18 PM

NAME ________________________________________ DATE _____________ PERIOD _____
PDF Pass
Chapter 8 7 Course 3
Cop
yrig
ht ©
Gle
ncoe
/McG
raw
-Hill
, a d
ivis
ion
of T
he M
cGra
w-H
ill C
ompa
nies
, Inc
.
Apply
Are You ReadyAre You Readyfor Chapter 8?for Chapter 8?
1. GOLF Sky is a member of her school’s golf team. The table shows her scores from each of her matches. What was her average golf score?
Sky’s Golf Scores72 69 7271 71 6968 72 68
2. AUTUMN Karly owns a lawn service. During the month of October she averaged 42 customers the first week, 38 the second week, 55 the third week, and 65 the fourth week. How many customers did she average per week?
3. SALES The number of bags of popcorn sold at a certain movie theater for several days was 27, 17, 24, 38, 47, and 21. Find the average number of bags of popcorn sold during these days.
4. CUSTOMERS Big Mart keeps track of the number of customers entering the store in the first hour of each day. In the first four days of April, Big Mart had 215, 125, 118, and 214 customers in the first hour. Find the average number of customers Big Mart had in the first hour during those four days.
5. KENNELS Betsy trains dogs. The table shows how many dogs she trained during the first six months this year. Display the data in a stem-and-leaf plot.
Number of Dogs Trained
21 11 1823 30 15
6. CHOIR Timmy belongs to the municipal choir in his home town. The table below shows the age of each member of the choir. Display the data in a stem-and-leaf plot.
Choir Member Ages18 25 28 33 35 4224 19 35 47 35 44
001_011_FLCRMC3C08_892307.indd 7001_011_FLCRMC3C08_892307.indd 7 7/25/09 11:16:58 AM7/25/09 11:16:58 AM

NAME ________________________________________ DATE _____________ PERIOD _____
PDF pass
Chapter 8 8 Course 3
Copyright ©
Glencoe/M
cGraw
-Hill, a division of T
he McG
raw-H
ill Com
panies, Inc.8
Chapter
Diagnostic Test
Display each set of data in a stem-and-leaf plot.
1. Monthly Mean Temperatures in
Pensacola, Florida51 54 54 6061 68 68 7578 80 82 82
2. Number of Canaries
Raised42 33 4145 30 29
Find the average for each data set. Round to the nearest tenth if necessary.
3. 29, 45, 31, 15
4. 82, 75, 19, 11, 23, 18
5. 14, 27, 11, 19, 31, 19, 25, 6
6. 52, 31, 23, 12, 8, 14
7. 88, 27, 15, 63, 12, 9, 32, 15
8. 34, 40, 31, 49, 32, 56, 51
9. TOURISTS Clarine owns a sight-seeing boat in Florida. In each of the last five weeks she had 42, 59, 67, 51, and 91 customers. How many customers did she average per week?
1.
2.
3.
4.
5.
6.
7.
8.
9.
001_011_FLCRMC3C08_892307.indd 8001_011_FLCRMC3C08_892307.indd 8 12/30/08 8:15:26 PM12/30/08 8:15:26 PM
NAME ________________________________________ DATE _____________ PERIOD _____
Pdf Crx
Chapter 8 9 Course 3
Cop
yrig
ht ©
Gle
ncoe
/McG
raw
-Hill
, a d
ivis
ion
of T
he M
cGra
w-H
ill C
ompa
nies
, Inc
.8
Chapter
Pretest
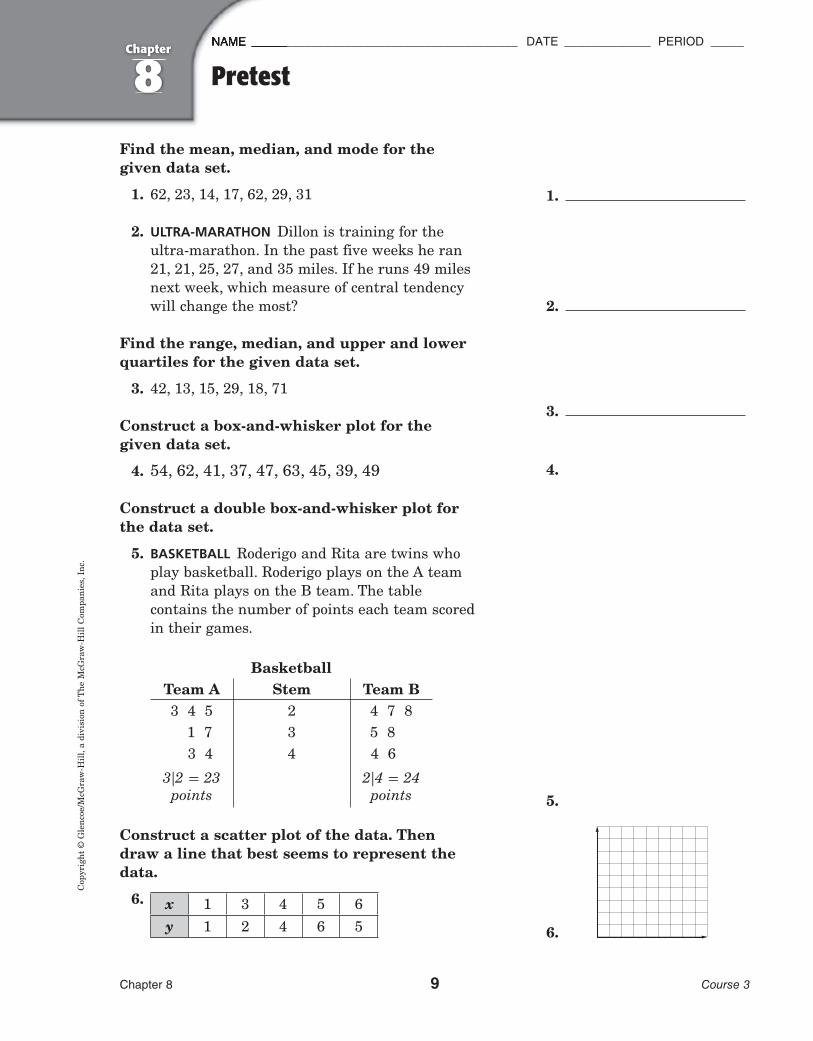
Find the mean, median, and mode for the given data set.
1. 62, 23, 14, 17, 62, 29, 31
2. ULTRA-MARATHON Dillon is training for the ultra-marathon. In the past five weeks he ran 21, 21, 25, 27, and 35 miles. If he runs 49 miles next week, which measure of central tendency will change the most?
Find the range, median, and upper and lower quartiles for the given data set.
3. 42, 13, 15, 29, 18, 71
Construct a box-and-whisker plot for the given data set.
4. 54, 62, 41, 37, 47, 63, 45, 39, 49
Construct a double box-and-whisker plot for the data set.
5. BASKETBALL Roderigo and Rita are twins who play basketball. Roderigo plays on the A team and Rita plays on the B team. The table contains the number of points each team scored in their games.
BasketballTeam A Stem Team B3 4 5 2 4 7 8
1 7 3 5 83 4 4 4 6
3!2 = 23 points
2!4 = 24 points
Construct a scatter plot of the data. Then draw a line that best seems to represent the data.
6. x 1 3 4 5 6y 1 2 4 6 5
1.
2.
3.
4.
5.
6.
001_011_FLCRMC3C08_892307.indd 9001_011_FLCRMC3C08_892307.indd 9 1/23/09 8:01:52 PM1/23/09 8:01:52 PM

NAME ________________________________________ DATE _____________ PERIOD _____
PDF pass
Chapter 8 10 Course 3
Copyright ©
Glencoe/M
cGraw
-Hill, a division of T
he McG
raw-H
ill Com
panies, Inc.Student Glossary8
Chapter
This is an alphabetical list of new vocabulary terms you will learn in Chapter 8. Fold the page vertically and use it as a bookmark. As you study the chapter, write each term’s definition or description in as few words as possible.
Vocabulary Word Definition/Description/Example
interquartile range
line of best fit
lower quartile
mean
median
mode
outlier
quartiles
range
upper quartile
Fold over
001_011_FLCRMC3C08_892307.indd 10001_011_FLCRMC3C08_892307.indd 10 12/30/08 8:15:34 PM12/30/08 8:15:34 PM
NAME ________________________________________ DATE _____________ PERIOD _____
PDF pass
Chapter 8 11 Course 3
Cop
yrig
ht ©
Gle
ncoe
/McG
raw
-Hill
, a d
ivis
ion
of T
he M
cGra
w-H
ill C
ompa
nies
, Inc
.Facts Practice8
Chapter
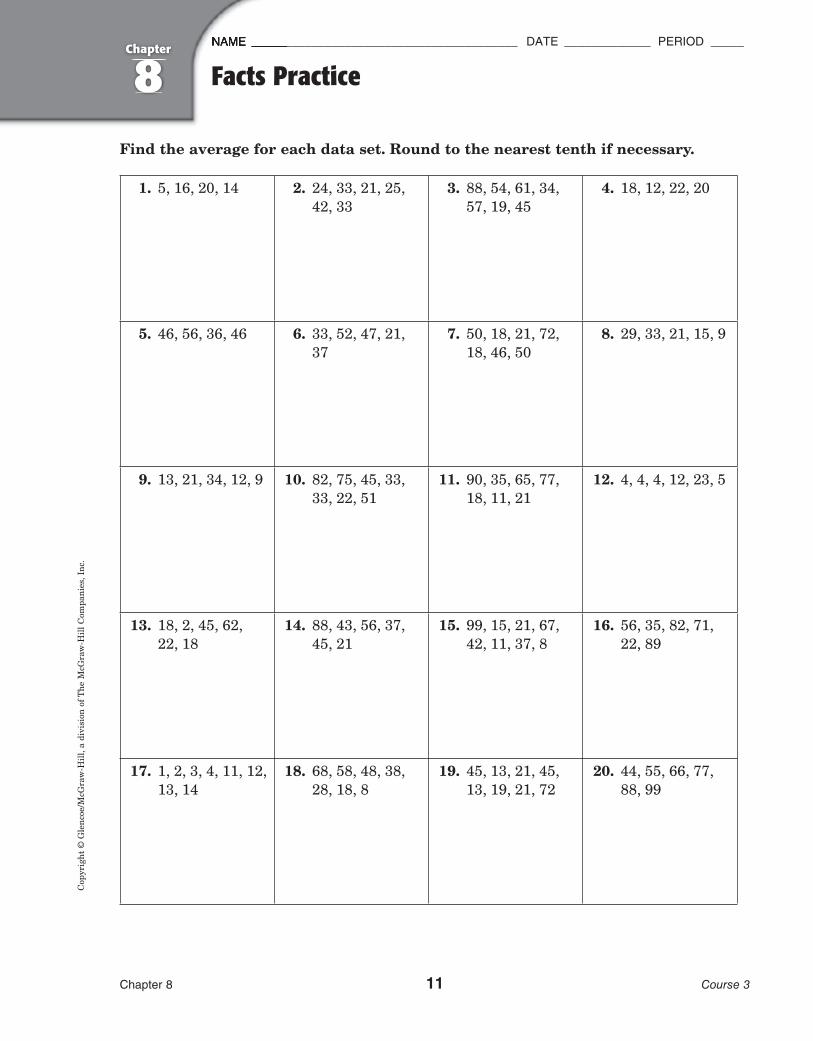
Find the average for each data set. Round to the nearest tenth if necessary.
1. 5, 16, 20, 14 2. 24, 33, 21, 25, 42, 33
3. 88, 54, 61, 34, 57, 19, 45
4. 18, 12, 22, 20
5. 46, 56, 36, 46 6. 33, 52, 47, 21, 37
7. 50, 18, 21, 72, 18, 46, 50
8. 29, 33, 21, 15, 9
9. 13, 21, 34, 12, 9 10. 82, 75, 45, 33, 33, 22, 51
11. 90, 35, 65, 77, 18, 11, 21
12. 4, 4, 4, 12, 23, 5
13. 18, 2, 45, 62, 22, 18
14. 88, 43, 56, 37, 45, 21
15. 99, 15, 21, 67, 42, 11, 37, 8
16. 56, 35, 82, 71, 22, 89
17. 1, 2, 3, 4, 11, 12, 13, 14
18. 68, 58, 48, 38, 28, 18, 8
19. 45, 13, 21, 45, 13, 19, 21, 72
20. 44, 55, 66, 77, 88, 99
001_011_FLCRMC3C08_892307.indd 11001_011_FLCRMC3C08_892307.indd 11 12/30/08 8:15:36 PM12/30/08 8:15:36 PM

PDF pass012_023_FLCRMC3C08_892307.indd 12012_023_FLCRMC3C08_892307.indd 12 12/30/08 8:13:37 PM12/30/08 8:13:37 PM
NAME ________________________________________ DATE _____________ PERIOD _____
Pdf Crx
Cop
yrig
ht ©
Gle
ncoe
/McG
raw
-Hill
, a d
ivis
ion
of T
he M
cGra
w-H
ill C
ompa
nies
, Inc
.8-1
Chapter 8 13 Course 3
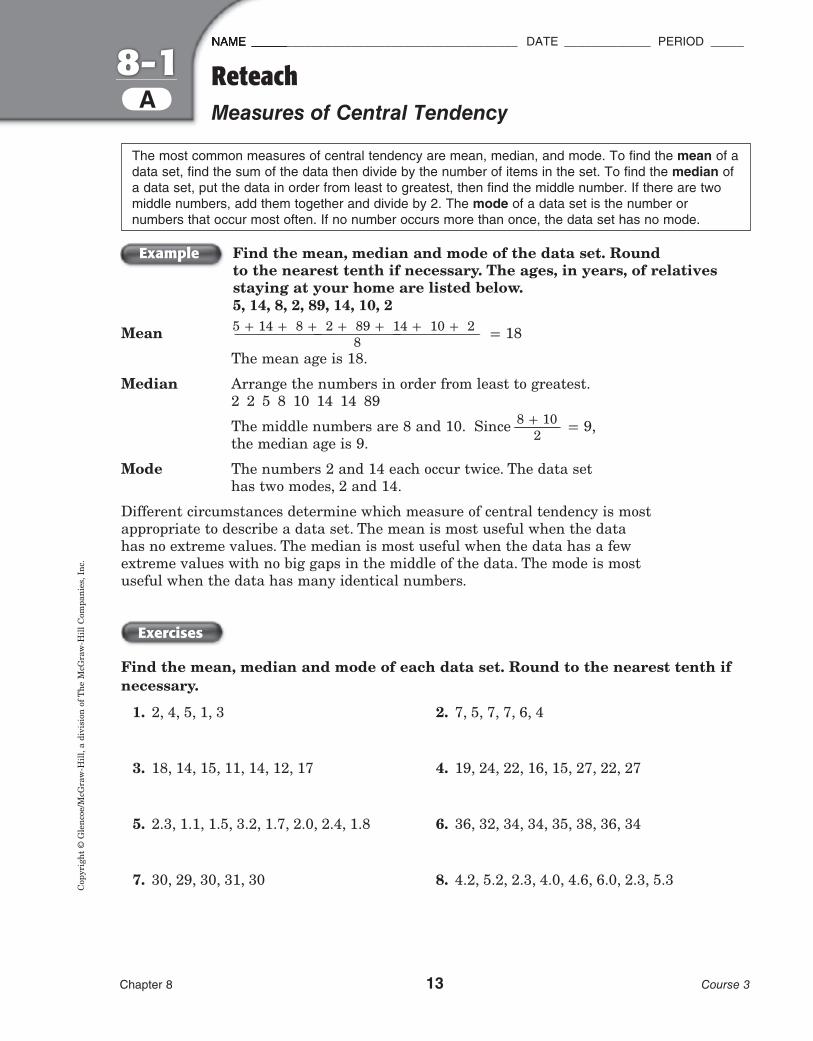
Find the mean, median and mode of the data set. Round to the nearest tenth if necessary. The ages, in years, of relatives staying at your home are listed below.5, 14, 8, 2, 89, 14, 10, 2
Mean 5 + 14 + 8 + 2 + 89 + 14 + 10 + 2 −−− 8 = 18
The mean age is 18.
Median Arrange the numbers in order from least to greatest. 2 2 5 8 10 14 14 89
The middle numbers are 8 and 10. Since 8 + 10 − 2 = 9,
the median age is 9.
Mode The numbers 2 and 14 each occur twice. The data set has two modes, 2 and 14.
Different circumstances determine which measure of central tendency is most appropriate to describe a data set. The mean is most useful when the data has no extreme values. The median is most useful when the data has a few extreme values with no big gaps in the middle of the data. The mode is most useful when the data has many identical numbers.
Exercises
Find the mean, median and mode of each data set. Round to the nearest tenth if necessary.
1. 2, 4, 5, 1, 3 2. 7, 5, 7, 7, 6, 4
3. 18, 14, 15, 11, 14, 12, 17 4. 19, 24, 22, 16, 15, 27, 22, 27
5. 2.3, 1.1, 1.5, 3.2, 1.7, 2.0, 2.4, 1.8 6. 36, 32, 34, 34, 35, 38, 36, 34
7. 30, 29, 30, 31, 30 8. 4.2, 5.2, 2.3, 4.0, 4.6, 6.0, 2.3, 5.3
The most common measures of central tendency are mean, median, and mode. To find the mean of a data set, find the sum of the data then divide by the number of items in the set. To find the median of a data set, put the data in order from least to greatest, then find the middle number. If there are two middle numbers, add them together and divide by 2. The mode of a data set is the number or numbers that occur most often. If no number occurs more than once, the data set has no mode.
ReteachMeasures of Central Tendency
Example
A
012_023_FLCRMC3C08_892307.indd 13012_023_FLCRMC3C08_892307.indd 13 1/23/09 7:56:24 AM1/23/09 7:56:24 AM
NAME ________________________________________ DATE _____________ PERIOD _____
PDF pass
Copyright ©
Glencoe/M
cGraw
-Hill, a division of T
he McG
raw-H
ill Com
panies, Inc.8-1
Chapter 8 14 Course 3
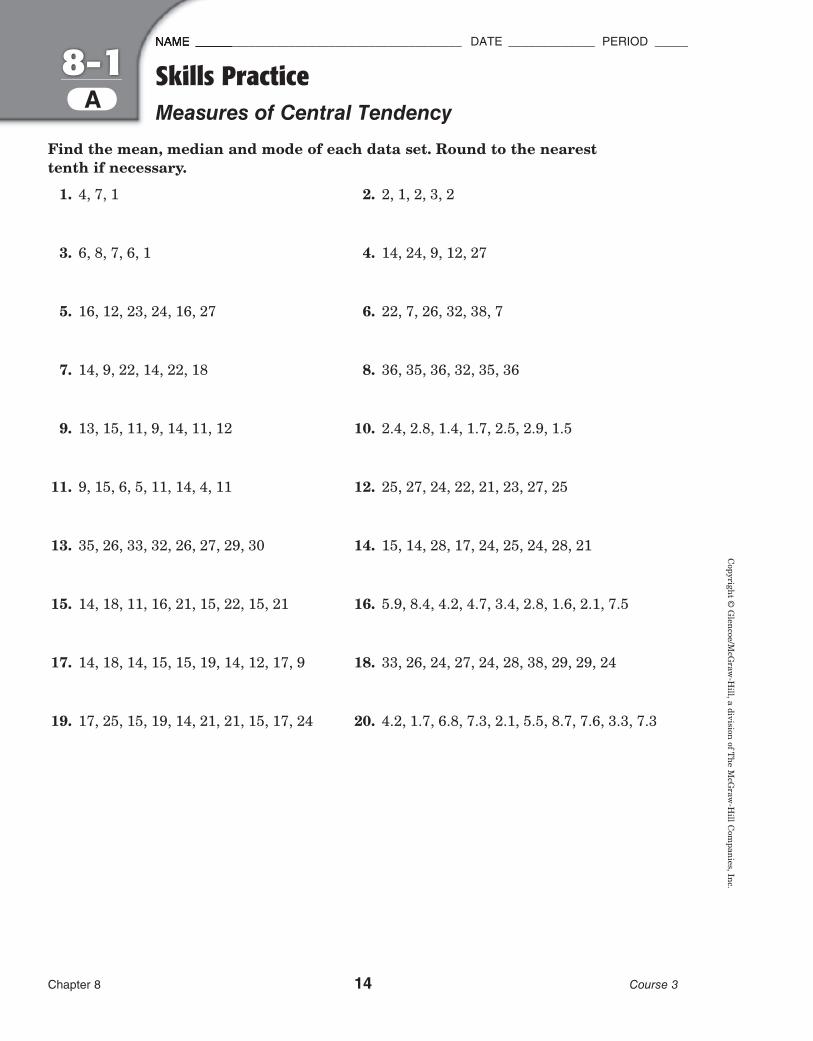
Find the mean, median and mode of each data set. Round to the nearest tenth if necessary.
1. 4, 7, 1 2. 2, 1, 2, 3, 2
3. 6, 8, 7, 6, 1 4. 14, 24, 9, 12, 27
5. 16, 12, 23, 24, 16, 27 6. 22, 7, 26, 32, 38, 7
7. 14, 9, 22, 14, 22, 18 8. 36, 35, 36, 32, 35, 36
9. 13, 15, 11, 9, 14, 11, 12 10. 2.4, 2.8, 1.4, 1.7, 2.5, 2.9, 1.5
11. 9, 15, 6, 5, 11, 14, 4, 11 12. 25, 27, 24, 22, 21, 23, 27, 25
13. 35, 26, 33, 32, 26, 27, 29, 30 14. 15, 14, 28, 17, 24, 25, 24, 28, 21
15. 14, 18, 11, 16, 21, 15, 22, 15, 21 16. 5.9, 8.4, 4.2, 4.7, 3.4, 2.8, 1.6, 2.1, 7.5
17. 14, 18, 14, 15, 15, 19, 14, 12, 17, 9 18. 33, 26, 24, 27, 24, 28, 38, 29, 29, 24
19. 17, 25, 15, 19, 14, 21, 21, 15, 17, 24 20. 4.2, 1.7, 6.8, 7.3, 2.1, 5.5, 8.7, 7.6, 3.3, 7.3
Skills PracticeMeasures of Central TendencyA
012_023_FLCRMC3C08_892307.indd 14012_023_FLCRMC3C08_892307.indd 14 12/30/08 8:13:41 PM12/30/08 8:13:41 PM
NAME ________________________________________ DATE _____________ PERIOD _____
PDF pass
Cop
yrig
ht ©
Gle
ncoe
/McG
raw
-Hill
, a d
ivis
ion
of T
he M
cGra
w-H
ill C
ompa
nies
, Inc
.8-1
Chapter 8 15 Course 3
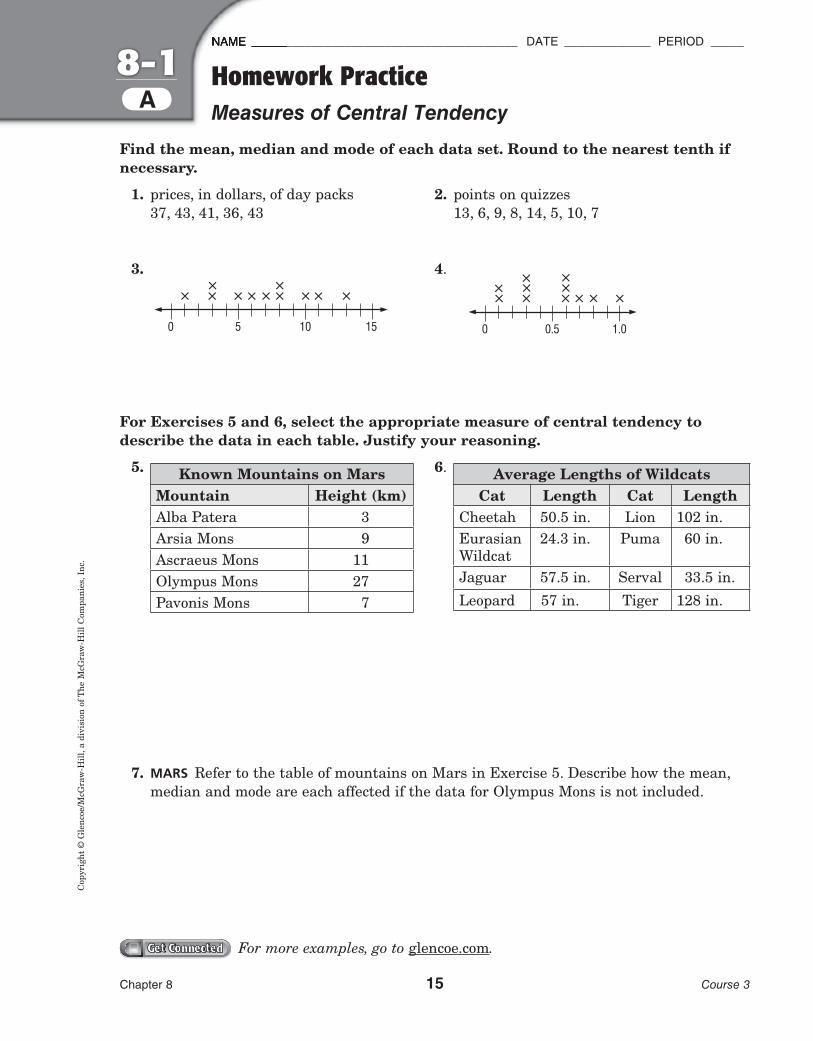
Find the mean, median and mode of each data set. Round to the nearest tenth if necessary.
1. prices, in dollars, of day packs 2. points on quizzes 37, 43, 41, 36, 43 13, 6, 9, 8, 14, 5, 10, 7
3.
0 5 10 15
� �� � � � � � � � �
4.
0 0.5 1.0
�� ��
� �
�
� � � �
For Exercises 5 and 6, select the appropriate measure of central tendency to describe the data in each table. Justify your reasoning.
5. Known Mountains on MarsMountain Height (km)Alba Patera 3Arsia Mons 9Ascraeus Mons 11Olympus Mons 27Pavonis Mons 7
6. Average Lengths of WildcatsCat Length Cat Length
Cheetah 50.5 in. Lion 102 in.Eurasian Wildcat
24.3 in. Puma 60 in.
Jaguar 57.5 in. Serval 33.5 in.Leopard 57 in. Tiger 128 in.
7. MARS Refer to the table of mountains on Mars in Exercise 5. Describe how the mean, median and mode are each affected if the data for Olympus Mons is not included.
Homework PracticeMeasures of Central Tendency
Get ConnectedGet Connected For more examples, go to glencoe.com.
A
012_023_FLCRMC3C08_892307.indd 15012_023_FLCRMC3C08_892307.indd 15 12/30/08 8:13:43 PM12/30/08 8:13:43 PM

NAME ________________________________________ DATE _____________ PERIOD _____
PDF Pass
Copyright ©
Glencoe/M
cGraw
-Hill, a division of T
he McG
raw-H
ill Com
panies, Inc.8-1
Chapter 8 16 Course 3
ANIMALS For Exercises 1–4, use the FOOTBALL For Exercises 5 and 6, information in the table below that use the information in the table shows the lifespan of selected mammals. below. Round to the nearest tenth Round to the nearest tenth if necessary. if necessary.
Average Lifespan for MammalsMammal Average Lifespan (years)
Baboon 20Camel 12Chimpanzee 20Cow 15Goat 8Gorilla 20Moose 12Pig 10
2007 NFL Season
Team Games WonAtlanta 4Carolina 7Denver 7Kansas City 4New Orleans 7Oakland 4St. Louis 3San Diego 11San Francisco 5Seattle 10
1. Explain how to find the mean of the lifespans listed in the table. Then find the mean.
2. Explain how to find the median of the set of data. Then find the median.
3. Explain how to find the mode of the set of data. Then find the mode.
4. Which measure of central tendency is most representative of the data? Explain.
5. What are the mean, median and mode of the number of games won by the teams in the table?
6. Which measure of central tendency is most representative of the data? Explain.
Problem-Solving PracticeMeasures of Central TendencyA
012_023_FLCRMC3C08_892307.indd 16012_023_FLCRMC3C08_892307.indd 16 7/25/09 11:06:00 AM7/25/09 11:06:00 AM

NAME ________________________________________ DATE _____________ PERIOD _____
PDF pass
Cop
yrig
ht ©
Gle
ncoe
/McG
raw
-Hill
, a d
ivis
ion
of T
he M
cGra
w-H
ill C
ompa
nies
, Inc
.8-1
Chapter 8 17 Course 3
Median and Mean of Grouped DataTo find the median, add a column for the cumulativefrequency. This is the total of the frequencies up to and including the frequency in a given row.
The last number in the cumulative frequency column will equal the number of data items. In this example, there are 75 data items. So, the median will be the 38th item. The median age is in the interval 30–39.
To find the mean, multiply the frequency of each interval by the midpoint of the interval. Then, divide by the total number of data items.
(20 × 14.5) + (17 × 24.5) + (23 × 34.5) + (15 × 44.5)
−−− 75
= 28.9
Find the interval for the median and the mean to the nearest tenth.
1. Add this data to the chart in the example: ages 50–59, 11 people; ages 60–69, 16 people; ages 70–79, 19 people; ages 80–89, 4 people.
2. People Who Prefer “All Talk” Radio Age 10–19 20–29 30–39 40–49 50–59 60–69 70–79 80–89
Frequency 4 10 14 5 6 5 4 2
3. People who Listen to Radio While 4. People who Listen to Radio Doing Homework While Driving to Work
0 2 4 6 810–1920–2930–3940–4950–5960–6970–7980–89
Frequency (Number of People)
Age
0 4 810–1920–2930–3940–4950–5960–6970–7980–89
Frequency (Number of People)
Age
16 2012
People Responding to Radio Station Survey
Ages Frequency Cumulative Frequency
10–19 20 2020–29 17 3730–39 23 6040–49 15 75
EnrichA
012_023_FLCRMC3C08_892307.indd 17012_023_FLCRMC3C08_892307.indd 17 12/30/08 8:13:49 PM12/30/08 8:13:49 PM
NAME ________________________________________ DATE _____________ PERIOD _____
Pdf Crx
Copyright ©
Glencoe/M
cGraw
-Hill, a division of T
he McG
raw-H
ill Com
panies, Inc.8-1
Chapter 8 18 Course 3
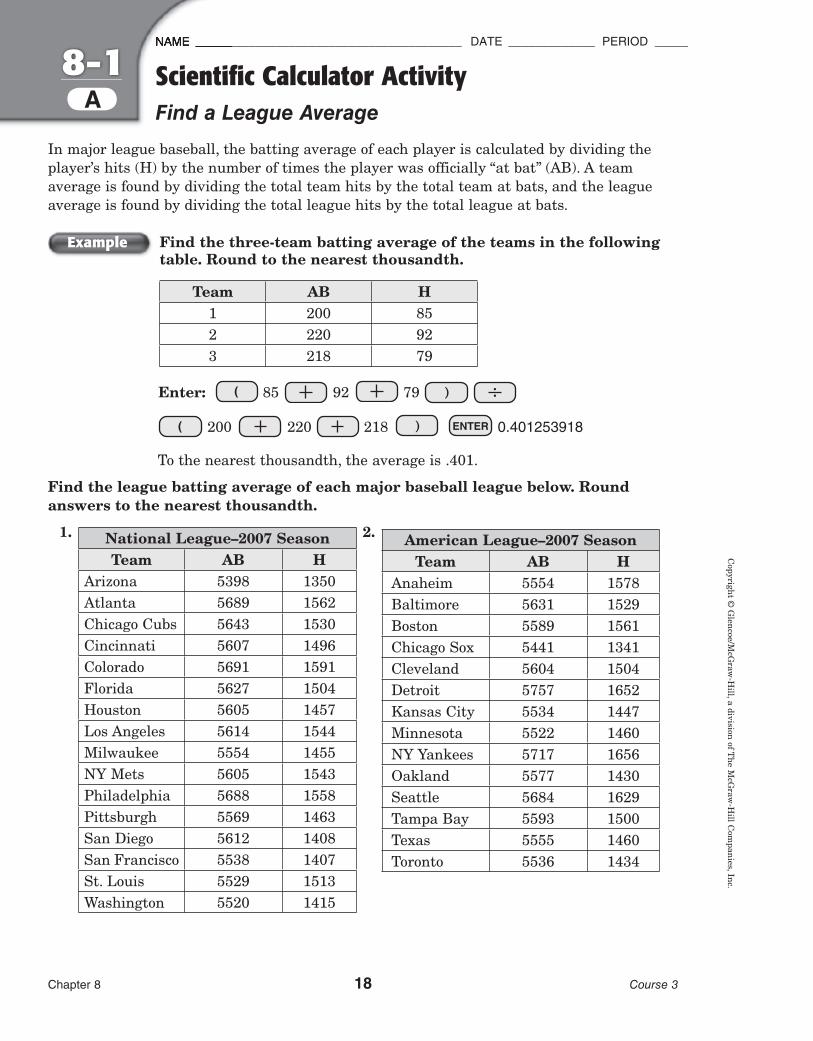
In major league baseball, the batting average of each player is calculated by dividing the player’s hits (H) by the number of times the player was officially “at bat” (AB). A team average is found by dividing the total team hits by the total team at bats, and the league average is found by dividing the total league hits by the total league at bats.
Find the three-team batting average of the teams in the following table. Round to the nearest thousandth.
Team AB H1 200 852 220 923 218 79
Enter: 885 92 79 )
200 220 218 ) 0.401253918
To the nearest thousandth, the average is .401.
Find the league batting average of each major baseball league below. Round answers to the nearest thousandth.
1. National League–2007 SeasonTeam AB H
Arizona 5398 1350Atlanta 5689 1562Chicago Cubs 5643 1530Cincinnati 5607 1496Colorado 5691 1591Florida 5627 1504Houston 5605 1457Los Angeles 5614 1544Milwaukee 5554 1455NY Mets 5605 1543Philadelphia 5688 1558Pittsburgh 5569 1463San Diego 5612 1408San Francisco 5538 1407St. Louis 5529 1513Washington 5520 1415
2. American League–2007 SeasonTeam AB H
Anaheim 5554 1578Baltimore 5631 1529Boston 5589 1561Chicago Sox 5441 1341Cleveland 5604 1504Detroit 5757 1652Kansas City 5534 1447Minnesota 5522 1460NY Yankees 5717 1656Oakland 5577 1430Seattle 5684 1629Tampa Bay 5593 1500Texas 5555 1460Toronto 5536 1434
AScientific Calculator ActivityFind a League Average
Example
012_023_FLCRMC3C08_892307.indd 18012_023_FLCRMC3C08_892307.indd 18 1/23/09 8:04:52 PM1/23/09 8:04:52 PM

NAME ________________________________________ DATE _____________ PERIOD _____
PDF pass
Cop
yrig
ht ©
Gle
ncoe
/McG
raw
-Hill
, a d
ivis
ion
of T
he M
cGra
w-H
ill C
ompa
nies
, Inc
.8-1
Chapter 8 19 Course 3
CReteachChanges in Data
LONG JUMP At the track meet Zazie participated in the long jump event. Her five best jumps were 10 feet, 9 feet, 10 feet, 15 feet, and 11 feet. Describe how the mean, median, and mode will change if she drops her shortest distance jumped.
Calculate each measure with and without the shortest distance jumped.
including the shortest jump without the shortest jump
Mean 10 + 9 + 10 + 15 + 11 −− 5 = 11 10 + 10 + 15 + 11 −−
4 = 11.5
Median 9, 10, 10, 11, 15 10, 10, 11, 15
10 10.5
Mode 10 10
If Zazie’s shortest distance is dropped, both the mean and the median will increase by 0.5. The mode remains the same.
BOARD GAME The table shows the number of points Margot earned while playing a board game six different times. Which measure of central tendency will change the most if her highest point total is eliminated?
Calculate each measure with and without her highest point total.
including the highest without the highest point total point total
Mean 41 + 54 + 118 + 37 + 55 + 55 −− 6 = 60 41 + 54 + 37 + 55 + 55 −−
5 = 48.4
Median 37, 41, 54, 55, 55, 118 37, 41, 54, 55, 55
54.5 54
Mode 55 55
When the highest point total is eliminated, the mean changes the most.
Exercises
1. YARD WORK Jane did yard work for five of her neighbors last week. The number of hours she worked for each is 2, 4, 3.5, 4, and 8. Which measure of central tendency will change the most if she had worked 1.5 hours instead of 8 hours on that one day?
2. VETERINARIAN The dogs Dr. Michele examined weighed 55, 62, 4, 40, and 40 pounds. Describe how the mean, median, and mode will change if the 4-pound dog’s weight is not included.
Example 1
Example 2 Points Earned41 54
118 3755 55
012_023_FLCRMC3C08_892307.indd 19012_023_FLCRMC3C08_892307.indd 19 12/30/08 8:14:02 PM12/30/08 8:14:02 PM

NAME ________________________________________ DATE _____________ PERIOD _____
PDF pass
Copyright ©
Glencoe/M
cGraw
-Hill, a division of T
he McG
raw-H
ill Com
panies, Inc.8-1
Chapter 8 20 Course 3
CSkills PracticeChanges in Data
1. POLITICS Mr. Mack, a candidate for city clerk, tabulated the results of a survey about his candidacy. The results are in the table to the right. Which measure of central tendency will change the most if his highest rating is removed?
2. DRIVING Niles drove 35 miles on Monday, 75 miles on Tuesday, 57 miles on Wednesday, 43 miles on Thursday, and 65 miles on Friday. Describe how the mean, median, and mode will change if Niles drives 85 miles on Saturday.
3. FUND RAISING Marge’s softball team is selling candy bars as a fundraiser. The table to the right shows the number of candy bars sold during each game. If they sell 12 candy bars during game 6, which measure of central tendency will change the most?
4. READING The local library is sponsoring a summer reading program. The line plot below shows how many students read a given number of books over the summer. Describe how the mean, median, and mode will change if the two people each reading 8 books did not participate in the program.
Rating Numberof People
10 18 06 54 32 1
GameNumber
Number ofCandy Bars Sold
1 482 543 624 565 60
1 2 3 4 5 6 7 8 9 10
× × × ×× ×
×× ××
× = one student
012_023_FLCRMC3C08_892307.indd 20012_023_FLCRMC3C08_892307.indd 20 12/30/08 8:14:05 PM12/30/08 8:14:05 PM
NAME ________________________________________ DATE _____________ PERIOD _____
PDF Pass
Cop
yrig
ht ©
Gle
ncoe
/McG
raw
-Hill
, a d
ivis
ion
of T
he M
cGra
w-H
ill C
ompa
nies
, Inc
.8-1
Chapter 8 21 Course 3
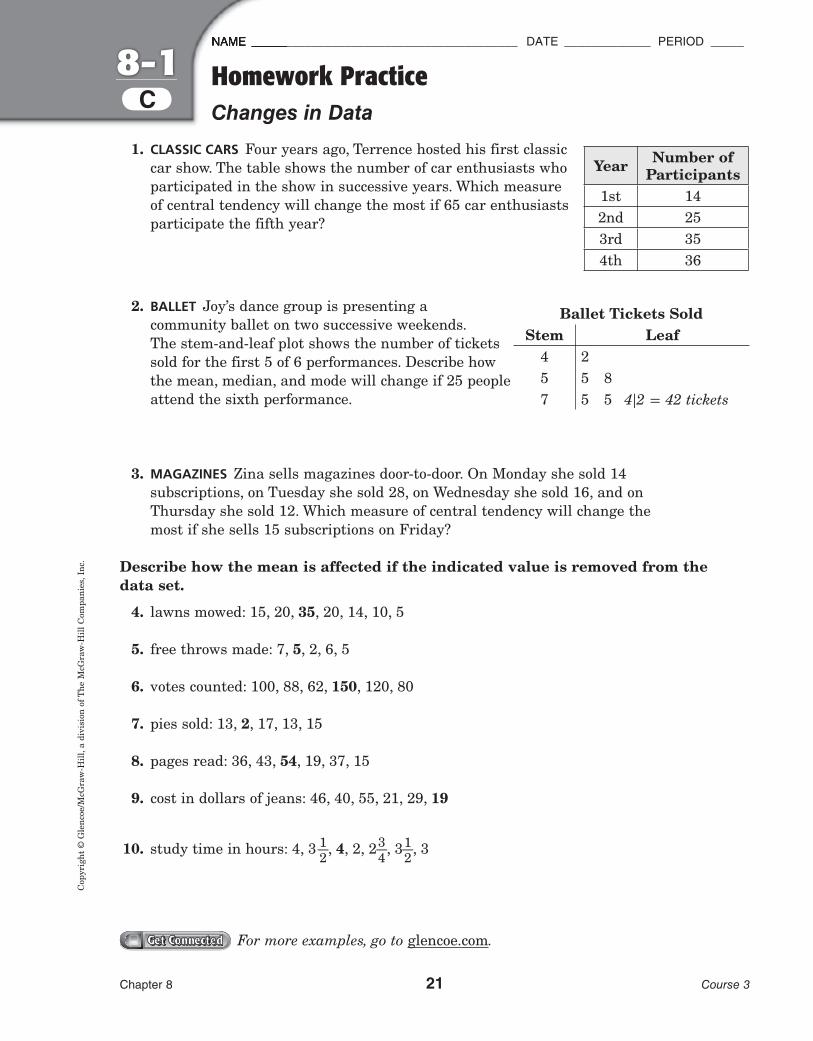
CHomework PracticeChanges in Data
Ballet Tickets SoldStem Leaf
4 25 5 87 5 5 4|2 = 42 tickets
1. CLASSIC CARS Four years ago, Terrence hosted his first classic car show. The table shows the number of car enthusiasts who participated in the show in successive years. Which measure of central tendency will change the most if 65 car enthusiasts participate the fifth year?
2. BALLET Joy’s dance group is presenting a community ballet on two successive weekends. The stem-and-leaf plot shows the number of tickets sold for the first 5 of 6 performances. Describe how the mean, median, and mode will change if 25 people attend the sixth performance.
3. MAGAZINES Zina sells magazines door-to-door. On Monday she sold 14 subscriptions, on Tuesday she sold 28, on Wednesday she sold 16, and on Thursday she sold 12. Which measure of central tendency will change the most if she sells 15 subscriptions on Friday?
Describe how the mean is affected if the indicated value is removed from the data set.
4. lawns mowed: 15, 20, 35, 20, 14, 10, 5
5. free throws made: 7, 5, 2, 6, 5
6. votes counted: 100, 88, 62, 150, 120, 80
7. pies sold: 13, 2, 17, 13, 15
8. pages read: 36, 43, 54, 19, 37, 15
9. cost in dollars of jeans: 46, 40, 55, 21, 29, 19
10. study time in hours: 4, 3 1 − 2 , 4, 2, 2 3 −
4 , 3 1 −
2 , 3
Year Number ofParticipants
1st 142nd 253rd 354th 36
Get ConnectedGet Connected For more examples, go to glencoe.com.
012_023_FLCRMC3C08_892307.indd 21012_023_FLCRMC3C08_892307.indd 21 7/25/09 11:05:43 AM7/25/09 11:05:43 AM
NAME ________________________________________ DATE _____________ PERIOD _____
PDF pass
Copyright ©
Glencoe/M
cGraw
-Hill, a division of T
he McG
raw-H
ill Com
panies, Inc.8-1
Chapter 8 22 Course 3
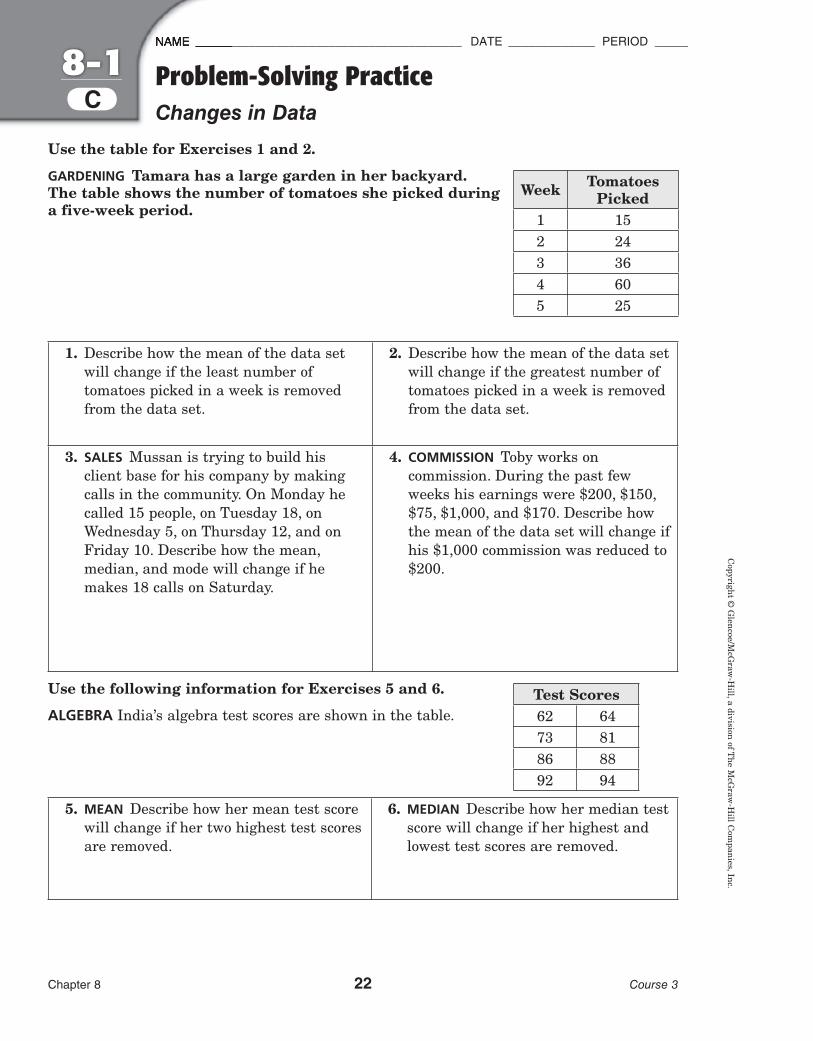
CProblem-Solving PracticeChanges in Data
Week TomatoesPicked
1 152 243 364 605 25
Test Scores62 6473 8186 8892 94
Use the table for Exercises 1 and 2.
GARDENING Tamara has a large garden in her backyard. The table shows the number of tomatoes she picked during a five-week period.
1. Describe how the mean of the data set will change if the least number of tomatoes picked in a week is removed from the data set.
2. Describe how the mean of the data set will change if the greatest number of tomatoes picked in a week is removed from the data set.
3. SALES Mussan is trying to build his client base for his company by making calls in the community. On Monday he called 15 people, on Tuesday 18, on Wednesday 5, on Thursday 12, and on Friday 10. Describe how the mean, median, and mode will change if he makes 18 calls on Saturday.
4. COMMISSION Toby works on commission. During the past few weeks his earnings were $200, $150, $75, $1,000, and $170. Describe how the mean of the data set will change if his $1,000 commission was reduced to $200.
Use the following information for Exercises 5 and 6.
ALGEBRA India’s algebra test scores are shown in the table.
5. MEAN Describe how her mean test score will change if her two highest test scores are removed.
6. MEDIAN Describe how her median test score will change if her highest and lowest test scores are removed.
012_023_FLCRMC3C08_892307.indd 22012_023_FLCRMC3C08_892307.indd 22 12/30/08 8:14:12 PM12/30/08 8:14:12 PM
NAME ________________________________________ DATE _____________ PERIOD _____
PDF pass
Cop
yrig
ht ©
Gle
ncoe
/McG
raw
-Hill
, a d
ivis
ion
of T
he M
cGra
w-H
ill C
ompa
nies
, Inc
.8-1
Chapter 8 23 Course 3
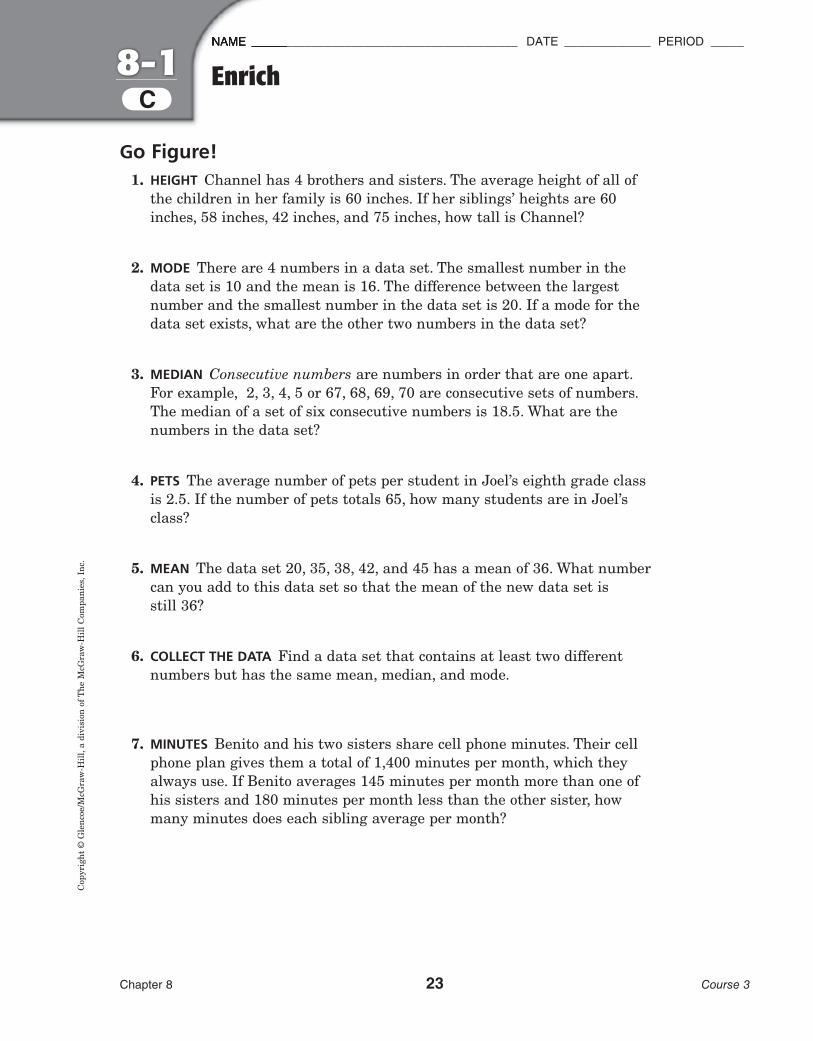
CEnrich
Go Figure! 1. HEIGHT Channel has 4 brothers and sisters. The average height of all of
the children in her family is 60 inches. If her siblings’ heights are 60 inches, 58 inches, 42 inches, and 75 inches, how tall is Channel?
2. MODE There are 4 numbers in a data set. The smallest number in the data set is 10 and the mean is 16. The difference between the largest number and the smallest number in the data set is 20. If a mode for the data set exists, what are the other two numbers in the data set?
3. MEDIAN Consecutive numbers are numbers in order that are one apart. For example, 2, 3, 4, 5 or 67, 68, 69, 70 are consecutive sets of numbers. The median of a set of six consecutive numbers is 18.5. What are the numbers in the data set?
4. PETS The average number of pets per student in Joel’s eighth grade class is 2.5. If the number of pets totals 65, how many students are in Joel’s class?
5. MEAN The data set 20, 35, 38, 42, and 45 has a mean of 36. What number can you add to this data set so that the mean of the new data set is still 36?
6. COLLECT THE DATA Find a data set that contains at least two different numbers but has the same mean, median, and mode.
7. MINUTES Benito and his two sisters share cell phone minutes. Their cell phone plan gives them a total of 1,400 minutes per month, which they always use. If Benito averages 145 minutes per month more than one of his sisters and 180 minutes per month less than the other sister, how many minutes does each sibling average per month?
012_023_FLCRMC3C08_892307.indd 23012_023_FLCRMC3C08_892307.indd 23 12/30/08 8:14:14 PM12/30/08 8:14:14 PM

NAME ________________________________________ DATE _____________ PERIOD _____
PDF pass
Copyright ©
Glencoe/M
cGraw
-Hill, a division of T
he McG
raw-H
ill Com
panies, Inc.8-2
A
Chapter 8 24 Course 3
ReteachMeasures of Variation
Find the measures of variation for the following data set.13, 20, 18, 12, 21, 2, 18, 17, 15, 10, 14
The greatest number in the data set is 21. The least number is 2. The range is 21 - 2 or 19.
To find the quartiles, arrange the numbers in order from least to greatest. 2 10 12 13 14 15 17 18 18 20 21
The median is 15. The numbers below 15 are 2, 10, 12, 13, and 14. The median of the numbers below 15 is 12, so the lower quartile is 12. The numbers above 15 are 17, 18, 18, 20, and 21. The median of the numbers above 15 is 18, so the upper quartile is 18. The interquartile range is 18 - 12 or 6.
Find any outliers for the data set given in Example 1.
The interquartile range is 18 - 12 or 6. Multiply the interquartile range by 1.5. 6 × 1.5 = 9
Any data more than 9 above the upper quartile or below the lower quartile are outliers. Find the limits of the outliers.
Subtract 9 from the lower quartile. 12 - 9 = 3Add 9 to the upper quartile. 18 + 9 = 27
The limits of the outliers are 3 and 27. The only data point outside this range is 2, so the only outlier is 2.
Exercises
Find the measures of variation and any outliers for each data set.
1. 14, 16, 18, 24, 19, 15, 13 2. 29, 27, 24, 28, 30, 51, 28
3. 57, 60, 43, 55, 46, 43, 62, 31 4. 91, 92, 88, 89, 93, 95, 65, 85, 91
5. 104, 116, 111, 108, 113, 127, 109, 122, 115, 105
In some data sets, a few of the values are much greater than or less than the rest of the data. Data that are more than 1.5 times the value of the interquartile range beyond the quartiles are called outliers.
The lower quartile or LQ is the median of the lower half of a set of data. The upper quartile or UQ is the median of the upper half of a set of data. The interquartile range is the difference between the upper quartile and the lower quartile. The range of a data set is the difference between the greatest number (maximum) and least number (minimum) in the set.
Example 1
Example 2
024_039_FLCRMC3C08_892307.indd 24024_039_FLCRMC3C08_892307.indd 24 12/30/08 8:11:06 PM12/30/08 8:11:06 PM

NAME ________________________________________ DATE _____________ PERIOD _____
PDF pass
Cop
yrig
ht ©
Gle
ncoe
/McG
raw
-Hill
, a d
ivis
ion
of T
he M
cGra
w-H
ill C
ompa
nies
, Inc
.8-2
A
Chapter 8 25 Course 3
Skills PracticeMeasures of Variation
Find the measures of variation and any outliers for each data set.
1. 15, 17, 10, 12, 19, 20, 16 2. 52, 72, 89, 21, 58, 42, 75
3. 20, 23, 18, 21, 4, 17, 15 4. 24, 37, 32, 39, 35, 42, 44, 28
5. 48, 56, 72, 47, 43, 36, 47, 14 6. 116, 107, 105, 113, 112, 123, 115, 108
7. 2.2, 2.6, 2.5, 3.6, 2.9, 2.8, 2.2, 2.4 8. 59, 72, 57, 51, 62, 77, 73, 64, 54
9. 81, 79, 88, 67, 89, 87, 85, 83, 83 10. 132, 116, 108, 113, 126, 120, 131, 112, 126
11. 6.3, 6.7, 6.2, 4.9, 6.7, 6.6, 5.3, 6.3, 6.4 12. 22, 27, 25, 11, 29, 28, 41, 26, 28, 23
13. 90, 88, 72, 85, 92, 95, 93, 86, 92, 91 14. 107, 114, 124, 108, 117, 106, 107, 109, 117, 115
15. 8.3, 8.5, 9.5, 8.7, 8.9, 8.3, 8.6, 8.8, 16. 42, 36, 58, 47, 34, 43, 54, 49, 48, 41, 388.9, 8.7
17. 8.3, 9.0, 8.1, 9.5, 8.2, 8.9, 9.4, 7.9, 18. 15, 16, 18, 9, 18, 17, 19, 19, 10, 12,8.3, 8.4, 8.0 15, 13, 16
024_039_FLCRMC3C08_892307.indd 25024_039_FLCRMC3C08_892307.indd 25 12/30/08 8:11:08 PM12/30/08 8:11:08 PM
NAME ________________________________________ DATE _____________ PERIOD _____
Pdf Crx
Copyright ©
Glencoe/M
cGraw
-Hill, a division of T
he McG
raw-H
ill Com
panies, Inc.8-2
A
Chapter 8 26 Course 3
Homework PracticeMeasures of Variation
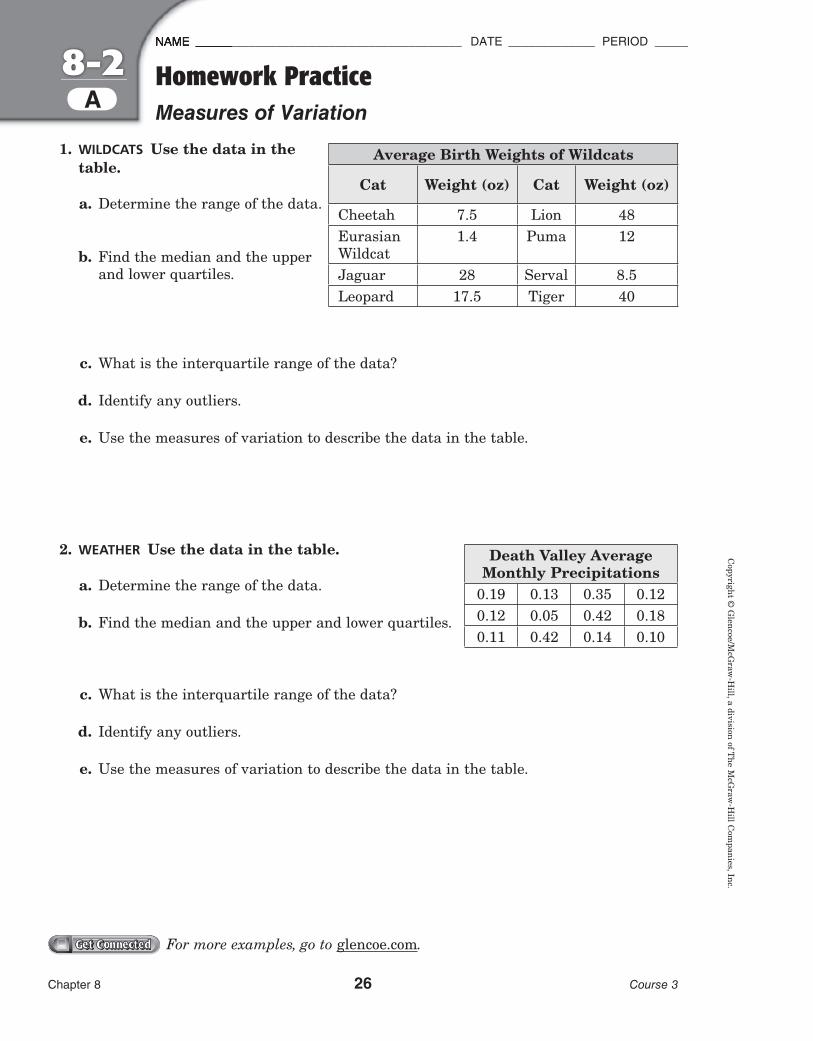
1. WILDCATS Use the data in the table.
a. Determine the range of the data.
b. Find the median and the upper and lower quartiles.
c. What is the interquartile range of the data?
d. Identify any outliers.
e. Use the measures of variation to describe the data in the table.
2. WEATHER Use the data in the table.
a. Determine the range of the data.
b. Find the median and the upper and lower quartiles.
c. What is the interquartile range of the data?
d. Identify any outliers.
e. Use the measures of variation to describe the data in the table.
Get ConnectedGet Connected For more examples, go to glencoe.com.
Average Birth Weights of Wildcats
Cat Weight (oz) Cat Weight (oz)
Cheetah 7.5 Lion 48Eurasian Wildcat
1.4 Puma 12
Jaguar 28 Serval 8.5Leopard 17.5 Tiger 40
Death Valley AverageMonthly Precipitations
0.19 0.13 0.35 0.120.12 0.05 0.42 0.180.11 0.42 0.14 0.10
024_039_FLCRMC3C08_892307.indd 26024_039_FLCRMC3C08_892307.indd 26 1/23/09 4:33:27 PM1/23/09 4:33:27 PM
NAME ________________________________________ DATE _____________ PERIOD _____
PDF Pass
Cop
yrig
ht ©
Gle
ncoe
/McG
raw
-Hill
, a d
ivis
ion
of T
he M
cGra
w-H
ill C
ompa
nies
, Inc
.8-2
A
Chapter 8 27 Course 3
Problem-Solving PracticeMeasures of Variation
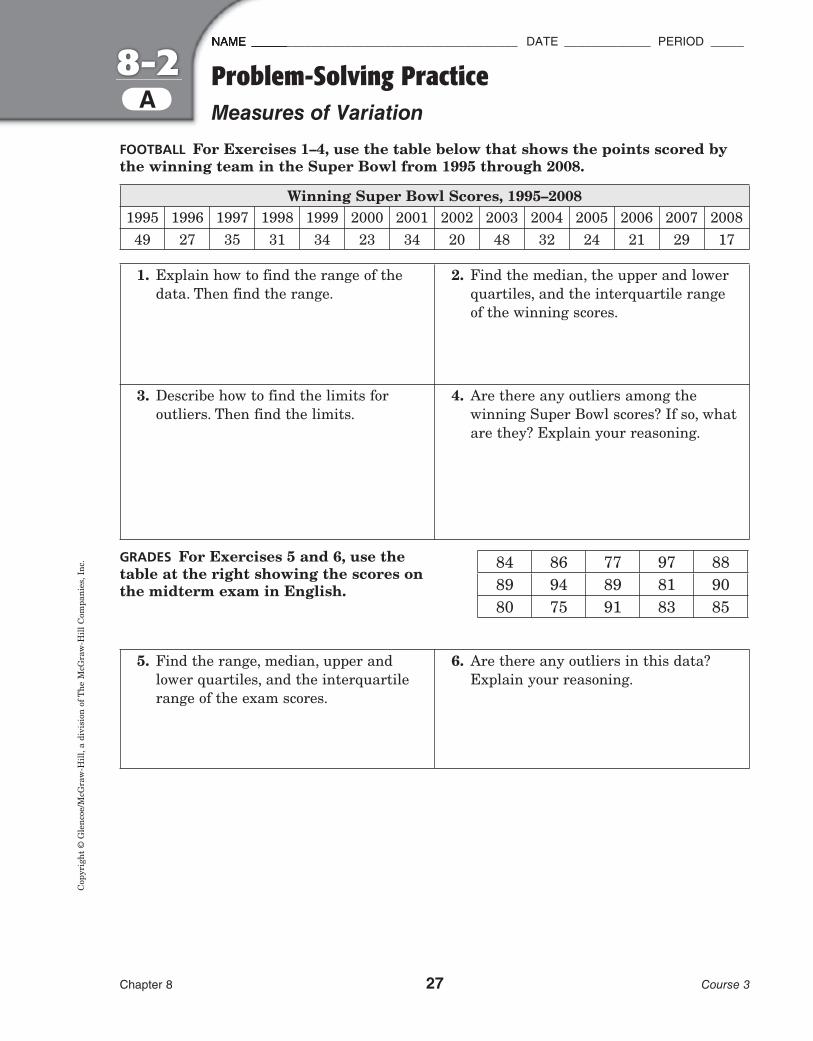
FOOTBALL For Exercises 1–4, use the table below that shows the points scored by the winning team in the Super Bowl from 1995 through 2008.
Winning Super Bowl Scores, 1995–20081995 1996 1997 1998 1999 2000 2001 2002 2003 2004 2005 2006 2007 2008
49 27 35 31 34 23 34 20 48 32 24 21 29 17
1. Explain how to find the range of the data. Then find the range.
2. Find the median, the upper and lower quartiles, and the interquartile range of the winning scores.
3. Describe how to find the limits for outliers. Then find the limits.
4. Are there any outliers among the winning Super Bowl scores? If so, what are they? Explain your reasoning.
GRADES For Exercises 5 and 6, use the table at the right showing the scores onthe midterm exam in English.
5. Find the range, median, upper and lower quartiles, and the interquartile range of the exam scores.
6. Are there any outliers in this data? Explain your reasoning.
84 86 77 97 8889 94 89 81 9080 75 91 83 85
024_039_FLCRMC3C08_892307.indd 27024_039_FLCRMC3C08_892307.indd 27 7/25/09 9:05:33 AM7/25/09 9:05:33 AM
NAME ________________________________________ DATE _____________ PERIOD _____
PDF pass
Copyright ©
Glencoe/M
cGraw
-Hill, a division of T
he McG
raw-H
ill Com
panies, Inc.8-2
A
Chapter 8 28 Course 3
1 4 6 4 11 3 3
1 2 11
11
1
4000
3000
2000
1000
0 4 5 6 7 8 9 10 11 Shoe Size
Freq
uenc
y
Enrich
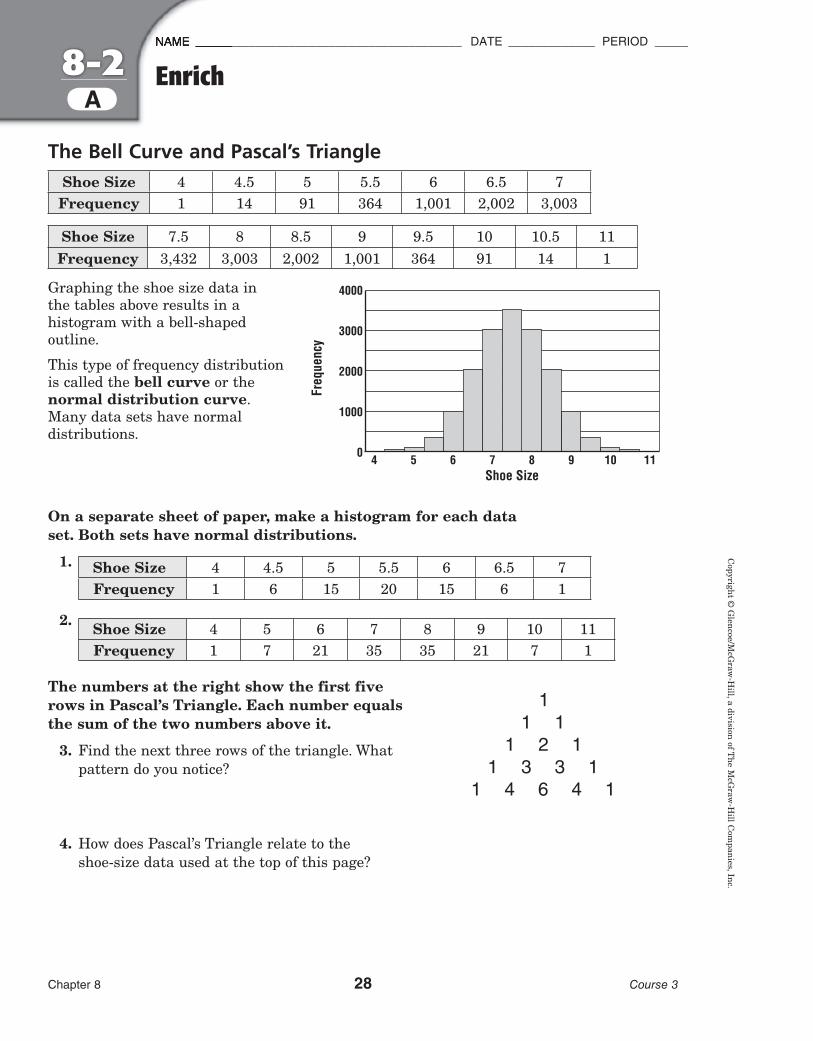
The Bell Curve and Pascal’s TriangleShoe Size 4 4.5 5 5.5 6 6.5 7Frequency 1 14 91 364 1,001 2,002 3,003
Shoe Size 7.5 8 8.5 9 9.5 10 10.5 11Frequency 3,432 3,003 2,002 1,001 364 91 14 1
Graphing the shoe size data in the tables above results in a histogram with a bell-shaped outline.
This type of frequency distribution is called the bell curve or the normal distribution curve. Many data sets have normal distributions.
On a separate sheet of paper, make a histogram for each data set. Both sets have normal distributions.
1. Shoe Size 4 4.5 5 5.5 6 6.5 7Frequency 1 6 15 20 15 6 1
2. Shoe Size 4 5 6 7 8 9 10 11Frequency 1 7 21 35 35 21 7 1
The numbers at the right show the first five rows in Pascal’s Triangle. Each number equals the sum of the two numbers above it.
3. Find the next three rows of the triangle. What pattern do you notice?
4. How does Pascal’s Triangle relate to the shoe-size data used at the top of this page?
024_039_FLCRMC3C08_892307.indd 28024_039_FLCRMC3C08_892307.indd 28 12/30/08 8:11:20 PM12/30/08 8:11:20 PM

NAME ________________________________________ DATE _____________ PERIOD _____
PDF pass
Cop
yrig
ht ©
Gle
ncoe
/McG
raw
-Hill
, a d
ivis
ion
of T
he M
cGra
w-H
ill C
ompa
nies
, Inc
.8-2
Chapter 8 29 Course 3
BReteachBox-and-Whisker Plots
Use the data below to construct a box-and-whisker plot.12, 14, 8, 10, 1, 16, 10, 11, 10
Step 1 Put the data in order from least to greatest and find the median, lower quartile, upper quartile, and the least and greatest values that are not outliers. Ordered data: 1, 8, 10, 10, 10, 11, 12, 14, 16Least value: 1; Median: 10; Greatest value: 16;
Lower quartile: 8 + 10 − 2 or 9; Upper quartile: 12 + 14 −
2 or 13;
Interquartile range: 13 - 9 or 4; Lower limit for outliers: 9 - 6 or 3; Upper limit for outliers: 13 + 6 or 19; Outliers: 1
Step 2 Draw a number line that includes the least and greatest numbers in the data.
Step 3 Mark the extremes, the median, and the upper and lower quartile above the number line. Check for outliers. If an outlier exists, mark the least value that is not an outlier. Use an asterisk (*) to indicate an outlier. It is not connected to a whisker.
Step 4 Draw the box and the whiskers.
Box-and-whisker plots separate data into four parts. Even though the parts may differ in length, each part contains 1 −
4 of the data.
Exercises
Construct a box-and-whisker plot for each data set.
1. 4, 7, 5, 3, 9, 6, 4 2. 13, 12, 17, 10, 6, 11, 14
0 1 2 3 4 5 6 7 8 9 10 0 2 4 6 8 10 12 14 16 18 20 3. 23, 36, 22, 34, 30, 29, 26, 27, 33 4. 108, 126, 110, 104, 106, 123, 140, 122, 114, 109
20 22 24 26 28 30 32 34 36 38 40 100 108 116 124 132 140
A box-and-whisker plot uses a number line to show the distribution of a set of data. The box is drawn around the quartile values, and the whiskers extend from each quartile to the extreme data points that are not outliers.
Example
024_039_FLCRMC3C08_892307.indd 29024_039_FLCRMC3C08_892307.indd 29 12/30/08 8:11:23 PM12/30/08 8:11:23 PM
NAME ________________________________________ DATE _____________ PERIOD _____
Pdf Crx
Copyright ©
Glencoe/M
cGraw
-Hill, a division of T
he McG
raw-H
ill Com
panies, Inc.8-2
Chapter 8 30 Course 3
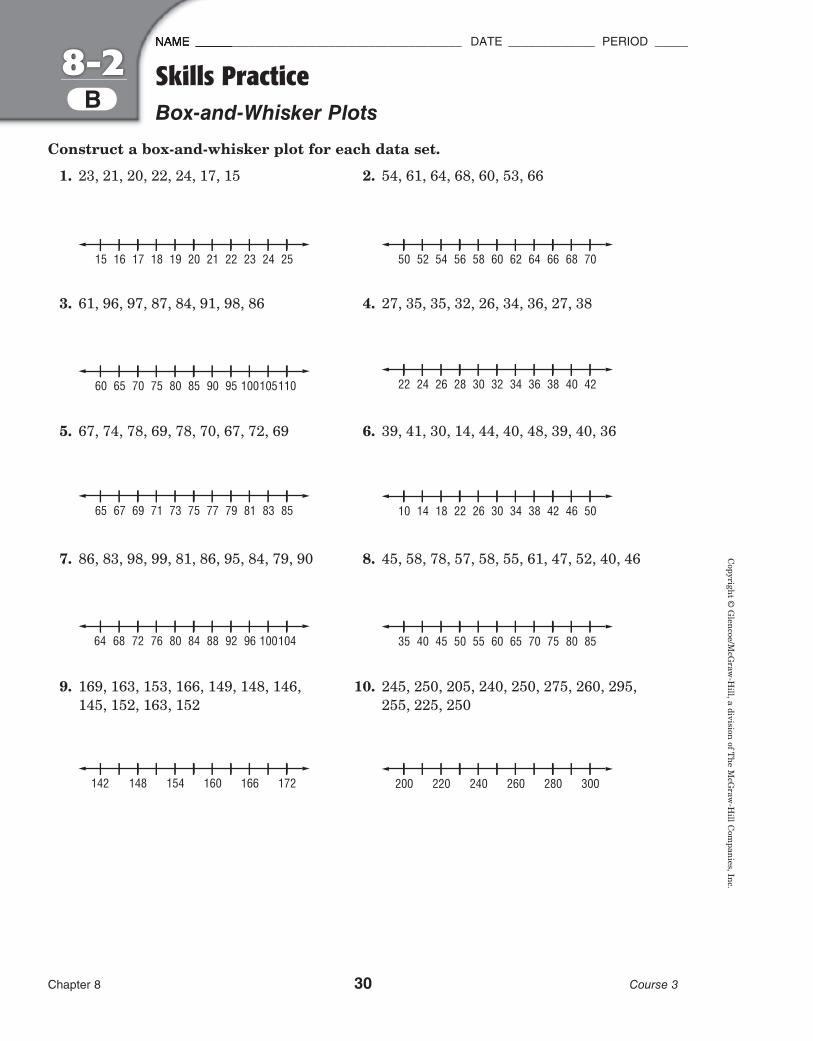
BSkills PracticeBox-and-Whisker Plots
Construct a box-and-whisker plot for each data set.
1. 23, 21, 20, 22, 24, 17, 15 2. 54, 61, 64, 68, 60, 53, 66
15 16 17 18 19 20 21 22 23 24 25 50 52 54 56 58 60 62 64 66 68 70
3. 61, 96, 97, 87, 84, 91, 98, 86 4. 27, 35, 35, 32, 26, 34, 36, 27, 38
60 65 70 75 80 85 90 95 100105110 22 24 26 28 30 32 34 36 38 40 42
5. 67, 74, 78, 69, 78, 70, 67, 72, 69 6. 39, 41, 30, 14, 44, 40, 48, 39, 40, 36
65 67 69 71 73 75 77 79 81 83 85 10 14 18 22 26 30 34 38 42 46 50
7. 86, 83, 98, 99, 81, 86, 95, 84, 79, 90 8. 45, 58, 78, 57, 58, 55, 61, 47, 52, 40, 46
76726864 80 84 88 92 96 100104 35 40 45 50 55 60 65 70 75 80 85
9. 169, 163, 153, 166, 149, 148, 146, 10. 245, 250, 205, 240, 250, 275, 260, 295,145, 152, 163, 152 255, 225, 250
148142 154 160 166 172 200 220 240 260 280 300
024_039_FLCRMC3C08_892307.indd 30024_039_FLCRMC3C08_892307.indd 30 1/23/09 7:57:45 AM1/23/09 7:57:45 AM

NAME ________________________________________ DATE _____________ PERIOD _____
Pdf Crx
Cop
yrig
ht ©
Gle
ncoe
/McG
raw
-Hill
, a d
ivis
ion
of T
he M
cGra
w-H
ill C
ompa
nies
, Inc
.8-2
Chapter 8 31 Course 3
Homework PracticeBox-and-Whisker Plots
Construct a box-and-whisker plot for each data set.
1. ages of children: 2. prices, in dollars: 150, 134, 132, 120, 10, 12, 9, 7, 10, 12, 14, 14, 10, 16 145, 170, 125, 130, 145, 185, 140
7 8 9 10 11 12 13 14 15 16 120 130 140 150 160 170 180 190
CHICKEN For Exercises 3–7, use the box-and-whisker plot below.
30 31 32 33 34 35 36 37 38 39 40 41 42 43 44
Chickens
3. How many outliers are in the data?
4. What is the range in chicken prices?
5. Which quartile(s) show the greatest spread of data?
6. What percent of the data indicates that farmers received more than $0.34 per pound for their chickens?
7. What percent of the data indicates that farmers received less than $0.35 per pound for their chickens?
B
Get ConnectedGet Connected For more examples, go to glencoe.com.
024_039_FLCRMC3C08_892307.indd 31024_039_FLCRMC3C08_892307.indd 31 1/23/09 7:57:53 AM1/23/09 7:57:53 AM

NAME ________________________________________ DATE _____________ PERIOD _____
PDF pass
Copyright ©
Glencoe/M
cGraw
-Hill, a division of T
he McG
raw-H
ill Com
panies, Inc.8-2
Chapter 8 32 Course 3
Problem-Solving PracticeBox-and-Whisker PlotsB
U.S. SENATE For Exercises 1–4, use thebox-and-whisker plot at the right.
1. Explain how to determine from the box-and-whisker plot whether there are any outliers in the data. Then identify any outliers.
2. Describe the distribution of the data. What can you say about the ages of U.S. senators?
3. What percent of U.S. senators are at least 54 years old? Explain how you found your answer.
4. Can you determine from the box-and-whisker plot whether there are any U.S. Senators exactly 65 years old? Explain.
HOCKEY For Exercises 5 and 6, use the box-and-whisker plot at the right.
5. Identify any outliers in the data. 6. Describe the distribution of the data. What can you say about the number of goals made by the top 10 all-time leading scorers?
40 50 60 70 80 90
400300 500 600 700 800 900
024_039_FLCRMC3C08_892307.indd 32024_039_FLCRMC3C08_892307.indd 32 12/30/08 8:11:42 PM12/30/08 8:11:42 PM

NAME ________________________________________ DATE _____________ PERIOD _____
PDF pass
Cop
yrig
ht ©
Gle
ncoe
/McG
raw
-Hill
, a d
ivis
ion
of T
he M
cGra
w-H
ill C
ompa
nies
, Inc
.8-2
Chapter 8 33 Course 3
Box-and-Whisker TransformationsAltering the data used to create a box-and-whisker plot changes the shape of the plot. Multiplying each piece of data by the same factor will have an affect on the plot. In this activity you will investigate how multiplying the data by a factor affects the box-and-whisker plot.
Start with the following data:
AGE OF CHILDREN
2, 3, 5, 4, 6, 3, 2, 1, 0, 2, 4, 3, 5, 2, 6, 3, 2
1. Use the date to create a box-and-whisker plot.
2. Multiply each piece of data by -1 and create a box-and-whisker plot for the new data. How does this change the box-and-whisker plot?
3. Multiply each original piece of data by 5 and create a box-and-whisker plot for the new data. How does this change the box-and-whisker plot?
EnrichB
024_039_FLCRMC3C08_892307.indd 33024_039_FLCRMC3C08_892307.indd 33 12/30/08 8:11:46 PM12/30/08 8:11:46 PM

NAME ________________________________________ DATE _____________ PERIOD _____
PDF pass
Copyright ©
Glencoe/M
cGraw
-Hill, a division of T
he McG
raw-H
ill Com
panies, Inc.8-2
Chapter 8 34 Course 3
B
A graphing calculator can be used to construct box-and-whisker plots. On the TI-84 Plus, box-and-whisker plots can be found in the [STATPLOT] menu.
Mrs. Tabler gave an exam in her math class. The exam scores were {19, 99, 67, 89, 11, 100, 90, 78, 76, 77, 86, 87, 69, 68, 72, 75, 89, 92, 93}. Use a graphing calculator to construct a box-and-whisker plot of the exam scores.
Step 1 Enter the data as a list.
Enter: 1 19 99 67 … 93
Step 2 Next, choose the box-and-whisker plot from the [STATPLOT] menu.
Enter: [STATPLOT]
L1 9
This displays the box-and-whisker plot.
Construct a box-and-whisker plot for each data set.
1. {11, 12, 13, 11, 10, 2} 2. {1, 1.5, 1, 2, 1.5, 1.75, 3}
3. {9, 9, 10, 10, 8, 7, 2, 3, 10, 9} 4. {1.2, 1.3, 1.25, 1, 2, 1.5}
5. {99, 99.5, 99.6, 99.7, 97, 99.8} 6. {1, 5, 4, 5, 3, 6, 4, 5, 3, 2}
7. {19, 20, 15, 12, 2, 19, 18, 17, 16} 8. {190, 187, 67, 177, 178, 200, 199, 184}
9. {3, 3, 4, 4, 5, 5, 5, 5, 4, 6, 3, 4, 3, 5, 6} 10. {36, 28, 30, 25, 42, 44, 48, 46, 40, 41}
TI-84 Plus ActivityBox-and-Whisker Plots
Example
024_039_FLCRMC3C08_892307.indd 34024_039_FLCRMC3C08_892307.indd 34 12/30/08 8:11:50 PM12/30/08 8:11:50 PM
NAME ________________________________________ DATE _____________ PERIOD _____
PDF Pass
Cop
yrig
ht ©
Gle
ncoe
/McG
raw
-Hill
, a d
ivis
ion
of T
he M
cGra
w-H
ill C
ompa
nies
, Inc
.8-2
Chapter 8 35 Course 3
CReteachDouble Box-and-Whisker Plots
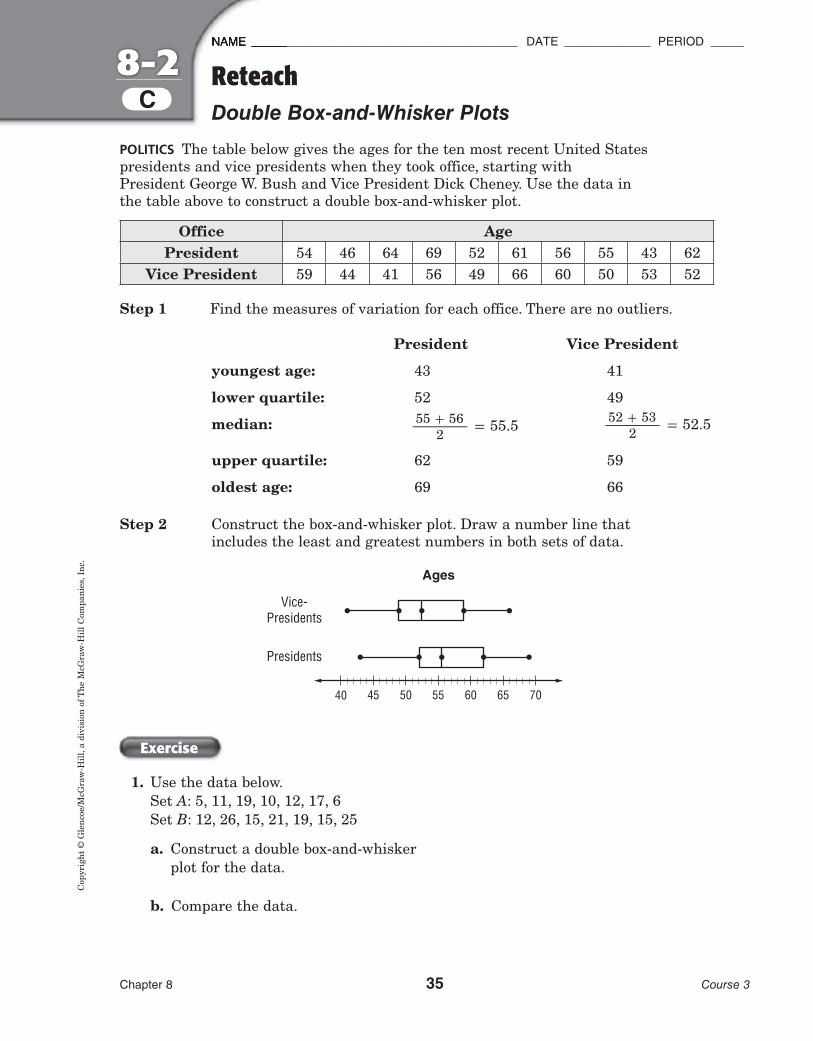
POLITICS The table below gives the ages for the ten most recent United States presidents and vice presidents when they took office, starting with President George W. Bush and Vice President Dick Cheney. Use the data in the table above to construct a double box-and-whisker plot.
Office AgePresident 54 46 64 69 52 61 56 55 43 62
Vice President 59 44 41 56 49 66 60 50 53 52
Step 1 Find the measures of variation for each office. There are no outliers.
President Vice President
youngest age: 43 41
lower quartile: 52 49
median: 55 + 56 − 2 = 55.5 52 + 53 −
2 = 52.5
upper quartile: 62 59
oldest age: 69 66
Step 2 Construct the box-and-whisker plot. Draw a number line that includes the least and greatest numbers in both sets of data.
40 45 50 55 6560 70
Vice-Presidents
Presidents
Exercise
1. Use the data below. Set A: 5, 11, 19, 10, 12, 17, 6 Set B: 12, 26, 15, 21, 19, 15, 25
a. Construct a double box-and-whisker plot for the data.
b. Compare the data.
024_039_FLCRMC3C08_892307.indd 35024_039_FLCRMC3C08_892307.indd 35 7/25/09 9:05:10 AM7/25/09 9:05:10 AM

NAME ________________________________________ DATE _____________ PERIOD _____
PDF Pass
Copyright ©
Glencoe/M
cGraw
-Hill, a division of T
he McG
raw-H
ill Com
panies, Inc.8-2
Chapter 8 36 Course 3
Skills PracticeDouble Box-and-Whisker Plots
1. BASKETBALL The table gives the scoring averages for the top ten scorers on two Florida basketball teams during the 2007–2008 season.
a. Construct a double box-and-whisker plot for the data.
b. Compare the ten highest scorers on Team M to the ten highest scorers on Team O.
2. READING Refer to the double box-and-whisker plot shown at the right that shows the number of books read by the boys and girls in Mrs. Wilken’s 8th-grade English class.
a. Which data set has a greater range? What is the range?
b. What does the median indicate about the number of books read by boys versus the number of books read by girls?
c. What percent of the girls read at least 5 books?
d. What percent of the boys read more than 9 books? What percent of the girls read less than 9 books?
e. In general, who reads more books? How do you know?
Team M Team O24.6 20.714.3 19.514.2 18.213.8 10.912.0 9.39.5 8.78.8 8.18.8 6.98.0 5.07.9 4.1
C
50 10 15 20
Boys
Girls
024_039_FLCRMC3C08_892307.indd 36024_039_FLCRMC3C08_892307.indd 36 7/25/09 12:51:54 PM7/25/09 12:51:54 PM

NAME ________________________________________ DATE _____________ PERIOD _____
PDF Pass
Cop
yrig
ht ©
Gle
ncoe
/McG
raw
-Hill
, a d
ivis
ion
of T
he M
cGra
w-H
ill C
ompa
nies
, Inc
.8-2
Chapter 8 37 Course 3
CHomework PracticeDouble Box-and-Whisker Plots
1. THEME PARKS The stem-and-leaf plot shows the number of people who visited two different theme parks last week.
a. Construct a double box-and-whisker plot for the data.
b. Compare the number of visitors to theme park A to the number of visitors to theme park B.
2. DANCE MARATHON The dance clubs at Whitfield Middle School and Jacob Middle School held a dance marathon to raise money for a local charity. How much money each club raised is based on the number of hours each couple danced. Refer to the double box-and-whisker plot that shows the number of hours couples danced.
1 2 3 4 5 6 7 8 11109
Whitfield MiddleSchool
Jacob MiddleSchool
a. What percent of the couples from Whitfield Middle School danced more than 4 hours?
b. Compare the number of hours danced by couples at both middle schools.
Theme Park A Stem Theme Park B5 8
5 6 2 4 61 3 7 5 7
4 6 9 8 18 9
5|6 = 65 visitors 5|8 = 58 visitors
Get ConnectedGet Connected For more examples, go to glencoe.com.
024_039_FLCRMC3C08_892307.indd 37024_039_FLCRMC3C08_892307.indd 37 7/25/09 11:10:25 AM7/25/09 11:10:25 AM
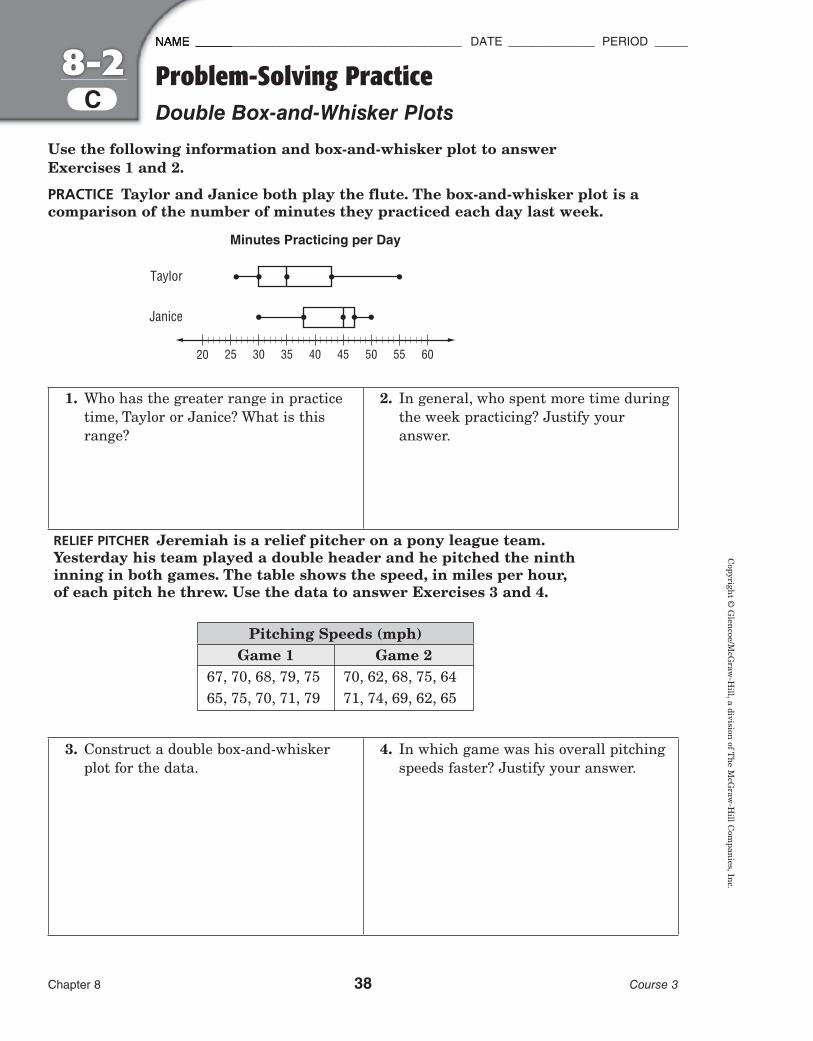
NAME ________________________________________ DATE _____________ PERIOD _____
PDF Pass
Copyright ©
Glencoe/M
cGraw
-Hill, a division of T
he McG
raw-H
ill Com
panies, Inc.8-2
Chapter 8 38 Course 3
Problem-Solving PracticeDouble Box-and-Whisker PlotsC
Use the following information and box-and-whisker plot to answer Exercises 1 and 2.
PRACTICE Taylor and Janice both play the flute. The box-and-whisker plot is a comparison of the number of minutes they practiced each day last week.
20 25 30 35 40 45 50 55 60
Taylor
Janice
1. Who has the greater range in practice time, Taylor or Janice? What is this range?
2. In general, who spent more time during the week practicing? Justify your answer.
RELIEF PITCHER Jeremiah is a relief pitcher on a pony league team. Yesterday his team played a double header and he pitched the ninth inning in both games. The table shows the speed, in miles per hour, of each pitch he threw. Use the data to answer Exercises 3 and 4.
Pitching Speeds (mph)
Game 1 Game 267, 70, 68, 79, 75 70, 62, 68, 75, 6465, 75, 70, 71, 79 71, 74, 69, 62, 65
3. Construct a double box-and-whisker plot for the data.
4. In which game was his overall pitching speeds faster? Justify your answer.
024_039_FLCRMC3C08_892307.indd 38024_039_FLCRMC3C08_892307.indd 38 7/25/09 9:08:58 AM7/25/09 9:08:58 AM
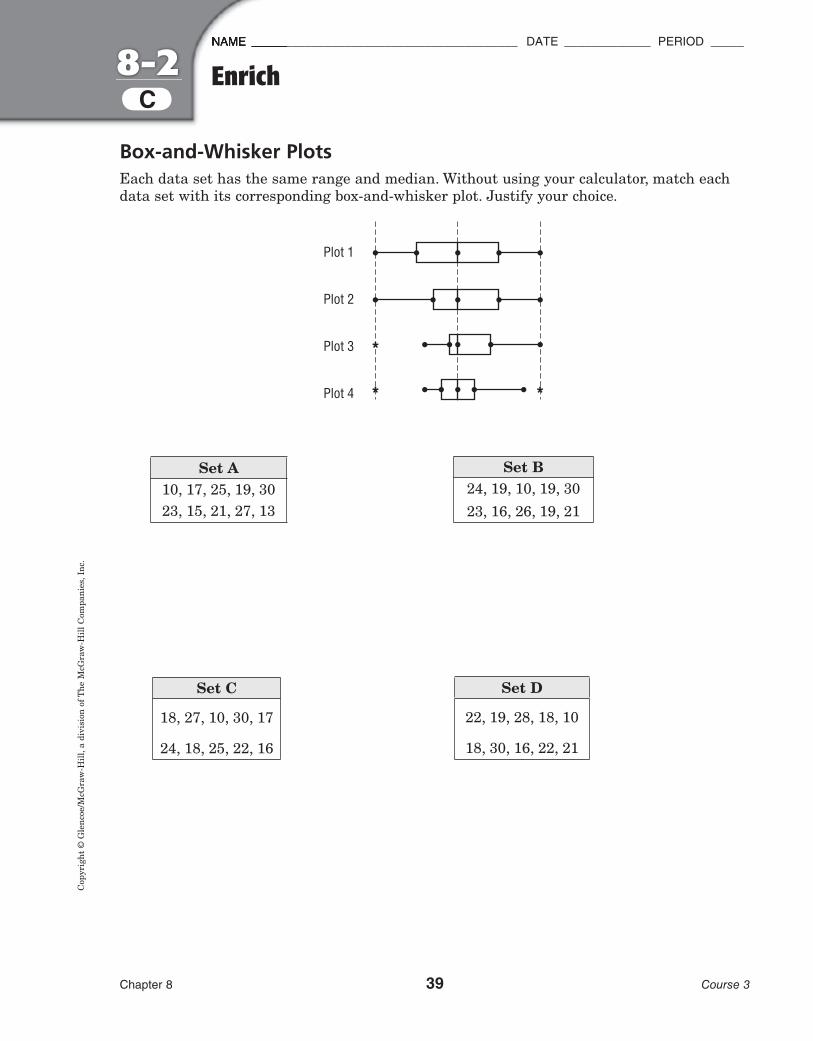
NAME ________________________________________ DATE _____________ PERIOD _____
PDF Pass
Cop
yrig
ht ©
Gle
ncoe
/McG
raw
-Hill
, a d
ivis
ion
of T
he M
cGra
w-H
ill C
ompa
nies
, Inc
.8-2
Chapter 8 39 Course 3
C
Box-and-Whisker PlotsEach data set has the same range and median. Without using your calculator, match each data set with its corresponding box-and-whisker plot. Justify your choice.
Plot 4
Plot 3
Plot 2
Plot 1
Set A
10, 17, 25, 19, 3023, 15, 21, 27, 13
Set B
24, 19, 10, 19, 3023, 16, 26, 19, 21
Set C
18, 27, 10, 30, 17
24, 18, 25, 22, 16
Set D
22, 19, 28, 18, 10
18, 30, 16, 22, 21
Enrich
024_039_FLCRMC3C08_892307.indd 39024_039_FLCRMC3C08_892307.indd 39 7/25/09 9:09:36 AM7/25/09 9:09:36 AM
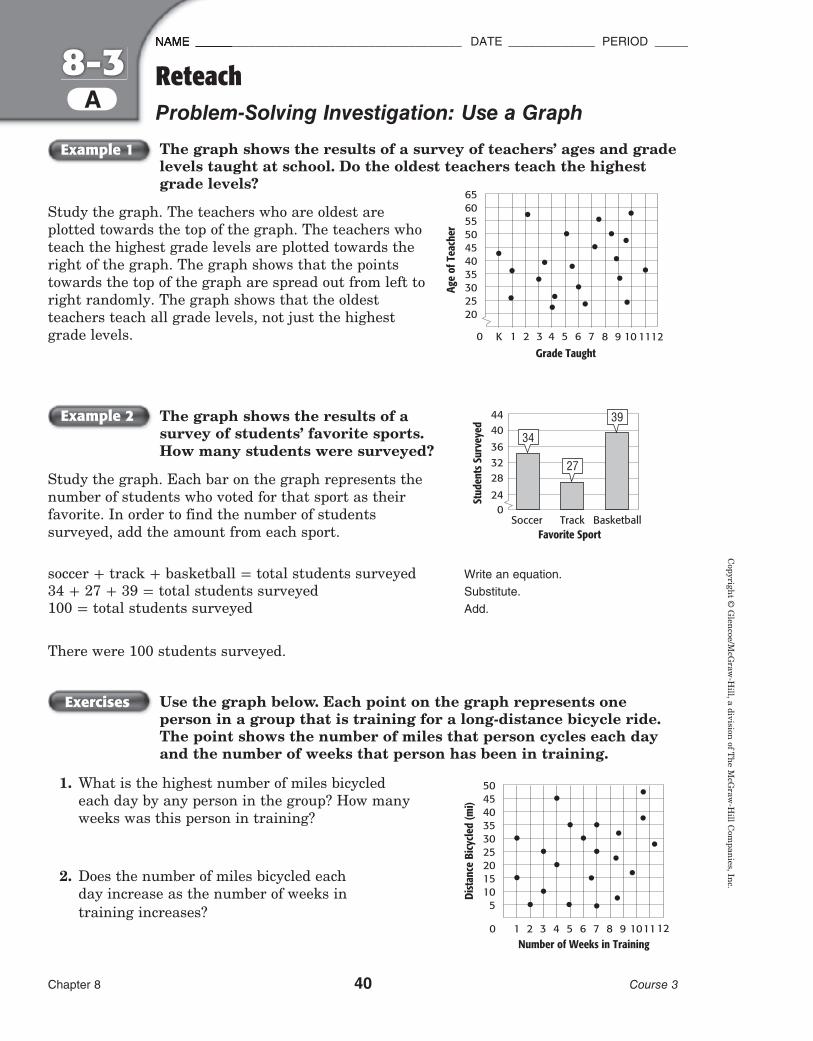
NAME ________________________________________ DATE _____________ PERIOD _____
PDF Pass
Chapter 8 40 Course 3
Copyright ©
Glencoe/M
cGraw
-Hill, a division of T
he McG
raw-H
ill Com
panies, Inc.
A
The graph shows the results of a survey of teachers’ ages and grade levels taught at school. Do the oldest teachers teach the highest grade levels?
Study the graph. The teachers who are oldest are plotted towards the top of the graph. The teachers who teach the highest grade levels are plotted towards the right of the graph. The graph shows that the points towards the top of the graph are spread out from left to right randomly. The graph shows that the oldest teachers teach all grade levels, not just the highest grade levels.
The graph shows the results of a survey of students’ favorite sports. How many students were surveyed?
Study the graph. Each bar on the graph represents the number of students who voted for that sport as their favorite. In order to find the number of students surveyed, add the amount from each sport.
soccer + track + basketball = total students surveyed Write an equation.34 + 27 + 39 = total students surveyed Substitute.100 = total students surveyed Add.
There were 100 students surveyed.
Use the graph below. Each point on the graph represents one person in a group that is training for a long-distance bicycle ride. The point shows the number of miles that person cycles each day and the number of weeks that person has been in training.
1. What is the highest number of miles bicycled each day by any person in the group? How many weeks was this person in training?
2. Does the number of miles bicycled each day increase as the number of weeks in training increases?
Example 1
1 2 3 4 5 6 7 8 9 10 1112
302520
354045
Age
of T
each
er 50556065
Grade Taught0 K
Example 2
BasketballTrackSoccer
3236
28
024
40
Stud
ents
Sur
veye
d
44
Favorite Sport
27
34
39
Exercises
8-3 ReteachProblem-Solving Investigation: Use a Graph
1 2 3 4 5 6 7 8 9 101112
15105
202530
Dist
ance
Bicy
cled
(mi)
35404550
Number of Weeks in Training0
040_044_FLCRMC3C08_892307.indd 40040_044_FLCRMC3C08_892307.indd 40 7/25/09 9:11:35 AM7/25/09 9:11:35 AM
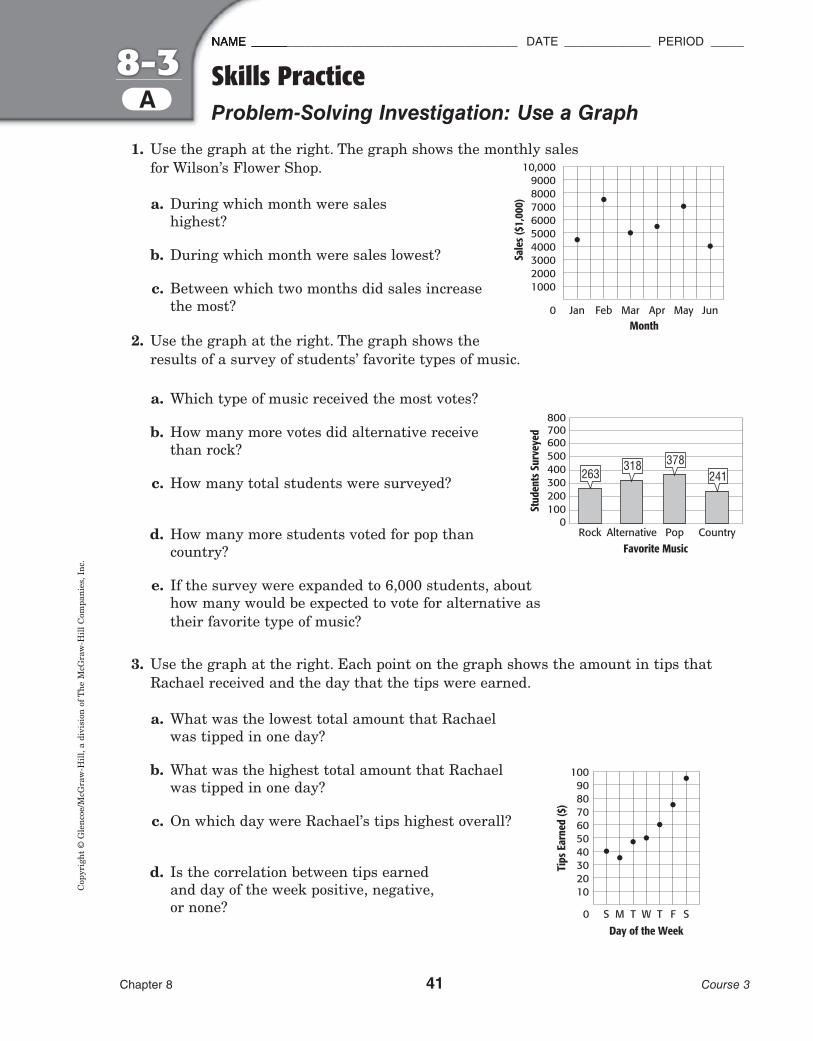
NAME ________________________________________ DATE _____________ PERIOD _____
PDF Pass
Chapter 8 41 Course 3
Cop
yrig
ht ©
Gle
ncoe
/McG
raw
-Hill
, a d
ivis
ion
of T
he M
cGra
w-H
ill C
ompa
nies
, Inc
.
A
1. Use the graph at the right. The graph shows the monthly sales for Wilson’s Flower Shop.
a. During which month were sales highest?
b. During which month were sales lowest?
c. Between which two months did sales increase the most?
2. Use the graph at the right. The graph shows the results of a survey of students’ favorite types of music.
a. Which type of music received the most votes?
b. How many more votes did alternative receive than rock?
c. How many total students were surveyed?
d. How many more students voted for pop than country?
e. If the survey were expanded to 6,000 students, about how many would be expected to vote for alternative as their favorite type of music?
3. Use the graph at the right. Each point on the graph shows the amount in tips that Rachael received and the day that the tips were earned.
a. What was the lowest total amount that Rachael was tipped in one day?
b. What was the highest total amount that Rachael was tipped in one day?
c. On which day were Rachael’s tips highest overall?
d. Is the correlation between tips earned and day of the week positive, negative,or none?
Jan Feb Mar Apr May Jun
300020001000
400050006000
Sale
s ($1
,000
)
700080009000
10,000
Month0
Pop CountryAlternativeRock
300400
200
0100
500
Stud
ents
Sur
veye
d
600700800
Favorite Music
241378318
263
S M T W T F S
302010
405060
Tips
Ear
ned
($)
708090
100
Day of the Week0
8-3 Skills PracticeProblem-Solving Investigation: Use a Graph
040_044_FLCRMC3C08_892307.indd 41040_044_FLCRMC3C08_892307.indd 41 7/25/09 12:56:03 PM7/25/09 12:56:03 PM
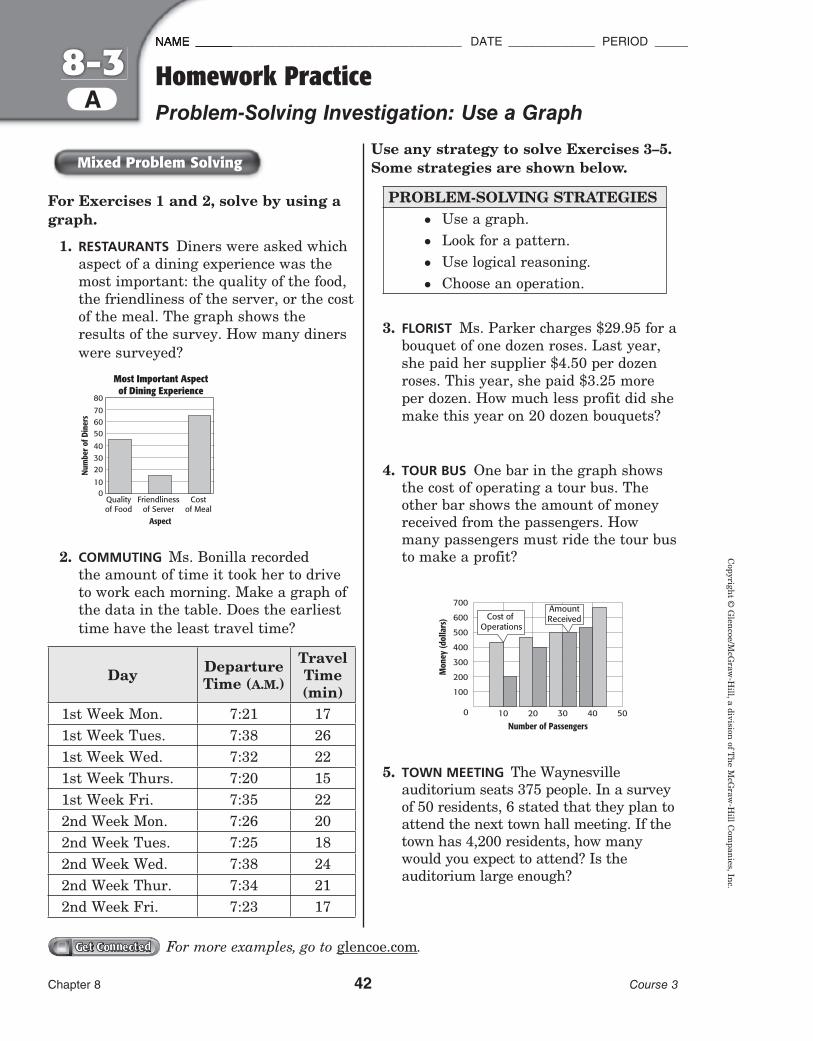
NAME ________________________________________ DATE _____________ PERIOD _____
PDF Pass
Chapter 8 42 Course 3
Copyright ©
Glencoe/M
cGraw
-Hill, a division of T
he McG
raw-H
ill Com
panies, Inc.
A
For Exercises 1 and 2, solve by using a graph.
1. RESTAURANTS Diners were asked which aspect of a dining experience was the most important: the quality of the food, the friendliness of the server, or the cost of the meal. The graph shows the results of the survey. How many diners were surveyed?
Qualityof Food
Friendlinessof Server
Costof Meal
3040
20
010
50
Num
ber o
f Din
ers
607080
Aspect
Most Important Aspectof Dining Experience
2. COMMUTING Ms. Bonilla recorded the amount of time it took her to drive to work each morning. Make a graph of the data in the table. Does the earliest time have the least travel time?
Day Departure Time (A.M.)
Travel Time (min)
1st Week Mon. 7:21 171st Week Tues. 7:38 261st Week Wed. 7:32 221st Week Thurs. 7:20 151st Week Fri. 7:35 222nd Week Mon. 7:26 202nd Week Tues. 7:25 182nd Week Wed. 7:38 242nd Week Thur. 7:34 212nd Week Fri. 7:23 17
Use any strategy to solve Exercises 3–5. Some strategies are shown below.
PROBLEM-SOLVING STRATEGIES• Use a graph.• Look for a pattern.• Use logical reasoning.• Choose an operation.
3. FLORIST Ms. Parker charges $29.95 for a bouquet of one dozen roses. Last year, she paid her supplier $4.50 per dozen roses. This year, she paid $3.25 more per dozen. How much less profit did she make this year on 20 dozen bouquets?
4. TOUR BUS One bar in the graph shows the cost of operating a tour bus. The other bar shows the amount of money received from the passengers. How many passengers must ride the tour bus to make a profit?
10 20 30 40 50
300
200
100
400
500
600
700
Mon
ey (d
olla
rs)
Number of Passengers0
Cost of Operations
AmountReceived
5. TOWN MEETING The Waynesville auditorium seats 375 people. In a survey of 50 residents, 6 stated that they plan to attend the next town hall meeting. If the town has 4,200 residents, how many would you expect to attend? Is the auditorium large enough?
Get ConnectedGet Connected For more examples, go to glencoe.com.
8-3 Homework PracticeProblem-Solving Investigation: Use a Graph
Mixed Problem Solving
040_044_FLCRMC3C08_892307.indd 42040_044_FLCRMC3C08_892307.indd 42 7/25/09 9:15:23 AM7/25/09 9:15:23 AM
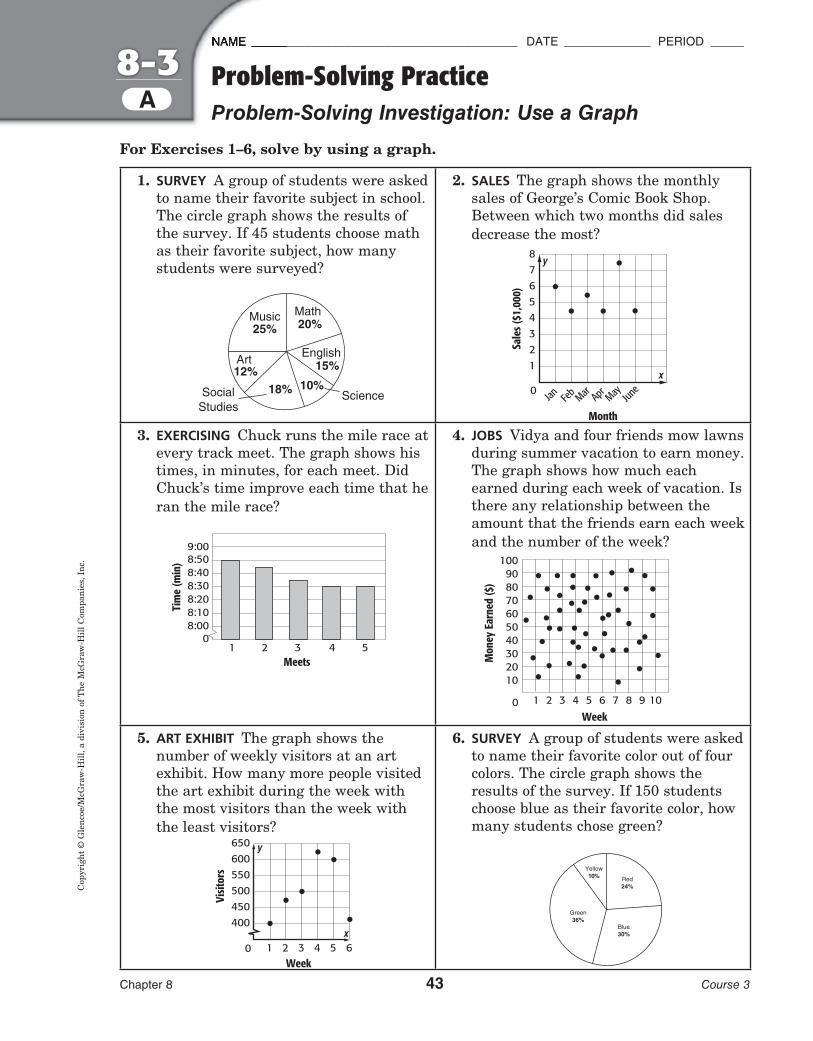
NAME ________________________________________ DATE _____________ PERIOD _____
Pdf Crx
Chapter 8 43 Course 3
Cop
yrig
ht ©
Gle
ncoe
/McG
raw
-Hill
, a d
ivis
ion
of T
he M
cGra
w-H
ill C
ompa
nies
, Inc
.
A8-3 Problem-Solving Practice
Problem-Solving Investigation: Use a Graph
For Exercises 1–6, solve by using a graph.
1. SURVEY A group of students were asked to name their favorite subject in school. The circle graph shows the results of the survey. If 45 students choose math as their favorite subject, how many students were surveyed?
2. SALES The graph shows the monthly sales of George’s Comic Book Shop. Between which two months did sales decrease the most?
3. EXERCISING Chuck runs the mile race at every track meet. The graph shows his times, in minutes, for each meet. Did Chuck’s time improve each time that he ran the mile race?
4. JOBS Vidya and four friends mow lawns during summer vacation to earn money. The graph shows how much each earned during each week of vacation. Is there any relationship between the amount that the friends earn each week and the number of the week?
5. ART EXHIBIT The graph shows the number of weekly visitors at an art exhibit. How many more people visited the art exhibit during the week with the most visitors than the week with the least visitors?
6. SURVEY A group of students were asked to name their favorite color out of four colors. The circle graph shows the results of the survey. If 150 students choose blue as their favorite color, how many students chose green?
3 4 521
8:208:30
8:10
08:00
8:40
Tim
e (m
in) 8:50
9:00
Meets302010
405060
Mon
ey E
arne
d ($
)
708090
100
Week0 1 2 3 4 5 6 7 8 9 10
y
x
Sale
s ($1
,000
)
21
0
345678
Jan Feb Mar Apr May June
Month
y
x
Visit
ors
450400
0
500550600650
1 2 3 4 5 6Week
040_044_FLCRMC3C08_892307.indd 43040_044_FLCRMC3C08_892307.indd 43 1/23/09 8:04:32 AM1/23/09 8:04:32 AM
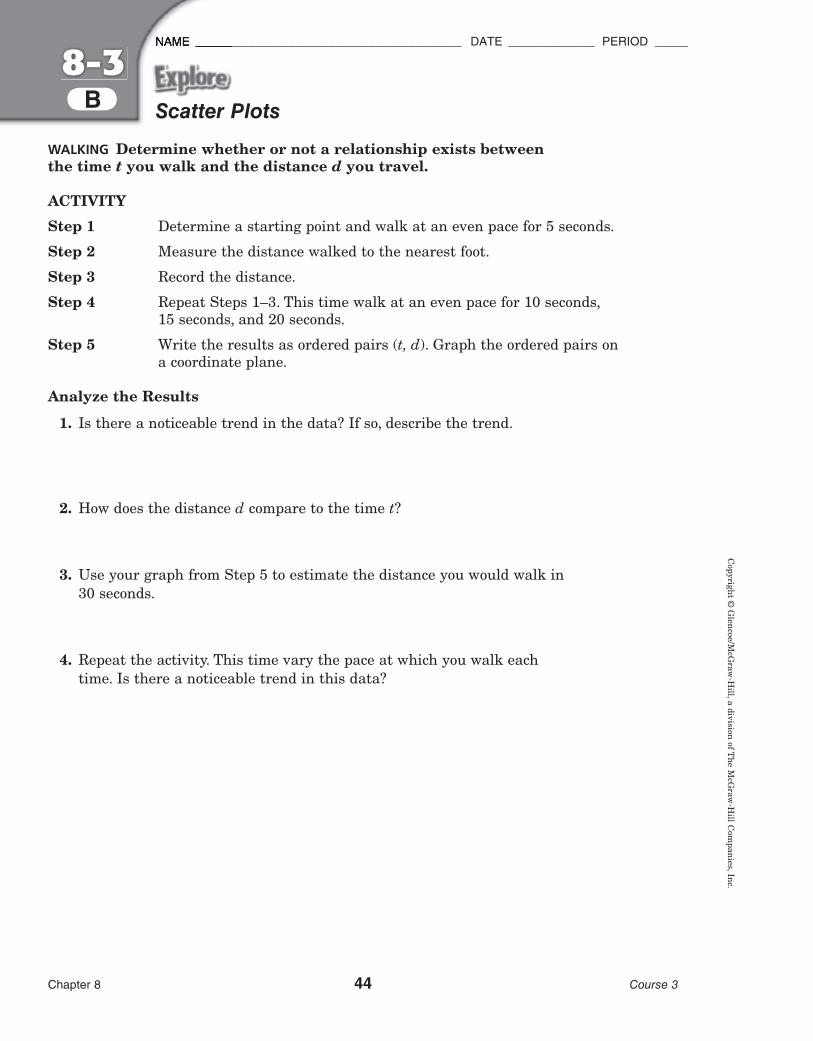
NAME ________________________________________ DATE _____________ PERIOD _____
Pdf Crx
Chapter 8 44 Course 3
Copyright ©
Glencoe/M
cGraw
-Hill, a division of T
he McG
raw-H
ill Com
panies, Inc.
Scatter Plots
WALKING Determine whether or not a relationship exists between the time t you walk and the distance d you travel.
ACTIVITY
Step 1 Determine a starting point and walk at an even pace for 5 seconds.
Step 2 Measure the distance walked to the nearest foot.
Step 3 Record the distance.
Step 4 Repeat Steps 1–3. This time walk at an even pace for 10 seconds, 15 seconds, and 20 seconds.
Step 5 Write the results as ordered pairs (t, d). Graph the ordered pairs on a coordinate plane.
Analyze the Results
1. Is there a noticeable trend in the data? If so, describe the trend.
2. How does the distance d compare to the time t?
3. Use your graph from Step 5 to estimate the distance you would walk in 30 seconds.
4. Repeat the activity. This time vary the pace at which you walk each time. Is there a noticeable trend in this data?
8-3B
040_044_FLCRMC3C08_892307.indd 44040_044_FLCRMC3C08_892307.indd 44 1/23/09 8:04:40 AM1/23/09 8:04:40 AM
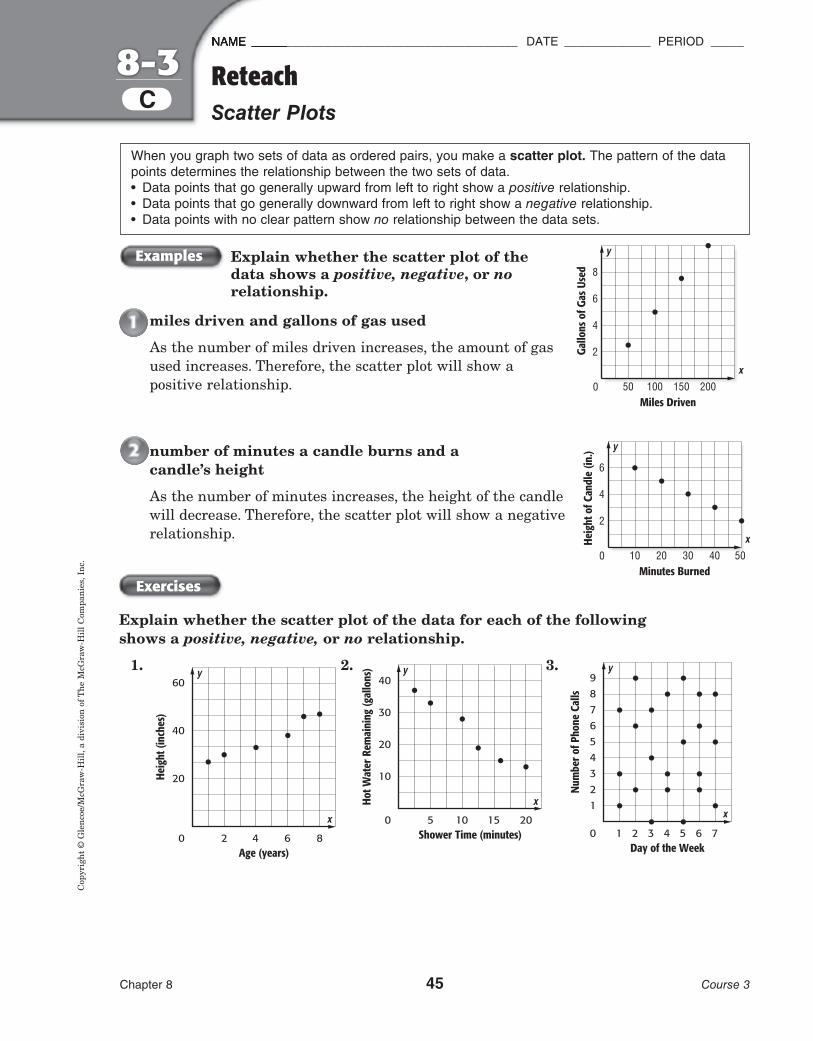
NAME ________________________________________ DATE _____________ PERIOD _____
PDF pass
Chapter 8 45 Course 3
Cop
yrig
ht ©
Gle
ncoe
/McG
raw
-Hill
, a d
ivis
ion
of T
he M
cGra
w-H
ill C
ompa
nies
, Inc
.8-3
C
y
x
0 10 20 30 40 50
2
4
6
Heig
ht o
f Can
dle
(in.)
Minutes Burned
y
x
0 50 100 150 200
2
4
6
8
Gallo
ns o
f Gas
Use
d
Miles Driven
ReteachScatter Plots
Explain whether the scatter plot of the data shows a positive, negative, or no relationship.
miles driven and gallons of gas used
As the number of miles driven increases, the amount of gas used increases. Therefore, the scatter plot will show a positive relationship.
number of minutes a candle burns and a candle’s height
As the number of minutes increases, the height of the candle will decrease. Therefore, the scatter plot will show a negative relationship.
Exercises
Explain whether the scatter plot of the data for each of the following shows a positive, negative, or no relationship.
1.
Heig
ht (i
nche
s)
20
0
40
60
2 4 6 8Age (years)
y
x
2.
Hot W
ater
Rem
aini
ng (g
allo
ns)
10
0
20
40
30
5 10 15 20Shower Time (minutes)
y
x
3.
Num
ber o
f Pho
ne C
alls
321
0
45
789
6
1 2 3 4 5 6 7Day of the Week
y
x
When you graph two sets of data as ordered pairs, you make a scatter plot. The pattern of the data points determines the relationship between the two sets of data.• Data points that go generally upward from left to right show a positive relationship.• Data points that go generally downward from left to right show a negative relationship.• Data points with no clear pattern show no relationship between the data sets.
Examples
045_050_FLCRMC3C08_892307.indd 45045_050_FLCRMC3C08_892307.indd 45 12/30/08 8:08:46 PM12/30/08 8:08:46 PM
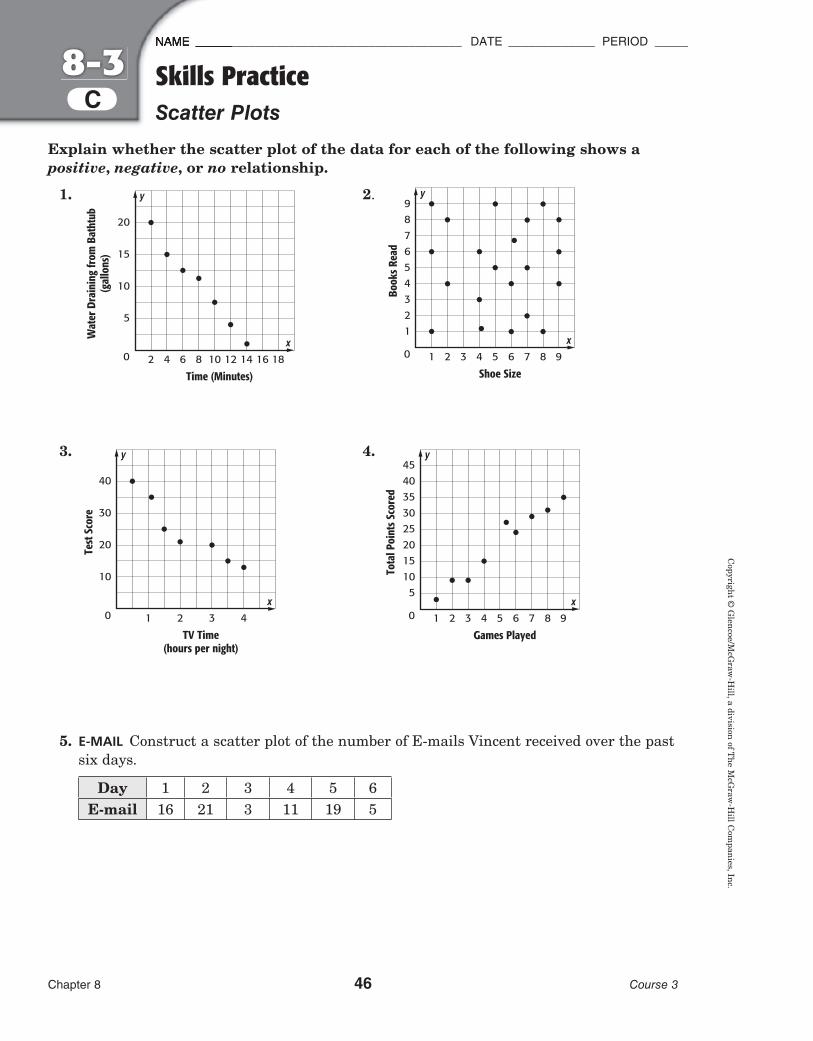
NAME ________________________________________ DATE _____________ PERIOD _____
Pdf Crx
Chapter 8 46 Course 3
Copyright ©
Glencoe/M
cGraw
-Hill, a division of T
he McG
raw-H
ill Com
panies, Inc.8-3
C
Explain whether the scatter plot of the data for each of the following shows a positive, negative, or no relationship.
1.
Wat
er D
rain
ing
from
Bat
htub
(gal
lons
)
5
0
10
20
15
4 8 12 162 6 10 14 18
Time (Minutes)
y
x
2.
Book
s Rea
d
23
1
0
45
89
67
2 4 6 81 3 5 7 9
Shoe Size
y
x
3.
Test
Sco
re
10
0
20
40
30
1 2 3 4
TV Time(hours per night)
y
x
4.
Tota
l Poi
nts S
core
d
105
0
2015
4045
353025
2 4 6 81 3 5 7 9
Games Played
y
x
5. E-MAIL Construct a scatter plot of the number of E-mails Vincent received over the past six days.
Day 1 2 3 4 5 6
E-mail 16 21 3 11 19 5
Skills PracticeScatter Plots
045_050_FLCRMC3C08_892307.indd 46045_050_FLCRMC3C08_892307.indd 46 1/23/09 8:02:33 AM1/23/09 8:02:33 AM
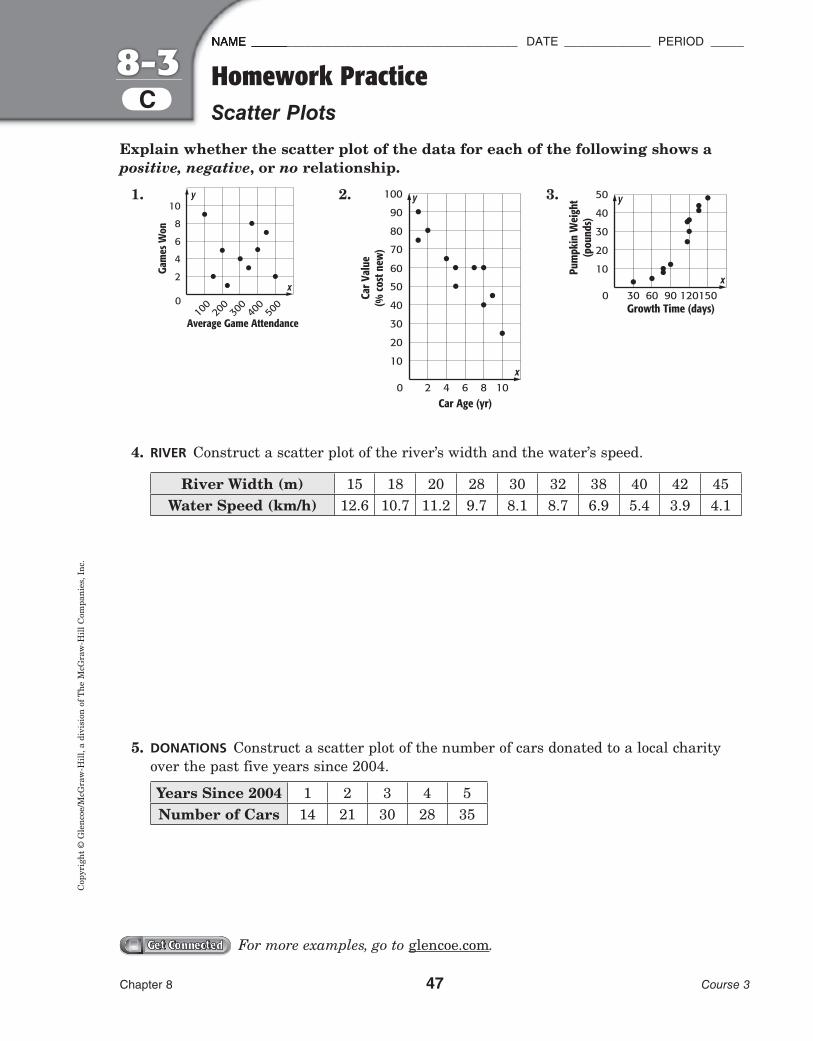
NAME ________________________________________ DATE _____________ PERIOD _____
PDF Pass
Chapter 8 47 Course 3
Cop
yrig
ht ©
Gle
ncoe
/McG
raw
-Hill
, a d
ivis
ion
of T
he M
cGra
w-H
ill C
ompa
nies
, Inc
.8-3
C
Explain whether the scatter plot of the data for each of the following shows a positive, negative, or no relationship.
1.
100
200
300
400
500
6
4
2
8
10
Gam
es W
on
Average Game Attendance
0
y
x
2.
30
20
10
40
50
60
70
80
90
100
Car V
alue
(% co
st n
ew)
Car Age (yr)0
y
x642 8 10
3.
30
20
10
40
50
Pum
pkin
Wei
ght
(pou
nds)
Growth Time (days)0
y
x906030 120150
4. RIVER Construct a scatter plot of the river’s width and the water’s speed.
River Width (m) 15 18 20 28 30 32 38 40 42 45Water Speed (km/h) 12.6 10.7 11.2 9.7 8.1 8.7 6.9 5.4 3.9 4.1
5. DONATIONS Construct a scatter plot of the number of cars donated to a local charity over the past five years since 2004.
Years Since 2004 1 2 3 4 5Number of Cars 14 21 30 28 35
Homework PracticeScatter Plots
Get ConnectedGet Connected For more examples, go to glencoe.com.
045_050_FLCRMC3C08_892307.indd 47045_050_FLCRMC3C08_892307.indd 47 7/25/09 9:17:14 AM7/25/09 9:17:14 AM
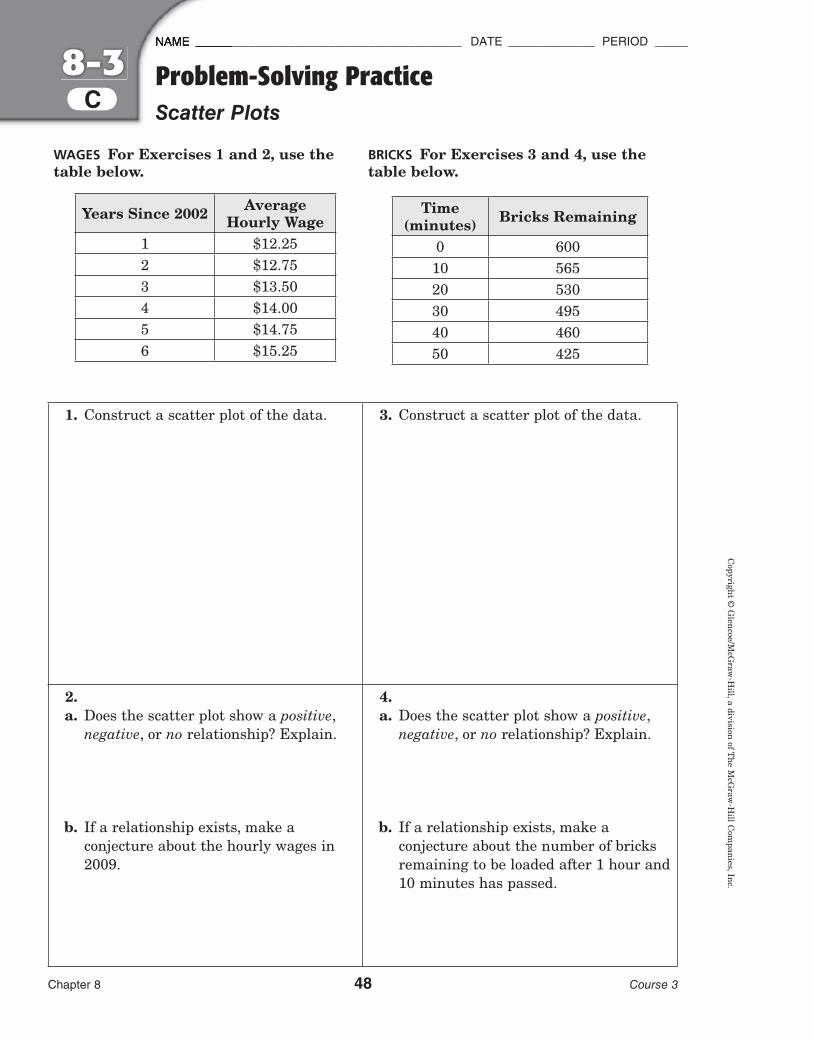
NAME ________________________________________ DATE _____________ PERIOD _____
Pdf Crx
Chapter 8 48 Course 3
Copyright ©
Glencoe/M
cGraw
-Hill, a division of T
he McG
raw-H
ill Com
panies, Inc.8-3
CProblem-Solving PracticeScatter Plots
WAGES For Exercises 1 and 2, use the table below.
Years Since 2002 Average Hourly Wage
1 $12.252 $12.753 $13.504 $14.005 $14.756 $15.25
BRICKS For Exercises 3 and 4, use the table below.
Time (minutes) Bricks Remaining
0 60010 56520 53030 49540 46050 425
1. Construct a scatter plot of the data. 3. Construct a scatter plot of the data.
2. a. Does the scatter plot show a positive,
negative, or no relationship? Explain.
b. If a relationship exists, make a conjecture about the hourly wages in 2009.
4. a. Does the scatter plot show a positive,
negative, or no relationship? Explain.
b. If a relationship exists, make a conjecture about the number of bricks remaining to be loaded after 1 hour and 10 minutes has passed.
045_050_FLCRMC3C08_892307.indd 48045_050_FLCRMC3C08_892307.indd 48 1/23/09 8:02:46 AM1/23/09 8:02:46 AM

NAME ________________________________________ DATE _____________ PERIOD _____
Pdf Crx
Chapter 8 49 Course 3
Cop
yrig
ht ©
Gle
ncoe
/McG
raw
-Hill
, a d
ivis
ion
of T
he M
cGra
w-H
ill C
ompa
nies
, Inc
.8-3
CEnrich
TranslationsA sporting goods store keeps its weekly sales information organized in a table similar to the one shown at the right. At the end of the month, the manager graphs the data for each week on a single graph. Unfortunately, after graphing the data shown in the table, the manager realizes that the sales figures are not for days 1–7 but for days 15–21. Thus the ordered pairs he graphed, (1, 200), (2,350), …, (7, 300), are not correct. A concept known as a translation can help. It moves all points on a plane the same distance and the same direction. The manager would like to move all of his points 14 units to the right. The coordinates of the translated points would have the following pattern.
(x, y) → (x + 14, y)
The manager can now use the translation to build the correct table and move the graphed points 14 units to the right.
(1, 200) → (1 + 14, 200) = (15, 200)
(2, 350) → (2 + 14, 350) = (16, 350)
(7, 300) → (7 + 14, 300) = (21, 300)
Exercises
Use the given translation to complete each table.
1. (x, y) → (x-3, y) 2. (x, y) → (x, y + 2) 3. (x, y) → (x – 2, y + 4)
x y4 67 39 2
x y3 14 -22 2
x y3 58 211 9
Day Sales ($)1 2002 3503 4754 3005 5006 2757 300
045_050_FLCRMC3C08_892307.indd 49045_050_FLCRMC3C08_892307.indd 49 1/23/09 8:02:51 AM1/23/09 8:02:51 AM

NAME ________________________________________ DATE _____________ PERIOD _____
PDF pass
Chapter 8 50 Course 3
Copyright ©
Glencoe/M
cGraw
-Hill, a division of T
he McG
raw-H
ill Com
panies, Inc.8-3
C
Make a scatter plot on your calculator to interpret data and find relationships.
Make a scatter plot for the data in the table at the right. Determine whether the scatter plot shows a positive, negative, or no relationship between the two sets of data.
Step 1 Clear all lists. [MEM] 6
Step 2 Open the List feature.
Step 3 Enter the data from the x-column in L1. Press after each value.
Step 4 Enter the data from the y-column in L2.
Step 5 Set up Plot 1. [PLOT] 1
Use Scatter Plot.
Step 6 Set the window and plot. 7
Step 7 Interpret the graph.
The points are spread out and do not follow any pattern. There is no relationship in this data. If the points follow an upward pattern, they have a positive relationship. If they follow a downward pattern, they have a negative relationship.
Use a graphing calculator to make scatter plots of the data sets. Determine whether each scatter plot shows a positive, negative, or no relationship.
1. x y1 79 1216 2428 337 1014 204 924 3130 3527 33
2. x y64 8
100 1226 438 650 10
111 11150 128 330 5
170 15
T1-73 ActivityScatter Plots
Example x y26 137 92 64 12
28 1147 1621 5
045_050_FLCRMC3C08_892307.indd 50045_050_FLCRMC3C08_892307.indd 50 12/30/08 8:09:30 PM12/30/08 8:09:30 PM

NAME ________________________________________ DATE _____________ PERIOD _____
PDF Pass
Cop
yrig
ht ©
Gle
ncoe
/McG
raw
-Hill
, a d
ivis
ion
of T
he M
cGra
w-H
ill C
ompa
nies
, Inc
.8-3
D
Chapter 8 51 Course 3
Lines of Best Fit
POPULATION Wayne found the following information on the U.S. Census Bureau’s Web site. The data in the table display the population of Florida at the beginning of each decade, in millions of people. The x-axis in the table is the number of years since 1900. So, “0” represents 1900, “10” represents 1910, and so on. He wants to know if he can predict Florida’s population in 2030.
Florida’s Population in Years Since 1900 (millions)
0 10 20 30 40 50 60 70 80 90 100 1100.53 0.75 0.97 1.47 1.90 2.77 4.95 6.79 9.75 12.94 15.98 19.31*
* projected
ACTIVITY
Step 1 Make a scatter plot for the data.
Flor
ida’
s Pop
ulat
ion
(mill
ions
)
63
0
129
2427
211815
20 40 60 80 100 120
Years Since 1900
y
x
Step 2 Use a piece of uncooked spaghetti to make a line that goes through most of the data points.
Step 3 Look at the point where the spaghetti has an x-value of 130 (year 2030). When the x-value is 130, the y-value is 21.5.
A prediction for Florida’s population in 2030 is 21,500,000.
Analyze the Results
1. Is it possible to use this kind of scatter plot to predict the population of each of the 50 states in 2030? Explain.
2. Refer to the scatter plot above. Is this method always valid when making a prediction? Explain.
3. Research and collect a set of data that has a positive or negative relationship. Display your data in a scatter plot. Use the method in the activity to make a prediction about the data in the scatter plot.
051_057_FLCRMC3C08_892307.indd 51051_057_FLCRMC3C08_892307.indd 51 7/25/09 9:19:27 AM7/25/09 9:19:27 AM
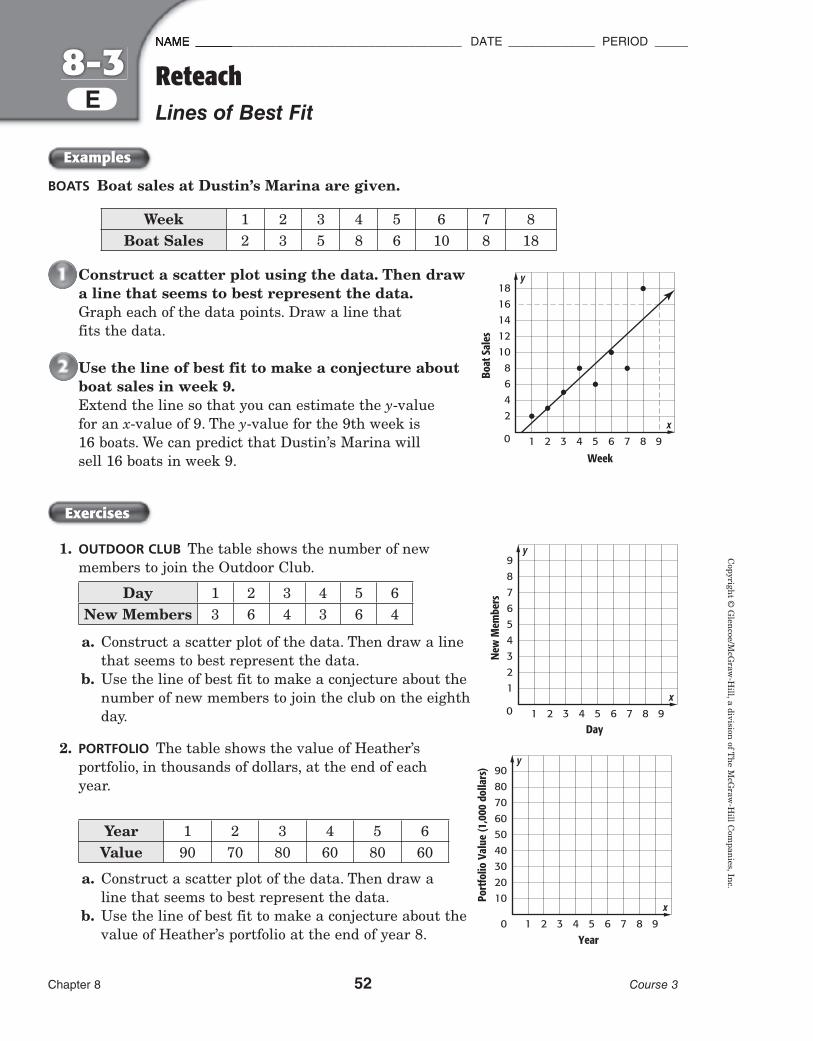
NAME ________________________________________ DATE _____________ PERIOD _____
PDF Pass
Copyright ©
Glencoe/M
cGraw
-Hill, a division of T
he McG
raw-H
ill Com
panies, Inc.8-3
E
Chapter 8 52 Course 3
ReteachLines of Best Fit
BOATS Boat sales at Dustin’s Marina are given.
Week 1 2 3 4 5 6 7 8Boat Sales 2 3 5 8 6 10 8 18
Construct a scatter plot using the data. Then draw a line that seems to best represent the data.Graph each of the data points. Draw a line that fits the data.
Use the line of best fit to make a conjecture about boat sales in week 9.Extend the line so that you can estimate the y-value for an x-value of 9. The y-value for the 9th week is 16 boats. We can predict that Dustin’s Marina will sell 16 boats in week 9.
Exercises
1. OUTDOOR CLUB The table shows the number of new members to join the Outdoor Club.
Day 1 2 3 4 5 6
New Members 3 6 4 3 6 4
a. Construct a scatter plot of the data. Then draw a line that seems to best represent the data.
b. Use the line of best fit to make a conjecture about the number of new members to join the club on the eighth day.
2. PORTFOLIO The table shows the value of Heather’sportfolio, in thousands of dollars, at the end of each year.
Year 1 2 3 4 5 6Value 90 70 80 60 80 60
a. Construct a scatter plot of the data. Then draw a line that seems to best represent the data.
b. Use the line of best fit to make a conjecture about the value of Heather’s portfolio at the end of year 8.
Examples
Boat
Sal
es
42
0
86
1618
141210
2 4 6 81 3 5 7 9
Week
y
x
New
Mem
bers
21
0
43
89
765
2 4 6 81 3 5 7 9Day
y
x
Port
folio
Val
ue (1
,000
dol
lars
)
2010
0
4030
8090
706050
2 4 6 81 3 5 7 9Year
y
x
051_057_FLCRMC3C08_892307.indd 52051_057_FLCRMC3C08_892307.indd 52 7/25/09 10:42:25 AM7/25/09 10:42:25 AM
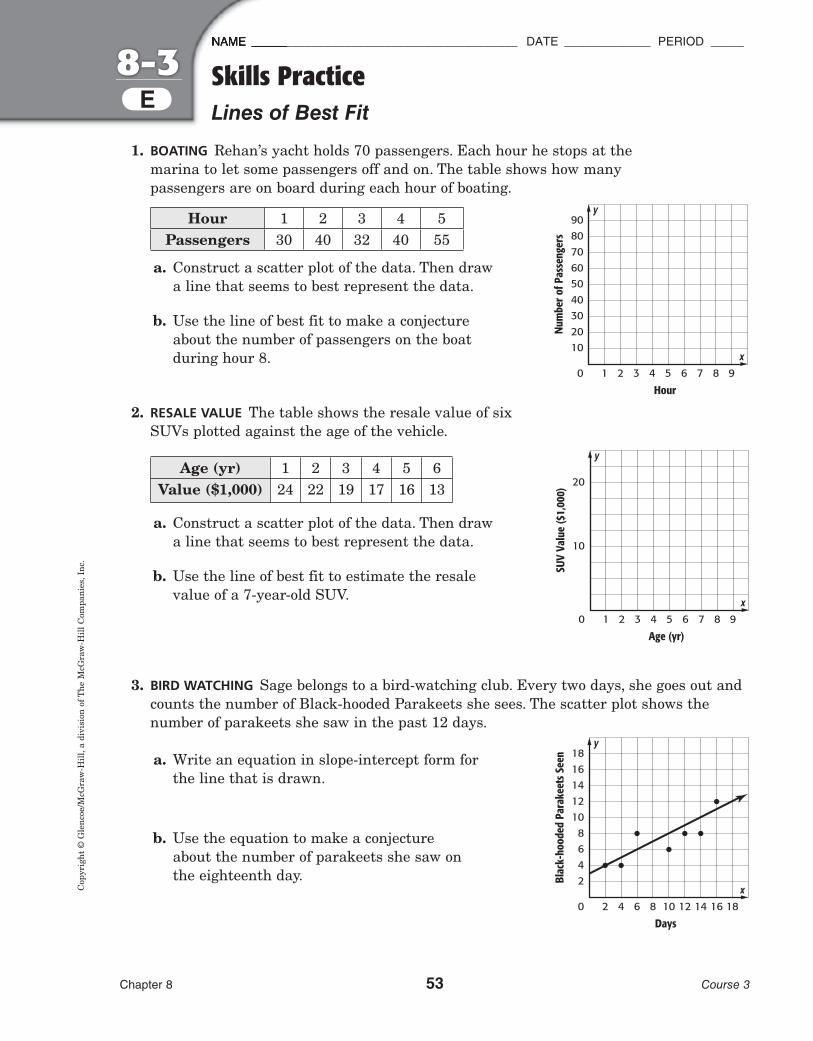
NAME ________________________________________ DATE _____________ PERIOD _____
PDF Pass
Cop
yrig
ht ©
Gle
ncoe
/McG
raw
-Hill
, a d
ivis
ion
of T
he M
cGra
w-H
ill C
ompa
nies
, Inc
.8-3
E
Chapter 8 53 Course 3
Skills PracticeLines of Best Fit
1. BOATING Rehan’s yacht holds 70 passengers. Each hour he stops at the marina to let some passengers off and on. The table shows how many passengers are on board during each hour of boating.
Hour 1 2 3 4 5
Passengers 30 40 32 40 55
a. Construct a scatter plot of the data. Then draw a line that seems to best represent the data.
b. Use the line of best fit to make a conjecture about the number of passengers on the boat during hour 8.
2. RESALE VALUE The table shows the resale value of six SUVs plotted against the age of the vehicle.
Age (yr) 1 2 3 4 5 6
Value ($1,000) 24 22 19 17 16 13
a. Construct a scatter plot of the data. Then draw a line that seems to best represent the data.
b. Use the line of best fit to estimate the resale value of a 7-year-old SUV.
3. BIRD WATCHING Sage belongs to a bird-watching club. Every two days, she goes out and counts the number of Black-hooded Parakeets she sees. The scatter plot shows the number of parakeets she saw in the past 12 days.
a. Write an equation in slope-intercept form for the line that is drawn.
b. Use the equation to make a conjecture about the number of parakeets she saw on the eighteenth day. Bl
ack-
hood
ed P
arak
eets
See
n
42
0
86
1618
141210
4 8 12 162 6 10 14 18
Days
y
x
Num
ber o
f Pas
seng
ers
2010
0
4030
8090
706050
2 4 6 81 3 5 7 9
Hour
y
x
SUV
Valu
e ($
1,00
0)
0
10
20
2 4 6 81 3 5 7 9
Age (yr)
y
x
051_057_FLCRMC3C08_892307.indd 53051_057_FLCRMC3C08_892307.indd 53 7/25/09 10:26:08 AM7/25/09 10:26:08 AM
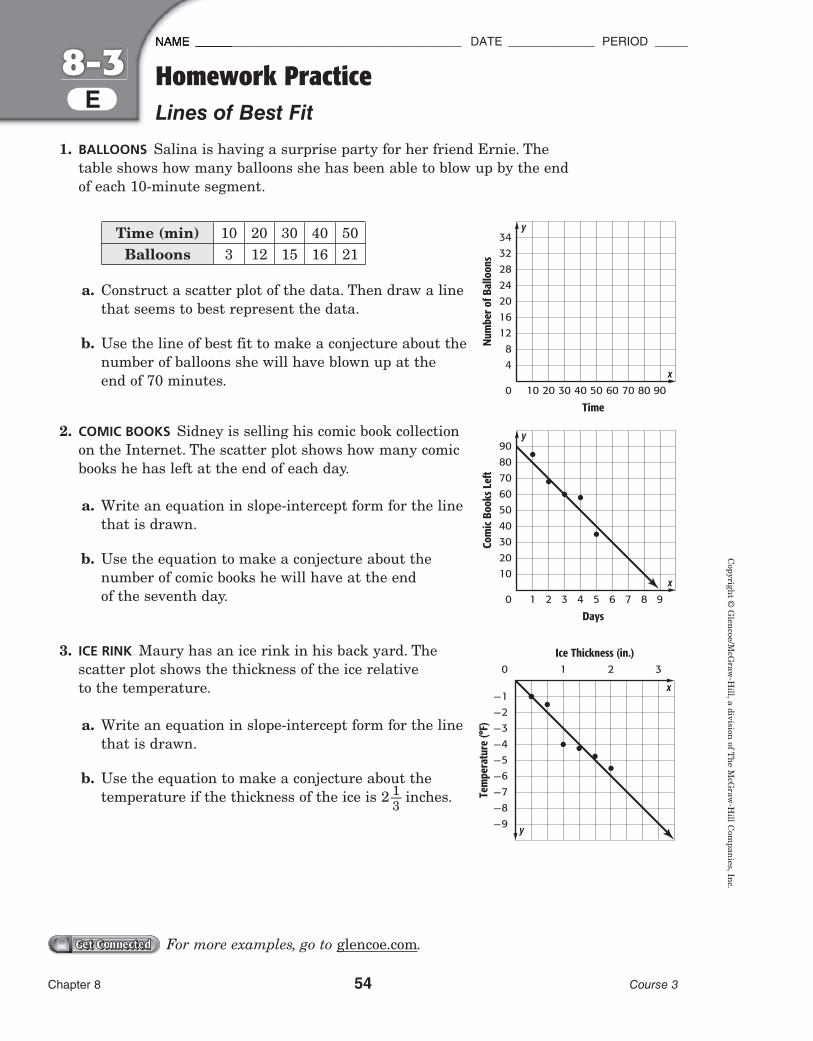
NAME ________________________________________ DATE _____________ PERIOD _____
PDF Pass
Copyright ©
Glencoe/M
cGraw
-Hill, a division of T
he McG
raw-H
ill Com
panies, Inc.8-3
E
Chapter 8 54 Course 3
Homework PracticeLines of Best Fit
1. BALLOONS Salina is having a surprise party for her friend Ernie. The table shows how many balloons she has been able to blow up by the end of each 10-minute segment.
Time (min) 10 20 30 40 50Balloons 3 12 15 16 21
a. Construct a scatter plot of the data. Then draw a line that seems to best represent the data.
b. Use the line of best fit to make a conjecture about the number of balloons she will have blown up at the end of 70 minutes.
2. COMIC BOOKS Sidney is selling his comic book collection on the Internet. The scatter plot shows how many comic books he has left at the end of each day.
a. Write an equation in slope-intercept form for the line that is drawn.
b. Use the equation to make a conjecture about the number of comic books he will have at the end of the seventh day.
3. ICE RINK Maury has an ice rink in his back yard. The scatter plot shows the thickness of the ice relative to the temperature.
a. Write an equation in slope-intercept form for the line that is drawn.
b. Use the equation to make a conjecture about the temperature if the thickness of the ice is 2 1 −
3 inches.
Com
ic Bo
oks L
eft
2010
0
4030
8090
706050
2 4 6 81 3 5 7 9
Days
y
x
Tem
pera
ture
(°F)
-4-5-6-7-8-9
0
-3
-1-2
1 2 3Ice Thickness (in.)
y
x
Num
ber o
f Bal
loon
s
84
0
1612
3234
282420
20 40 60 8010 30 50 70 90
Time
y
x
Get ConnectedGet Connected For more examples, go to glencoe.com.
051_057_FLCRMC3C08_892307.indd 54051_057_FLCRMC3C08_892307.indd 54 7/25/09 9:56:40 PM7/25/09 9:56:40 PM
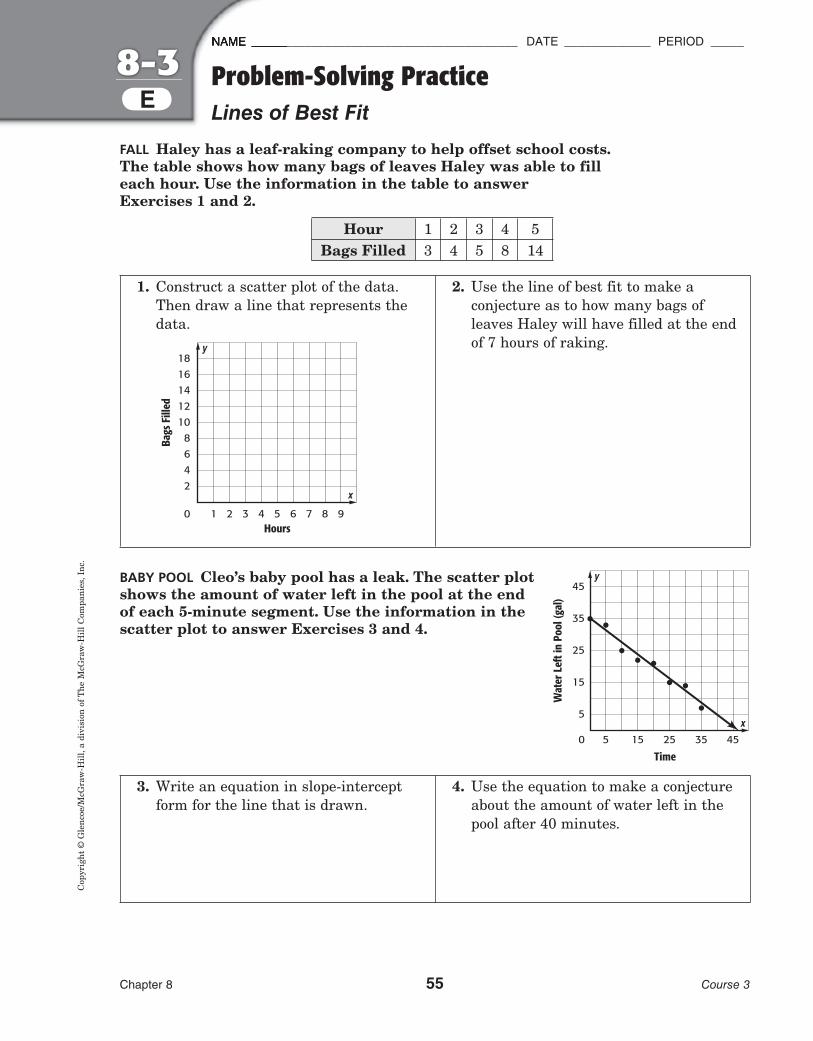
NAME ________________________________________ DATE _____________ PERIOD _____
PDF Pass
Cop
yrig
ht ©
Gle
ncoe
/McG
raw
-Hill
, a d
ivis
ion
of T
he M
cGra
w-H
ill C
ompa
nies
, Inc
.8-3
E
Chapter 8 55 Course 3
Problem-Solving PracticeLines of Best Fit
FALL Haley has a leaf-raking company to help offset school costs. The table shows how many bags of leaves Haley was able to fill each hour. Use the information in the table to answer Exercises 1 and 2.
Hour 1 2 3 4 5Bags Filled 3 4 5 8 14
1. Construct a scatter plot of the data. Then draw a line that represents the data.
Bags
Fill
ed
2
0
4
81012141618
6
1 2 3 4 5 6 7 8 9Hours
y
x
2. Use the line of best fit to make a conjecture as to how many bags of leaves Haley will have filled at the end of 7 hours of raking.
BABY POOL Cleo’s baby pool has a leak. The scatter plot shows the amount of water left in the pool at the end of each 5-minute segment. Use the information in the scatter plot to answer Exercises 3 and 4.
3. Write an equation in slope-intercept form for the line that is drawn.
4. Use the equation to make a conjecture about the amount of water left in the pool after 40 minutes.
Wat
er L
eft i
n Po
ol (g
al)
5
0
15
45
35
25
5 15 25 35 45
Time
y
x
051_057_FLCRMC3C08_892307.indd 55051_057_FLCRMC3C08_892307.indd 55 7/25/09 10:27:35 AM7/25/09 10:27:35 AM
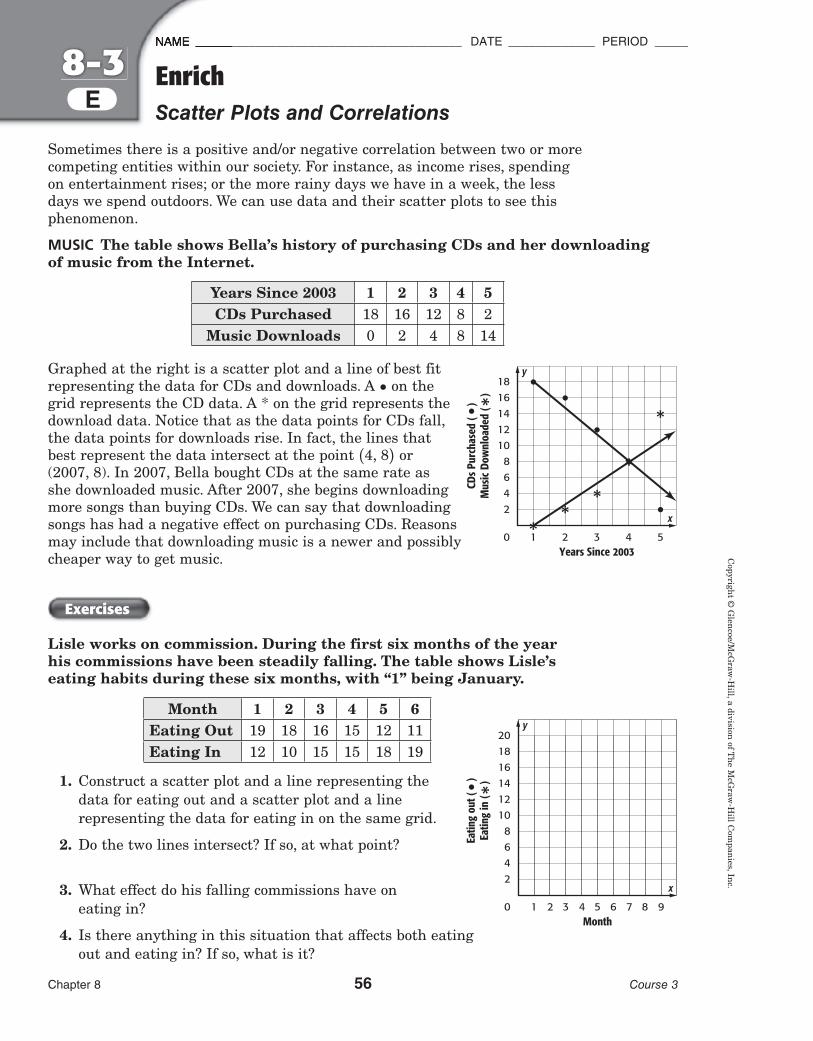
NAME ________________________________________ DATE _____________ PERIOD _____
PDF Pass
Copyright ©
Glencoe/M
cGraw
-Hill, a division of T
he McG
raw-H
ill Com
panies, Inc.8-3
E
Chapter 8 56 Course 3
EnrichScatter Plots and Correlations
Sometimes there is a positive and/or negative correlation between two or more competing entities within our society. For instance, as income rises, spending on entertainment rises; or the more rainy days we have in a week, the less days we spend outdoors. We can use data and their scatter plots to see this phenomenon.
MUSIC The table shows Bella’s history of purchasing CDs and her downloading of music from the Internet.
Years Since 2003 1 2 3 4 5CDs Purchased 18 16 12 8 2
Music Downloads 0 2 4 8 14
Graphed at the right is a scatter plot and a line of best fit representing the data for CDs and downloads. A • on the grid represents the CD data. A * on the grid represents the download data. Notice that as the data points for CDs fall, the data points for downloads rise. In fact, the lines that best represent the data intersect at the point (4, 8) or (2007, 8). In 2007, Bella bought CDs at the same rate as she downloaded music. After 2007, she begins downloading more songs than buying CDs. We can say that downloading songs has had a negative effect on purchasing CDs. Reasons may include that downloading music is a newer and possibly cheaper way to get music.
Exercises
Lisle works on commission. During the first six months of the year his commissions have been steadily falling. The table shows Lisle’s eating habits during these six months, with “1” being January.
Month 1 2 3 4 5 6Eating Out 19 18 16 15 12 11Eating In 12 10 15 15 18 19
1. Construct a scatter plot and a line representing the data for eating out and a scatter plot and a line representing the data for eating in on the same grid.
2. Do the two lines intersect? If so, at what point?
3. What effect do his falling commissions have on eating in?
4. Is there anything in this situation that affects both eating out and eating in? If so, what is it?
2
0
4
81012141618
6
1 2 3 4 5Years Since 2003
y
x*
*
CDs P
urch
ased
(
)M
usic
Dow
nloa
ded
( ) *
*
*
*
2
0
4
81012141618
6
1 32 5 64 7 8 9Month
20y
x
Eatin
g ou
t (
)Ea
ting
in (
) *
051_057_FLCRMC3C08_892307.indd 56051_057_FLCRMC3C08_892307.indd 56 7/25/09 9:35:14 AM7/25/09 9:35:14 AM
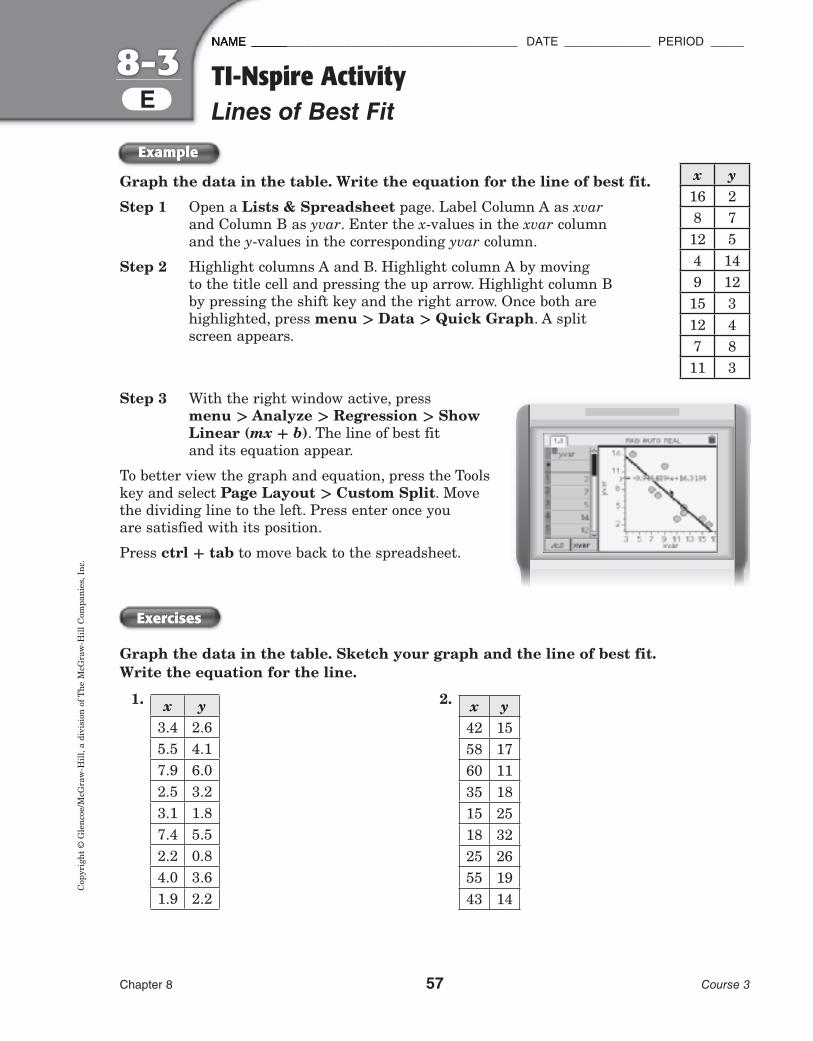
NAME ________________________________________ DATE _____________ PERIOD _____
Pdf Crx
Cop
yrig
ht ©
Gle
ncoe
/McG
raw
-Hill
, a d
ivis
ion
of T
he M
cGra
w-H
ill C
ompa
nies
, Inc
.8-3
E
Chapter 8 57 Course 3
TI-Nspire ActivityLines of Best Fit
Graph the data in the table. Write the equation for the line of best fit.
Step 1 Open a Lists & Spreadsheet page. Label Column A as xvar and Column B as yvar. Enter the x-values in the xvar column and the y-values in the corresponding yvar column.
Step 2 Highlight columns A and B. Highlight column A by moving to the title cell and pressing the up arrow. Highlight column B by pressing the shift key and the right arrow. Once both are highlighted, press menu > Data > Quick Graph. A split screen appears.
Step 3 With the right window active, press menu > Analyze > Regression > Show Linear (mx + b). The line of best fit and its equation appear.
To better view the graph and equation, press the Tools key and select Page Layout > Custom Split. Move the dividing line to the left. Press enter once you are satisfied with its position.
Press ctrl + tab to move back to the spreadsheet.
Exercises
Graph the data in the table. Sketch your graph and the line of best fit. Write the equation for the line.
1. x y3.4 2.65.5 4.17.9 6.02.5 3.23.1 1.87.4 5.52.2 0.84.0 3.61.9 2.2
2. x y42 1558 1760 1135 1815 2518 3225 2655 1943 14
x y16 28 7
12 54 149 12
15 312 47 8
11 3
Example
051_057_FLCRMC3C08_892307.indd 57051_057_FLCRMC3C08_892307.indd 57 1/23/09 8:01:35 AM1/23/09 8:01:35 AM
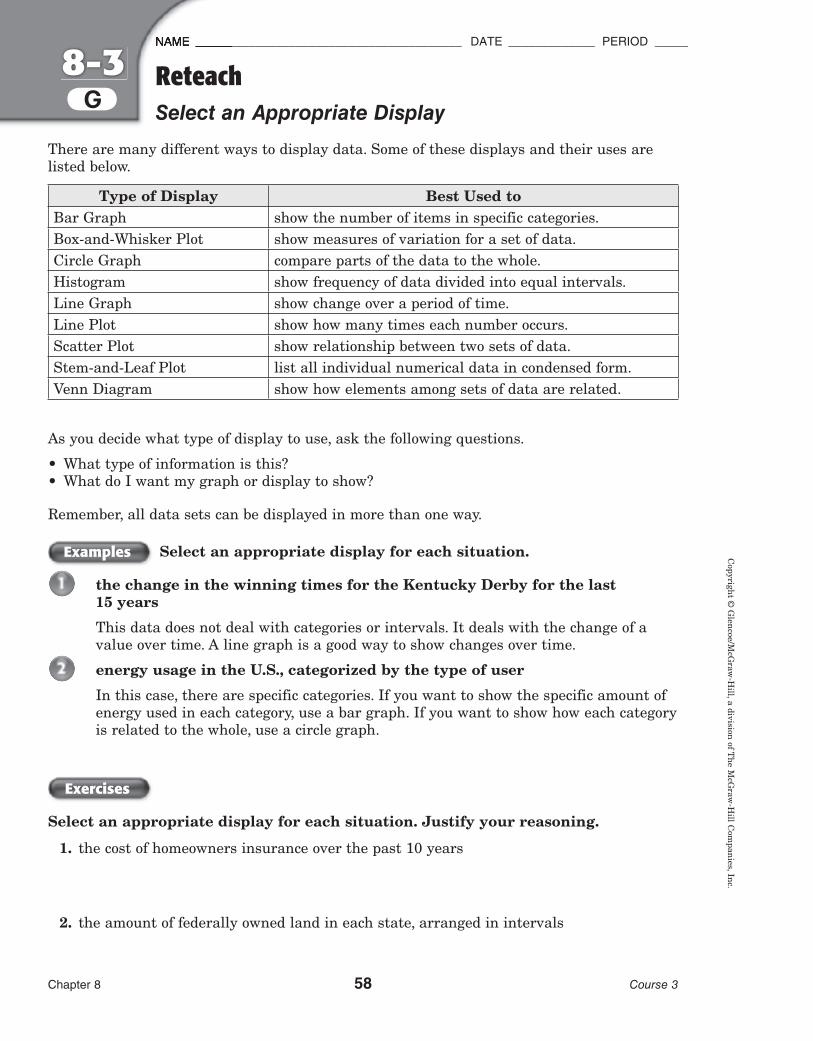
NAME ________________________________________ DATE _____________ PERIOD _____
PDF Pass
Copyright ©
Glencoe/M
cGraw
-Hill, a division of T
he McG
raw-H
ill Com
panies, Inc.8-3
G
Chapter 8 58 Course 3
ReteachSelect an Appropriate Display
There are many different ways to display data. Some of these displays and their uses are listed below.
Type of Display Best Used toBar Graph show the number of items in specific categories.Box-and-Whisker Plot show measures of variation for a set of data.Circle Graph compare parts of the data to the whole.Histogram show frequency of data divided into equal intervals.Line Graph show change over a period of time.Line Plot show how many times each number occurs.Scatter Plot show relationship between two sets of data.Stem-and-Leaf Plot list all individual numerical data in condensed form.Venn Diagram show how elements among sets of data are related.
As you decide what type of display to use, ask the following questions.
• What type of information is this?• What do I want my graph or display to show?
Remember, all data sets can be displayed in more than one way.
Select an appropriate display for each situation.
the change in the winning times for the Kentucky Derby for the last 15 years
This data does not deal with categories or intervals. It deals with the change of a value over time. A line graph is a good way to show changes over time.
energy usage in the U.S., categorized by the type of user
In this case, there are specific categories. If you want to show the specific amount of energy used in each category, use a bar graph. If you want to show how each category is related to the whole, use a circle graph.
Exercises
Select an appropriate display for each situation. Justify your reasoning.
1. the cost of homeowners insurance over the past 10 years
2. the amount of federally owned land in each state, arranged in intervals
Examples
058_062_FLCRMC3C08_892307.indd 58058_062_FLCRMC3C08_892307.indd 58 7/25/09 9:38:58 AM7/25/09 9:38:58 AM
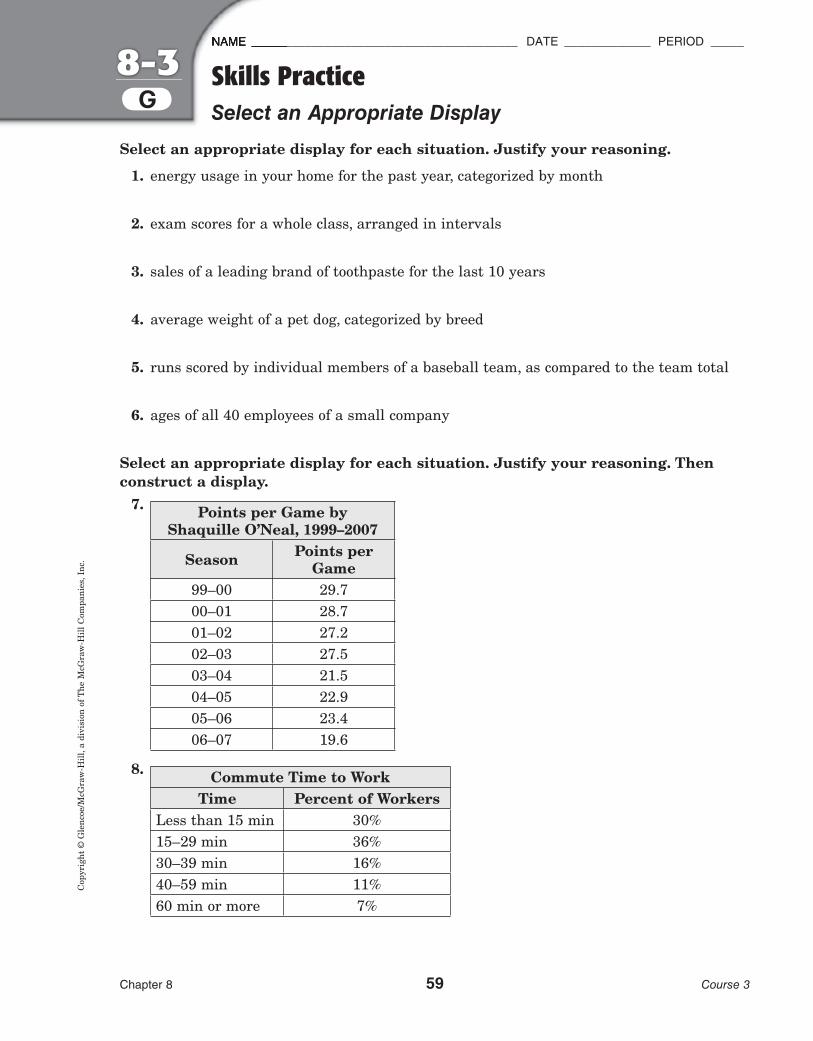
NAME ________________________________________ DATE _____________ PERIOD _____
PDF pass
Cop
yrig
ht ©
Gle
ncoe
/McG
raw
-Hill
, a d
ivis
ion
of T
he M
cGra
w-H
ill C
ompa
nies
, Inc
.8-3
G
Chapter 8 59 Course 3
Select an appropriate display for each situation. Justify your reasoning.
1. energy usage in your home for the past year, categorized by month
2. exam scores for a whole class, arranged in intervals
3. sales of a leading brand of toothpaste for the last 10 years
4. average weight of a pet dog, categorized by breed
5. runs scored by individual members of a baseball team, as compared to the team total
6. ages of all 40 employees of a small company
Select an appropriate display for each situation. Justify your reasoning. Then construct a display. 7. Points per Game by
Shaquille O’Neal, 1999–2007
Season Points per Game
99–00 29.700–01 28.701–02 27.202–03 27.503–04 21.504–05 22.905–06 23.406–07 19.6
8. Commute Time to WorkTime Percent of Workers
Less than 15 min 30%15–29 min 36%30–39 min 16%40–59 min 11%60 min or more 7%
Skills PracticeSelect an Appropriate Display
058_062_FLCRMC3C08_892307.indd 59058_062_FLCRMC3C08_892307.indd 59 12/30/08 8:14:25 PM12/30/08 8:14:25 PM

NAME ________________________________________ DATE _____________ PERIOD _____
PDF Pass
Copyright ©
Glencoe/M
cGraw
-Hill, a division of T
he McG
raw-H
ill Com
panies, Inc.8-3
G
Chapter 8 60 Course 3
Select an appropriate display for each situation. Justify your reasoning.
1. prices of athletic shoes in the store arranged by intervals
2. the numbers of teens who spend Saturdays doing homework, playing, and/or doing chores
3. the number of each of four kinds of trees found in the forest
4. the spread of the run times for the first 1 − 4 of the runners completing a marathon
Select an appropriate display for each situation. Justify your reasoning. Then construct the display.
5. Heights of Mountains on the Moon
Height Percent of the Mountains
Less than 1 km 11.81-2 km 17.72-3 km 17.73-4 km 35.3More than 4 km 17.7
6. WORK Jim worked 1 hour on Monday. On Tuesday, he worked 2 more hours than he worked on Monday. On Wednesday, he worked 2 more hours than he worked on Tuesday. The pattern continued through Friday.
Homework PracticeSelect an Appropriate Display
Get ConnectedGet Connected For more examples, go to glencoe.com.
058_062_FLCRMC3C08_892307.indd 60058_062_FLCRMC3C08_892307.indd 60 7/25/09 9:40:15 AM7/25/09 9:40:15 AM
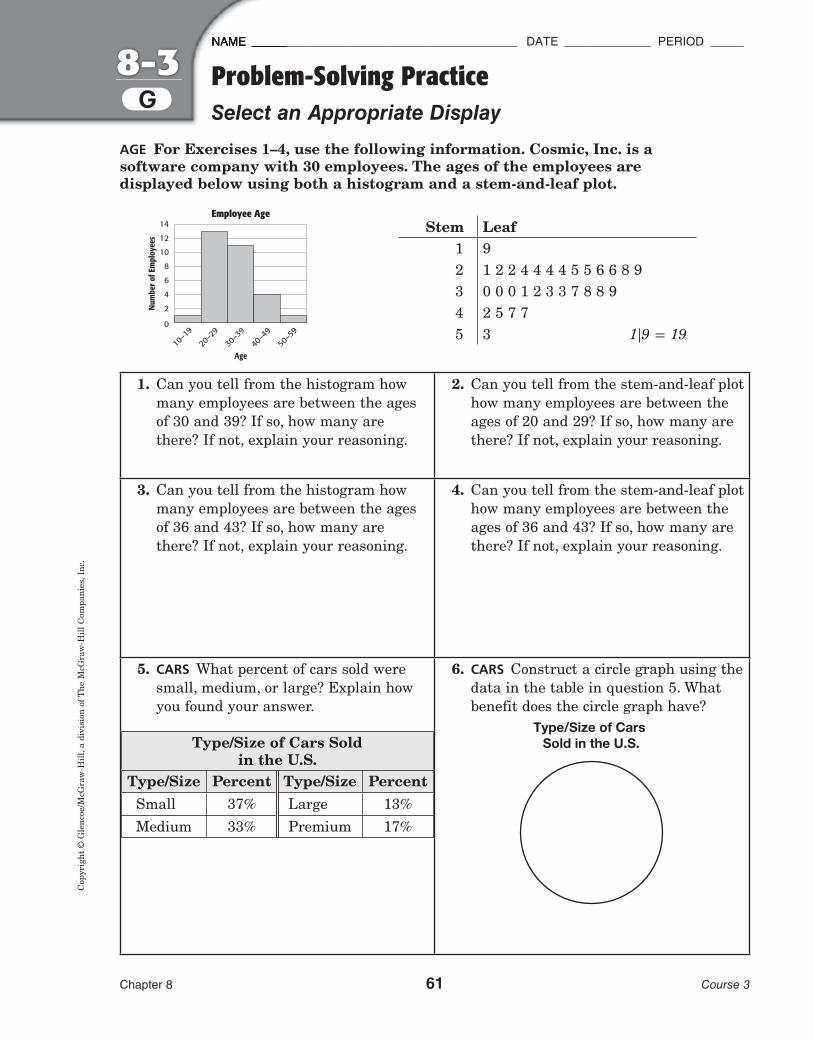
NAME ________________________________________ DATE _____________ PERIOD _____
PDF Pass Crx
Cop
yrig
ht ©
Gle
ncoe
/McG
raw
-Hill
, a d
ivis
ion
of T
he M
cGra
w-H
ill C
ompa
nies
, Inc
.8-3
G
Chapter 8 61 Course 3
Problem-Solving PracticeSelect an Appropriate Display
AGE For Exercises 1–4, use the following information. Cosmic, Inc. is a software company with 30 employees. The ages of the employees are displayed below using both a histogram and a stem-and-leaf plot.
1. Can you tell from the histogram how many employees are between the ages of 30 and 39? If so, how many are there? If not, explain your reasoning.
2. Can you tell from the stem-and-leaf plot how many employees are between the ages of 20 and 29? If so, how many are there? If not, explain your reasoning.
3. Can you tell from the histogram how many employees are between the ages of 36 and 43? If so, how many are there? If not, explain your reasoning.
4. Can you tell from the stem-and-leaf plot how many employees are between the ages of 36 and 43? If so, how many are there? If not, explain your reasoning.
5. CARS What percent of cars sold were small, medium, or large? Explain how you found your answer.
6. CARS Construct a circle graph using the data in the table in question 5. What benefit does the circle graph have?
Type/Size of Cars Sold in the U.S.
2
0
4
6
8
10
12
14
10–1
9
20–2
9
30–3
9
40–4
9
50–5
9
Age
Num
ber o
f Em
ploy
ees
Employee AgeStem Leaf
1 92 1 2 2 4 4 4 4 5 5 6 6 8 93 0 0 0 1 2 3 3 7 8 8 94 2 5 7 75 3 1|9 = 19
Type/Size of Cars Sold in the U.S.
Type/Size Percent Type/Size PercentSmall 37% Large 13%Medium 33% Premium 17%
058_062_FLCRMC3C08_892307.indd 61058_062_FLCRMC3C08_892307.indd 61 7/29/09 10:06:17 AM7/29/09 10:06:17 AM
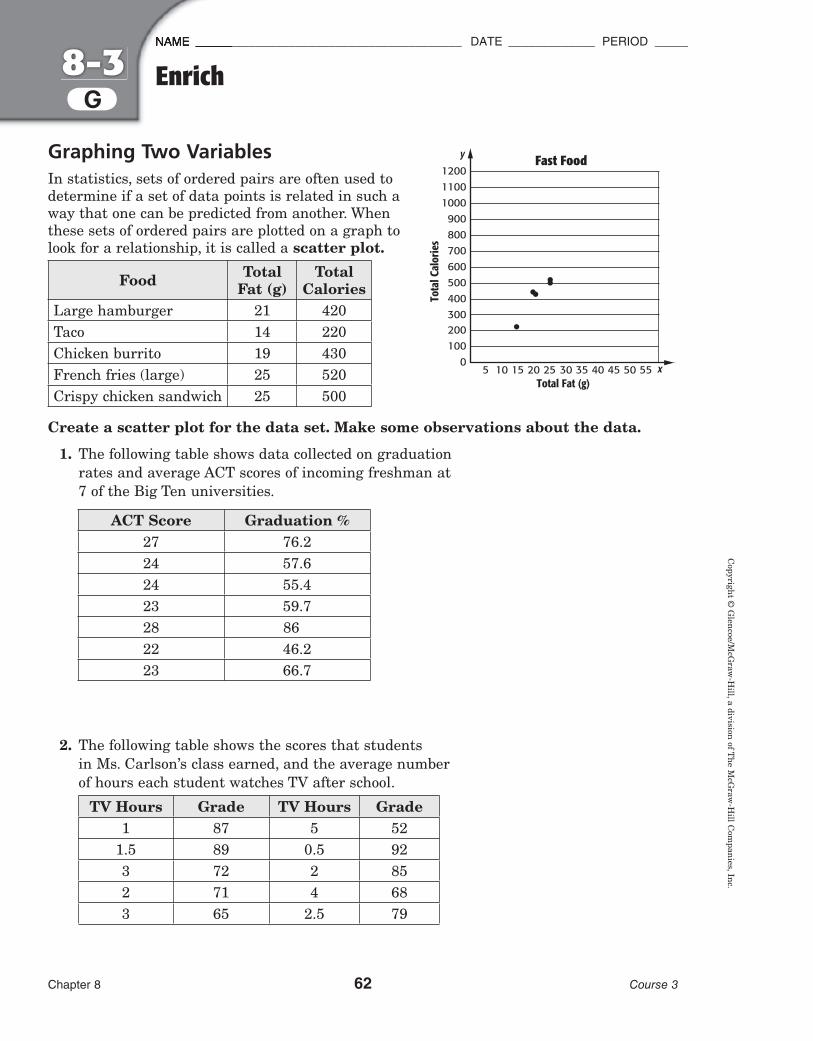
NAME ________________________________________ DATE _____________ PERIOD _____
Pdf Crx
Copyright ©
Glencoe/M
cGraw
-Hill, a division of T
he McG
raw-H
ill Com
panies, Inc.8-3
G
Chapter 8 62 Course 3
Graphing Two VariablesIn statistics, sets of ordered pairs are often used to determine if a set of data points is related in such a way that one can be predicted from another. When these sets of ordered pairs are plotted on a graph to look for a relationship, it is called a scatter plot.
Create a scatter plot for the data set. Make some observations about the data.
1. The following table shows data collected on graduation rates and average ACT scores of incoming freshman at 7 of the Big Ten universities.
2. The following table shows the scores that students in Ms. Carlson’s class earned, and the average number of hours each student watches TV after school.
TV Hours Grade TV Hours Grade1 87 5 52
1.5 89 0.5 923 72 2 852 71 4 683 65 2.5 79
Enrich
Tota
l Cal
orie
s
400300200100
0
500600700800900
100011001200
5 10 15 20 25 30 35 40 45 50 55Total Fat (g)
Fast Foody
x
Food Total Fat (g)
TotalCalories
Large hamburger 21 420 Taco 14 220Chicken burrito 19 430French fries (large) 25 520Crispy chicken sandwich 25 500
ACT Score Graduation %27 76.224 57.624 55.423 59.728 8622 46.223 66.7
058_062_FLCRMC3C08_892307.indd 62058_062_FLCRMC3C08_892307.indd 62 1/23/09 8:02:15 AM1/23/09 8:02:15 AM

NAME ________________________________________ DATE _____________ PERIOD _____
PDF Pass Crx
Cop
yrig
ht ©
Gle
ncoe
/McG
raw
-Hill
, a d
ivis
ion
of T
he M
cGra
w-H
ill C
ompa
nies
, Inc
.
1. Where have you used the measures of central tendency and the measures of variation? Explain.
2. When graphing a scatter plot, the x and y variables
are related in one of three ways. Identify each of
these relationships. Explain in your own words
what each relationship means.
3. Name one idea that still confuses you. Why are you confused?
Chapter 8 63 Course 3
063_074_FLCRMC3C08_892307.indd 63063_074_FLCRMC3C08_892307.indd 63 7/29/09 10:22:26 AM7/29/09 10:22:26 AM

PDF Pass
ISBN: 978-0-07-892307-4MHID: 0-07-892307-7
www.glencoe.com
Contents Chapter 0 Start Smart Chapter 1 Rational Numbers and Percent Chapter 2 Expressions and Functions Chapter 3 Linear Functions and Systems of Equations Chapter 4 Equations and Inequalities Chapter 5 Operations on Real Numbers Chapter 6 Angles and Lines Chapter 7 Similar Triangles and the Pythagorean Theorem Chapter 8 Data Analysis Chapter 9 Units of Measure Chapter 10 Measurement: Area and Volume Chapter 11 Properties and Multi-Step Equations and InequalitiesChapter 12 Nonlinear Functions and Polynomials
glencoe.com
Also available online:
MC'11_CRM3_c8_FL_892307-7.indd 2MC'11_CRM3_c8_FL_892307-7.indd 2 2/11/09 11:58:10 PM2/11/09 11:58:10 PM