ccesscc e s s growth and shrinkage in antarctic krill … · tarling et al.: body-length shrinkage...
TRANSCRIPT
MARINE ECOLOGY PROGRESS SERIESMar Ecol Prog Ser
Vol. 547: 61–78, 2016doi: 10.3354/meps11634
Published April 7
INTRODUCTION
Antarctic krill Euphausia superba has long beenrecognised as an integral component of manyAntarctic marine food webs (Marr 1962, Miller &Hampton 1989, Hill et al. 2012) as a result of its highlevels of abundance globally (Everson 1977, Gulland1983, Atkinson et al. 2009), its nutritional content(Pond et al. 1995) and its tendency to form swarmsand thus concentrate biomass (Clarke 1984, El-Sayed& McWhinnie 1979, Tarling et al. 2009). For thesesame reasons, it is also a readily exploitable resource(Miller and Agnew 2000) and it has now been com-mercially harvested for almost 40 yr. The fishery is
managed under the Convention for the Conservationof Antarctic Marine Living Recourses (CCAMLR),which recognises the need to limit fishery impacts onboth the krill stock and the predator populations thatfeed on it. The fishery is currently managed with aninterim catch limit and CCAMLR is actively develop-ing a long-term management approach.
Effective fisheries management relies on a goodunderstanding of the population dynamics of theexploited resource (Hilborn & Walters 1992, Quinn &Deriso 1999). These dynamics are often representedin models that assimilate data to assess stock status(Kinzey et al. 2015) and project the consequences offuture fishing. Critical population parameters in such
© The authors 2016. Open Access under Creative Commons byAttribution Licence. Use, distribution and reproduction are un -restricted. Authors and original publication must be credited.
Publisher: Inter-Research · www.int-res.com
*Corresponding author: [email protected]
Growth and shrinkage in Antarctic krill Euphausia superba is sex-dependent
G. A. Tarling1,*, S. Hill1, H. Peat1, S. Fielding1, C. Reiss2, A. Atkinson3
1British Antarctic Survey, Natural Environment Research Council, High Cross, Madingley Road, Cambridge CB3 0ET, UK2Southwest Fisheries Science Center, 8604 La Jolla Shores Drive, La Jolla, CA 92037, USA
3Plymouth Marine Laboratory, Prospect Place, The Hoe, Plymouth PL1 3DH, UK
ABSTRACT: The ability of Antarctic krill Euphausia superba Dana to withstand the overwinteringperiod is critical to their success. Laboratory evidence suggests that krill may shrink in bodylength during this time in response to the low availability of food. Nevertheless, verification thatkrill can shrink in the natural environment is lacking because winter data are difficult to obtain.One of the few sources of winter krill population data is from commercial vessels. We examinedlength-frequency data of adult krill (>35 mm total body length) obtained from commercial vesselsin the Scotia-Weddell region and compared our results with those obtained from a combination ofscience and commercial sampling operations carried out in this region at other times of the year.Our analyses revealed body-length shrinkage in adult females but not males during winter, basedon both the tracking of modal size classes over seasons and sex-ratio patterns. Other explanatoryfactors, such as differential mortality, immigration and emigration, could not explain the observeddifferences. The same pattern was also observed at South Georgia and in the Western AntarcticPeninsula. Fitted seasonally modulated von Bertalanffy growth functions predicted a pattern ofoverwintering shrinkage in all body-length classes of females, but only stagnation in growth inmales. This shrinkage most likely reflects morphometric changes resulting from the contraction ofthe ovaries and is not necessarily an outcome of winter hardship. The sex-dependent changes thatwe observed need to be incorporated into life cycle and population dynamic models of this species, particularly those used in managing the fishery.
KEY WORDS: Southern Ocean · Population dynamics · Production · Life cycle · Fishery
OPENPEN ACCESSCCESS

Mar Ecol Prog Ser 547: 61–78, 201662
models include rates of recruitment, mortality andgrowth, total lifespan and maximum body size (Con-stable & de la Mare 1996, Miller & Agnew 2000).Nevertheless, estimation of some of these parametersfor Antarctic krill is far from straightforward and isstill subject to some controversy (Rosenberg et al.1986, Siegel & Nicol 2000, Kawaguchi et al. 2006,2007). In particular, growth rate has been shown tobe highly variable, both temporally (Kawaguchi et al.2006) and spatially (Quetin et al. 2003, Atkinson et al.2006), making the relationship between age andbody length a complex one (Nicol 2000).
One of the major factors affecting the populationdynamics of Antarctic krill is the extended winter pe-riod, when food resources are limited. As well asusing lipid reserves and various alternative winterfood sources and feeding substrates (Quetin et al.1994, Schmidt et al. 2011, Meyer 2012), krill also ap-pear capable of utilising protein in somatic tissue andshrinking in body size during periods of low food in-take. This is clearly seen in field populations of larvalkrill during their first overwintering period (Daly2004, Meyer 2012). In adults, reports of shrinkagehave mainly come from laboratory incubation studies.Ikeda & Dixon (1982) maintained adult Antarctic krillin starved conditions for 211 d, during which timetheir body mass decreased by 45%, equivalent to adecrease in body length of 0.033 mm d−1. In a largebatch of adult krill maintained at Palmer station(Antarctic Peninsula), McWhinnie et al. (1979) re-ported shrinkage of 23% in body length in specimensmaintained during an overwintering period. Body-length shrinkage has since been reported in bothshort- and long-term incubation studies (Nicol et al.1992, Kawaguchi et al. 2006). Candy & Kawaguchi(2006) modelled a number of datasets generated fromincubation studies and concluded that maximumbody lengths were better predicted when allowingindividuals to shrink during over wintering periods.
Because the low-food conditions last for a largefraction of the year, whether growth is positive, neg-ative or zero during this time has a large influence onour estimates of size at age and longevity. From ini-tial estimates of a 2 to 3 yr life cycle in Antarctic krill(Bargmann 1945, Marr 1962, Mackintosh 1972),there is now a greater consensus that typical lifecycles last approximately 5 to 6 yr (Rosenberg et al.1986, Nicol 2000), by which time adults havespawned in 2 or 3 summer seasons (Cuzin-Roudy2000) and reached body lengths of between 55 and65 mm (Schmidt et al. 2014). However, there is stilluncertainty around whether the pattern of growth isthe same in males and females (Kawaguchi et al.
2006). Siegel & Loeb (1994), for instance, consideredthat males took 1 yr more than females to attain sexual maturity. However, Kawaguchi et al. (2007)posited that males matured earlier than females, andwere more likely to have a shorter life cycle, dying ata younger age than females. Resolution of this issueis critical to understanding patterns of sex-ratio biasover the course of the year, with further implicationsto recruitment and harvesting.
Another notable biological feature of both maleand female Antarctic krill is their ability to regresssecondary sexual characters. McWhinnie et al. (1979)observed this phenomenon while incubating speci-mens over winter. These individuals returned to pre-vious maturity stages the following summer. Thomas& Ikeda (1987) found the same pattern of regressionwhen exposing incubated specimens to sub-optimalfood conditions. These results provided support tothe earlier assertion by Makarov (1976) that sexualregression must be taking place in field populations,given his observation of a high incidence of sexuallyimmature specimens in August.
Despite laboratory evidence that krill are capable ofdecreasing their body size and regressing their sexualcharacters, there remains considerable debate overwhether such traits are common in adult field popula-tions, particularly with regards to body-length fre-quency distributions (Quetin et al. 1994). For instance,Ettershank (1983) concluded that there was body-length shrinkage during winter in samples taken byStepnik (1982) from the South Shetland Islands (West-ern Antarctic Peninsula [WAP]). However, in a re-analysis of this data, McClatchie (1988) found slowpositive growth. Quetin & Ross (1991) found negativein situ growth in adult krill collected in the BransfieldStrait (WAP) in August and September 1985.
Body-size distribution data are difficult to interpretin situations where there may also be size-selectivemortality, immigration and emigration taking placein the sampled population. This is compounded bythe fact that Antarctic krill populations are in a con-stant state of flux through their interactions with thestrongly advective Southern Ocean currents (Thorpeet al. 2004, 2007). Certain age classes may be missingwithin a study area at any one particular samplingperiod, and the situation may change dramaticallybetween sampling periods. A further difficulty is thatvery few scientific sampling operations are carriedout during the winter period, necessitating a certainlevel of inference on overwintering population dy -namics. By contrast, commercial trawling for Ant -arctic krill has been very active during the australwinter. Body-length distributions, sex and develop-
Tarling et al.: Body-length shrinkage in Antarctic krill
ment stage are measured by observers on krill fishing vessels and reported to CCAMLR. In total,these measurements have been made on more than180 000 krill over the winter period.
In this study, we combine thousands of net sampleson which size distribution, sex and maturity weremeasured. Science-net samples collected over de -cades of sampling have been collated within theKRILLBASE database (Atkinson et al. 2009), whereasdata from fishery catches have been compiled byCCAMLR (www.ccamlr.org). We focus this study onthe Scotia-Weddell region (from ice-edge to PolarFront), where some of the highest concentrations ofkrill biomass occur (Atkinson et al. 2008) and almostall of the krill fishery operates (Croxall & Nicol 2004).In carrying out analyses on large-scale, long-termdata sets, we overcome one of the main difficulties ofinferring more general patterns from relativelysmall-scale surveys, which has beset many previousstudies of Antarctic krill population dynamics (Miller& Hampton 1989). This study also makes a particularfocus of the overwintering period through utilisationof data provided by the winter fishery, allowingdirect observations of how size-distribution patternschange during this poorly observed period and howthis influences present interpretations of growth tra-jectories and life-cycle duration. Finally, in line withthe recommendations of a recent study (Kawaguchiet al. 2007), the population dynamics of females andmales were considered separately, to elucidate dif-ferences in growth trajectories and the relative tim-ing of sexual maturity in both sexes.
METHODS
Databases
Two main databases of individual krill measure-ments were used to analyse the population dynamicsof Antarctic krill: one comprising data collected aspart of scientific surveys (KRILLBASE, Atkinson et al.2009; see Supplement 1 at www.int-res.com/ articles/suppl/m547p061_supp.pdf), the other comprising datacollected by observers on fishery operations as partof CCAMLR, (www.ccamlr.org; see Supplement 2 atwww.int-res.com/articles/ suppl/ m547p061_ supp .pdf).KRILLBASE contains measurements collected mainlybetween October and April (summer) whereas theCCAMLR data are more evenly spread betweensummer and winter, although records were lackingfor certain periods of the summer. Population dy -namic analyses were based on a combination of these
databases, where KRILLBASE data were used toassess the summer situation and CCAMLR data wereused to assess the situation during the overwinteringperiod. Differences in collection and measurementmethods, both within and between databases, neces-sitated a number of comparisons to be made to iden-tify the major biases. In particular, CCAMLR summerrecords were compared with those of KRILLBASE toidentify methodological biases between the data-bases. These comparisons led to the implementationof a number of pre-treatments to minimise error andbias when determining population structure. Theanalyses were focused on the Scotia-Weddell region,which we defined as being between the longitudes60° W and 20° W and south of latitude 56° S. The deci-sion to limit the analyses to this region was made tominimise the impact of geographic factors on ourresults, while encompassing the largest possiblebody of population data. Comparisons to other geo-graphic regions (South Georgia and WAP) were per-formed subsequently to examine levels of spatialcoherence in patterns of population dynamics.
KRILLBASE
In KRILLBASE, there were 3402 net hauls in theScotia-Weddell region on which body-length fre-quency measurements were made. They span fromthe Discovery Investigations (1926−1939) through tothe modern era. The hauls were carried out in both atargeted or untargeted manner and were thus a mixof horizontal, oblique and vertical deployments. Themajority of hauls (98.6%) were taken between Octo-ber and April, where a total of 317 335 individualswere measured. Body-length measurements weremostly made from the front of the eye to the tip of thetelson (AT; Morris et al. 1988). Maturity status wasspecified to different degrees of resolution accordingto several different schemes (see below).
CCAMLR database
This database has been compiled by the CCAMLRdata centre (www.ccamlr.org/) from submissions tothe Secretariat under rules adopted by the Twenty-Second Meeting of the Commission (CCAMLR-XXII,paragraphs 12.1 to 12.6). The database covers obser-vations made on fishery operations between 2000and 2013, which comprised a total of 7538 haulsmade from 134 separate fishing expeditions. Approx-imately half (3290 hauls) were performed in the
63
Mar Ecol Prog Ser 547: 61–78, 201664
Scotia-Weddell region, comprising 1334 hauls duringwinter (May to September) and 1956 hauls in sum-mer (October to April). This provided 184 931 and184 161 individuals measured in winter and summer,respectively, although it is to be noted that that therewere no recorded catches in November and April.Total body length (mm), sex and sexual developmentstage were recorded for each individual, followingCCAMLR protocols specified in www.ccamlr.org/en/system/files/obsman.pdf. According to these proto-cols, total body length measurements were madefrom the front of the eye to the tip of the telson (AT;Morris et al. 1988) to the nearest millimetre. Sex andsexual development stage were classified accordingto (1) the presence of a petasma: male; (2) the pres-ence of a thelycum: female; or (3) the absence ofeither external organ: juvenile. In the case offemales, those with swollen carapaces were furtherclassified as being gravid.
The winter population structure in the Scotia-Wed-dell region was compared with that found at SouthGeorgia and the WAP during the same period. TheSouth Georgia region was defined as being withinthe limits of 56° S and 50° S, and 40° W and 34° W,whereas the limits of the WAP were defined as 65° Sto 62° S, and 64° W to 60° W. Between May and September, the CCAMLR database for the SouthGeorgia region contained a total of 435 separate nethauls, amounting to 23 378 individuals. For the WAPregion, the database contained 860 separate nethauls and 58 134 individuals.
Pre-treatment of data
Pooling of data
Most net-sample catches reported measurementsof between 30 and 200 individuals per haul and allindividual measurements of krill body length, sexand maturity status were considered as discretedata points. In KRILLBASE, the maturity status ofindividuals was classified according to a number ofdifferent schemes, whereas in the CCAMLR data-base, 4 different categories were distinguished:juveniles, adult males, non-gravid adult females andgravid adult females. The lack of a universalscheme across all databases, plus the variancebetween scientists and observers in how these wereapplied, introduces further error in comparativeanalyses. Therefore, all maturity information wassimplified into the following 3 categories: juvenile,male and female.
Smoothing algorithm
Body-length measurements in certain datasetswere made in increments of 2 mm or, very infre-quently, 3 mm, rather than the more commonlymeasured 1 mm intervals. This was mitigatedthrough applying the following ‘moving-average’algorithm:
(1)
where n’ is the smoothed frequency of individuals,n is the original frequency of individuals and x isbody length in increments of 1 mm. For the firstand last body-length increments, n’ was determinedas the average of that increment and the one adja-cent to it.
Component-fitting analysis
Antarctic krill have a multi-year life cycle, soanalysis of body-length frequency data necessitatesthe application of statistical methods to separate yearclasses into size-distribution modes. For this purpose,we applied the mixdist package (Ichthus data sys-tems, www.math.mcmaster.ca/peter/mix/mix.html) inR (version 3.1.1) to body-length frequency data fromboth the KRILLBASE and CCAMLR databases.mixdist fits finite mixture distributions to populationdata, and is an update of the MIX programme, devel-oped by Macdonald & Pitcher (1979), with improvednumerical methods based on a combi nation of theexpectation-maximization algorithm (Dempster et al.1977) and a Newton-type method (Du 2002). To applythe software, the user must identify the expectednumber of age components within the distributionbefore initialising the fitting procedure. The initialhypothesis, based on other observations (Rosenberget al. 1986, Tarling et al. 2007), was that there were 3log-normal components in the post-larval populationof Antarctic krill, with modal peaks at 35, 45 and55 mm. Further runs with 2 and 4 modes at variousassumed modal peaks were also performed to con-sider whether better fits could be achieved with alter-native assumptions. As a starting point for the fittingprocedure, the initial proportions in each componentwere assumed to be equal and there were no con-straints put on the proportions, mean body lengthsand variances in each component. Further fits wereattempted by reducing or increasing the number ofcomponents and also assuming that componentswere normally distributed.
nn n n
xx x x= + + +'4 2 4
–1 1

Tarling et al.: Body-length shrinkage in Antarctic krill 65
Before applying the mixdist fitting procedure, thedatabases were divided into 3 periods of the year:early productive period (October to December), lateproductive period (January to April) and overwinter-ing (May to September). KRILLBASE was used in theearly and late productive period datasets, whereasCCAMLR data were used for the overwintering data-set. The CCAMLR summer dataset was not includedin certain analyses, particularly those consideringgrowth, because of the absence of records in 2 out ofthe 7 months. Nevertheless, the dataset was used toconsider seasonally integrated patterns in body-length frequency and length-specific sex ratio. TheCCAMLR summer dataset was also used in analysesto identify biases between the CCAMLR and KRILL-BASE datasets.
In each period, 3 subsets were generated: (1) alllength frequency data (sexes combined), (2) femaledata only and (3) male data only. Fits by mixdist tothe body-length frequency distributions of each subset were ranked according to their chi-squaredgoodness-of-fit values. In some instances, somehigh-ranking fits contained components with un -realistic levels of variance or very small inter- component distances, and these were subsequentlyrejected.
Sexual regression
Antarctic krill can lose their secondary sexual characteristics during winter and take on a juvenileexternal appearance (Ikeda & Thomas 1987, Siegel2012). Therefore, a potential explanation for any sea-sonal changes in the proportion of males and femalesis that one sex regresses to a juvenile state more thananother (regression bias). An associated problem isthe misclassification of maturity status and sex byobservers when secondary sexual characters areeither still developing or in a state of regression. Thiscould have an influence similar to that of real regres-sion bias if misclassifications are more common forone sex than the other (misclassification bias). Weconsidered how regression bias and misclassificationbias could alter sex ratio through a series of sens -itivity analyses.
In simulations, it was assumed that all juveniles inthe CCAMLR winter population had developed sec-ondary sexual characteristics during the previoussummer and had since regressed to a juvenile state(termed henceforth as ex-females and ex-males). Forthe purpose of the analysis, ex-females and ex-malesrepresent individuals that have either genuinely
regressed or have otherwise been misclassified ashaving regressed. The proportion of ex-females toex-males was then varied such that, at one extreme,there was 10% ex-females to 90% ex-males and, atthe other, 90% ex-females to 10% ex-males. The ex-female and ex-male populations were added to theoverwintering adult population and the proportion ofmales (PM) per body-length interval was deter-mined. These simulated PM to body-length distribu-tions were compared with those observed in the summer to consider whether any differences could beexplained by sex-related skew in sexual-regression.
Growth trajectories
Seasonally modulated von Bertalanffy functions(sVBFs; Pitcher & MacDonald, 1973) were fitted tothe modal peaks identified above (for a full descrip-tion of this method, see Supplement 3 at www.int-res.com/articles/ suppl/ m547p061_ supp .pdf). Pitcher& MacDonald (1973) developed 2 sVBFs: one inwhich the population switched be tween a period ofpositive growth and a period of zero growth (theswitched-growth model) and another where the sea-sonal change in growth rate occurred more smoothlyand allowed for negative growth (the sine-wavegrowth model). Attempts were made to fit bothgrowth models with a distance minimisation algo-rithm (Microsoft Excel 2007 Solver: GeneralisedReduced Gradient [GRG2] nonlinear optimisation),using initial estimates of the growth constant K fromSiegel (1987) and setting the upper body-length sizelimit (Linf) at 65 mm and solving for all other sVBFparameters. A single set of parameter values did notfit both the smaller and larger body-length modesequally well, so further fits were attempted by split-ting the observed data set into smaller and largerbody lengths and fitting the sVBF to each datasetseparately. The split point was made at 1 of 4 differ-ent points in the life cycle (1st week in November orJuly in years 2+ or 3+), representing the points atwhich growth was, respectively, highest and lowestwithin the annual cycle. The preferred sVBF param-eter values and split-points were those that achievedthe minimum squared-difference.
Validation: simulations of overwintering population
Simulations were performed to consider the levelof agreement between population size-structure inthe late productive-season and overwinter, once the

Mar Ecol Prog Ser 547: 61–78, 2016
fitted sVBF functions had been factored in. The totalbody length of each individual measured in the lateproductive season dataset (Lt,ls) was altered by agrowth factor Rt to predict a mid-overwintering totalbody length, Lt,ow’, as follows:
(2)
Rt was a randomised variable with a mean equal tothe difference in Lt between late productive seasonand overwintering according to the fitted sVBF function. Growth in body length between these 2periods derives a positive value, and shrinkagederives a negative value. A randomisedamount within the range of ±1.5 mm wasintegrated within the Rt value applied toeach individual to represent individualvariance in growth and shrinkage. Rt wasderived separately for each year class.The predicted and observed overwinter-ing size structures were subsequentlycompared.
RESULTS
Comparison of KRILLBASE andCCAMLR datasets
A comparison was made between thesummer (October to April) records ofKRILLBASE and CCAMLR databases toidentify any major differences in theirrespective body-length distributions.Both databases showed a concentrationof sampling effort towards the tip of theAntarctic Peninsula and around theSouth Orkneys (Fig. 1). The least inten-sively sampled areas were towards theeastern and southern parts of the Scotia-Weddell region. The geographic extent ofthe CCAMLR database was more limitedcompared with that of KRILLBASE, particularly in the northwestern sector ofthe Scotia-Weddell region. By compari-son, 61% of all krill and 63% of allcatches within the KRILLBASE databaseoccurred within the main CCAMLR fishing areas.
During summer, a peak in body-length distributions occurred between45 and 47 mm in both the KRILLBASEand CCAMLR databases (Fig. 2). Fur-thermore, comparative proportions were
very similar between 40 and 53 mm. At bodylengths greater than this, there was a slightincrease in the cumulative proportion of krill in theCCAMLR database. Below 40 mm, and particularlybelow 35 mm, the cumulative proportion in theCCAMLR database decreased from around 75% toless than 1% of the KRILLBASE dataset. Whenrestricting KRILLBASE to the main CCAMLR fish-ing areas, the proportion of individuals in thesmaller body-length classes was also depleted com-pared with the full KRILLBASE dataset (Fig. 2).Nevertheless, the pattern of this decrease was dif-
L L Rt,ow' t,ls t= +
66
Fig. 1. Euphausia superba. Distribution of net hauls in the Scotia-Weddellregion within KRILLBASE summer records (main map) and within thewinter period of the CCAMLR dataset (inset) that were used for the analysis in this study. Key refers to number of hauls within a 2×2° grid cell

ferent to the CCAMLR dataset, given that the com-parative proportion of krill <35 mm remainedaround 75% of that observed in the full KRILLBASEdataset.
These comparisons show that there are differencesin the body-length distributions of the KRILLBASEand CCAMLR datasets, which are a combination ofboth geographic and methodological factors. Never-theless, it was only at body lengths smaller than35 mm that differences were severe enough to affectcomponent-fitting analysis. This is most likely due tothe coarser mesh size of the commercial trawls.Therefore, modal classes below 35 mm identified inthe CCAMLR winter dataset were not considered inany further interpretation of overwintering popula-tion structure.
Population structure
General population structure
Juveniles with body lengths of between 17 and30 mm were a major contributor to the populationduring the early productive season (Fig. 3). These areprobably a combination of individuals that haveoverwintered either once or twice. This pulse of newrecruits was less evident in the late productive sea-son, where the population was dominated by adultsbetween 40 and 50 mm in body length. The adultpopulation structure changed little moving into theoverwintering period, but juvenile structure changedconsiderably, with a large fraction being evidentbetween 40 and 50 mm.
Adult population components
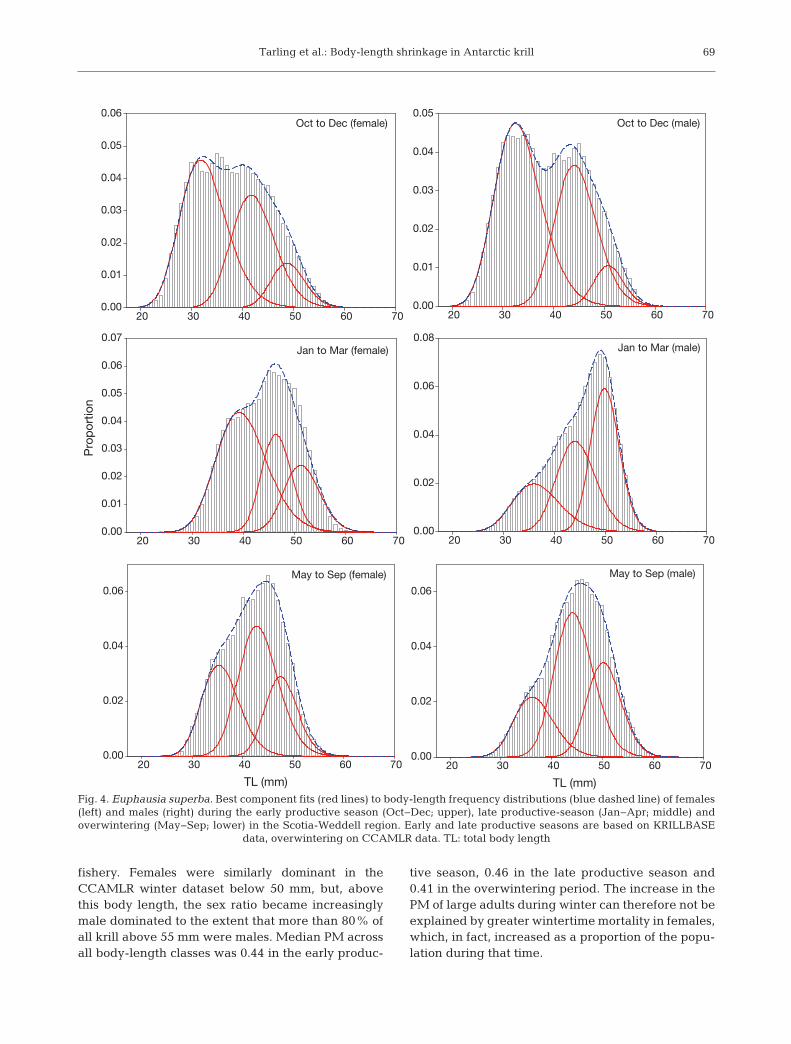
Component-fitting analysis consistently found 3log-normal components to be the best fit to the adultpopulation structure in all 3 seasons. In the early pro-ductive season, the 3 female components peaked at32 mm (mode 1), 42 mm (mode 2) and 49 mm (mode3), although the latter mode contained only a smallproportion of the population (11%; Fig. 4, Table 1). Inthe males, peaks were at larger body lengths: 33, 44and 50 mm, respectively.
In the late productive season, females in mode 3increased substantially both in terms of peak bodylength (51 mm) and proportion (21%). Growth wasalso seen in the earlier modes, which now peaked at40 mm (mode 1) and 46 mm (mode 2). In males, therewas growth in mode 1 (peak at 36 mm), but modes 2and 3 peaked at approximately the same bodylengths as observed in the early productive season(44 and 50 mm, respectively).
During the overwintering period, although therewere 3 clearly defined components in both the maleand female populations, mode 1 was not consideredfurther given the potential sampling bias in theCCAMLR dataset. In females, mode 2 peaked at43 mm and mode 3 peaked at 47 mm, which are 3and 4 mm smaller, respectively, than these modes inthe late productive season. In males, both mode 2(44 mm) and mode 3 (50 mm) peaked at approxi-mately the same body lengths as observed at othertimes of year.
At a mean length of between 31 and 38 mm, it ismost likely that mode 1 within the productive seasonis equivalent to the 1+ cohort, following Siegel
Tarling et al.: Body-length shrinkage in Antarctic krill 67
Oct to AprKRILLBASE
TL (mm)0 10 20 30 40 50 60
Pro
por
tion
(KR
ILLB
AS
E)
0.00
0.02
0.04
0.06
0.08
0.10
0.12
Pro
por
tion
(CC
AM
LR s
umm
er)
0.00
0.01
0.02
0.03
0.04
0.05
0.06
Pro
por
tion
(KR
ILLB
AS
E -
are
a re
stric
ted
)
0.00
0.01
0.02
0.03
0.04
0.05
0.06Juvenile Female Male CCAMLR summer KRILLBASE - area restricted
Fig. 2. Euphausia superba.Body-length frequency distri-butions in the Scotia-Weddellregion during summer (Oct−Apr). Bars: all KRILLBASErecords, divided according tomaturity stage; filled circles:CCAMLR records; open tri -angles: KRILLBASE recordsrestricted to the geographicregions covered by theCCAMLR records. Data weresmoothed using a moving av-erage algorithm. TL: total bodylength. Only size classes at orabove 35 mm were included
in modal class analyses

Mar Ecol Prog Ser 547: 61–78, 2016
(1987). Accordingly, mode 2 contains 2+ individualsand mode 3, 3+ individuals. Although older krill (4+and 5+) probably occur within the population, theircontribution could not be distinguished through thepresent component-fitting analysis.
Comparative structure of males and females
There was a clear difference in the body-lengthfrequencies of the female and male populations overthe seasonal cycle (Fig. 5). In the early and late productive seasons, females were more numerousthan males in most of the comparable size classes at>35 mm. However, the frequencies of both sexeswere similar in all size-class intervals above 50 mm.Over the winter, the distribution above 50 mm wasstrikingly different to other seasons, with malesbeing consistently more abundant than females.
The seasonal shift in the relative proportions ofmales and females is further illustrated when consid-ering sex ratio (PM) per size interval (Fig. 6). Both theKRILLBASE summer and CCAMLR summer data-bases show that PM is at or below 0.5, with the lowestvalues found above 55 mm. Notable is the offset ofaround 0.1 between these 2 databases, illustrating a10% shift in sex ratio in favour of females in theCCAMLR summer dataset, most likely a result of asummer bias towards females in the commercial
68
Jan to AprKRILLBASE
20 30 40 50 60 70
Freq
uenc
y
0
2000
4000
6000
8000
Oct to DecKRILLBASE
20 30 40 50 60 700
500
1000
1500
2000
2500
3000
JuvenileFemaleMale
May to SepCCAMLR
TL (mm)20 30 40 50 60 70
0
2000
4000
6000
8000
10 000
12 000
Fig. 3. Euphausia superba. Body-length frequency distribu-tions of juveniles, females and males in the Scotia-Weddellregion, divided into 3 seasonal periods. Early and late pro-ductive seasons (Oct−Dec and Jan−Apr, respectively) arebased on KRILLBASE data, overwintering (May−Sep) onCCAMLR data. Note that the relative lack of individualsbelow 35 mm during winter is most likely a result of under-sampling by the coarse meshes used by fishery vessels. Datawere smoothed using a moving average algorithm. TL: total
body length
Oct−Dec Jan−Apr May−Sep
FemaleMode 1 32.26 (4.61) 39.58 (5.00) 35.34 (3.72)
51.70% 53.30% 30.60%Mode 2 41.85 (4.26) 46.12 (2.88) 42.80 (3.95)
36.90% 25.60% 46.60%Mode 3 48.54 (3.29) 51.08 (3.49) 47.28 (3.15)
11.40% 21.10% 22.90%
MaleMode 1 32.91 (4.68) 36.35 (4.73) 36.27 (3.93)
54.50% 23.00% 21.20%Mode 2 44.08 (4.13) 44.02 (3.82) 44.11 (3.82)
37.70% 35.70% 50.00%Mode 3 50.47 (2.90) 49.53 (2.78) 50.01 (3.35)
7.70% 41.40% 28.80%
Table 1. Euphausia superba. The best-fitting componentswithin adult female and adult male body-length frequencydistributions in the early productive season (Oct−Dec), lateproductive season (Jan−Apr) and overwintering (May−Sep)in the Scotia-Weddell region. Values represent the point ofthe modal peak (SD) and % of the population. Note that thedistributions are log-normal. Italics denotes that the valuewas not used when fitting seasonally modulated von
Bertalanffy functions
Tarling et al.: Body-length shrinkage in Antarctic krill
fishery. Females were similarly dominant in theCCAMLR winter dataset below 50 mm, but, abovethis body length, the sex ratio became increasinglymale dominated to the extent that more than 80% ofall krill above 55 mm were males. Median PM acrossall body-length classes was 0.44 in the early produc-
tive season, 0.46 in the late productive season and0.41 in the overwintering period. The increase in thePM of large adults during winter can therefore not beex plained by greater wintertime mortality in females,which, in fact, increased as a proportion of the popu-lation during that time.
69
Oct to Dec (male)
20 30 40 50 60 700.00
0.01
0.02
0.03
0.04
0.05Oct to Dec (female)
20 30 40 50 60 700.00
0.01
0.02
0.03
0.04
0.05
0.06
Jan to Mar (female)
20 30 40 50 60 70
Pro
por
tion
0.00
0.01
0.02
0.03
0.04
0.05
0.06
0.07Jan to Mar (male)
20 30 40 50 60 700.00
0.02
0.04
0.06
0.08
May to Sep (female)
TL (mm)
20 30 40 50 60 700.00
0.02
0.04
0.06
May to Sep (male)
TL (mm)
20 30 40 50 60 700.00
0.02
0.04
0.06
Fig. 4. Euphausia superba. Best component fits (red lines) to body-length frequency distributions (blue dashed line) of females(left) and males (right) during the early productive season (Oct−Dec; upper), late productive-season (Jan−Apr; middle) andoverwintering (May−Sep; lower) in the Scotia-Weddell region. Early and late productive seasons are based on KRILLBASE
data, overwintering on CCAMLR data. TL: total body length

Mar Ecol Prog Ser 547: 61–78, 2016
Sexual regression
During winter, individuals with an external juve-nile appearance occurred at almost all body-lengthintervals (Fig. 3). This indicates a regression of someadults to a juvenile state during the overwinteringperiod (Siegel 2012), although it must also be notedthat the level of expertise of fishery observers most
likely varied between cruises and there is the poten-tial for some misclassification of such regression.Sensitivity analyses showed that sex-related skew inthe proportion of adult regression to a juvenile exter-nal appearance (either through genuine or misclassi-fied sexual-regression) had the potential to explainthe relatively low PM values observed in the smallersize classes (Fig. 7). In a scenario where all the juve-
70
Oct to Dec
0
200
400
600
800
1000
1200
1400
FemaleMale
Jan to Apr
Freq
uenc
y
0
1000
2000
3000
4000
May to Sep
TL (mm)35 40 45 50 55 60 65
35 40 45 50 55 60 65
35 40 45 50 55 60 65
0
1000
2000
3000
4000
5000
6000
Fig. 5. Euphausia superba. Comparison of female and malebody-length frequency distributions (≥35 mm total bodylength) during the early productive season (Oct−Dec), lateproductive season (Jan−Apr) and overwintering (May−Sep)in the Scotia-Weddell region. Early and late productive seasons are based on KRILLBASE data, overwintering on
CCAMLR data. TL: total body length
TL (mm)35 40 45 50 55 60 65
PM
0.0
0.1
0.2
0.3
0.4
0.5
0.6
0.7
0.8
0.9
1.0
KRILLBASE summerCCAMLR summerCCAMLR winter
Fig. 6. Euphausia superba. Proportion of males (PM) as afunction of total body length (≥35 mm) in the adult popula-tion of the Scotia-Weddell region according to KRILLBASEduring summer (Oct−Apr), the CCAMLR dataset duringsummer (Oct−Apr) and the CCAMLR dataset during over-wintering (May−Sep). PM was calculated as the sum ofmales per interval divided by the sum of males and females
per interval
TL (mm)35 40 45 50 55 60 65
PM
0.0
0.1
0.2
0.3
0.4
0.5
0.6
0.7
0.8
0.9
1.0CCAMLR winter adults onlyAdults+juveniles split 50:50 F:MAdults+juveniles split 90:10 F:MAdults+juveniles split 75:25 F:MAdults+juveniles split 25:75 F:MAdults+juveniles split 10:90 F:M
Fig. 7. Euphausia superba. Sensitivity analysis illustratingthe effect of the proportion of adult regression to a juvenileappearance on the proportion of males (PM) as a function oftotal body length (≥35 mm) during the overwintering period(May−Sep) in the Scotia-Weddell region. TL: total body
length; F: female; M: male

Tarling et al.: Body-length shrinkage in Antarctic krill
niles between 35 and 40 mm consisted of 10 to 25%ex-females and 75 to 90% ex-males, the overwinter-ing PM values (0.26 to 0.33) would be equivalent tothose observed during summer. However, no sce-nario could explain the difference between late pro-ductive season and winter PM values in size classesabove 50 mm. The sensitivity analysis therefore indi-cates that the skew towards males in these larger sizeclasses during the overwintering period was not aresult of the greater level of genuine or misclassifiedregression to a juvenile state in females.
Inter-regional comparison
As well as the Scotia-Weddell region, the fisheryfor Antarctic krill also operates at South Georgia andthe WAP. During overwintering in both of those locations there was an offset between the size distri-bution of females and males that resembled thatobserved in the Scotia-Weddell region (Fig. 8). Inparticular, a much higher proportion of males thanfemales were found in size classes above 50 mm. Thiswas also reflected in the comparison of PM distribu-tions, where there was a continual increase in PMwith increasing body length, particularly above50 mm (Fig. 9). In the WAP, the maximum PM wasaround 0.6, whereas at South Georgia, as well as inthe Scotia-Weddell region, PM reached a maximumof 0.9 in the largest size classes.
Growth trajectories
In both sexes, sVBFs were found to obtain betterfits to the observed data when fitted to the smallerand larger body lengths separately (Table 2), whichsuggests that the characteristic oscillations in growthalter over the course of adult life. Furthermore, thenature of these oscillations in growth differed be -tween the sexes. Male body-length growth was rapidin the early productive season and then stagnated forthe remainder of the year, while female body-lengthgrowth occurred later in the year and was followedby a period of shrinkage. We found that male growthwas best simulated by a switched-growth sVBF,whereas female growth was better represented by asine-wave growth sVBF (Fig. 10). Despite the differ-ences in growth characteristics, both males andfemales reach the same average 4-yr-old adult size of~50 mm. However, whereas the male modal peakremains at 50 mm during overwintering, the femalemodal peak decreases to 47 mm before returning to
71
TL (mm)
Freq
uenc
y
0
500
1000
1500
2000
2500
35 40 45 50 55 60 65
35 40 45 50 55 60 65
Freq
uenc
y
0
1000
2000
3000Adult femaleAdult male
Fig. 8. Euphausia superba. Comparison of female and malebody-length frequency distributions (≥35 mm total bodylength) during overwintering (May−Sep) at South Georgia(upper) and in the Western Antarctic Peninsula (lower).
TL: total body length
TL (mm)35 40 45 50 55 60 65
PM
0.0
0.1
0.2
0.3
0.4
0.5
0.6
0.7
0.8
0.9
1.0
Scotia-Weddell winterWAP winterSouth Georgia winter
Fig. 9. Euphausia superba. Proportion of males (PM) as afunction of total body length (≥35 mm) in the adult popula-tion during the overwintering period in the Scotia-Weddellregion, the Western Antarctic Peninsula (WAP) and South
Georgia. TL: total body length

Mar Ecol Prog Ser 547: 61–78, 2016
growth during the late overwintering period and theearly productive season.
According to the fitted growth rate trajectories,average adult growth rates during the early produc-tive season varied between +0.020 and +0.103 mmd−1, with higher rates occurring in younger adults(Table 3). During the late productive season, growth
rates had already become comparatively reduced,with the maximum rate being +0.044 mm d−1 in mode1 males. Older male year classes had already enteredthe period of growth stagnation during this period. Infemales, this period may also include some body-length shrinkage (minimum growth rates of between−0.031 and −0.046 mm d−1). Growth resumed by theend of winter, such that average growth rates for thisperiod were mainly positive in both males andfemales.
The seasonal shape of the fitted curves indicatedthat the highest growth rates occurred in the earlyproductive season and growth recommenced evenwithin the latter part of the overwintering period.This was especially true of males, which had averagegrowth rates of between 0.01 and 0.03 mm d−1 duringoverwintering, mainly as a result of growth duringthe latter part of this period. By the early productiveperiod, average growth rates reached up to 0.05 mmd−1. Females showed little growth during overwinter-ing, but had higher average growth rates than malesduring the early productive period, ranging between0.05 and 0.1 mm d−1.
Body length to age relationships
The differences between males and females ingrowth trajectories also mean that there were differ-ences between sexes with respect to the relationshipbetween body length and age. Component-fittinganalyses identified modes that peaked at differentbody lengths in females compared with males. Inparticular, during the late productive season, females
72
C sw t0 K s Linf (mm) Split time point
FemalesYounger modes 0.157042 − −74.048 0.005976 −6.96 65 1st week of July, year 2+Older modes 0.162127 − −101.398 0.005296 −10.73 65
MalesYounger modes − −0.100 −24.2307 0.010499 −10.00 65 1st week of July, year 3+Older modes − 0.100 −5.9820 0.013420 −16.00 65
Table 2. Optimal parameter fits of seasonally modulated von Bertalanffy functions (sVBF) fitted to modal peaks identifiedwithin seasonally resolved body-length frequency distributions of female and male Antarctic krill in the Scotia-Weddell
Sea region. Female growth was fitted by a sine-wave sVBF function, Lt = Linf(1–e–K), where .
Male growth was fitted by a switched-growth sVBF function, Lt = Linf(1–e–K(tg–t0)), where when .
The split point (week/month/year after spawn) refers to the point at which the observed dataset was split into a younger andolder section. The sVBF was fitted to each of the 2 sections separately. C is a constant, sw: time spent growing each year,t0: time from which the growth-curve starts, K: the rate parameter, s: time at which zero growth begins and ends (switched-growth function) or starting point for the sine (sine-wave growth function), Linf, maximum total body length (mm). Supplement 3
contains a more detailed explanation of the functions and the split points
K Ct s
K t t= ⎛⎝⎜
⎞⎠⎟ +sin
( – )( – )
252 0
π
d
d
t
tg
s
= 0 cos = ⎛⎝⎜
⎞⎠⎟ <
2
52
πtsws
Month
01 04 07 10 01 04 07 10 01 04 07 10 01 04 07 10 01 04 07 10 01
TL (m
m)
25
30
35
40
45
50
55
60Female fitted growth curveMale fitted growth curveFemale observationsMale observations
Mode 1(year 2+)
Mode 2(year 3+)
Mode 3(year 4+)
Male split-point Female split-point
Fig. 10. Euphausia superba. Best fits of seasonally adjustedvon Bertalanffy growth functions (lines) to modal peaks(symbols) in the Scotia-Weddell adult population. Separatefits were made to the females and males, the former using asine-wave growth function, the latter, a switched-growthfunction. In each instance, the datasets were divided intosmaller and larger body length fractions and a function fit-ted to each fraction separately. The body length at which thesplit was made was part of the fitting procedure and is indicated for each sex. TL: total body length. Error bars
denote ±1 SD

Tarling et al.: Body-length shrinkage in Antarctic krill
were longer than males by 3 mm in mode 1 and 2 mmin mode 2. By the overwintering period, these differ-ences reduced to approximately 1 mm. The patternwas different in mode 3, where, although the modalpeaks in the productive season were the same, thoseduring overwintering were 3 mm shorter in femalesthan in males. Furthermore, the overwintering modalpeak was 4 mm shorter than that in the late produc-tive season in females, whereas that in the males was0.5 mm longer.
Validation: simulation of overwintering population
Simulations of overwintering size structure focusedon females given that total body length of males wasfound to remain relatively constant during thisperiod. In accordance with the fitted sVBF, the Rt
growth factor was set at −4 mm for mode 1 females,−3.5 mm for mode 2 females and −4 mm for mode 3females. The simulated size structure closely resem-bled that observed during the overwintering period,particularly between 41 and 60 mm total body length(Fig. 11). Peak female size class was estimated to be45 mm in both the simulated and observed overwin-tering size distributions. Nevertheless, the simulationoverestimated the proportion of females observedbetween 35 and 40 mm by up to 3% per size class,suggesting that estimated growth and shrinkage fac-tors were less robust in these body-length classes.
DISCUSSION
The present study performed population dynamicanalyses on the 2 most comprehensive Antarctickrill body-length datasets yet amassed, covering the Scotia-Weddell region, the WAP and South Georgia,
with more than 686 000 measured individuals over49 yr. A distinguishing feature of this study is theinclusion of a substantial body of CCAMLR fisherydata from winter, a period that has been poorly sam-pled by scientific surveys. The outcomes of the analy-ses are complex to interpret, which is, in part, theconsequence of methodological issues within eachdatabase. Nevertheless, a clear dominance of malesin the upper body-length range of overwintering krillstands out as a robust and widespread pattern acrossall analyses. This reflects a consistent reduction inbody length of all the female cohorts by mid-winter,while the body lengths of male cohorts appear to
73
Maximum growth rate Minimum growth rate Mean (SD) growth rateFemale Male Female Male Female Male
Mode 1, Early productive season 0.1167 0.0499 0.0764 0.0440 0.1033 (0.0142) 0.0469 (0.0019)Mode 1, Late productive season 0.0684 0.0436 −0.0457 0.0000 0.0052 (0.0374) 0.0076 (0.0169)Mode 1, Overwintering 0.0750 0.0539 −0.0509 0.0000 −0.0020 (0.0449) 0.0252 (0.0259)Mode 2, Early productive season 0.0855 0.0465 0.0560 0.0000 0.0765 (0.0097) 0.0305 (0.0212)Mode 2, Late productive season 0.0501 0.0000 −0.0413 0.0000 −0.0082 (0.0342) 0.0000 (0.0000)Mode 2, Overwintering 0.0640 0.0412 −0.0386 0.0000 0.0161 (0.0365) 0.0284 (0.0164)Mode 3, Early productive season 0.0642 0.0332 0.0191 0.0000 0.0461 (0.0153) 0.0203 (0.0157)Mode 3, Late productive season 0.0143 0.0000 −0.0314 0.0000 −0.0155 (0.0155) 0.0000 (0.0000)Mode 3, Overwintering 0.0487 0.0294 −0.0293 0.0000 0.0139 (0.0281) 0.0205 (0.0115)
Table 3. Euphausia superba. Rates of growth in body length (mm d−1) over the adult life cycle in the Scotia-Weddell region, asestimated by seasonally adjusted von Bertalanffy functions fitted to modal peaks identified in body-length frequency distributions. Negative values denote shrinkage in body length. Early productive season: October to December; late
productive season: January to April; overwintering: May to September
TL (mm)35 40 45 50 55 60 65
Pro
por
tion
0.00
0.02
0.04
0.06
Observed overwinter femaleSimulated overwinter femaleObserved late productive season female
Fig. 11. Euphausia superba. Comparison of simulated andobserved female body-length frequency distributions(≥35 mm total body length) between the late productive season and overwintering in the Scotia-Weddell region.Simulated overwintering data were derived through applying a growth/shrinkage factor (derived from the fittedseasonally adjusted von Bertalanffy growth function) toobserved late productive season data. Late productive season observations are based on KRILLBASE data, over-wintering observations on CCAMLR data. TL; total body
length. Error bars denote ±1 SD

Mar Ecol Prog Ser 547: 61–78, 201674
remain the same during this time. We conclude thatthe most likely scenario is an autumn−winter con-traction in body length of the mature females. In sub-sequent sections, we will discuss a number of othercandidate explanations for these results, and de -scribe how each fails as an alternative explanation.
Comparison of data sources
Our use of datasets from CCAMLR has allowed usto resolve the Antarctic krill life cycle across the com-plete annual cycle. It is nevertheless a set of data thathas been collected in a different way to that obtainedthrough the scientific survey methods within KRILL-BASE. Fishery nets have a coarser mesh so are un-likely to sample smaller size classes in a representa-tive manner. We found that the population structurein the CCAMLR and KRILLBASE databases divergedat around 35 mm, with specimens smaller than thissize being under-represented in the CCAMLR data-set. Fishery nets are also comparatively large and aresampled at faster speeds, which probably results inless avoidance by larger, more mobile krill (Jones &Ramm 2004). This may be a factor explaining theslightly greater proportion of larger krill in CCAMLRsummer catches compared with those in the KRILL-BASE datasets. There is also a potential bias in theway fishery trawls are targeted, which reflects a his-torical preference for catches containing gravid fe-males (Kawaguchi et al. 2005, Kawaguchi & Nicol2007). We found that the CCAMLR summer data, onaverage, contained 10% more females than KRILL-BASE. Fishing industry sources suggest that somevessels avoid green krill (i.e. those that contain undi-gested phytoplankton) and high-density aggrega-tions of krill, although the implications this has to thesampled population structure is difficult to ascertain.
With prior knowledge of potential biases, ouranalyses were performed to accommodate theseissues when comparing between KRILLBASE andCCAMLR datasets. For instance, the first componentin the winter population structure was not consideredwhen fitting growth curves, given that this part ofthe population was under-sampled in the CCAMLRdatasets. Furthermore, our conclusion of female body-length shrinkage was based on several different linesof evidence, so as to reduce the reliance on any sin-gle perspective. Particularly useful in this regard wasthe comparison of the growth characteristics of malesand females. Whereas the female modal peaks alloccurred at smaller body lengths in winter comparedwith summer, the male peaks all remained approxi-
mately the same. This allowed the males to act as acontrol for sampling error between seasons. Further-more, we repeatedly cross-referenced body-length frequency and sex-ratio patterns obtained from theKRILLBASE datasets with those from the summerCCAMLR datasets to check for consistency and iden-tify any methodological biases.
Trajectories of growth and shrinkage in body length
In fitting the sVBFs to the Scotia-Weddell data, wefound that male growth was best characterised by theswitch-growth function because it captured alternat-ing periods of positive growth and then zero growthapparent from the component-fitting analysis. Theperiod during which growth stagnated started withinthe late production season, especially in the oldermodes. Female growth was better described by asine-wave growth function, because component- fitting analysis identified periods of alternating growthand shrinkage in body length. During the winter period, females shrank by up to 75% of the bodylength they had gained the previous summer. Inmode 2, this meant that overwintering females wereapproximately the same body length as males (43 to44 mm), whereas, in mode 3, overwintering femaleswere, on average, 3 mm shorter than males.
Using the instantaneous growth rate (IGR) ap -proach, Kawaguchi et al. (2006) found a similar pat-tern of highest growth in body length earlier in theproductive season. In the SW Atlantic sector (an areaencompassing both the Scotia-Weddell and SouthGeorgia sectors in the present study), they found thatgrowth rates in November and December weremainly between 0.20 and 0.30 mm d−1, whereas laterin the year they were between 0.05 and 0.15 mm d−1.From body-length frequency distributions within fur-seal stomachs at South Georgia, Reid (2001) pro-posed that the main period of growth in body lengthwas from September to December, and that littlegrowth occurred beyond January. Other studies haveshown that rapid growth phases appear to occur laterin the season in the WAP (Siegel 1986) and in theIndian sector (Kawaguchi et al. 2006), which is likelyto reflect the later start to the bloom periods in thoseregions (Kawaguchi et al. 2006). For instance, usingkernel-density analysis, Shelton et al. (2013) foundthat the most common growth rates at ElephantIsland (within the Scotia-Weddell region) in Januaryand February were between 0.05 and 0.1 mm d−1,equivalent to the rates we observed earlier in theyear in the Scotia-Weddell region.

Tarling et al.: Body-length shrinkage in Antarctic krill 75
In females, the fitted sVBF curve predicted a periodof body-length shrinkage just before and into thewinter period. Maximum shrinkage rates (minimumgrowth rates) varied between −0.051 and −0.031 mmd−1 between modes, with mode 1 females exhibitingthe greatest rates of shrinkage (Table 3). Candy &Kawaguchi (2006) fitted a number of different typesof sVBFs to an extensive set of IGR data. There wereno IGR data available for the overwintering period,so growth rates over that time were inferred. Theyfound that a scenario that allowed for an overwinter-ing shrinkage rate of 1.5% per moult (−0.034 to−0.011 mm d−1, assuming an intermoult period ofbetween 20 and 60 d for a 45 mm adult) produced thebest fit to observed body lengths. In the only over-wintering Antarctic krill IGR study yet carried out,Quetin & Ross (1991) calculated body-length shrink-age rates of krill in the WAP of between 0.16 and2.03% per moult, and intermoult periods of 30 to60 d, giving a range of −0.001 to −0.030 mm d−1 (for a45 mm adult). Our fitted shrinkage rates are there-fore towards, but not outside of, the upper range ofthose estimated by other studies.
Influences on sex-ratio patterns
Our undertaking to analyse patterns over largespatial and temporal scales was in part motivated bya need to minimise the influence of immigration andemigration in our analyses. Analysing datasets atthese spatial and temporal scales also overcomes thefurther issue of identifying each major cohort despiteinterannual variations in levels of recruitment. Varia-tion in both migration and recruitment may result ina modal class being absent, leading to the erroneousassessment of growth and development. For similarreasons, we also undertook a comparison with thesituation found in 2 other large-scale regions, theWAP and South Georgia. In all 3 regions, we foundthat females comprised a considerably smaller por-tion of the overwinter population greater than 50 mmbody length compared with males.
One explanation for this skew in sex ratio duringoverwintering is that there is a sexual difference inthe relationship between body length and mortality,with males suffering higher mortality at smaller bodylengths (i.e. younger ages) and females at larger bodylengths (i.e. at an older age). However, there are 2lines of evidence against this interpretation. Firstly,the sex-ratio trajectory (represented as the proportionof males, PM, per body-length increment) was com-paratively flat during the productive season, with the
majority of body-length increments exhibiting PMvalues between 0.4 and 0.6. This contrasts with theoverwintering situation of an upward trajectory inPM, reaching 0.9 above 50 mm. The lack of sex-ratiobias in summer appears contrary to an explanationthat relies on a severe depletion in numbers of onesex. Secondly, median PM values across all lengthclasses were 0.41, 0.44 and 0.46 during overwintering,early and late productive seasons, respectively.Therefore, if anything, females made up a greaterproportion of the population during overwintering.
Alternatively, the overwintering skew in PM couldbe the result of a seasonal spatial or vertical segre -gation of male and females. Spatially, Siegel (1987,2000) suggested that adults move offshore in order tospawn during summer. Even if this tendency wasmore likely to occur in females than in males,the CCAMLR and KRILLBASE databases containcatches from both onshore and offshore environ-ments. Whether one sex is more likely to migrate be-neath the sea-ice is unknown, and cannot be directlyaddressed with current technology, although net sur-veys have suggested that juveniles and sub-adultsare more likely to inhabit under-ice environmentsthan adults (Cuzin-Roudy & Schalk 1988). Vertically,krill are known to make deep migrations to the seabed (Clarke & Tyler 2008), a behaviour that may po-tentially be more prevalent in one sex than the other.However, observations to date have shown that suchdeep migrations are undertaken by both sexes withlittle indication of any sex bias (Schmidt et al. 2011).
Another potential influence on PM is the regressionof sexual characteristics during overwintering, whichresults in individuals that have already bred and sub-sequently regressed being recorded as juveniles. Ju-veniles occurred at almost all body-length incrementsduring overwintering, which is a strong indicationthat a proportion of even the larger adults had re-gressed. What is not known is whether one sex ismore likely to regress than the other. Our results didnot provide any further direct evidence of this, so in-stead we carried out a sensitivity analysis to determinewhether the observed skews in PM could be explainedby a sex-based bias in genuine or misclassified sexualregression. We found that regression could accountfor PM skew in the smaller body-length classes, butcould not explain the strong skew towards malesabove 50 mm. There is no possibility that adults maychange sex between seasons, given observations ofgerminal zones (oogonia and spermatogonia) beingpresent year-round (Cuzin-Roudy 1987).
Overall, in explaining our observation of the relative lack of females in size classes above 50 mm
Mar Ecol Prog Ser 547: 61–78, 2016
during winter, we have ruled out the following majorinfluences: (1) the migration of stocks, given the comprehensive spatial scale of our datasets; (2) sex-selective mortality, as males do not make up a higherproportion of the overall adult population duringoverwintering; (3) sexually differentiated seasonalvertical migration, given that sex bias has not beenreported in records of deep stocks; and (4) sex-basedbias in the regression of secondary sexual character-istics because our sensitivity analyses show that thiscannot account for the observed dramatic changes insex ratio. This leaves differential growth and shrink-age in body length between sexes as the remainingexplanation for this skew. We validated this explana-tion through successfully simulating overwinter sizestructure from late-productive size structure usingthe shrinkage factor derived by this study. The simu-lations involved applying cohort-specific shrinkagefactors, derived from sVBFs, that were between 3and 4 mm, depending on the mode. Our ability toachieve a close congruence between predicted andobserved overwinter population structures by thismeans indicates that shrinkage in female bodylength is an adequate and sufficient explanation forthe skew in sex ratio in the older size classes of thepopulation during overwintering.
Significance of body-length shrinkage
Seasonal changes in the length of krill are impor-tant in terms of both krill ecophysiology and inter-preting stock structure for fisheries management. Inthe present analysis, we found that shrinkage in bodylength during winter was most likely to occur infemales. Male and female Antarctic krill show a cleardimorphism in body shape (Farber-Lorda 1990),which is most notable in the relative sizes of thecephalothorax. In females, this body section containsthe ovaries and the ‘fat body’, which can make up to40% of total individual wet mass in fully gravid individuals (Tarling et al. 2007). Accordingly, thecephalothorax can be more than 30% longer infemales compared with males of similar total bodylength (Goebel et al. 2007). The ovaries and the fat-body regress at the end of the productive season(Cuzin-Roudy & Amsler 1991, Cuzin-Roudy 1993).Without the need to contain this large mass, thecephalothorax itself reduces in size, with a corre-sponding reduction in total body length. A useful testof this hypothesis would be to compare carapace withtotal body-length measurements in females from pro-ductive and overwintering seasons, which can be
achieved through minor modifications to the fisheryobserver krill measurement protocol.
Our finding that Antarctic krill are capable ofdecreasing in body length is consistent with labora-tory studies on a number of euphausiid species(Euphausia pacifica, Lasker 1966; E. superba, Ikeda& Dixon 1982; Meganyctiphanes norvegica, Buch-holz 1985; Thysanoessa inermis, Dalpadado & Ikeda1989; and Nyctiphanes australis, Hosie & Ritz 1989).These studies mainly incubated individuals in sub-optimal conditions, particularly with regards to theavailability of food. The question that has remainedis how frequently (if ever) krill field populationsencounter food shortage sufficient to engender body-length shrinkage and do they do so for sufficientperiods to affect the size structure of the population(Nicol 2000)?
In a study of stomach contents and body reserves,Schmidt et al. (2014) contended that krill experi-enced varying levels of overwintering hardship, withthose in the WAP and Scotia-Weddell region faringbetter as a result of longer phytoplankton blooms andaccess to benthic food compared with those in thedeep, seasonally ice-covered Lazarev Sea. It followsthat our observations of female body-length shrink-age occurs even in some of the best overwinteringconditions for Antarctic krill. This suggests thatbody-length shrinkage alone may not necessarilysignify winter hardship. Instead, a summer increaseand winter contraction in body length in female krillmay reflect stages in their sexual development: frompre-spawn vitellogenesis for egg production duringspring and summer to post-spawn ovary and fat-bodyregression in the overwintering period (Cuzin-Roudy& Amsler 1991, Cuzin-Roudy 1993). The fact thatnon-regressed males do not shrink during winter alsoargues against body-length shrinkage being solelythe result of starvation in natural populations.
Implications for future management
Future management of the Antarctic krill fisherymakes use of population projections to evaluatepotential management options (Miller & Agnew2000). CCAMLR is working to improve this manage-ment system and it is likely that assessment and pro-jection models will play central roles in the futuremanagement of the fishery (Hill & Cannon 2013,Kinzey et al. 2015). Any such model may produceerroneous results if assumptions about growth areincorrect. The models developed on behalf ofCCAMLR have generally been careful to account
76

Tarling et al.: Body-length shrinkage in Antarctic krill
for uncertainties, including variability in plausiblegrowth rates. Our finding of body-length shrinkagein field populations of Antarctic krill implies a needto extend this consideration to incorporate negativerates of growth in body length.
Acknowledgements. We are particularly grateful to EvgenyPakhomov, Volker Siegel and Valerie Loeb, who providedconsiderable amounts of data to the KRILLBASE database.Other data providers are included in Supplement 1, to whomwe extend our thanks. Much of the original construction ofthe KRILLBASE length frequency database was carried outby Mark Jessopp. Steve Candy supplied valuable input onprojecting sex ratio under different scenarios of mortalityand lifespan. Eugene Murphy contributed helpful discus-sions on growth trajectories. George Watters made con -structive criticisms on earlier drafts of the manuscript. TheCCAMLR data was provided by the CCAMLR data centre(Hobart, Tasmania) and has been published in accordancewith the rules adopted by the Twenty-Second Meeting ofthe Commission (CCAMLR-XXII, paragraphs 12.1 to 12.6).
LITERATURE CITED
Atkinson A, Shreeve RS, Hirst AG, Rothery P and others(2006) Natural growth rates in Antarctic krill (Euphausiasuperba): II. Predictive models based on food, tempera-ture, body length, sex, and maturity stage. LimnolOceanogr 51: 973−987
Atkinson A, Siegel V, Pakhomov EA, Rothery P and others(2008) Oceanic circumpolar habitats of Antarctic krill.Mar Ecol Prog Ser 362: 1−23
Atkinson A, Siegel V, Pakhomov EA, Jessopp MJ, Loeb V(2009) A re-appraisal of the total biomass and annualproduction of Antarctic krill. Deep-Sea Res I 56: 727−740
Bargmann HE (1945) The development and life history ofadolescent and adult krill, Euphausia superba. DiscovRep 23: 103−176
Buchholz F (1985) Moult and growth in Antarctic euphausi-ids. In: Siegfried WR, Condy PR, Laws RM (eds) Antarcticnutrient cycles and food webs. Springer-Verlag Berlin,p 339−345
Candy SG, Kawaguchi S (2006) Modelling growth ofAntarctic krill. II. Novel approach to describing thegrowth trajectory. Mar Ecol Prog Ser 306: 17−30
Clarke A (1984) Lipid content and composition of Antarctickrill, Euphausia superba Dana. J Crustac Biol 4: 285−294
Clarke A, Tyler PA (2008) Adult Antarctic krill feeding atabyssal depths. Curr Biol 18: 282−285
Constable AJ, de la Mare WK (1996) A generalised modelfor evaluating yield and the long-term status of fishstocks under conditions of uncertainty. CCAMLR Sci 3: 31−54
Croxall JP, Nicol S (2004) Management of Southern Oceanfisheries: global forces and future sustainability. AntarctSci 16: 569−584
Cuzin-Roudy J (1987) Sexual differentiation in the Antarctickrill Euphausia superba (Crustaceana: Euphausiacea).J Crustac Biol 7:518–527
Cuzin-Roudy J (1993) Reproductive strategies of the Medi-terranean krill, Meganyctiphanes norvegica and theAntarctic krill Euphausia superba (Crustacea: Euphausi-acea). Invertebr Reprod Dev 23: 105−114
Cuzin-Roudy J (2000) Seasonal reproduction, multiplespawning, and fecundity in northern krill, Meganyc-tiphanes norvegica, and Antarctic krill, Euphausiasuperba. Can J Fish Aquat Sci 57: 6−15
Cuzin-Roudy J, Amsler MO (1991) Ovarian developmentand sexual maturity staging in Antarctic krill, Euphausiasuperba Dana (Euphausiacea). J Crustac Biol 11:236–249
Cuzin-Roudy J, Schalk P (1988) Macrozooplankton biomass,development and activity. The expedition ANTARCTISVII/3 (EPOS leg 2) of RV Polarstern in 1989:146–159
Dalpadado P, Ikeda T (1989) Some observations on moult-ing, growth and maturation of krill (Thysanoessa iner-mis) from the Barents Sea. J Plankton Res 11: 133−139
Daly KL (2004) Overwintering growth and development oflarval Euphausia superba: an interannual comparisonunder varying environmental conditions west of theAntarctic Peninsula. Deep-Sea Res II 51: 2139−2168
Dempster AP, Laird NM, Rubin DB (1977) Maximum like -lihood from incomplete data via the EM algorithm. J RStat Soc, B 39: 1−38
Du J (2002) Combined algorithms for constrained estimationof finite mixture distirbutions with grouped data andconditional data. Masters thesis, McMaster University,Hamilton, Ontario, Canada
El-Sayed SZ, McWhinnie MA (1979) Antarctic krill: proteinof the last frontier. Oceanus 22: 13−20
Ettershank G (1983) Age structure and cyclical annual sizechange in the Antarctic krill Euphausia superba Dana.Polar Biol 2: 189−193
Everson I (1977) The living resources of the Southern Ocean.Southern Ocean Fisheries Survey Programme GLO/SO/77/1, FAO, Rome
Farber-Lorda J (1990) Somatic length relationships andontogenic morphometric differentiation of Euphausiasuperba and Thysanoessa macrura of the southwestIndian Ocean during Summer (February 1981). Deep-Sea Res 37: 1135−1143
Goebel ME, Lipsky JD, Reiss CS, Loeb VJ (2007) Using cara-pace measurements to determine the sex of Antarctickrill, Euphausia superba. Polar Biol 30: 307−315
Gulland JA (1983) The development of fisheries and stockassessment of resources in the Southern Ocean. MemNatl Inst Polar Res 27: 129−152
Hilborn R, Walters CJ (1992) Quantitative fisheries stockassessment: choice, dynamics and uncertainty. Chapman& Hall, New York, NY
Hill SL, Cannon M (2013) A potential feedback approach toecosystem-based management: model predictive controlof the Antarctic krill fishery. CCAMLR Sci 20: 119−137
Hill SL, Keeble K, Atkinson A, Murphy EJ (2012) A foodwebmodel to explore uncertainties in the South Georgia shelfpelagic ecosystem. Deep-Sea Res II 59−60: 237−252
Hosie GW, Ritz DA (1989) Body shrinkage in the sub- tropical euphausiid Nyctiphanes australis G.O. Sars.J Plankton Res 11: 595−598
Ikeda T, Dixon P (1982) Body shrinkage as a possible over-wintering mechanism of the Antarctic Krill, Euphausiasuperba Dana. J Exp Mar Biol Ecol 62: 143−151
Ikeda T, Thomas PG (1987) Molting interval and growth ofjuvenile Antarctic krill (Euphausia superba) fed differentconcentrations of the diatom Phaeodactylum tricornutumin the laboratory. Polar Biol 7: 339−343
Jones CD, Ramm DC (2004) The commercial harvest of krillin the southwest Atlantic before and during the CCAMLR2000 Survey. Deep-Sea Res II 51: 1421−1434
Kawaguchi S, Nicol S (2007) Learning about Antarctic krillfrom the fishery. Antarct Sci 19: 219−230
77
Mar Ecol Prog Ser 547: 61–78, 2016
Kawaguchi S, Candy S, Nicol S, Taki K, Naganobu M (2005)Analysis of trends in Japanese krill fishery CPUE data,and its possible use as a krill abundance index. CCAMLRSci 12: 1−28
Kawaguchi S, Candy SG, King R, Naganobu M, Nicol S(2006) Modelling growth of Antarctic krill. I. Growthtrends with sex, length, season, and region. Mar EcolProg Ser 306: 1−15
Kawaguchi S, Finley LA, Jarman S, Candy SG and others(2007) Male krill grow fast and die young. Mar Ecol ProgSer 345: 199−210
Kinzey D, Watters GM, Reiss CS (2015) Selectivity and twobiomass measures in an age-based assessment ofAntarctic krill (Euphausia superba). Fish Res 168: 72−84
Lasker R (1966) Feeding, growth, respiration and carbon uti-lization of a euphausiid crustacean. J Fish Res Board Can23: 1291−1317
Macdonald PDM, Pitcher TJ (1979) Age-groups from size-frequency data: a versatile and efficent method of ana -lysing distribution mixtures. J Fish Res Board Can 36: 987−1001
Mackintosh NA (1972) Life-cycle of Antarctic krill in relationto ice and water conditions. Discov Rep 36: 1−94
Makarov RR (1976) Reproduction of Euphausia superba(Dana) (Crustacea: Euphausiacea). Proc All-Union SciRes Inst Mar Fish Oceanogr 110: 85−89 (translated fromRussian)
Marr JWS (1962) The natural history and geography of theAntarctic krill. Discov Rep 32: 33−464
McClatchie S (1988) Food-limited growth of Euphausiasuperba in Admiralty Bay, South Shetland Islands,Antarctica. Cont Shelf Res 8: 329−345
McWhinnie MA, Denys CJ, Parkin R, Parkin K (1979) Biological investigations of Euphausia superba (krill).Antarct J US 14:163–164
Meyer B (2012) The overwintering of Antarctic krill,Euphausia superba, from an ecophysiological perspec-tive. Polar Biol 35: 15−37
Miller D, Agnew D (2000) Management of krill fisheries inthe Southern Ocean. In: Everson I (ed) Krill biology, ecol-ogy and fisheries. Oxford Blackwell Science, p 300−337
Miller DGM, Hampton I (1989) Biology and ecology of theAntarctic krill, Vol 9. SCOR, Cambridge, UK
Morris DJ, Watkins JL, Ricketts C, Buchholz F, Priddle J(1988) An assessment of the merits of length and weightmeasurements of Antarctic krill Euphausia superba. BrAntarct Surv Bull 79: 27−50
Nicol S (2000) Understanding krill growth and aging: thecontribution of experimental studies. Can J Fish AquatSci 57: 168−177
Nicol S, Stolp M, Cochran T, Geijsel P, Marshall J (1992)Growth and shrinkage of Antarctic krill Euphausiasuperba from the Indian Ocean sector of the SouthernOcean during summer. Mar Ecol Prog Ser 89: 175−181
Pitcher T, MacDonald P (1973) Two models for seasonalgrowth in fishes. J Appl Ecol 10: 599−606
Pond D, Watkins J, Priddle J, Sargent J (1995) Variation inthe lipid content and composition of Antarctic krillEuphausia superba at South Georgia. Mar Ecol Prog Ser117: 49−57
Quetin LB, Ross RM (1991) Behavioural and physiologicalcharacteristics of Antarctic krill Euphausia superbaDana. Am Zool 31: 49−63
Quetin LB, Ross RM, Clarke A (1994) Krill energetics: sea-sonal and environmental aspects of the physiology ofEuphausia superba. In: El-Sayed SZ (ed) SouthernOcean Ecology: the BIOMASS perspective. Cambridge
University Press Cambridge, p 165−184Quetin LB, Ross RM, Frazer TK, Amsler MO, Wyattevens C,
Oakes SA (2003) Growth of larval krill, Euphausiasuperba, in fall and winter west of the Antarctic Penin-sula. Mar Biol 143: 833−843
Quinn TJ, Deriso RB (1999) Quantitative fish dynamics.Oxford University Press, Oxford
Reid K (2001) Growth of Antarctic krill Euphausia superbaat South Georgia. Mar Biol 138: 57−62
Rosenberg AA, Beddington JR, Basson M (1986) Growthand longevity of krill during the first decade of pelagicwhaling. Nature 324: 152−153
Schmidt K, Atkinson A, Steigenberger S, Fielding S and oth-ers (2011) Seabed foraging by Antarctic krill: implica-tions for stock assessment, bentho-pelagic coupling, andthe vertical transfer of iron. Limnol Oceanogr 56: 1411−1428
Schmidt K, Atkinson A, Pond DW, Ireland LC (2014) Feed-ing and overwintering of Antarctic krill across its majorhabitats: the role of sea ice cover, water depth, andphytoplankton abundance. Limnol Oceanogr 59: 17−36
Shelton AO, Kinzey D, Reiss C, Munch S, Watters G, MangelM (2013) Among-year variation in growth of Antarctickrill Euphausia superba based on length-frequency data.Mar Ecol Prog Ser 481: 53−67
Siegel V (1986) Untersuchungen zur Biologie des antarkti-schen Krill, Euphausia superba, im Bereich der Brans-field Straße und angrenzender Gebiete. Mitt Inst See -fischerei 38: 1–244
Siegel V (1987) Age and growth of Antarctic Euphausiacea(Crustacea) under natural conditions. Mar Biol 96: 483−495
Siegel V (2000) Krill (Euphausiacea) life history and aspectsof population dynamics. Can J Fish Aquat Sci 57: 130−150
Siegel V (2012) Krill stocks in high latitudes of the AntarcticLazarev Sea: seasonal and interannual variation in distri-bution, abundance and demography. Polar Biol 35: 1151−1177
Siegel V, Loeb V (1994) Length and age at maturity ofAntarctic krill. Antarct Sci 6: 479−482
Siegel V, Nicol S (2000) Population parameters. In: Everson I(ed) Krill biology, ecology and fisheries. Blackwell Science, Oxford, p 103−149
Stepnik R (1982) All year populational studies of Euphausi-acea (Crustacea) in the Admiralty Bay (King GeorgeIsland, South Shetland Islands, Antarctica). Pol Polar Res3: 49−68
Tarling GA, Cuzin-Roudy J, Thorpe SE, Shreeve RS, WardP, Murphy EJ (2007) Recruitment of Antarctic krillEuphausia superba in the South Georgia region: adultfecundity and the fate of larvae. Mar Ecol Prog Ser 331: 161−179
Tarling GA, Klevjer T, Fielding S, Watkins JL and others(2009) Variability and predictability of Antarctic krillswarm structure. Deep-Sea Res I 56: 1994−2012
Thomas P, Ikeda T (1987) Sexual regression, shrinkage,rematuration and growth in spent females Euphausiasuperba in the laboratory. Mar Biol 95: 357−363
Thorpe SE, Heywood KJ, Stevens DP, Brandon MA (2004)Tracking passive drifters in a high resolution oceanmodel: implications for interannual variability of larvalkrill transport to South Georgia. Deep-Sea Res I 51: 909−920
Thorpe SE, Murphy EJ, Watkins JL (2007) Circumpolar connections between Antarctic krill (Euphausia superbaDana) populations: Investigating the roles of ocean andsea ice transport. Deep-Sea Res I 54: 792−810
78
Editorial responsibility: Anna Pasternak, Moscow, Russian Federation
Submitted: November 3, 2015; Accepted: January 25, 2016Proofs received from author(s): March 21, 2016
➤
➤
➤
➤
➤
➤
➤
➤
➤
➤
➤
➤
➤
➤
➤
➤
➤
➤
➤
➤
➤
➤
➤
➤
➤
➤