ccc future energy needs/capability report-22-04-2014
TRANSCRIPT

Project Name Document Name
1
Infrastructure in a
low-carbon energy
system to 2030:
Transmission and
distribution
Final report
for
The Committee on
Climate Change
Imperial College
and
Element Energy
22nd April 2014
Element Energy Limited
20 Station Road
Cambridge CB1 2JD
Tel: 01223 852499
Fax: 01223 353475

Infrastructure in a low-carbon energy system to 2030: Transmission and distribution
Caveat
While the authors consider that the data and opinions in this report are sound, all parties
must rely on their own judgement and skill when using it. The authors do not make any
representation or warranty, expressed or implied, as to the accuracy or completeness of
the report. Any maps, tables and graphs are provided for high-level illustrative purposes
only; no detailed location-specific studies have been carried out. All models are limited by
the quality and completeness of input assumptions. “Over-analysis” of site-specific results
is strongly discouraged. The authors assume no liability for any loss or damage arising
from decisions made on the basis of this report.
The views and judgements expressed here are the opinions of the authors and do not
reflect those of the CCC or the stakeholders consulted during the course of the project.
Element Energy
Emrah Durusut
Shane Slater
Imperial College
Goran Strbac
Danny Pudjianto
Predrag Djapic
Marko Aunedi

Infrastructure in a low-carbon energy system to 2030: Transmission and distribution
Contents
1 Introduction ..................................................................................................................... 1
1.1 Background ............................................................................................................... 1
1.2 Transmission and distribution.................................................................................... 1
2 Characterisation and cost of transmission infrastructure to 2030 .................................. 4
2.1 Network expansion in the Core Decarbonisation Scenario ....................................... 4
2.2 Network expansion in the No Climate Action Scenario (NCA) .................................. 8
2.3 Network expansion in the Delayed Electrification (DE) Scenario ........................... 11
2.4 Sensitivity studies .................................................................................................... 15
2.5 Comparison across scenarios ................................................................................. 23
3 Characterisation and cost of distribution infrastructure to 2030 ................................... 28
4 Feasibility of transmission and distribution deployment in the UK ............................... 33
4.1 Potential barriers, remedial actions and responsibilities for delivery of transmission
and interconnection capacity ............................................................................................ 33
4.2 Timelines and deployment of transmission and interconnection capacity .............. 37
4.3 Potential barriers, remedial actions and responsibilities for delivery of distribution
network capacity ............................................................................................................... 41
5 Conclusions .................................................................................................................. 45
5.1 Transmission ........................................................................................................... 45
5.2 Distribution............................................................................................................... 46
6 Appendix ....................................................................................................................... 47
6.1 Methodology and assumptions................................................................................ 47
6.2 Detailed transmission costs ..................................................................................... 57
6.3 Detailed distribution costs ....................................................................................... 58

Infrastructure in a low-carbon energy system to 2030: Transmission and distribution
Figures
Figure 1: The UK’s electricity generation mix in 2030 in the CCC scenarios. ...................... 2
Figure 2: Additional transfer capacity needed for each GB main transmission boundaries
by 2020 and 2030 (CD scenario) .......................................................................................... 6
Figure 3: Interconnectors: transfer capacity and investment needed by 2030 (NCA
scenario) ................................................................................................................................ 8
Figure 4: Additional transfer capacity needed for each GB main transmission boundaries
by 2020 and 2030 (NCA scenario) ........................................................................................ 9
Figure 5: Installed generating capacity and peak demand in South West for both NCA and
CD scenarios ....................................................................................................................... 10
Figure 6: Additional transfer capacity needed for each GB main transmission boundaries
by 2020 and 2030 (DE scenario)......................................................................................... 13
Figure 7: Impact of European electricity market integration on the UK interconnectors
(sensitivity based on CD scenario) ...................................................................................... 16
Figure 8: Impact of European electricity market integration on the GB MITS ..................... 17
Figure 9: Impact of fast charging on the UK interconnectors .............................................. 19
Figure 10: Impact of Fast Charging on the GB MITS .......................................................... 20
Figure 11: Impact of Demand Response on the UK interconnectors.................................. 21
Figure 12: Impact of Demand Response on the GB MITS ................................................. 22
Figure 13: Modelling of EU Grid .......................................................................................... 48
Figure 14: DTIM Cost-benefit analysis ................................................................................ 50
Figure 15: A reduced GB main transmission system (transfer capacities in 2013) ............ 51
Figure 16: Methodology block diagram for distribution network analysis............................ 54
Figure 17: After-diversity profiles of EV charging for BaU and Smart scenarios ................ 56
Figure 18: After-diversity profiles of domestic (l) and commercial HPs (r) .......................... 56
Figure 19: Cluster parameters ............................................................................................. 56
Figure 20: Reinforcement cost 2020 for core decarbonisation (a), delayed electrification (b)
and no climate action (c) scenarios ..................................................................................... 59
Figure 21: Reinforcement cost 2025 for core decarbonisation (l), delayed electrification (m)
and no climate action (r) scenarios ..................................................................................... 60
Figure 22: Reinforcement cost 2030 for core decarbonisation (a), delayed electrification (b)
and no climate action (c) scenarios ..................................................................................... 61

Infrastructure in a low-carbon energy system to 2030: Transmission and distribution
Figure 23: Reinforcement cost 2030 for uneven EV and HP distribution (a), demand
response (b) and no fast charging (c) sensitivities .............................................................. 63

Infrastructure in a low-carbon energy system to 2030: Transmission and distribution
Tables
Table 1: Interconnectors: additional transfer capacity and investment needed by 2020 and
2030 (CD scenario) ............................................................................................................... 4
Table 2: Regions of transmission reinforcement ................................................................... 7
Table 3: Investment cost for upgrading the transfer capacity of GB main transmission
infrastructure (in £bn). Costs in the 2020-2030 period are in addition to the costs in the
previous period. (CD scenario) .............................................................................................. 7
Table 4: Investment cost for upgrading the capacity of GB main transmission infrastructure
(in £bn, NCA scenario) .......................................................................................................... 9
Table 5: Interconnectors: transfer capacity and investment needed by 2020 and 2030 (DE
scenario) .............................................................................................................................. 11
Table 6: Investment cost for upgrading the capacity of GB main transmission infrastructure
(in £bn) ................................................................................................................................ 14
Table 7: Investment cost for upgrading the capacity of GB main transmission infrastructure
(in £bn) ................................................................................................................................ 18
Table 8: Investment cost for upgrading the capacity of GB main transmission infrastructure
(in £bn) ................................................................................................................................ 23
Table 9: Total investment cost for upgrading UK interconnectors (in £bn) ......................... 24
Table 10: Total investment cost for upgrading GB MITS (in £bn) ....................................... 26
Table 11: Total investment cost for upgrading UK interconnectors and GB MITS (in £bn) 26
Table 12: Summary of volumes of new distribution assets ................................................. 29
Table 13: Summary of costs of new distribution assets ...................................................... 30
Table 14: Potential savings of advanced voltage control .................................................... 31
Table 15: Key barriers and remedial actions for delivery of transmission infrastructure .... 35
Table 16: Additional capacity and investment needed by region in the CD scenario ......... 37
It should be noted that the additional capacity requirements are those for an optimised
network, and prioritising or shortlisting key pieces of infrastructure has limited validity.
Nevertheless table 17 does clearly show the importance of network upgrades in Scotland,
and from Scotland to England, and Midlands-South (highlighted in red). The driver behind
these upgrades is the additional wind capacity onshore and offshore in Scotland, which
needs to be brought to centres of demand. Also, the above network accommodates
significant transfer of wind energy from Ireland to Great Britain, and onwards to other
markets. ............................................................................................................................... 37
Table 18: Timeline for delivery of interconnectors .............................................................. 38
Table 19: Key barriers and remedial actions for delivery of distribution infrastructure ....... 44
Table 20: Interconnection length and unity cost .................................................................. 52

Infrastructure in a low-carbon energy system to 2030: Transmission and distribution
Table 21: Mapping of representative networks (RN) onto actual GB distribution networks 53
Table 22: Deployment of Low Carbon Technologies (LCTs) .............................................. 55
Table 23: Growth rate of demand excluding LCTs.............................................................. 55
Table 24: Average reinforcement unit costs ........................................................................ 55
Table 25: Cluster parameters .............................................................................................. 56
Table 26: Investment cost for upgrading UK interconnectors (in £bn) ................................ 57
Table 27: Investment cost for upgrading GB MITS (in £bn) ................................................ 57
Table 28: Reinforcement cost across time – CD vs. Uneven EV and HP distribution ........ 63
Table 29: Distribution of customers per regions .................................................................. 63

Infrastructure in a low-carbon energy system to 2030: Transmission and distribution
1
1 Introduction
1.1 Background
The Committee on Climate Change commissioned Element Energy, with Imperial College
and Grid Scientific, to characterise and cost the infrastructure that would be required for a
low carbon system by 2030. The study explored infrastructure challenges associated with
three distinct sectors/technologies:
The transmission and distribution system
Carbon Capture and Storage
Smart Grid for delivering Demand Side Response
For each of these, the authors explored:
A number of decarbonisation scenarios to 2030.
The implications of these on the requirements on the above infrastructures, in
terms of their extent and their cost.
The barriers to the deployment of these infrastructures
This document is one of three reports produced by the authors, and focuses on the
characterisation, cost and deployment challenges associated with transmission and
distribution networks.
1.2 Transmission and distribution
The UK’s path towards a sustainable and low-carbon energy system will require a major
shift in the structure of electricity generation technologies, primarily involving intermittent
renewable resources and large-scale low-emission or zero-emission technologies such as
nuclear power and Carbon Capture and Storage. Large-scale deployment of these
technologies raises complex challenges in planning the supporting electricity infrastructure
and real-time operation management of the system. Efficient planning of and investment in
the cross-border and intra-transmission system will play a key role in facilitating cost
effective transition to a low carbon future and it will be crucial that the investment decisions
are timely.
This study examines the deployment of transmission and distribution infrastructure under a
variety of CCC scenarios as shown in Figure 1:
The core decarbonisation scenario (CD), in which UK greenhouse gas
emissions are 60% below 1990 levels in 2030, the power sector decarbonises to
around 50 gCO2/kWh and there is extensive electrification of heat and transport
(i.e. deployment of heat pumps and electric vehicles).
The delayed electrification sensitivity (DE), in which electrification of heat and
transport occurs at a slower pace and the power sector decarbonises to around
100 gCO2/kWh.
The “no climate action” scenario (NCA), which will involve demand increasing
with population and incomes, less energy efficiency improvement and very limited
deployment of low-carbon technologies in power, transport or heat.

Infrastructure in a low-carbon energy system to 2030: Transmission and distribution
2
Source: CCC data, with additional OCGT capacity determined by Imperial College models
Figure 1: The UK’s electricity generation mix in 2030 in the CCC scenarios.
In the base case analysis, the assumption is made that the UK is energy neutral, i.e. the
annual electricity production in the UK is equal to annual electricity consumption while
allowing short-term imports or exports of electricity to minimise EU wide system operating
costs.
In addition to the core scenarios, the key features of required distribution and transmission
network investments in the core decarbonisation scenario are assessed for the following
sensitivities:
Impact of European electricity market integration, in which both long-term and
short-term cross border trading is enabled allowing the UK to be an annual net
exporter or net importer, while minimising the overall EU wide generation
operating costs. In this scenario, our analysis focuses on assessing the impact of
electricity market integration on the need for additional investment in cross-border
interconnection and transmission within the UK. .
EVs and HPs unevenly distributed, in which uptake of electric vehicles (EVs)
and heat pumps (HPs) is not distributed evenly (from a geographic perspective). It
is expected that distribution of EVs and HPs may vary across the regions and a
sensitivity analysis on uneven distribution of EVs and HPs is assessed to
investigate possible impacts. It should be noted that the total number of EVs and
HPs in each region is unchanged, while the distribution across the region varies.
For more details see Section 6.1.2 and specifically Figure 19.
Demand response sensitivity, in which reduction in peak demand is achieved by
shifting demand from peak periods. Demand response utilises the flexibility of
smart appliances, smart charging of electric vehicles, heat storage and other
demand side management measures to enhance efficiency of system operation
and reduce the network infrastructure investment.
Fast-charging EVs sensitivity, in which fast-charging stations are installed in
addition to residential charging. This sensitivity study assumes that 28% of EV
demand is met through around 5,000 fast charging stations, each with a charging
capability of 300 kW offered through 6 charging points. The stations are assumed
to be in use between 11am and 11pm. Annual electricity demand for fast charging
is estimated to be 2.76 TWh, with the peak demand of around 1.5 GW occurring in
winter workday evenings.

Infrastructure in a low-carbon energy system to 2030: Transmission and distribution
3
The analysis reported below is based on:
The Imperial College dynamic system and transmission investment models (DSIM
and DTIM) of optimised transmission system infrastructure, given generation
locations and energy consumption at a set of nodes representing the UK
Transmission system, and nearby European nodes.
The Imperial College representative models of UK Distribution Networks.
These are described in more detail in the appendix.
This report is the final deliverable from the “Transmission and Distribution” part of the
Element Energy-led “Infrastructure in a low-carbon energy system to 2030” study for the
CCC and presents:
Characterisation and cost of transmission infrastructure to 2030 including
interconnectors
Characterisation and cost of distribution infrastructure to 2030
Feasibility of T&D deployment in the UK

Infrastructure in a low-carbon energy system to 2030: Transmission and distribution
4
2 Characterisation and cost of transmission infrastructure
to 2030
In this chapter, the requirements for the UK’s interconnection and intra-transmission
capacity are assessed for the CCC scenarios, namely: Core Decarbonisation, No Climate
Action, and Delayed Electrification. A further analysis is also carried out to examine the
characterisation and cost of transmission infrastructure under a variety of sensitivities.
2.1 Network expansion in the Core Decarbonisation Scenario
Table 1 shows the 2013 interconnection capacities, capacities expected to be in place by
2020 and the proposed 2030 capacity requirement for each UK cross-border
interconnector. The Dynamic System Investment Model (DSIM) is used to determine the
optimal interconnection capacity (transfer capacity) in the European system using our EU
Grid model, which includes the electricity systems of Great Britain (GB), Ireland and
continental (detailed description of the model is presented in Appendix).
Table 1: Interconnectors: additional transfer capacity and investment needed by
2020 and 2030 (CD scenario)
Additional transfer
capacity
(MW)
CAPEX of new
capacity
(£bn)
Length
(km)
Capacity
in 2013
(MW)
Planned
transfer
capacity
by 2020
(MW)
Total
transfer
capacity
by 2030
(MW)
Between
2013 -
2020
Between
2020 -
2030
Between
2013 -
2020
Between
2020-
2030
Scotland -
Ireland 380 450 450 2,256 - 1,806 - 0.98
Midlands
E&W - Ireland 480 500 500 6,757 - 6,257 - 4.82
South E&W -
NorthEast
France
440 2,000 2,000 2,769 - 769 - 0.51
South E&W -
NorthWest
France
495 - 1,000 1,000 1,000 0 0.83 0.00
South E&W -
Netherlands 400 1,000 1,000 1,000 - 0 - 0.00
South E&W –
Belgium 380 - 1,000 2,464 1,000 1,464 0.62 0.91
Scotland -
South
Norway
912 - 1,400 1,400 1,400 0 2.93 0.00
South E&W -
South
Norway
1,160 - - 0 - 0 - 0.00
South E&W -
North Spain 1,495 - - 0 - 0 - 0.00
Total 4.39 7.22

Infrastructure in a low-carbon energy system to 2030: Transmission and distribution
5
This includes not only the interconnection to Ireland, France, and the Netherlands, that
exist at present, but also potential future interconnection towards Belgium, Norway, and
Spain. The table shows the expected total capital expenditure (capex) associated with
delivery of the transfer capacity including any onshore network reinforcements that may be
triggered by the interconnection1.
One can observe that by 2020, there will be 3.4 GW of additional interconnection capacity
to mainland Europe, while a further 2.2 GW is proposed to be built by 2030. This indicates
the importance of UK interconnectors to mainland Europe in order to facilitate efficient
development of renewable energy sources not only in the UK but also in Ireland.
In this study, it is envisaged that the capacity of wind power generation in Ireland will reach
23 GW by 2030. This capacity exceeds by far the Irish peak demand, which is around 7
GW at present. In order to harness Irish wind energy, it will be efficient to increase
interconnector capability between Ireland and UK, and then UK and mainland Europe, and
facilitate exports of Irish wind to Europe. This is reflected in the significant upgrade (8.1
GW) of the interconnector between Ireland and the UK. Although the development of Irish
wind also triggers demand for upgrading the UK’s interconnector to the mainland Europe,
this also provides a commercial opportunity for the UK to act as a hub for Irish wind and at
the same time to improve the utilisation factor of its cross border interconnectors to the
mainland Europe.
The upgrade and development of new UK interconnectors will cost around £4.4bn in the
period between 2013 and 2020 and £7.2bn in the period between 2020 and 2030. By
2030, the total cost is estimated at £11.6bn.
In parallel to the development of UK cross-border interconnectors, the onshore and
offshore intra-transmission system within the UK will also require significant upgrades. The
capacity of interconnectors and the projected power flows from/to UK are used by the
Dynamic Transmission Investment Model (DTIM) to determine the transfer capability
across the main transmission boundaries of the Main Interconnection Transmission
System (MITS) in the UK (a detailed description of DTIM is presented in Appendix).
Figure 2 shows the additional capacity needed, with reference to the present capacity
(described in the Appendix, Figure 15), on each of the main transmission boundaries on
the GB system by 2020 and 2030 (the figures adjacent to each boundary indicate the
additional capacity in GW). It is important to note that the additional capacities shown in
Figure 2 (right) are cumulative; 2030 figures include the reinforcement required by 2020.
The boundary reinforcement costs in DTIM are calibrated to reflect the actual costs of
projects associated with increasing boundary capacity as proposed in National Grid’s
“Gone Green” scenario2.
1 The total network costs implicitly include the cost of new substations including transformers, cost of
overhead lines or underground cables, and the installation costs. 2 The cost of boundary reinforcement implicitly includes all infrastructure and installation costs
required taking into account the security level that needs to be satisfied. This is a standard practice for a high level transmission planning studies that makes use aggregated reinforcement cost rather than modelling the individual circuits and the substations involved.

Infrastructure in a low-carbon energy system to 2030: Transmission and distribution
6
Figure 2: Additional transfer capacity needed for each GB main transmission
boundaries by 2020 and 2030 (CD scenario)
Given that the most significant renewable resources, especially large wind farms, are
expected to be located in Scotland or Northern England, most of the transmission
upgrades will be required in those areas. Two DC bootstraps (Western and Eastern) will
also be needed, each with the capacity of 1.8 GW by 2020. The capacity needs to be
further increased to 2.48 GW and 2.18 GW by 2030 for the Western and Eastern
bootstraps, respectively, indicating increased capacity requirement to access renewables
in the north. By 2030, a significant upgrade will also be needed in Wales and East coast to
facilitate power transfer from Ireland to mainland Europe.
The reinforcement requirements are presented on regional basis, as shown in Table 2.
The investment cost of reinforcing the transmission system is estimated at around £4bn by
2020, with another £2.2bn needed between 2020 and 2030, as shown in Table 3.
6.69
2.43
2.67
0.90
2.20
1.22
2.18
2.48
0.11
9.34 -
5.10
4.85 0.24 1.67
2.62 -
Total AC: 40.0 GW
Total DC: 4.7 GW
4.58
0.91
0.98
-
2.20
1.22
1.80
1.80
0.01
1.82 -
2.65
1.54 0.24 -
2.62 -
2020 2030
Total AC: 18.8 GW
Total DC: 3.6 GW

Infrastructure in a low-carbon energy system to 2030: Transmission and distribution
7
Table 2: Regions of transmission reinforcement
Transmission boundaries Length (km) Region
TB1 60
Scotland
TB2 100
TB3 50
TB4 120
TB5 35
TB6 150
Scotland - England Eastern DC bootstrap 330
Western DC bootstrap 280
TB7 150 North to Midlands and Midlands to
South TB9 40
TB10 93
TB8 79 North Wales
TB11 75 Mid-Wales
TB14 195 South West
TB12 80 East Coast and East Anglia
TB15 60
TB13 155 London
Table 3: Investment cost for upgrading the transfer capacity of GB main
transmission infrastructure (in £bn). Costs in the 2020-2030 period are in addition to
the costs in the previous period. (CD scenario)
Region 2013-2020 2020-2030
Scotland 0.38 0.40
Scotland-England 3.00 0.79
North to Midlands and Midlands to South 0.34 0.18
North Wales 0.11 0.46
Mid-Wales 0.15 -
South West 0.04 -
East Coast and East Anglia 0.07 0.15
London - 0.20
Total 4.08 2.19
Note that the investments shown in Table 1 and Table 3 only include the capital cost of
new transmission investment required to accommodate the additional generation required
to meet the decarbonisation objectives in each scenario. In addition to this cost will be the
routine cost of replacing the aging assets and the maintenance cost of existing assets,
which may vary between £1.9m/km – £3.2m/km across the lifetime of the assets3
3 Source: National Grid, Electricity transmission cost study – National Grid’s view p.2,February 2012

Infrastructure in a low-carbon energy system to 2030: Transmission and distribution
8
2.2 Network expansion in the No Climate Action Scenario (NCA)
For the NCA scenario, DSIM does not require any upgrade and reinforcement of the UK’s
interconnectors since the current capacity is already sufficient to facilitate efficient power
exchange between the UK and the mainland Europe. The results are illustrated in Figure
3.
Figure 3: Interconnectors: transfer capacity and investment needed by 2030 (NCA
scenario)
It can be inferred that developing new interconnectors (or upgrading the existing ones) is
predominantly driven by the development of low marginal cost renewable generation. Note
that this result is in line with a recent analysis by Redpoint which identified that the extent
of interconnection capacity was closely related to the deployment of renewable
generation4. Since the NCA scenario does not postulate any further increase in renewable
capacity in the UK and in Ireland compared to today’s levels, the DSIM model suggests
that the present capacity of the interconnectors is adequate.
The demand for upgrading GB main interconnected transmission system (MITS) will be
relatively modest by 2020. DTIM studies suggest the reinforcement of the SYS boundary 1
between the north-west part and north part of the Scottish Hydro Electric Transmission
Limited (SHETL) network, as well as a modest upgrade at the boundary between Midlands
and south part of GB and the south west. The total increased capacity of the on-shore AC
MITS is 1.8 GW. Development of DC bootstraps is not proposed in this scenario.
By 2030, the total investment will be moderate with most of the upgrade occurring in the
south east and south west of GB due to the development of new generation in those areas
to meet the increasing demand. The total increased capacity of the onshore AC MITS is
11.2 GW. There is again no development of any DC bootstraps.
4 “Impacts of further electricity interconnection on Great Britain”, Redpoint Energy Limited
for DECC, November 2013.

Infrastructure in a low-carbon energy system to 2030: Transmission and distribution
9
Figure 4: Additional transfer capacity needed for each GB main transmission
boundaries by 2020 and 2030 (NCA scenario)
The investment cost of reinforcing the transmission system is estimated at about £0.2bn
by 2020 and another £0.9bn will be needed between 2020 and 2030 as shown in Table 4.
Table 4: Investment cost for upgrading the capacity of GB main transmission
infrastructure (in £bn, NCA scenario)
Region 2013-2020 2020-2030
Scotland 0.04 0.12
Scotland-England - -
North to Midlands and Midlands to South - -
North Wales - -
Mid-Wales - -
South West 0.11 0.65
East Coast and East Anglia - 0.16
London 0.02 -
Total 0.17 0.92
There are some transmission developments in a number of regions between 2013 and
2030 in Scotland, East Coast, London and the South West, which is the largest one. The
investment in the South West is considerably greater than the transmission development

Infrastructure in a low-carbon energy system to 2030: Transmission and distribution
10
in the same region in the CD scenario. This is primarily driven by the lack of installed
generating capacity in the South West postulated in the NCA scenario. In the CD scenario,
the presence of new interconnection between South West of England and North West of
France also contributes to providing supply to the demand in South West and therefore
leads to less reinforcement required in the South West corridors. The installed generating
capacity and the peak of demand minus import from the interconnector is shown in the
figure below.
Figure 5: Installed generating capacity and peak demand in South West for both
NCA and CD scenarios
The figure shows a significant capacity gap between the peak demand and generation,
taking into account the interconnection available, and installed generating capacity in
South West in the NCA scenario. This is in contrast to the CD scenario where the installed
capacity is equal or greater than peak demand. As a consequence, there is a need to
reinforce the South West transmission corridor to allow import from other regions.

Infrastructure in a low-carbon energy system to 2030: Transmission and distribution
11
2.3 Network expansion in the Delayed Electrification (DE)
Scenario
The delayed electrification (DE) scenario is similar to the core decarbonisation (CD)
scenario and it has a similar generation mix with a similar level of renewable penetration
(see Figure 1). The key difference between the two scenarios is in the level of
electrification of transport and heating sectors; in the DE scenario this electrification is
slower. The consequence is lower electricity consumption and lower peak demand than in
the CD scenario. Furthermore, the total capacity of low carbon generation technologies
(renewables, nuclear and CCS) is also reduced; hence the average grid CO2 emissions in
this scenario (i.e. 100 g/kWh) are higher compared to the CD scenario (50 g/kWh).
Table 5 shows the 2013 capacity and the proposed 2020 and 2030 capacity requirement
for each UK cross-border interconnector for the DE scenario. Table 5 also shows how
much reinforcement is expected for each interconnector between 2013 and 2020, and
what DSIM suggests should be added between 2020 and 2030. The estimated cost of
each reinforcement project is also given in Table 5.
Table 5: Interconnectors: transfer capacity and investment needed by 2020 and 2030
(DE scenario)
New
transmission
capacity
(MW)
CAPEX of new
transmission
(£bn)
Capa
city
in
2013
(MW)
Planned
boundary
capacity
by 2020
(MW)
Total
boundary
capacity
requirem
ent by
2030
(MW)
Betw
een
2013 -
2020
Betwe
en
2020-
2030
Betwe
en
2013 -
2020
Betwe
en
2020-
2030
Scotland - Ireland
450
450
1,200
-
750
-
0.41
Midlands E&W - Ireland
500
500
7,318
-
6,818
-
5.25
South E&W - NorthEast
France
2,000
2,000
2,572
-
572
-
0.38
South E&W - NorthWest
France
-
1,000
1,000
1,000
0
0.83
0.00
South E&W -
Netherlands
1,000
1,000
1,000
-
-
0
-
-
0.00
South E&W – Belgium
-
1,000
2,108
1,000
1,108
0.62
0.69
Scotland - South Norway
-
1,400
1,400
1,400
0
2.93
0.00
South E&W - South
Norway
-
-
0
-
0
-
0.00
South E&W - North
Spain
-
-
0
-
0
-
0.00
Total
4.39
6.73

Infrastructure in a low-carbon energy system to 2030: Transmission and distribution
12
It is projected that by 2020, there will be a requirement for 3.4 GW of additional
interconnection capacity to mainland Europe and another 1.7 GW will be built between
2020 and 2030. This suggests that upgrading the interconnectors to Europe is vital for the
system to facilitate the development in generation and growth in demand assumed in this
scenario.
As in the CD scenario, the Irish wind capacity is expected to reach 23 GW by 2030. This
requires stronger interconnectors from Ireland to mainland Europe via the UK, as reflected
in the significant upgrade (7.6 GW) of the interconnector between Ireland and the UK.
Again, the development of renewables in Ireland also triggers demand for upgrading the
UK’s interconnector to the mainland Europe, as UK provides a more cost-efficient solution
for the Irish wind to access European electricity markets.
However, the total additional capacity of Ireland-UK interconnectors in this case is slightly
lower compared to the results of CD scenario. This is primarily due to less interconnection
capacity between UK and the mainland Europe and also because of less electricity
demand in the UK that affects the ability of the UK system to absorb wind power.
The upgrade and development of new UK interconnectors will cost circa £4.4bn in the
period between 2013 and 2020 and £6.7bn in the period between 2020 and 2030. By
2030, the total cost is estimated at £11.1 bn.
In order to enable more intensive power exchanges at the UK cross-border
interconnectors, the onshore and offshore intra-transmission system in the UK will also
require significant upgrades. Figure 6 shows the additional GW capacity needed, with
reference to the present capacity, on each of the main transmission boundaries on the GB
system by 2020 and 2030.

Infrastructure in a low-carbon energy system to 2030: Transmission and distribution
13
Figure 6: Additional transfer capacity needed for each GB main transmission
boundaries by 2020 and 2030 (DE scenario)
Similar to the CD scenario, the DE scenario assumes that most of the renewable sources,
especially large wind farms, will be located in Scotland or Northern England, requiring
most of the transmission upgrades are carried out in those areas. Two DC bootstraps
(Western and Eastern) will be needed with 1.8 GW of capacity each by 2020. The capacity
of the Western bootstrap will need to be further increased to 1.91 GW by 2030. This may
provide an opportunity for this bootstrap to be developed strategically in order to avoid the
marginal upgrade between 2020 and 2030.
By 2030, a significant upgrade will also be needed in Wales and East coast to facilitate
power transfer from Ireland to mainland Europe. The investment cost of reinforcing the
transmission system is estimated circa £4bn by 2020 and another £0.8bn will be needed
between 2020 and 2030 as shown in Table 6.

Infrastructure in a low-carbon energy system to 2030: Transmission and distribution
14
Table 6: Investment cost for upgrading the capacity of GB main transmission
infrastructure (in £bn)
Region 2013-2020 2020-2030
Scotland 0.38 0.33
Scotland-England 3.00 0.09
North to Midlands and Midlands to South 0.31 0.05
North Wales 0.11 0.25
Mid-Wales 0.19 0.00
South West - -
East Coast and East Anglia 0.06 0.09
London - -
Total 4.04 0.82
The results also suggest that the period between 2013 and 2020 will be critical given that a
large reinforcement project will be needed to upgrade the main interconnectors between
Scotland and England. This will be essential to allow the demand in south to access
renewable energy sources in the north of the GB system.

Infrastructure in a low-carbon energy system to 2030: Transmission and distribution
15
2.4 Sensitivity studies
The need for the interconnection and transmission infrastructure will also be affected by
other factors such as the availability of both short-term and long-term access to the
neighbouring electricity markets, or the characteristics of electricity demand including the
implementation of Demand Response technologies. In order to quantify the impact of
these factors on the interconnection and transmission infrastructure, we have carried out
three sensitivity studies focusing on:
The impact of European electricity market integration. In this scenario, we
assume that UK does not need to be energy neutral i.e. that UK can export or
import electricity from other European electricity markets not only in the short-
term but also in the long-term energy markets. In other words, UK can be a
net exporter or a net importer. (Note that all other scenarios assume that UK is
energy neutral.) With the full electricity market integration, the interconnection
also provides the opportunity for sharing capacity and to enable adjacent
European Member States to support security for the UK system and vice
versa. This will reduce the amount of generating capacity which is needed to
secure demand;
The national roll out of fast-charging stations for electric vehicles; this will
marginally increase peak demand, which may require upgrading the national
transmission system and have impact on the interconnection requirements;
The implementation of demand response (DR) technologies such as smart
appliances, smart charging electric vehicles, smart control of heat pumps, etc.
may also have implications on the network infrastructure requirements.
All the sensitivity studies are based on the 2030 CD scenario.
Impact of European electricity market integration
The proposed interconnection capacity for the CD scenario and the case with full EU
electricity market integration is compared in Figure 7. The results suggest that significantly
higher interconnection capacities will be required to facilitate a full integration of UK and
EU electricity markets. This is reflected in the increased capacity of UK interconnectors to
France, the Netherlands and Norway, while the largest increase is detected at the UK-
Belgium interconnector – from 2.5 GW to around 6 GW. The total interconnection upgrade
requirement increases from 13.7 GW in the CD scenario to 20.6 GW in the full market
integration case.

Infrastructure in a low-carbon energy system to 2030: Transmission and distribution
16
(a) Core Decarbonisation
(b) Full EU electricity market integration
Figure 7: Impact of European electricity market integration on the UK
interconnectors (sensitivity based on CD scenario)
The increased capacity of interconnectors not only facilitates larger volumes of electricity
to be exchanged but also reduces the capacity of peaking plant in the UK from 29.7 GW to
8.3 GW as the security is now shared across EU Member States. Assuming a capex of

Infrastructure in a low-carbon energy system to 2030: Transmission and distribution
17
peaking plant (i.e. Open Cycle Gas Turbine) of £450/kW5, the savings are circa £9.6
bn..The cost saving from this reduction in generating capacity more than offsets the cost of
upgrading the interconnectors, which increases from £11.6bn (CD) to £16.7bn by 2030.
The electricity market integration also has an impact on the GB MITS. We observe that the
additional capacity requirements in the northern part of GB are slightly lower due to the
slightly larger capacity of the Scotland-Norway interconnector that can help to relieve
congestion of the bulk power transfer from north to south. In the south, the demand for
upgrading the GB MITS is higher, especially in the south-east. This is triggered by the
development of larger GB – mainland Europe interconnectors. The comparison between
the additional capacities proposed for the GB MITS in the CD scenario and the EU full
electricity market integration is illustrated in Figure 8.
(a) Core Decarbonisation (b) Full EU electricity market integration
Figure 8: Impact of European electricity market integration on the GB MITS
The cost of upgrading GB MITS in the second case is lower than in the CD scenario.
Although the total additional capacity is higher, the upgrade of transmission in the second
case happens at the boundaries where the length of the boundary is shorter and therefore
the cost is lower. The total cost of reinforcing GB MITS decreases from £6.3bn to £5.6bn.
The comparison between the cost of upgrading GB MITS in the CD scenario and the EU
full market integration is given in Table 7.
5 Source: National Renewable Energy Laboratory, Cost and Performance Data for Power
Generation Technologies, 2012

Infrastructure in a low-carbon energy system to 2030: Transmission and distribution
18
Table 7: Investment cost for upgrading the capacity of GB main transmission
infrastructure (in £bn)
Region
Core
decarbonisation
Full EU market
integration
Scotland 0.78 0.77
Scotland-England 3.79 3.00
North to Midlands and Midlands to South 0.51 0.49
North Wales 0.58 0.54
Mid-Wales 0.15 0.14
South West 0.04 0.10
East Coast and East Anglia 0.23 0.36
London 0.20 0.24
Total 6.28 5.62

Infrastructure in a low-carbon energy system to 2030: Transmission and distribution
19
Impact of Fast Charging (FC)
The proposed interconnection capacity for the CD scenario and the FC scenario is
compared in Figure 9, which shows that the FC scenario has no visible impact on the
expansion programme of the UK cross-border interconnectors.
(a) Core Decarbonisation
(b) Fast charging
Figure 9: Impact of fast charging on the UK interconnectors

Infrastructure in a low-carbon energy system to 2030: Transmission and distribution
20
The impact of FC on the GB MITS is also modest. This is illustrated in Figure 8, which
suggests that the proposed transmission reinforcement for each major boundary is almost
identical as in the CD scenario. The total additional transmission capacity is only slightly
larger in the FC sensitivity study, since the FC case only increases the peak demand by
around 2 GW in comparison with the CD scenario. The cost of reinforcing the transmission
grid in both cases is therefore very similar.
(a) Core Decarbonisation (b) Fast charging
Figure 10: Impact of Fast Charging on the GB MITS

Infrastructure in a low-carbon energy system to 2030: Transmission and distribution
21
Impact of Demand Response (DR)
The results of our study suggest that the impact that DR has on the expansion programme
of the UK cross-border interconnectors is relatively modest except for the GB-Ireland
interconnectors. DR enables the GB system to accommodate more imported renewable
generation from Ireland, which in turn reduces the capacity requirement for the direct
connection between Ireland and mainland Europe. Other UK interconnectors are not
affected by DR. Figure 11 shows the comparison between the proposed interconnection
capacity for the CD scenario and the DR scenario.
(a) Core Decarbonisation
(b) Demand Response
Figure 11: Impact of Demand Response on the UK interconnectors

Infrastructure in a low-carbon energy system to 2030: Transmission and distribution
22
The national roll-out of DR can help in reducing the additional capacity requirement on the
GB MITS. It can be observed that the additional capacity requirements in most of the main
transmission boundaries are slightly lower in comparison with the reference case (without
DR). The results are expected since DR can effectively reduce the peak demand, which
will in turn reduce the transmission capacity required to exchange power between regions.
However, the impact of DR in this respect is not significant. In total, DR reduces the
additional capacity requirement for the AC system by only 1.5 GW and for the offshore DC
system by only 0.3 GW. The proposed GB MITS reinforcements for both the CD and DR
scenarios are depicted in Figure 12.
(a) Core Decarbonisation (b) Demand Response
Figure 12: Impact of Demand Response on the GB MITS
The cost of upgrading GB MITS in the DR scenario is therefore lower than the cost in the
CD scenario. Our analysis suggests that the savings due to DR by 2030 in reducing
transmission investment are £0.3bn. The comparison between the cost of upgrading GB
MITS in the CD scenario and the DR scenario is given in Table 8.

Infrastructure in a low-carbon energy system to 2030: Transmission and distribution
23
Table 8: Investment cost for upgrading the capacity of GB main transmission
infrastructure (in £bn)
Region Core
decarbonisation Full EU market
integration
Scotland 0.78 0.71
Scotland-England 3.79 3.62
North to Midlands and Midlands to South 0.51 0.51
North Wales 0.58 0.55
Mid-Wales 0.15 0.20
South West 0.04 0.01
East Coast and East Anglia 0.23 0.22
London 0.20 0.17
Total 6.28 5.98
2.5 Comparison across scenarios
In order to analyse the impacts of different scenarios and sensitivities that have been
studied in this project, the calculated costs of upgrading the UK interconnectors, the cost
of upgrading GB MITS and the total cost of both for all case studies are summarised in
Table 9 - Table 11.
Our study suggests that the investment in the UK interconnection will be driven by the
increased installed capacity of low marginal cost generators (nuclear and renewables,
particularly wind power), not only in the UK but also in Ireland and improved integration of
the UK electricity market with continent Europe. This is demonstrated by the results of the
CD, DE and the three sensitivity studies. The results of the NCA scenario also confirm the
findings since, with no increase in the installed capacity of renewables, there is no
increased demand for new UK interconnection capacity.
Considering a scenario with 23 GW of installed wind capacity in Ireland by 2030, the UK –
Ireland interconnection will require major upgrades within 2020 to 2030 period. At the
same time, the UK interconnection to Belgium and France will also need to be reinforced.
If the pace of new installation of renewable power increases between 2020 and 2030, it
will need to be facilitated by reinforcement of the UK interconnection.
Our study also investigates the potential of new interconnection corridors between
Southern England and Southern Norway, and between Southern England and Northern
Spain; the results suggest that interconnection at these two new corridors are not as
competitive economically in comparison to other corridors and therefore the results
indicate no development at these corridors. The total investment costs for upgrading the
UK interconnectors across all scenarios are summarised in Table 9.

Infrastructure in a low-carbon energy system to 2030: Transmission and distribution
24
Table 9: Total investment cost for upgrading UK interconnectors (in £bn)
Core decarbonisation
No Climate Action
Delayed electrification
Full EU Market Integration
Fast charging DSR
Item 2013-2020
2020-2030
2013-2020
2020-2030
2013-2020
2020-2030 2020-2030
2020-2030
2020-2030
Scotland - Ireland - 0.98 - - - 0.41 1.36 1 0.76
Midlands E&W - Ireland
- 4.82 - - - 5.25 4.56 4.79 5.4
South E&W - NorthEast France
- 0.51 - - - 0.38 1.49 0.5 0.56
South E&W - NorthWest France
0.83 0 - - 0.83 0 0 0 0
South E&W - Netherlands
- 0 - - - 0 0.63 0 0
South E&W - Belgium
0.62 0.91 - - 0.62 0.69 3.21 0.97 0.81
Scotland - South Norway
2.93 0 - - 2.93 0 1.04 0 0
South E&W - South Norway
- 0 - - - 0 0 0 0
South E&W - North Spain
- 0 - - - 0 0 0 0
Total cost 4.39 7.22 - - 4.39 6.73 12.3 7.25 7.53
Increased development of UK interconnection capacity between 2020 and 2030 may also
reduce the burden of the intra GB transmission system; this is demonstrated in

Infrastructure in a low-carbon energy system to 2030: Transmission and distribution
25
Table 10 as the reinforcement costs between 2020 and 2030 for CD and DE are less
significant than the reinforcement between 2013 and 2020.
Similar to the interconnection cases, the investment in GB MITS is primarily driven by
development in low marginal cost generators (nuclear, renewables) as demonstrated by
the results for CD, DE, and three sensitivity studies. Significant reinforcement will be
required in the upper part of the GB system particularly for enhancing power transfer
capability between Scotland and England as significant share of new capacity of
renewable power will be installed in the north. The results of NCA also confirm the
findings, and demonstrate low reinforcement requirements in the absence of development
of renewable power generation.

Infrastructure in a low-carbon energy system to 2030: Transmission and distribution
26
Table 10: Total investment cost for upgrading GB MITS (in £bn)
Core decarbonisation
No Climate Action
Delayed electrification
Full EU Market Integration
Fast charging DSR
Item 2013-2020
2020-2030
2013-2020
2020-2030
2013-2020
2020-2030 2020-2030
2020-2030
2020-2030
Scotland 0.38 0.4 0.04 0.12 0.38 0.33 0.39 0.41 0.33
Scotland-England 3 0.79 - - 3 0.09 - 0.84 0.62
North to Midlands and Midlands to South
0.34 0.18 - - 0.31 0.05 0.15 0.19 0.17
North Wales 0.11 0.46 - - 0.11 0.25 0.42 0.47 0.44
Mid-Wales 0.15 - - - 0.19 0 - - 0.04
South West 0.04 - 0.11 0.65 - - 0.07 0.01 -
East Coast and East Anglia
0.07 0.15 - 0.16 0.06 0.09 0.29 0.16 0.15
London - 0.2 0.02 - - - 0.24 0.22 0.17
Total cost 4.08 2.19 0.17 0.92 4.04 0.82 1.56 2.29 1.91
The total costs of investment in the UK interconnection and GB MITS across all scenarios
are summarised in Table 11.
Table 11: Total investment cost for upgrading UK interconnectors and GB MITS (in
£bn)
Core decarbonisation
No Climate Action
Delayed electrification
Full EU Market Integration
Fast charging DSR
Item 2013-2020
2020-2030
2013-2020
2020-2030
2013-2020
2020-2030 2020-2030
2020-2030
2020-2030
UK Interconnection 4.39 7.22 - - 4.39 6.73 12.30 7.25 7.53
UK Transmission 4.08 2.19 0.17 0.92 4.04 0.82 1.56 2.29 1.91
Total cost 8.47 9.41 0.17 0.92 8.42 7.54 13.85 9.54 9.44
It can be concluded that in most of the cases, the decarbonisation of the UK energy
system is the main driver for enhancing the capacity of UK interconnectors and the GB
MITS. This is demonstrated by modest investment requirement in the NCA scenario; while
other scenarios which are based on the CD scenario require significant investment cost.
As a summary, the investment needed for upgrading UK interconnectors and GB MITS in
the CD scenario and its sensitivity cases may reach £18bn to £22bn within the period
2013-2030. In contrast, the total respective investment in the NCA scenario is only circa
£1.1bn in the same period.

Infrastructure in a low-carbon energy system to 2030: Transmission and distribution
27
Another key driver for the network investment is the improved market integration between
the UK and the rest of EU electricity markets. Although the investment cost increases by
circa 47% in this case in comparison to the CD scenario in the period 2020-2030, the
benefits of market integration are significant. For instance:
It reduces the UK generating capacity requirement, particularly low load factor
peaking plant that would be required to support security of supply.
It reduces overall generation operation costs, as market integration facilitates
increased utilisation of low marginal cost generation and reduces operation of high
marginal costs generation
More analysis on the benefits of market integration can be found in the report to the EU
Commission Directorate General of Energy entitled: “Benefits of an Integrated European
Energy Market”6.
The increased peak demand due to the deployment of fast charging stations for Electric
Vehicles will also contribute to the increased investment cost of interconnection and
transmission network infrastructure, but the impact is relatively modest.
In the DE scenario, the investment cost is £1.8bn lower than in the CD scenario. This is
expected given that with less electrification of heating and transport sectors, the demand
for additional infrastructure will also be lower.
With demand response, the impact on the overall cost is modest. On one hand, DR
reduces the need for upgrading the GB MITS but on the other hand it facilitates higher
volumes of power to be exchanged with Ireland and enables the GB demand to absorb
more renewable sources.
6 http://ec.europa.eu/energy/infrastructure/studies/doc/20130902_energy_integration_benefits.pdf

Infrastructure in a low-carbon energy system to 2030: Transmission and distribution
28
3 Characterisation and cost of distribution infrastructure
to 2030
Key objective of this chapter is to assess the level of distribution infrastructure
reinforcement required by 2030 across the range of scenarios and sensitivities considered.
To produce these outputs we have used the Imperial models of representative UK
distribution networks. Imperial has developed a number of synthetic, statistical networks,
which have been shown to be representative of different kinds of UK distribution networks.
Expected UK electricity loads are distributed on these modelled networks, and where the
infrastructure is determined to be insufficient, additional capacity is added to the networks.
More information is provided in the appendices.
As with the transmission modelling, the distribution models were run for the three
scenarios outlined previously in this report. Three sensitivities were run on the core
decarbonisation scenario.
Table 12 shows the summary of volumes of new distribution assets for the whole of GB
across all scenarios and sensitivities considered in this study, and the breakdown of
reinforcement costs is given in Table 13.
More details on the modelling is provided in the appendix, however to determine the levels
of infrastructure investment required, there are a number of failure criteria. These are:
thermally driven constraints – where the power flow through a line or cable is
above its rating7;
voltage driven constraints – where the voltage at a connection point is outside
statutory limits8;
transformer rating constraints – where the power flow through a transformer is
above its rating9;
substation constraints – where the capacity of substations is insufficient to security
meet the demand10
.
When any of these failure criteria are identified, in the model, an investment is needed to
overcome the relevant constraint. The investments are tabulated below.
7 The maximum loading of the circuit cannot exceed the circuit rating. Network operators take into
the account the maximum current and actual ambient conditions when specifying the threshold for a secure network operation i.e. to satisfy the security of supply standard. Network operators keep the current below the threshold by reinforcing the electric circuit or, if possible, by other mitigating actions (e.g. demand side response). 8 Network operators have the obligation to ensure that the voltage at the connection point satisfies
the statutory limits. On long circuits the voltage drop (or rise in the case of generation connections) can be significant enough to warrant the circuit upgrade before the thermally driven constraints trigger reinforcement. 9 The transformers have an adequate rating in order that the security of supply standard is satisfied
while keeping safe operation of the transformer. 10
The total rating of a group of transformers in a substation needs to satisfy the security of supply standard while keeping safe operation of transformers.

Infrastructure in a low-carbon energy system to 2030: Transmission and distribution
29
Table 12: Summary of volumes of new distribution assets
Scenario Year Low voltage
network
upgrade length
– thermal
driven (km)
Low voltage
network
upgrade
length -
voltage
driven (km)
Number of
upgraded
distribution
transformers
High
voltage
network
upgrade
length (km)
Number of
upgraded
primary
substations
Core decarb. 2020 21,280 10,781 50,643 26,393 1,228
2025 52,205 36,746 156,595 76,227 1,875
2030 87,424 46,784 278,898 109,825 2,465
Delayed
electrification
2020 10,610 5,543 25,828 12,945 0
2025 34,520 30,647 103,401 49,708 1,875
2030 63,516 46,562 209,802 89,760 1,875
No climate
action (NCA)
2020 21,011 26,335 80,463 33,681 0
2025 39,366 40,648 158,773 60,184 1,875
2030 59,138 52,722 223,262 84,800 1,899
Uneven EV &
HP distr. 2030 77,895 36,119 250,062 90,213 1,917
DR 2030 79,801 46,038 255,198 106,057 2,199
Fast charging 2030 87,424 46,784 283,979 109,832 2,470
Source: Imperial College
The Delayed Electrification is the least-cost scenario in the years 2020 and 2025, while the
No Climate Action scenario has the lowest cost in 2030. The Core Decarbonisation
scenario is always more expensive than the Delayed Electrification due to higher
penetration of EVs and HPs while base demand is the same. The NCA scenario however
is characterised by higher base peak demand then the other two scenarios, due to limited
energy efficiency measures. Another finding is that uneven EV and HP distribution
throughout the network might require slightly less network reinforcement than with a
uniform EV and HP distribution, reducing the network reinforcement cost from £31.4bn to
£26.3bn. Given that the penetration of EVs and HPs is relatively high in the CD scenario,
network reinforcement cost are lower when these technologies are confined to limited
areas, rather then being uniformly distributed. On the other hand, if the overall penetration
of EVs and HPs was low, then the cost of network reinforcement would be higher if these
are concentrated in limited areas, rather than widespread. The use of Demand response
also results in reinforcement cost savings in this case, where cost is reduced from £31.4bn
to £29.7bn for the BaU option. The fast-charging option is only marginally more expensive
given the relatively small number of charging stations compared to the number of
distribution transformers that have to be upgraded.

Infrastructure in a low-carbon energy system to 2030: Transmission and distribution
30
Table 13: Summary of costs of new distribution assets
Scenario Year Low
voltage
network
upgrade –
thermal
driven
(£bn)
Low
voltage
network
upgrade -
voltage
driven
(£bn)
Distribution
transformers
upgrade (£bn)
High
voltage
network
upgrade
(£bn)
Primary
substations
upgrade
(£bn)
Extra
high
voltage
network
upgrade
(£bn)
Total
upgrade
cost (£bn)
Core decarb. 2020 2.08 1.06 0.48 2.52 0.93 1.42 8.50
2025 5.12 3.62 1.44 6.53 1.42 3.62 21.74
2030 8.57 4.60 2.28 9.04 1.86 5.05 31.40
Delayed
electrification
2020 1.04 0.55 0.24 1.18 0.00 0.60 3.61
2025 3.38 3.02 0.90 4.32 1.42 2.61 15.65
2030 6.23 4.58 1.78 7.49 1.42 4.30 25.79
No climate
action (NCA)
2020 2.06 2.59 0.66 2.70 0.00 1.60 9.61
2025 3.86 4.00 1.26 4.93 1.42 3.09 18.57
2030 5.80 5.19 1.73 6.85 1.44 4.20 25.20
Uneven EV &
HP distr. 2030 7.63 3.55 1.98 7.44 1.45 4.27 26.32
DSR 2030 7.82 4.53 2.08 8.74 1.66 4.85 29.68
Fast charging 2030 8.57 4.60 2.28 9.05 1.87 5.06 31.42
Source: Imperial College
In addition to Business as Usual (BaU) network reinforcement we have also considered
application of advanced voltage control (smart transformer option). In the BaU option, the
violations of voltage constraints in the LV networks are mitigated by upgrading the
conductors, a relatively expensive process which can be avoided by the application of
advanced area voltage control through installing smart transformers. This technology in
various forms is available and is expected to be commercially applied when the market
need materialises. The potential savings across all scenarios are presented in Table 14.
Irrespective of the scenario, the Smart transformer option is less expensive than BaU.
The highest potential savings are expected in the NCA scenario, driven by the low level of
energy efficiency measures deployed in this scenario. It is interesting to observe that the
potential savings are generally greater in 2025 than in 2030. The reason is that for a
proportion of circuit reinforcements, initially the voltage driven investments (in 2025)
become thermally driven (in 2030), which cannot be mitigated by the advanced voltage
control.

Infrastructure in a low-carbon energy system to 2030: Transmission and distribution
31
Table 14: Potential savings of advanced voltage control
Scenario Year
Cost BaU
(£bn)
Cost Smart Transformer
Option (£bn)
Potential savings
(£bn)
Core decarb.
2020 8.5 7.5 1.0
2025 21.7 18.3 3.4
2030 31.4 28.1 3.3
Delayed
electrification
2020 3.6 3.1 0.5
2025 15.6 12.8 2.9
2030 25.8 21.4 4.3
No climate action
(NCA)
2020 9.6 7.2 2.4
2025 18.6 14.8 3.8
2030 25.2 20.3 4.9
Uneven EV & HP
distr. 2030 26.3 23.7
2.7
DR 2030 29.7 26.0 3.7
Fast charging 2030 31.5 28.1 3.4
Source: Imperial College
The detailed reinforcement costs for 2030 are also shown in the Appendix for the three
scenarios and the three sensitivities. The breakdown of investment cost is also given for
five GB regions, which suggests that the highest reinforcement is needed in South
England followed by North England. These broadly follow the distribution of customers per
region (see Appendix):
We observe that in 2020, CD and NCA scenarios are characterised by similar
overall distribution network reinforcement costs, while the cost associated with the
DE scenario are significantly lower.
In 2025, the distribution network reinforcement costs more than double in the CD
and NCA scenarios, while the cost in the DE scenario increase more significantly
as the penetration levels of low carbon technologies accelerates.
In 2030, expected cumulative distribution network reinforcement cost for the CD
scenario are about £31.4bn, while the DE and NCA scenarios are characterised
by about 15%-20% lower costs.
Costs of distribution network reinforcement associated with uneven distribution,
application of additional demand response and absence of fast charging are
marginally lower.
In summary, the key features of required distribution network investment in different
scenarios are as follows:
Core decarbonisation scenario: High (£31.4bn by 2030) – driven by rapid
electrification of heat and transport demand (despite energy efficiency
measures),

Infrastructure in a low-carbon energy system to 2030: Transmission and distribution
32
Delayed electrification scenario: Moderate (£25.8bn) – due to slower growth of
electrified heat and transport demand requiring less grid reinforcements,
No climate action scenario: Moderate (£25.2bn) – despite the lack of heat and
transport electrification, reinforcements are needed due to faster demand
growth resulting from less ambitious improvements in energy efficiency.
The impact of sensitivities performed on the CD scenario has been found to be the
following:
Uneven EV and HP distribution: Cost reduced by £5.1bn – higher
reinforcement in areas with high EV and HP concentration more than offset by
the cost avoided in areas with little or no EVs and HPs,
DSR: Cost reduced by £1.7bn – resulting from DSR being able to reduce
peaks in local networks,
Fast charging: Slight increase compared to CD scenario (by £0.1bn) – fast
charging requires reinforcements of HV distribution networks.

Infrastructure in a low-carbon energy system to 2030: Transmission and distribution
33
4 Feasibility of transmission and distribution deployment
in the UK
4.1 Potential barriers, remedial actions and responsibilities for
delivery of transmission and interconnection capacity
This section discusses the key challenges and barriers that will need to be overcome in
order to ensure the deployment of efficient volumes of transmission and interconnection
capacity in the GB electricity system.
(1) Lack of coordination in planning in onshore networks, offshore networks
and interconnection
Given the carbon reduction targets, a substantial expansion of onshore and offshore
transmission capacity and interconnection is expected. In Great Britain, it is projected that
an unprecedented amount of transmission investment will take place in the next 10-15
years. Indicatively, these investments will be the largest transmission network
reinforcements since post WW II expansion. Although an exceptionally large transmission
investment program is expected over the next decade, there is currently a lack of
coordination between planning in onshore networks, offshore networks and
interconnection regimes, and given that the interaction between these regimes is growing
in the absence of efficient locational marginal pricing framework, efficiency in network
investment may be undermined.
The unprecedented level of transmission investment that is expected to take place will
increase the risks associated with the decision making process, particularly as uncertainty
in timing, location and volume of this investment will be significant. The consequence of
the lack of coordination between regimes could lead to sub-optimal investment in network
infrastructure, which would increase the overall cost of delivery of transmission network
assets.
These coordination concerns, including the growing complexity and interactions between
transmission network regimes, could be addressed by Government through establishing
the GB Independent System Operator (GB-ISO) as an entity responsible for operating all
onshore and offshore transmission networks in GB including interconnection, and for
coordinating onshore, offshore and interconnection transmission plans. An alternative
approach is a Shadow Independent Design Authority (IDA), which would scrutinise and
challenge Transmission Owners’ (TOs11
) plans and co-ordinate planning across regimes
through engagement with TOs and project developers. The emerging consensus on
enhancing National Grid Electricity Transmission (NGET’s) role to include new
responsibilities for coordination of system planning, identifying strategic system needs and
identifying coordination opportunities, is in line with the above recommendations.
In addition, it will be important to improve the interface between regimes (e.g.
interconnectors pay the equivalent TNUoS12
charge), extend good practice schemes (e.g.
Network Access Policy) so as to improve co-ordination between TOs. In the longer term,
11
By TOs in this case we refer to onshore, offshore and cross-border transmission owners 12
For further information: National Grid, TNUoS tariffs for 2013/14, January 2013

Infrastructure in a low-carbon energy system to 2030: Transmission and distribution
34
GB-ISO should be supported by implementing an efficient locational marginal pricing
market mechanism13
.
(2) Lack of EU-wide market integration
It is unlikely that sufficient interconnection capacity will be deployed with the current weak
level of EU-wide coordination, burdened with conflicting interests driven by asymmetrical
benefits of interconnection between neighbouring systems. To facilitate European
electricity market integration, adequate coordination and compensation regimes will need
to be established and cross-government coordination at EU level will be required. The
increased level of coordination will require commitment from all EU Member States as well
as the European Commission. If not successfully resolved, the lack of coordination will
lead to an unnecessary increase in generation investment and system operating cost.
(3) Lack of stable interconnection regime
Delivery of adequate volumes of interconnection capacity with neighbouring countries may
become compromised by uncertainties in the future commercial regime for
interconnection, i.e. whether they will be built as merchant project (under auctions similar
to the offshore regime) or as a part of regulated businesses. The underinvestment in
interconnection will lead to an increase in generation operating cost and in unnecessary
overinvestment in generation capacity in the UK.
In order to overcome this barrier, a cap and floor on the revenue that interconnector
owners earn may be introduced. The level of cap and floor will in effect determine whether
a project is classified as merchant or regulated. In case that the floor for revenue is set
significantly below the cost of debt of the project then equity investors in effect take
significant merchant risk given that the revenue will depend on the cross-border price
arbitrage. In this case, the driver for establishing the cap & floor is to satisfy EU regulations
regarding interconnections and at the same time cover some of the compliance costs that
developers face. It would be important that Ofgem / DECC establish stable interconnection
regimes, through setting appropriate cap and floor for revenues to investors, in order to
facilitate significant investment in interconnection that GB would benefit from.
Ofgem’s Integrated Transmission Planning and Regulation (ITPR) project recognises the
challenges on delivering interconnector capacity, including a recognition that the existing
merchant approach may be inadequate.
(4) Inadequate EMR capacity market design
Current EMR proposals14
do not allow for generation outside GB to participate in the GB
capacity market. Failure to allow generation outside GB to participate would lead to
overinvestment in generation capacity in the UK. This would further reduce economic
incentives to invest in interconnection, and lead to underinvestment in interconnection
infrastructure and excessive overinvestment in UK generation capacity. In order to extract
the value of existing interconnection and facilitate further investment in interconnection
infrastructure, it is important to ensure that generation outside GB is able to participate in
the GB capacity market.
13
For further information: Imperial College and University of Cambridge “Integrated Transmission Planning and Regulation Project: Review of System Planning and Delivery”, report for Ofgem, June 2013. 14
DECC, Annex C Capacity Market: Design and Implementation Update, November 2012

Infrastructure in a low-carbon energy system to 2030: Transmission and distribution
35
(5) Lengthy planning permission process
Another potential barrier to timely transmission network development is the lengthy
planning permission process for new transmission projects that may lead to delays in
planning and delivery of required transmission infrastructure. For example, it took 10 years
and two public hearings to obtain planning permission for the North Yorkshire Line. In
many cases the delays are the result of the unwillingness of local communities to have
new transmission infrastructure constructed in their areas. While a detailed assessment of
the interventions is beyond the scope of this report, nevertheless it may be appropriate to
consider actions that would de-risk and to shorten the planning process for new
transmission infrastructure. This could include actions which:
Simplify and shorten the planning process for new transmission infrastructure
Develop schemes for rewarding local communities that are willing to support
national energy policy objectives by agreeing to host strategic transmission
projects in their areas.
This potential problem in many cases could be overcome developing underground or
undersea transmission networks, which would lead to increase in costs.
Summary
In summary, while the delivery of the required transmission infrastructure may not be
critically constrained by the above barriers, nevertheless these barriers do increase
uncertainty in cost. Improved coordination of planning and operating on- and offshore
networks may result in significantly lower investment requirements. Similarly, development
of cost-effective interconnection projects will require the development of a stable
interconnection regime and further integration of the EU electricity market. Failure to
develop this will result in underinvestment in interconnection, which will increase the
system integration costs both in the UK and mainland EU. All of these barriers will need to
be removed without delay if economically optimal volumes of transmission capacity are to
be delivered in the coming decade
Key barriers and the potential remedial actions are summarised in Table 15.
Table 15: Key barriers and remedial actions for delivery of transmission infrastructure
Barrier Key actions to overcome the barrier Responsibility
Lack of coordination in
planning
Accelerate agreement to assign responsibility for coordination of entire GB onshore and offshore transmission network planning (currently proposed to extend National Grid’s role to meet this requirement).
Ofgem/ National Grid/Government
Lack of EU-wide market
integration
Establish coordination and compensation regimes – cross-governmental coordination at EU level is required
European Commission, Member States
Uncertainty in future
regime for
interconnection in GB
Establish stable interconnection regime. Government, Ofgem

Infrastructure in a low-carbon energy system to 2030: Transmission and distribution
36
Inadequate EMR
capacity market design
Ensure that generation outside GB is able to participate in the GB capacity market via interconnection
Government
Delays in planning and
delivery of infrastructure
(lengthy planning
permission process)
1) Simplify and shorten the process 2) Develop schemes for rewarding local communities supporting national objectives
Government

Infrastructure in a low-carbon energy system to 2030: Transmission and distribution
37
4.2 Timelines and deployment of transmission and
interconnection capacity
The modelling presented above has characterised the optimal transmission and
interconnector infrastructure for 2020 and 2030, under a number of decarbonisation
objectives and sensitivities. The modelling has identified that significant additional
transmission capacity needs to be delivered by these dates, to achieve a least cost
optimised network.
Timelines for deployment of GB transmission infrastructure
Based on the modelling, significant additional transmission capacity is needed by 2020 as
shown in the table below.
Table 16: Additional capacity and investment needed by region in the CD scenario
Region
Core decarbonisation
Additional capacity needed (GW)
Investment cost (£bn)
2013 - 2020 2020 - 2030 2013 - 2020 2020 - 2030
Scotland 6.49 6.30 0.38 0.40
Scotland-England 5.80 1.07 3.00 0.79
North to Midlands and Midlands to South
3.87 2.45 0.34 0.18
North Wales 1.82 7.53 0.11 0.46
Mid-Wales 2.62 - 0.15 -
South West 0.24 - 0.04 -
East Coast and East Anglia
1.54 3.30 0.07 0.15
London - 1.67 - 0.20
Total 22.38 22.32 4.08 2.19
It should be noted that the additional capacity requirements are those for an optimised
network, and prioritising or shortlisting key pieces of infrastructure has limited validity15
.
Nevertheless table 17 does clearly show the importance of network upgrades in Scotland,
and from Scotland to England, and Midlands-South (highlighted in red). The driver behind
these upgrades is the additional wind capacity onshore and offshore in Scotland, which
needs to be brought to centres of demand. Also, the above network accommodates
significant transfer of wind energy from Ireland to Great Britain, and onwards to other
markets.
Timelines and indicators for onshore transmission system deployment developed for the
CCC16
indicate that the project cycle to final commissioning time for a new onshore
15
Lower capacity upgrades, will have knock-on impacts which would make the network operate sub-optimally. 16
http://archive.theccc.org.uk/aws2/docs/503_WindTimelinesProgressIndicators_v7_0.pdf

Infrastructure in a low-carbon energy system to 2030: Transmission and distribution
38
overhead transmission line is around 1200 days. In order to deliver the transmission and
interconnection infrastructure required by 2020 the project cycle for this infrastructure
therefore needs to begin in 2015. Even putting aside concerns (mentioned earlier in this
document) that planning may take significantly longer than the two years assumed in the
(above referenced) Poyry report, the clear implication is that the measures required to
address the barriers to deployment as identified in Section 4.1 are implemented as a
matter of urgency to ensure that delivery of additional capacity arrives on time.
Timelines for deployment of interconnectors
In the table below, interconnector infrastructure characterised for 2020 and 2030 is
assigned to the relevant carbon budget period based on the date capacity is delivered.
The time period required to deliver a new interconnector may take longer compared to
onshore transmission projects as interconnectors around the UK will be offshore and they
will require cross-border collaboration, Planning/design process has already begun for
these interconnectors, which are planned to be delivered within the third carbon budget
period:
England – Belgium17
: National Grid and the Belgian TSO, Elia, have started
working to connect the south east of England with Zeebrugge in. The project has a
planned commissioning date of 2018.
England – France17
: National Grid and the French transmission company RTE
signed a cost sharing agreement in 2010 to further investigate the feasibility of an
interconnector linking the South coast of England with the Northern coast of
France (planned commissioning date is around 2020).
Scotland – Norway18
: NorthConnect is a Joint Venture established to deliver an
interconnector between Scotland and Norway. JV partners include Vattenfall UK,
Agder Energi, E-CO Energi and Lyse. Following the design phase (2013-2015),
the infrastructure is planned to be delivered within the third carbon budget period.
Table 18: Timeline for delivery of interconnectors
Interconnector Timeline for delivery of infrastructure
South E&W - NorthWest France Carbon budget 3 (2018-2022)
South E&W – Belgium (Phase I) Carbon budget 3 (2018-2022)
Scotland - South Norway Carbon budget 3 (2018-2022)
Scotland - Ireland Carbon budget 5 (2028-2032)
Midlands E&W – Ireland Carbon budget 5 (2028-2032)
South E&W - NorthEast France Carbon budget 5 (2028-2032)
South E&W – Belgium (Phase II) Carbon budget 5 (2028-2032)
17
http://investors.nationalgrid.com/~/media/Files/N/National-Grid-IR/factsheets/interconnectors130214-v12.pdf 18
http://www.northconnect.no/files/31860-E01d_A4-version.pdf

Infrastructure in a low-carbon energy system to 2030: Transmission and distribution
39
Similar to the onshore transmission infrastructure, preparatory work to address the barriers
identified in Section 4.1 needs to begin immediately to achieve cost-effective deployment
of the infrastructure.
Impact of delays/uncoordinated deployment
Although it is outside the scope of this work to examine non-optimal deployment scenarios,
it is important to understand the required resilience of the deployment schedule,
particularly as this report recommends immediate action to safeguard the required
transmission capacity at least cost.
There is strong evidence from National Grid, who conducted their own network studies, in
response to consultation on the Offshore Electricity Transmission Owner (OFTO)
arrangements. National Grid have identified that without a coordination role on
transmission, the result would be the deployment of more radial networks i.e. single
windfarm projects procuring transmission capacity optimised for their own needs. National
Grid predict that this would lead to higher costs (an increase of 25%, or capex costs of £4-
8 Billion) and longer delays and higher risks in planning – because of the increased
number of transmission routes and landing sites required to serve the same overall
capacity. The “Gone Green” scenario requires 20% less offshore assets and 75% less new
onshore lines compared to an uncoordinated radial solution. Critically, National Grid also
raised concerns that an uncoordinated approach would increase the likelihood of offshore
route “sterilisation” and the blocking of landing sites, which are limited in number19
. The
clear implication of an uncoordinated deployment is not just higher cost, but also delays
and lower deployment capacity.
The recommendation in this report of immediate action to safeguard capacity and cost
benefits, is supported by National Grid: “work must start immediately if 2020 targets are to
be met and the early benefits of an integrated design are not to be lost”19
.
Route to delivery
From previous consultations on the OFTO, Ofgem has recognised that Wider Network
Benefit Investments (WNBI) need to be made and of the merit of onshore Transmission
Owners (TOs) to undertake some central coordination. Ofgem has stated that “National
Grid’s System Operator responsibilities have also been extended offshore to enable the
coordinated, efficient and economic development of the network”.
In the current consultation on WNBI and options for the role of the TO, in all cases the
responsibility for identifying the need/opportunity (of nationally and strategically valuable
network assets) and selecting options is presumed to lie with the TO. However there are
concerns of conflict of interest and the consultation is exploring who should identify
preferred solutions, undertakes surveys and studies, and achieves consents for
infrastructure20
. This is also reflected in the Integrated Transmission Planning and
Regulation (ITPR) project where a June 2013 consultation accepted the view that National
Grid Electricity Transmission (NGET) should have new responsibilities for coordination of
19
https://www.ofgem.gov.uk/ofgem-publications/51375/national-grid-response-further-consultation-
enduring-regulatory-regime.pdf 20
“Offshore Transmission: Non Developer-Led Wider Network Benefit Investment” Ofgem 10/01/2014.

Infrastructure in a low-carbon energy system to 2030: Transmission and distribution
40
system planning, identifying strategic system needs and identifying coordination
opportunities21
. ITPR is planning to report on a draft impact assessment by Summer 2014.
For the delivery of interconnectors, the planning process has already been started by
National Grid and SSE for the three potential interconnector projects that will be required
by 2020.
21
ITPR open letter, Ofgem, 18 November 2013.

Infrastructure in a low-carbon energy system to 2030: Transmission and distribution
41
4.3 Potential barriers, remedial actions and responsibilities for
delivery of distribution network capacity
This section outlines the key barriers associated with delivering the required distribution
network infrastructure in GB in order to facilitate a cost effective transition to low-carbon
electricity system.
(1) Lengthy permitting and consenting
In the no-climate action scenario, in which heat and transport sectors are not electrified,
the total distribution network reinforcement cost is estimated to be around £25 billion. To
benchmark this, annual capex investments by UK DNOs are over £1 billion22
. Therefore,
the investment of £25bn over 20 years represents an increase of 25% on historical
investments. In reality, the cost of distribution network reinforcement could in fact exceed
projections in this report as the impact and costs of wide-scale disruptions associated with
network reinforcements, particularly in urban areas, could lead to even higher costs, which
are not quantified in this study23
. In this context, potential barriers to achieving a higher
rate of reinforcement include permitting and consent issues, particularly in urban areas, as
well as planned network outages during network upgrades.
This could be mitigated through timely planning of distribution network reinforcements.
There is a gap between the deployment targets of low carbon technologies stated by
government, and the policies/incentives/regulation that would deliver this. The uncertainty
associated with deployment rates limits DNO ability to plan both adequately and cost
effectively for future reinforcement. The current price control framework (RIIO-ED1) spans
investment from 2015 to 2023. The uncertainty associated with the deployment of low
carbon technologies should be reduced or removed long before (i.e. by 2020) the next
price control period from 2023 onwards to ensure that adequate investments can take
place.
Furthermore, coordinated installation of new infrastructure across different industry sectors
such as water, gas, heat, electricity and ICT could facilitate cost effective and timely
infrastructure reinforcements. For instance, if a heat network in a certain area is to be
deployed, it may be beneficial to upgrade the electricity distribution network at the same
time although its upgrade may only be required in later years; this would potentially avoid
costly and disruptive interventions into (particularly urban) public infrastructure. The
current regulatory regime however would not allow network investment to take place well
ahead of need, which would lead to unnecessary increase in reinforcement costs. In this
context there may be significant benefits in establishing strategic rather than incremental
approach to network development. Government and regulatory agencies could develop
processes to facilitate the timely coordination in order to deliver integrated service
infrastructure in an efficient manner. In case that this is not resolved in time, there may
lead to increased costs and delays in the delivery of the infrastructure needed.
(2) Materials and supply chain constraints
In addition, there may also be resource and material constraints, such as bottlenecks in
the equipment supply chain, constraining e.g. the volume of new underground cables that
can be delivered due to limited manufacturing capability. This will be primarily driven by
the gap between the deployment targets of low carbon technologies stated by government
22
DNO capex allowance for 2010-2011 was ca. £1.3bn (source: Electricity Distribution Annual Report 2010-11, Ofgem) 23
Nor are they quantified in the approved cost methodologies used by Ofgem.

Infrastructure in a low-carbon energy system to 2030: Transmission and distribution
42
and the corresponding implementation policies. If unresolved, this barrier may lead to
increased costs and delays in the delivery of the infrastructure.
Government and regulatory agencies could mitigate this through timely planning and
coordination of the uptake of low carbon technologies that would inform the supply industry
about the need for various types of equipment required to support timely distribution
network reinforcements. Government and regulatory agencies could establish process for
strategic and coordinated network planning. In order to avoid delays, this barrier should be
resolved before 2020.
(3) Inadequate distribution network design standards
A number of previous studies on the impact of the electrification of transport and heat
demand on the required reinforcements in distribution grids identified potentially significant
cost associated with upgrading the existing distribution network under the “fit and forget”
approach, without any contribution from demand-side response applications and smart
technologies.24
’25
Similarly, it is estimated in this study that the required distribution
network investment in the core decarbonisation scenario is £6 billion more compared to
the no climate action scenario due to the growth in peak demand resulting from electrified
heat and transport sectors.
The network reinforcement cost in the core decarbonisation scenario could be mitigated to
a very significant extent by deploying smart network technologies such smart voltage
regulation and demand-side response. The results suggest that around £5 billion (i.e. more
than 80% of the additional reinforcement cost in the CD scenario) could be saved with the
timely implementation of smart grid technologies and DSR services. However, efficient
integration of these solutions is not a part of the existing network planning standards.
There are current initiatives in place, led by the industry, aimed at performing a
comprehensive review of the distribution network security standards and the associated
regulatory arrangements governing the electricity distribution business. It is anticipated
that the new planning standard will be established by 2016. This will allow for a cost
effective deployment of non-network solutions in network planning (alongside conventional
asset replacements and upgrades), and ensure least-cost provision of distribution network
service. Planning tools used by distribution network operators will need to be updated
accordingly to take into consideration the advanced real-time network control solutions.
(4) Increased risk and complexity associated with deployment of new
technologies
Delivering adequate levels of distribution infrastructure until 2030 will benefit significantly
from development and deployment of novel cost effective smart technologies and
solutions. However, deployment of new technologies, such as those associated with smart
grids, into actual distribution networks inevitably creates significant additional risks for
distribution companies. It is unclear how these risks and the associated cost would be
managed, particularly with respect to the application of more disruptive technologies. Risks
associated with new technologies are not fully recognised by the current regulatory
24
“Benefits of Advanced Smart Metering for Demand Response-Based Control of Distribution Networks”, report for the Energy Networks Association, April 2010. Available at: www.energynetworks.org. 25
“Understanding the Balancing Challenge” report for DECC, July 2012. Available at https://www.gov.uk/government/uploads/system/uploads/attachment_data/file/48553/5767-understanding-the-balancing-challenge.pdf

Infrastructure in a low-carbon energy system to 2030: Transmission and distribution
43
framework, which may present an impediment for their widespread adoption and lead to
increase in network investment costs. Smart grids will also increase the complexity
considerably compared to the traditional solutions, given that significant Information and
Communication Technology infrastructure will be needed in addition to the advanced
Distribution Management Systems applications (yet to be developed), all necessary to
make use of available information and control in real time management of distribution
networks.
Government and the regulatory agency should establish provisions to allow distribution
companies to include the risk associated with new technologies in network planning.
Furthermore, research and demonstration projects, facilitated through Network Innovation
Allowance and Completion schemes should also assist the industry with understanding
and reducing risks associated with the application of new emerging smart grid
technologies.
(5) Lack of full market integration of distributed energy resources
Multiple benefits potentially generated by distributed energy resources (e.g. distributed
storage, demand side response, distributed generation) across different sectors in the
electricity system are not fully reflected in the current market environment and regulatory
framework. For example, in addition to using storage to reduce peak loads in local
distribution network and consequently improve network capacity utilisation, it may also be
desirable for storage technologies to respond to opportunities in the energy, reserve and
ancillary services markets at the national level. Applying smart grid technologies for
distribution network management in isolation without considering these markets, will
potentially undermine the business case for some of these technologies, and hence
increase the overall cost of the end-to-end electricity delivery chain. If these technologies
are to be deployed at cost effective levels, that would minimise the overall system
operation and investment cost, it will be important to overcome market and regulatory
barriers and ensure that service providers are rewarded according to the benefits they
provide across the entire electricity supply chain. If unresolved, it is likely that the costs of
network investment and system real time balancing costs will increase as these enabling
technologies, although cost effective, would not be deployed due to insufficient revenues
received due to market failures26
.
In this context, establishing a Distribution System Operator (DSO) type function, together
with appropriate distribution network access and energy and ancillary services pricing
structures, would facilitate both efficient real-time network operation and prevent
overinvestment in future network reinforcements27
. Establishing the DSO function,
analogous to the Transmission System Operator, would not only support a more holistic
approach to future distribution network management but also provide distributed energy
resources with access to various markets at the national level (provision of various forms
of reserve, capacity, transmission network management) and hence support more efficient
operation of the national system. This would require restructuring of distribution
businesses and active involvement from both the government and the regulator, and
similar to other actions in the transition towards more active distribution networks, will
require a time window of several years to implement the necessary changes (e.g. 2020).
26
As demonstrated in DECC study: “Understanding the Balancing Challenge, 2012. 27
As identified in Imperial College and Energy Networks, Benefits of Advanced Smart Metering for Demand Response based Control of Distribution Networks, April 2010

Infrastructure in a low-carbon energy system to 2030: Transmission and distribution
44
(6) Voltage standards, harmonics and fault level issues
There are also a number of technical issues to be addressed in future distribution
networks, such as voltage standards in the context of the EU harmonisation, harmonics
and fault levels. It is expected levels of harmonics in distribution systems will increase due
to penetration EVs, HPs and PVs using power electronics interfaces. Furthermore, the
expected decrease in fault current level driven by substitution of synchronous generation
with non-synchronous renewable sources (wind and PV), coupled with increased
interconnection could present an additional challenge for protection management schemes
and the related safety considerations in distribution networks. The magnitude and
materiality of these issues has not been comprehensively analysed. Government, Ofgem
and industry, through Smart Grid Forum and other demonstration project are engaging
with these issues and it is anticipated that the information about possible implications may
be available in the next couple of years, so that appropriate courses of actions can be
established.
Table 19 summarises the key barriers and the associated corrective actions relevant for
delivery of distribution infrastructure in the future GB system.
Table 19: Key barriers and remedial actions for delivery of distribution infrastructure
Barrier Key actions to overcome the
barrier Responsibility
Lengthy permitting and consent (particularly in urban areas)
(1) Timely planning of distribution network reinforcements (ahead of next price control period) (2) Coordinated infrastructure deployment across different sectors (i.e. water, gas, heat, electricity, ICT)
Government, Regulators
Materials and supply chain
constraints Establish strategic and coordinated network planning
Government, Ofgem
Inadequate distribution network design standards
Review the distribution security standards and regulatory arrangements to incorporate non-network solutions in network planning
Government, Ofgem, DNOs
Increased risk and complexity
associated with deployment of
new technologies
(1) Establish provisions for dealing with increased levels of risks (2) Carry out demonstration projects aimed at understanding and mitigating risks
Government, Ofgem, DNOs
Lack of full market integration distributed energy resources
1) Ensure that actors in the market are rewarded according to the benefits they provide across the electricity supply chain 2) Establish the Distribution System Operator (DSO) function
Government, Ofgem
Technical issues foreseen in
future distribution networks
(e.g. voltage standards,
harmonics and fault levels etc)
Conduct further research into understanding the magnitude and impact of these issues on future networks
Government, Ofgem, Industry

Infrastructure in a low-carbon energy system to 2030: Transmission and distribution
45
5 Conclusions
5.1 Transmission
The UK interconnection and GB MITS additional infrastructure requirements have been
analysed for the three different generation and demand backgrounds, i.e. Core
Decarbonisation (CD), No Climate Actions (NCA), and Delayed Electrification(DE)
scenarios. Three sensitivity studies based on the 2030 CD scenarios have also been
conducted investigating the impact that full EU market integration, national roll-out of fast
charging EV stations, and the implementation of DR technologies on the investment
needed by the UK interconnection and GB MITS . The results and the trends for each of
the cases can be summarised as follows:
Core Decarbonisation (CD)
Significant reinforcement of transmission network in Scotland to accommodate
wind capacity.
Both HVDC bootstraps constructed to facilitate North-South flows.
Significant upgrade of GB - Ireland interconnectors.
Need for significant interconnection to Europe to accommodate wind development
in the UK and Ireland.
No Climate Action
Modest network reinforcement in Scotland
No HVDC bootstraps chosen for construction
Reinforcement of western E&W – central E&W links focused on southern corridors
No need for upgrade in interconnection to Europe
Delayed Electrification
Similar results as in the CD scenario but slightly less in magnitude due to the lower
electricity peak demand and annual energy consumption.
Sensitivities
Overall, the results of the sensitivity studies are similar to the results in the CD
scenario with the following notes:
Fully UK market integration to EU: 50% more network cost; higher interconnection
capacity but slightly offset by less transmission. However, the increase in network
investment is fully justified, as it would lead to reduction in the overall generation
operation and investment costs.
Fast Charging: slight increase in the capacity requirement but not material.
DSR: slightly lower in GB MITS but slightly higher in the GB-Ireland
interconnectors since DR improves the GB system ability to absorb more
renewable output including the wind output from Ireland.
It can be concluded that in most of the cases, the decarbonisation of the UK energy
system is the main driver for enhancing the capacity of UK interconnectors and the GB
MITS. This is demonstrated by modest investment requirement in the NCA scenario; while
other scenarios which are based on the CD scenario require significant investment. As a

Infrastructure in a low-carbon energy system to 2030: Transmission and distribution
46
summary, the investment needed for upgrading UK interconnectors and GB MITS in the
CD scenario and its sensitivity cases ranges between £18bn and £22bn within the period
2013-2030. In contrast, the total investment in the NCA scenario is only about £1.1bn in
the same period.
5.2 Distribution
In summary, the key features of required distribution network investment in different
scenarios are as follows:
- Core decarbonisation scenario: High (£31.4bn by 2030) – driven by rapid
electrification of heat and transport demand (despite energy efficiency measures),
- Delayed electrification scenario: Moderate (£25.8bn) – due to slower growth of
electrified heat and transport demand requiring less grid reinforcements,
- No climate action scenario: Moderate (£25.2bn) – despite the lack of heat and
transport electrification, reinforcements are needed due to faster demand growth
resulting from less ambitious improvements in energy efficiency.
The impact of sensitivities performed on the CD scenario has been found to be the
following:
- Uneven EV and HP distribution: Cost reduced by £5.1bn – higher reinforcement in
areas with high EV and HP concentration more than offset by the cost avoided in
areas with little or no EVs and HPs,
- DSR: Cost reduced by £1.7bn – resulting from DSR being able to reduce peaks in
local networks,
- Fast charging: Slight increase compared to CD scenario (by £0.1bn) – fast
charging requires reinforcements of HV distribution networks.
In contrast to the conclusions on Transmission, for distribution the main cost drivers are
not decarbonisation but the growth in load in the period to 2030. The use of demand side
management and smart grid technologies could offset most of the additional investment
cost associated with the core decarbonisation scenario. Nevertheless there remains
significant risk associated with the deployment and proven utility of smart grid
technologies, the recruitment of consumers as an active participant in network
management, and with the actual levels of low carbon technologies that will have to be
deployed in networks by 2030.

Infrastructure in a low-carbon energy system to 2030: Transmission and distribution
47
6 Appendix
6.1 Methodology and assumptions
6.1.1 Transmission studies
The main role of the transmission and interconnection infrastructure is:
To facilitate energy transfer from generation sources to demand centres while
minimising the operation cost of generation system (and facilitate competition in
electricity supply);
To enhance long-term security of supply by sharing of generation capacity
between regions;
To share flexibility and reserves between regions by exploiting the benefits of
diversity in demand and renewable energy sources; and improve efficiency of real
time balancing task by providing access to the Transmission System Operator to
procure balancing services from neighbouring systems28
In summary, transmission and interconnection infrastructure enhances the efficiency of
system operation, increase security of supply, and enhance system flexibility to balance
demand and supply in real time.
In order to design a multi-purpose interconnection and to determine the optimal network
expansion programme, there is a need for an integrated planning approach that considers
simultaneously the requirements for generation (both in terms of capacity adequacy and
system balancing) and transmission infrastructure whilst taking into account security and
economic considerations. The key challenge for such an approach will be to include the
full representation of operational requirements and characteristics of the system including
variability in intermittent renewable output, available demand response and energy
storage) in a (multi) year-round network design framework that deals with the economics
of bulk energy transport, seasonal/weekly allocation of hydro resources and reliability /
security of supply.
For this purpose, we use a two-stage cost minimisation process to decompose the original
very large optimisation problem into two manageable size sub-optimisation problems.
First, the Dynamic System Investment Model (DSIM) is used to determine the optimal
interconnection capacity and the bulk power exchanges on the entire European system
using the EU Grid model, which includes the electricity systems of Great Britain (GB),
Ireland and continental Europe. It is important to note that the capacity of cross border
interconnection is not only affected by the systems directly connected to it but also by their
adjacent systems; for example: the capacity of UK interconnection with France and
Belgium may be influenced by development of renewable power in Ireland, or by capacity
of the interconnection between Norway and UK, or Norway and Denmark. In order to
capture the interaction between various developments, it is important for this study to use
an European grid model to assess the interconnection requirements. However, due to high
computational cost, the intra region transmission system cannot be modelled in much
28
Balancing task is carried out by Transmission Network Operators and through integrated EU
Balancing Market, that is currently being implemented, will enable them to exchange balancing services cross border, that will significantly reduce system balancing costs

Infrastructure in a low-carbon energy system to 2030: Transmission and distribution
48
detail in this model and therefore we use the second model, Dynamic Transmission
Investment Model (DTIM) which represents all key transmission boundaries in the UK.
The capacity of interconnectors and the projected power flows from/to UK are used by the
DTIM to determine the optimal capacity of the Main Interconnection Transmission System
(MITS) in the UK. The following sections provide more details on the two models used in
this study.
EU Grid Model and the Dynamic System Investment Model (DSIM)
The EU Grid model comprises all main cross-border interconnectors across Europe and
the intra-national main transmission systems. Generation data (installed capacity per
technology; investment and operating cost including fuel, O&M, start-up and no-load costs;
dynamic characteristics including efficiency and flexibility such as ramp rates, minimum up
and down time, response capability) and demand backgrounds are specified for each
Member State, as well as the renewable generation profiles (wind, PV, hydro). The
network data used by the model comprises the existing capacity and length, and the
average network reinforcement cost per unit length and per unit capacity. Long
interconnectors may be built using a combination of network technologies (AC/DC, on/off
shore, Extra or Ultra High Voltage) that have different cost characteristics. This has to be
reflected in the network cost data. The EU Grid Model used in the study is illustrated in
Figure 13.
Figure 13: Modelling of EU Grid
DSIM is an analytical tool for power system studies, developed by Imperial College
London, which seeks to minimize the total system cost as the sum of the following
components:
Investment cost in new generation and storage capacity;
Investment cost in additional network capacity (both cross-border and intra-
national); and
Existing corridor
New corridor

Infrastructure in a low-carbon energy system to 2030: Transmission and distribution
49
Annual electricity production cost including the cost of providing balancing
services.
These are all calculated while maintaining the required level of system reliability and
respecting operating constraints. The overall modelling framework simultaneously
optimises the investment and hourly system operation across the time horizon of a year,
thus considering the tradeoffs between long-term decisions to invest into new
infrastructure and short-term decisions on how to utilise this infrastructure on an hourly
basis. At the same time, the DSIM model is capable of capturing the effects of sharing
generation capacity through inter-regional transmission (if such a strategy is selected
when studying the system) in order to minimize the overall additional infrastructure costs
needed to deliver the required level of reliability.
The reliability target is defined in terms of the Loss of Load Expectation (LOLE), which is
set to balance the cost of investment in peaking plant and cost of expected energy
curtailed (driven by Value of Lost Load). This is based on an array of probabilistic inputs,
which the model takes into account:
Effects of forced outages of generating plant
Optimised production schedule from available conventional generation
technologies
Seasonal availability of hydro power (as well as the variability of ‘run of river’ and
hydro with reservoir)
Dispatch of Concentrated Solar Power (CSP) plants considering thermal reservoir
capacities and thermal storage losses, and
Probable contribution from renewable generation and the associated short- and
long-term correlations with demand.
Demand-side response and energy storage are both explicitly modelled in DSIM, including
the effects of efficiency losses, in order to assess the effectiveness of such measures to
reduce additional generating capacity and inter-regional transmission investments while
maintaining the required system reliability performance.
Dynamic Transmission Investment Model (DTIM)
DTIM is used to support the Cost-Benefit Analysis (CBA) of different transmission
expansion strategies. The model is formulated as a linear programming problem that
minimizes the sum of the Present Values (PVs) of transmission investment cost and the
cost of congestion in the system, taking into account uncertainties in the development of
generation capacity, load growth, and evolution of investment and operating costs across
a multi-year period (referred to as ‘epoch’ in the model). As depicted in Figure 14, DTIM
balances the cost of network constraints against the cost of network reinforcement,
minimising the overall cost of power system operation and expansion over a given study
period (e.g. 20 years).

Infrastructure in a low-carbon energy system to 2030: Transmission and distribution
50
Figure 14: DTIM Cost-benefit analysis
DTIM can consider various network technologies and solutions capable of enhancing the
power transfer capability of transmission corridors, such as e.g. reactive compensation, re-
tensioning, re-conductoring or installing new lines. All of these options are considered
when upgrading the transmission capacity across the planning period by using a piecewise
approximation of the transmission investment cost function. A piecewise cost function is
used for terrestrial transmission reinforcement so as to reflect the cost of various options in
enhancing transfer capability of individual lines. Furthermore, DTIM has the capability to
model investment in DC lines (“bootstraps”) between pre-defined system nodes. It is also
possible to use DTIM to choose from a portfolio of possible transmission expansion
projects specified by the user. Both radial and meshed networks can be modelled.
Throughout the optimization period the model determines when, where and how much to
invest. Key input data for the optimisation include the demand forecast, current and future
fuel costs, bid and offer prices, evolution of installed generation capacity, the location and
quantity of new wind capacity and transmission and generation maintenance plans. DTIM
is capable of capturing inter-temporal changes in generation and demand thus optimizing
both the amount of transmission capacity and the timing throughout the modelling period.
For example, if a plant is decommissioned rendering an upgrade of a particular line sub-
optimal in later years, DTIM will be able to capture this effect and invest accordingly.
A reduced GB main boundary transmission system is modelled in DTIM for the purpose of
this study, as illustrated in Figure 15. TB1 to TB6 equate to SYS boundaries 1-6. TB7 is
mapped to a non-SYS boundary, known as B7a, which runs South-of-Penwortham rather
than South-of-Harker. TB8 is a non-SYS boundary to North Wales, namely West of
Deeside and West of Treuddyn. TB9 is mapped to the Humber Estuary boundary, namely
East-of-Keadby and cuts across Thorton--Creyke Beck circuit. TB10, TB13 and TB15 are
SYS boundaries B8, B9 and B15 respectively. TB11 is south Wales boundary, namely
West-of-Walham plus West-of-Melksham. TB12 can be mapped to East Anglia, i.e.
transmission nodes Norwich Main, Sizewell and Bramford. TB14 maps to the boundary to
Cornwall, Devon and Somerset.
Tx Investment Cost
Constrants Cost
Optimum Network Capacity
Total Cost
MW
Cost
Constraint
cost

Infrastructure in a low-carbon energy system to 2030: Transmission and distribution
51
Figure 15: A reduced GB main transmission system (transfer capacities in 2013)
Transmission System Cost Assumptions
DTIM has been used by National Grid as a validation tool for the proposed ENSG projects
in 2009 as well as for system operation modelling within the fundamental SQSS review. In
order to ensure the accuracy of DTIM in calculating the cost of reinforcing transfer
capability across main transmission boundaries on the GB system, the reinforcement cost
in DTIM are calibrated to reflect the actual costs of projects to increase boundary capacity
proposed in reports from ENSG,29
KEMA30
and National Grid.31
The cost includes all infrastructure and installation costs required taking into account the
security level that needs to be satisfied, for example: N-1. It is a standard practice for a
high level transmission planning tools to use aggregated reinforcement costs per km rather
than a detailed actual transmission network cost32
.
We have calibrated our DTIM model using assumptions on reinforcement costs,
generation capacity, demand and marginal costs from National Grid’s “Gone Green”
scenario. The calibrated DTIM model has also been used in analysing the impacts of
different transmission charging regimes in the TransmiT project33
. To estimate
29
Our Electricity Transmission Network: A Vision for 2020, ENSG, July 2009 30
Assessment of the overall robustness of the transmission investment proposed for additional funding by the three GB electricity transmission owners, KEMA, December 2009 31
Anticipatory Investment Update – 2010 , National Grid, 2010 32
Electricity Transmission Costing Study: an independent report endorsed by the Institution of Engineering and Technology, 2012 33
Project TransmiT: Impact of Uniform Generation TNUoS , a report prepared for RWE npower, Imperial College and NERA, 2011

Infrastructure in a low-carbon energy system to 2030: Transmission and distribution
52
transmission investment costs, we used the average annuitized investment cost of
£50/MW/km/year, which is a conservative estimate that National Grid uses with the DTIM
model.
In order to reflect the need of the DC bootstraps, we included constraints on maximum
boundary capacities, the most important of which is the maximum capacity of 4.4GW on
the Cheviot boundary. Increasing capacity beyond 4.4GW across this boundary would
either require a relaxation of security standards, which we did not consider, or building a
new line, which given the planning issues is very difficult. Hence we assume that any
further increase in Scotland –England transmission capacity is delivered only through
offshore DC links.
We defined assumptions on DC link costs from reports by ENSG and KEMA. In the
Transport model DC links are modelled as 275/400kV cables, with the length adjusted to
reflect DC link cost as quoted in ENSG report. The investment cost of the DC Links has
also been calibrated using the same approach; the average annuitized investment cost of
£160/MW/km/year is used in the study.
The costs of UK interconnection, taken from our study with European Climate
Foundation34
. The distance of the interconnection is calculated from the centre of the
sending-end region to the centre of the receiving-end region. The cost of interconnection
also includes the cost of reinforcing the onshore transmission and the subsea
transmission, including the capital cost of the infrastructure (substations, transformers,
converters if it involves DC links, conductors, protection systems) and installation costs.
Table 20: Interconnection length and unity cost
Distance [km] Annuitised cost of
investment [£/MW/km per year]
Scotland - Ireland 380 91
Midlands E&W - Ireland 480 103
South E&W - NorthEast France 440 96
South E&W - NorthWest France 495 107
South E&W - Netherlands 400 118
South E&W - Belgium 380 105
Scotland - South Norway 912 147
South E&W - South Norway 1,160 137
South E&W - North Spain 1,495 137
North E&W - South Norway 1,036 140 Source: KEMA, ECF
The capital cost of the investment is calculated as a function of the annuitized investment
cost, the proposed additional transfer capacity, economic lifetime of the asset (i.e. 40
years), and the discount rate (i.e. Weighted Average Cost of Capital = 5.7%).
DTIM is longer-term planning tool that considers the need for new cross-boundary
transmission infrastructure over a specified time horizon, so that the network
reinforcements are identified in advance of the need. Hence for a given future
34
Power Perspective 2030, European Climate Foundation, available at http://www.roadmap2050.eu/project/power-perspective-2030

Infrastructure in a low-carbon energy system to 2030: Transmission and distribution
53
development scenario, DTIM will provide information about the timing of future
investment and hence planning, network reinforcement and installation can be planned.
6.1.2 Distribution studies
Distribution networks in this analysis are modelled using Imperial’s fractal network models
calibrated against real GB networks. Fractal models reproduce realistic network topologies
and network lengths and therefore allow for the characterisation of distribution networks of
different types. For the purpose of the analysis presented in this report, mapping the entire
GB distribution network, we have developed 10 representative networks that are used to
evaluate the GB distribution network reinforcement costs.
The 10 representative networks capture the key statistical properties of typical network
topologies that can range from high-load density city/town networks to low-density rural
networks. The design parameters of the representative networks closely match those of
realistic distribution networks of similar topologies.
The proposed representative networks map the GB distribution networks closely in terms
of total number of connected customers, total overhead LV network length, total
underground LV network length, total number of pole-mounted transformers (PMT), and
total number of ground-mounted transformers (GMT). Table 21 demonstrates that
Imperial’s fractal model closely maps the GB aggregate values.
Table 21: Mapping of representative networks (RN) onto actual GB distribution networks
Parameter GB value RN value Discrepancy
(%)
Number of connected customers 29,416,113 29,410,374 -0.02%
Overhead LV network length (km) 64,929 64,905 -0.04%
Underground LV network length (km) 327,609 327,822 0.07%
Number of PMT 343,857 343,848 -0.00%
Number of GMT 230,465 230,323 -0.06%
Overhead LV network length per PMT (m) 189 189 -0.03%
Underground LV network length per GMT (m)
1,422 1,423 0.13%
Imperial’s distribution network modelling tools are employed to quantify the network
reinforcement costs across different future development scenarios. Figure 16 illustrates
the analytical approach adopted. For each of the alternative electricity network control
scenarios ‘Uncontrolled’ and ‘Smart’, we assess the required investment in the distribution
network. The smart scenario involves the use of flexible demand to manage demand
peaks, allowing us to identify the value of flexible demand for reducing the cost of network
reinforcement.

Infrastructure in a low-carbon energy system to 2030: Transmission and distribution
54
Figure 16: Methodology block diagram for distribution network analysis
Mitigating distribution network reinforcement
In our distribution network analysis we consider three development pathways: (i) Core
decarbonisation (CD) pathway with the integration of low-carbon generation and demand
technologies; and (ii) Delayed electrification; and (iii) No Climate Action. Within the Core
decarbonisation pathway three further sensitivity scenarios are considered: EVs and HPs
unevenly distributed, Demand response and Fast-charging of EVs.
Three snapshot years are considered, namely 2020, 2025 and 2030. They are
characterised by the deployment of low carbon technologies and the growth rate of base
load. Table 22 and Table 23 show the assumed number of installed HPs and EVs, as well
as the growth rate of base load. The uptake of EVs and HPs in delayed electrification
sensitivity is 50% of the core decarbonisation scenario. The base demand of the core
decarbonisation scenario in 2020, which excludes heat and transport electrification
demand, is used as a reference demand. Network reinforcements needed due to increase
of the base demand and demand associated with integration of low carbon technologies is
recorded.
Heat pumpsElectric vehicles
Impact assessment
Distribution network investment cost
Value of flexible demand services
Scenarios: penetration levels
Consumer mix
System operation paradigm
Uncontrolled demand Smart demand

Infrastructure in a low-carbon energy system to 2030: Transmission and distribution
55
Table 22: Deployment of Low Carbon Technologies (LCTs)
Scenario Year
No residential
HPs
No commercial
HPs No EVs
Core
decarbonisation
2020 569,676 79,585 1,527,888
2025 2,580,633 162,613 4,169,806
2030 6,832,493 252,274 7,990,978
Delayed
electrification
2020 284,838 39,793 763,944
2025 1,290,317 81,307 2,084,903
2030 3,416,247 126,137 3,995,489
No Climate Action 2020 - - -
2025 - - -
2030 - - -
Table 23: Growth rate of demand excluding LCTs
Year Core
decarbonisation
Delayed
electrification No climate action
2020 100% 100% 114%
2025 106% 106% 124%
2030 115% 115% 137%
Average reinforcement unit costs are given in Table 24 (based on the costs published by
Ofgem35
). The variation of underground cable reinforcement cost might be significant,
particularly when cost associated with disruption is considered, particularly in urban areas.
Table 24: Average reinforcement unit costs
Asset upgrade Overhead/PMT Underground/GMT
LV circuit (£k/km) 30 98.4
HV circuit (£k/km) 70 185.8
Distribution transformer (£k) 2.9 13.2
LV voltage regulation (£k) 1 2
Primary substations (£k) 755.8
EHV network (% of all LV and HV
costs) 20 20
Note: PMT – pole mounted transformer; GMT – ground mounted transformer.
Figure 17 and Figure 18 show the after-diversity profiles of off-peak EV charging and for
domestic and commercial HP operation, respectively. Smart EV charging occurs off-peak
i.e. during the night.
35
Ofgem, Electricity Distribution Price Control Review: Final Proposals - Allowed revenue - Cost assessment appendix, Ref: 146a/09, 7/12/2009, https://www.ofgem.gov.uk/ofgem-publications/46749/fp3cost-assesment-network-investmentappendix.pdf

Infrastructure in a low-carbon energy system to 2030: Transmission and distribution
56
Figure 17: After-diversity profiles of EV charging for BaU and Smart scenarios
Figure 18: After-diversity profiles of domestic (l) and commercial HPs (r)
Uneven distribution of EVs and HPs, as sensitivity, is modelled by introducing seven
clusters where penetrations of EVs and HPs are specified as multipliers of the average
penetration as shown in Table 25. The size of each region in percentage is also given in
the table. The resulting average concentration is the same as in the base case (i.e. when
EVs and HPs are uniformly distributed), as shown in Figure 19. Demand response
sensitivity is based on the peak reduction of 6.3% accomplished by using flexible demand,
as identified in transmission studies. The sensitivity featuring the fast-charging of EVs
assumes that 5,081 charging stations are deployed across GB with the annual electricity
supplied in the amount of about 1/3 of total EV demand. It is assumed that fast charging
needs installation of a new distribution transformer for each station.
Table 25: Cluster parameters
Multiplier Percentage
0 26%
0.5 20%
1 18%
1.5 16%
2 13%
3 6%
4 1%
Figure 19: Cluster parameters
0
1
2
3
4
0% 20% 40% 60% 80% 100%
Mu
ltip
lie
r
Cumulative percentage of area
Avg. concentration
26% 20% 18% 16% 13% 6%
1%

Infrastructure in a low-carbon energy system to 2030: Transmission and distribution
57
6.2 Detailed transmission costs
Table 26: Investment cost for upgrading UK interconnectors (in £bn)
Core decarbonisation
No Climate Action
Delayed electrification
Full EU market integration
Fast charging DR
Region 2013-2020
2020-2030
2013-2020
2020-2030
2013-2020
2020-2030 2020-2030
2020-2030
2020-2030
Scotland - Ireland - 0.98 - - - 0.41 1.36 1.00 0.76
Midlands E&W - Ireland - 4.82 - - - 5.25 4.56 4.79 5.40
South E&W - NorthEast France - 0.51 - - - 0.38 1.49 0.50 0.56
South E&W - NorthWest France 0.83 0.00 - - 0.83 0.00 0.00 0.00 0.00
South E&W - Netherlands - 0.00 - - - - 0.00 0.63 0.00 - 0.00
South E&W - Belgium 0.62 0.91 - - 0.62 0.69 3.21 0.97 0.81
Scotland - South Norway 2.93 0.00 - - 2.93 0.00 1.04 0.00 0.00
South E&W - South Norway - 0.00 - - - 0.00 0.00 0.00 0.00
South E&W - North Spain - 0.00 - - - 0.00 0.00 0.00 0.00
Total 4.39 7.22 - - 4.39 6.73 12.30 7.25 7.53
Table 27: Investment cost for upgrading GB MITS (in £bn)
Core decarbonisation
No Climate Action
Delayed electrification
Full EU Market Integration
Fast charging DSR
Region 2013-2020
2020-2030
2013-2020
2020-2030
2013-2020
2020-2030 2020-2030
2020-2030
2020-2030
Scotland 0.38 0.40 0.04 0.12 0.38 0.33 0.39 0.41 0.33
Scotland-England 3.00 0.79 - - 3.00 0.09 - 0.84 0.62
North to Midlands and Midlands to South 0.34 0.18 - - 0.31 0.05 0.15 0.19 0.17
North Wales 0.11 0.46 - - 0.11 0.25 0.42 0.47 0.44
Mid-Wales 0.15 - - - 0.19 0.00 - - 0.04
South West 0.04 - 0.11 0.65 - - 0.07 0.01 -
East Coast and East Anglia 0.07 0.15 - 0.16 0.06 0.09 0.29 0.16 0.15
London - 0.20 0.02 - - - 0.24 0.22 0.17
Total 4.08 2.19 0.17 0.92 4.04 0.82 1.56 2.29 1.91

Infrastructure in a low-carbon energy system to 2030: Transmission and distribution
58
6.3 Detailed distribution costs
(a) Core Decarbonisation scenario
(b) Delayed electrification scenario
(c) No Climate Action scenario

Infrastructure in a low-carbon energy system to 2030: Transmission and distribution
59
Figure 20: Reinforcement cost 2020 for core decarbonisation (a), delayed electrification (b) and no climate action (c) scenarios
(a) Core Decarbonisation scenario
(b) Delayed electrification scenario

Infrastructure in a low-carbon energy system to 2030: Transmission and distribution
60
(c ) No Climate Action scenario
Figure 21: Reinforcement cost 2025 for core decarbonisation (l), delayed electrification (m) and no climate action (r) scenarios
(a) Core Decarbonisation scenario

Infrastructure in a low-carbon energy system to 2030: Transmission and distribution
61
(b) Delayed Electrification scenario
(c ) No Climate Action scenario
Figure 22: Reinforcement cost 2030 for core decarbonisation (a), delayed electrification (b) and no climate action (c) scenarios
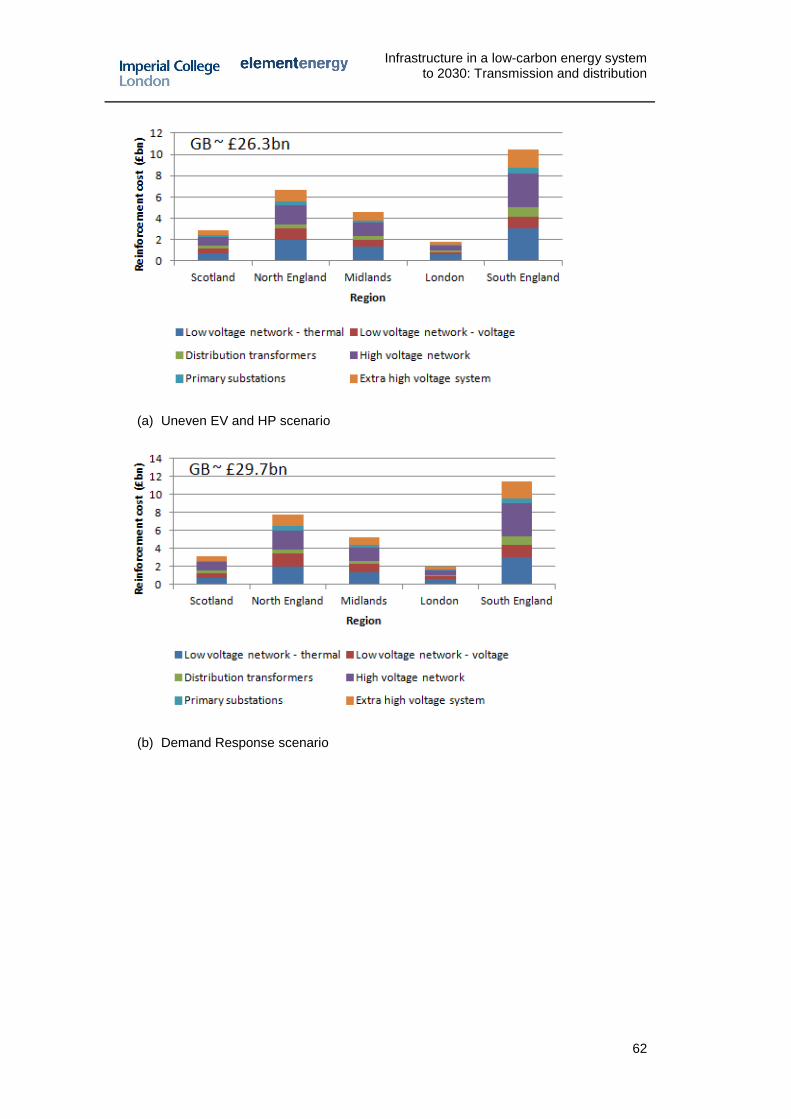
Infrastructure in a low-carbon energy system to 2030: Transmission and distribution
62
(a) Uneven EV and HP scenario
(b) Demand Response scenario

Infrastructure in a low-carbon energy system to 2030: Transmission and distribution
63
(c ) No Fast Charging scenario
Figure 23: Reinforcement cost 2030 for uneven EV and HP distribution (a), demand response (b) and no fast charging (c) sensitivities
Table 28: Reinforcement cost across time – CD vs. Uneven EV and HP distribution
Scenario Year Cost BaU
(£bn)
Core decarbonisation 2020 8.5
2025 21.7
2030 31.4
Uneven EV & HP
distribution
2020 7.5
2025 18.3
2030 26.3
Table 29: Distribution of customers per regions
Region Customers (%)
Scotland 10%
North England 26%
Midlands 17%
London 7%
South England 39%