cb -- q3 2012 venture capital activity report (cb insights)
TRANSCRIPT

Venture Capital Activity Report | Q3 2012
www.cbinsights.com
QUARTER SUMMARY 2
QUARTERLY TRENDS 3
SECTOR REVIEW 12
1 INTERNET 12
2 MOBILE & TELECOM 19
3 HEALTHCARE 26
4 GREEN / CLEAN TECH 33
GEOGRAPHIC REVIEW
1 CALIFORNIA 40
2 MASSACHUSETTS 47
3 NEW YORK 52
4 WASHINGTON 58
5 TEXAS 63
DEFINITIONS & DATA INTEGRITY 68
TABLE OF CONTENTS
© 2010, CB Insights. All rights reserved. For more information about CB Insights, please email [email protected].
Venture Capital Activity Report | Q3 2012
www.cbinsights.com
Q3 2012 This Quarter in Venture Capital
down year for VC funding relative to 2011 barring a freakish 4th quarter tally.
2
VCs remained ready, willing and able to invest in Q3 2012 making 835 investments totaling $7.5 billion. The deal count was the highest since the dot com days largely driven by what seems to be an insatiable VC appetite for making small seed investments in fledgling companies. The funding tally registered $7.9 billion. It was also down versus the gargantuan $8.1 billion witnessed in the prior quarter. Of course, when one reads the words in the same sentence as VC, the bubble chatter begins. We, again, think it
bet a healthy sum of money that it 2012 will actually be a down year in terms of total VC funding to companies. Yes, there continues to be frothiness in the Seed VC investing saw yet another uptick in already-high Seed VC deal volumes. And yes, the size of Seed VC deals is growing, following suit with volumes. So the reality is that there will eventually be blood among these Seed VC companies as many will be orphaned or just unable to raise follow-on financing.
ll Seed VC deals failed, it would be the equivalent of a single medium-sized VC fund going out of business. That happens all the time and presents no risk to the entire VC ecosystem. If it becomes easy for companies with little or no traction to raise
more openly entertain talk of a VC bubble. Note: Only deals in which VCs are participating are included. Companies which raise money from mutual or private equity funds or corporations (unless it is their corporate venture arms) are not included. We recommend you review our definitions and methodology on p. 68 to see what is included/excluded as there is a great amount of misinformation out there.
Bigger, Faster Seed Planting Seed investing represented 31% of all VC deals. Mobile saw 42% of its deal volume at the Seed VC level. Healthcare also saw growth in Seed investing as well. Both internet and mobile saw larger Seed VC medians hitting the $1 million mark for the first time suggesting that the frenzy for Seed VC investing is allowing entrepreneurs to raise larger seed rounds than in the past.
The Mobile Wild West VCs clearly are positioning themselves for the next big wave they see in mobile. While big deals in security and payments buoyed funding totals, the deal breakdown by industry within mobile remains diverse. For the first time, Cali actually saw more activity to the mobile sector than Healthcare.
Green Tech Fizzes; Reveals Unusual Suspects
The clean tech doldrums continued with both deals and funding hitting five quarter lows. Interestingly, NY and Illinois took #2 spots for green tech deal and funding activity, respectively.
Healthcare Deals Dip; Funding Stabilizes
Third straight quarter where healthcare deals decline.
Southern California Can I Get a Little Respect? We broke out some stats on Silicon Valley vs. SoCal (p 46) after some of our customers in the area told us SoCal was the Rodney Dangerfield of VC markets. And there was something to their claims. Based on VC funding, SoCal was actually the 3rd biggest market ahead of NY and just behind Silicon Valley and Massachusetts.
NY Does it Smaller; Maybe Not a One-Trick Pony New York deal count hit five quarter high but is dominated by lots of small Seed VC deals (49% of deals). Although still very tech dominant, the quarter did see NY register signs of life in both green tech and healthcare which typically are nowhere to be found.
Mass Bucks National Trend Deals and Dollars Up Massachusetts, which fell on both deals and dollars last quarter, increased on both this go around. The market saw strength in mobile as well as a modest comeback in the healthcare sector.
Washington and Texas Both Fall Down After a couple of strong quarters, Washington fails to keep its momentum slipping on both deals and dollars. Texas continues its recent descent with deals and funding both being weak.
Venture Capital Activity Report | Q3 2012
www.cbinsights.com
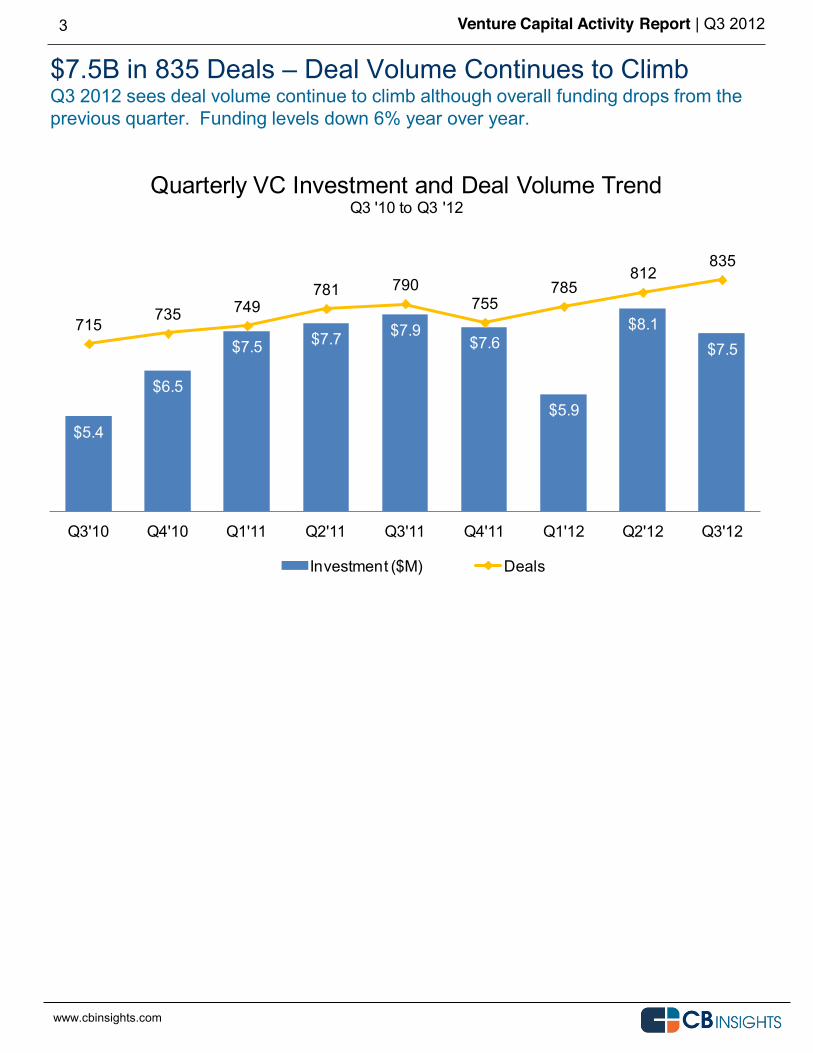
$7.5B in 835 Deals Deal Volume Continues to Climb Q3 2012 sees deal volume continue to climb although overall funding drops from the previous quarter. Funding levels down 6% year over year.
3
$5.4
$6.5
$7.5 $7.7 $7.9$7.6
$5.9
$8.1$7.5
715735 749
781 790755
785812
835
Q3'10 Q4'10 Q1'11 Q2'11 Q3'11 Q4'11 Q1'12 Q2'12 Q3'12
Quarterly VC Investment and Deal Volume TrendQ3 '10 to Q3 '12
Investment ($M) Deals
www.cbinsights.com
Venture Capital Activity Report | Q3 2012
www.cbinsights.com
4
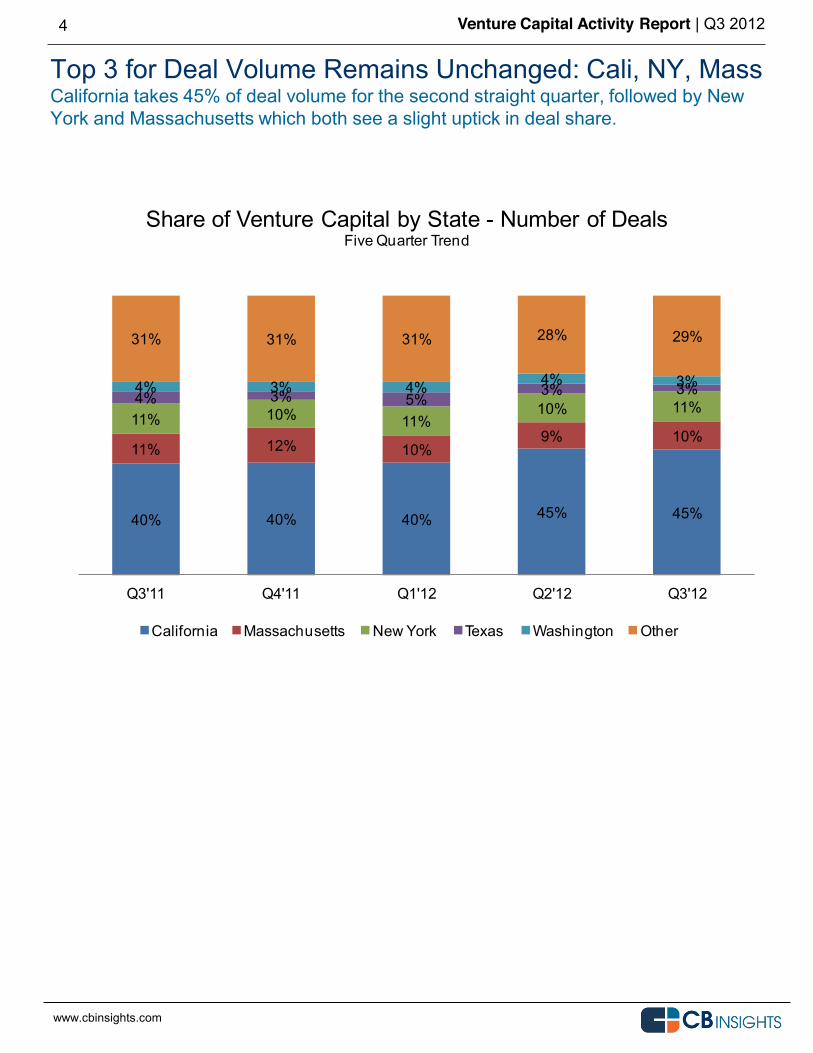
Top 3 for Deal Volume Remains Unchanged: Cali, NY, Mass California takes 45% of deal volume for the second straight quarter, followed by New York and Massachusetts which both see a slight uptick in deal share.
40% 40% 40% 45% 45%
11% 12% 10%9% 10%
11% 10% 11%10% 11%4% 3% 5%3% 3%4% 3% 4% 4% 3%
31% 31% 31% 28% 29%
Q3'11 Q4'11 Q1'12 Q2'12 Q3'12
Share of Venture Capital by State - Number of DealsFive Quarter Trend
California Massachusetts New York Texas Washington Other
www.cbinsights.com
Venture Capital Activity Report | Q3 2012
www.cbinsights.com
5
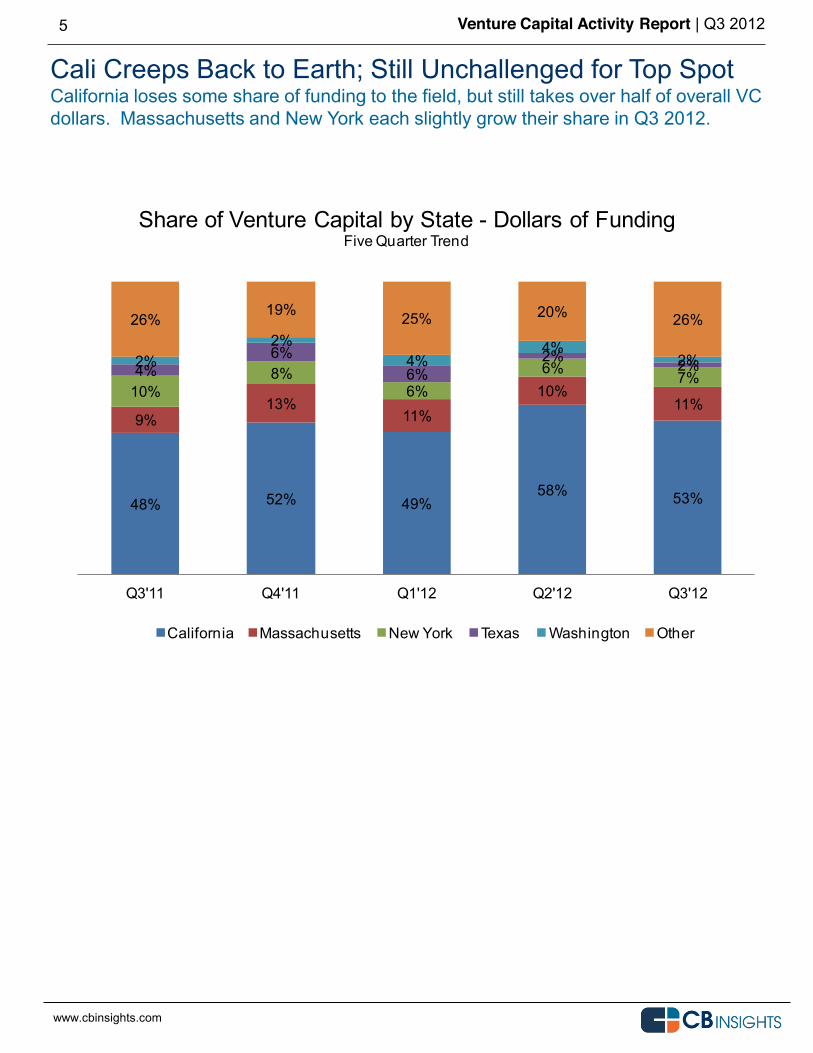
Cali Creeps Back to Earth; Still Unchallenged for Top Spot California loses some share of funding to the field, but still takes over half of overall VC dollars. Massachusetts and New York each slightly grow their share in Q3 2012.
48% 52% 49%58% 53%
9%13%
11%10%
11%10%
8%6%
6% 7%4%6%
6%2% 2%2%
2%4%
4%2%
26%19% 25% 20% 26%
Q3'11 Q4'11 Q1'12 Q2'12 Q3'12
Share of Venture Capital by State - Dollars of FundingFive Quarter Trend
California Massachusetts New York Texas Washington Other
www.cbinsights.com
Venture Capital Activity Report | Q3 2012
www.cbinsights.com
6
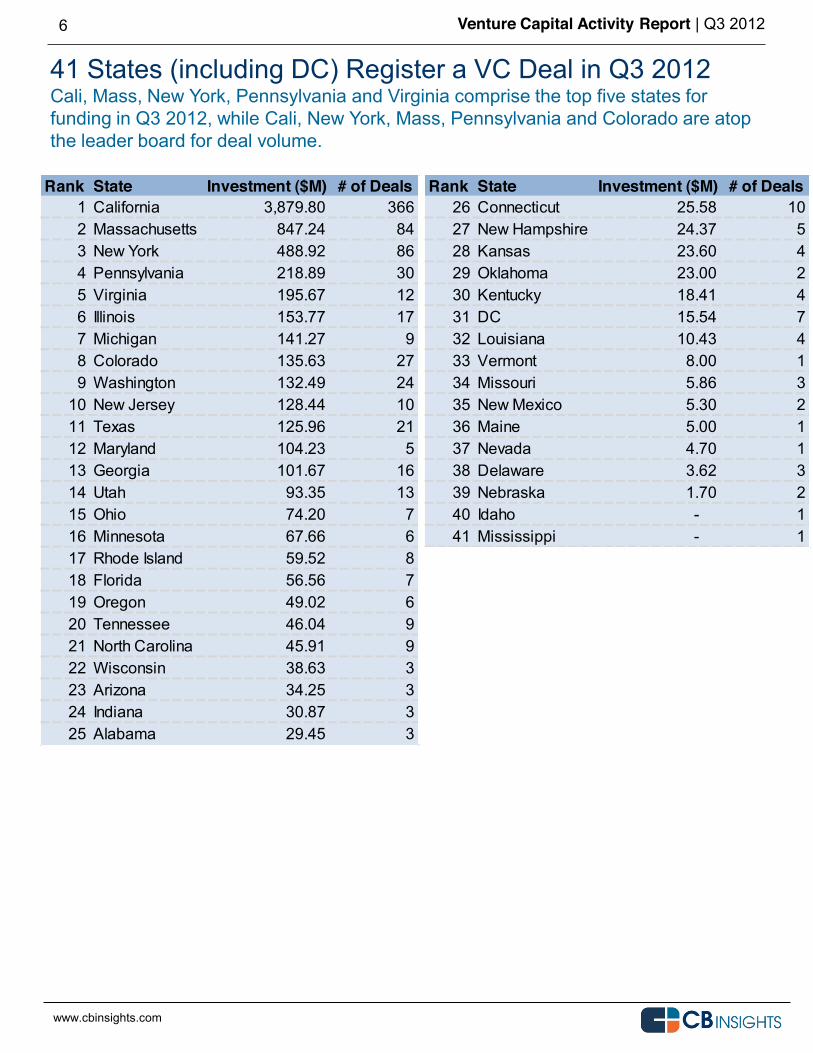
41 States (including DC) Register a VC Deal in Q3 2012 Cali, Mass, New York, Pennsylvania and Virginia comprise the top five states for funding in Q3 2012, while Cali, New York, Mass, Pennsylvania and Colorado are atop the leader board for deal volume.
Rank State Investment ($M) # of Deals1 California 3,879.80 3662 Massachusetts 847.24 843 New York 488.92 864 Pennsylvania 218.89 305 Virginia 195.67 126 Illinois 153.77 177 Michigan 141.27 98 Colorado 135.63 279 Washington 132.49 24
10 New Jersey 128.44 1011 Texas 125.96 2112 Maryland 104.23 513 Georgia 101.67 1614 Utah 93.35 1315 Ohio 74.20 716 Minnesota 67.66 617 Rhode Island 59.52 818 Florida 56.56 719 Oregon 49.02 620 Tennessee 46.04 921 North Carolina 45.91 922 Wisconsin 38.63 323 Arizona 34.25 324 Indiana 30.87 325 Alabama 29.45 3
Rank State Investment ($M) # of Deals26 Connecticut 25.58 1027 New Hampshire 24.37 528 Kansas 23.60 429 Oklahoma 23.00 230 Kentucky 18.41 431 DC 15.54 732 Louisiana 10.43 433 Vermont 8.00 134 Missouri 5.86 335 New Mexico 5.30 236 Maine 5.00 137 Nevada 4.70 138 Delaware 3.62 339 Nebraska 1.70 240 Idaho - 141 Mississippi - 1
Venture Capital Activity Report | Q3 2012
www.cbinsights.com
7
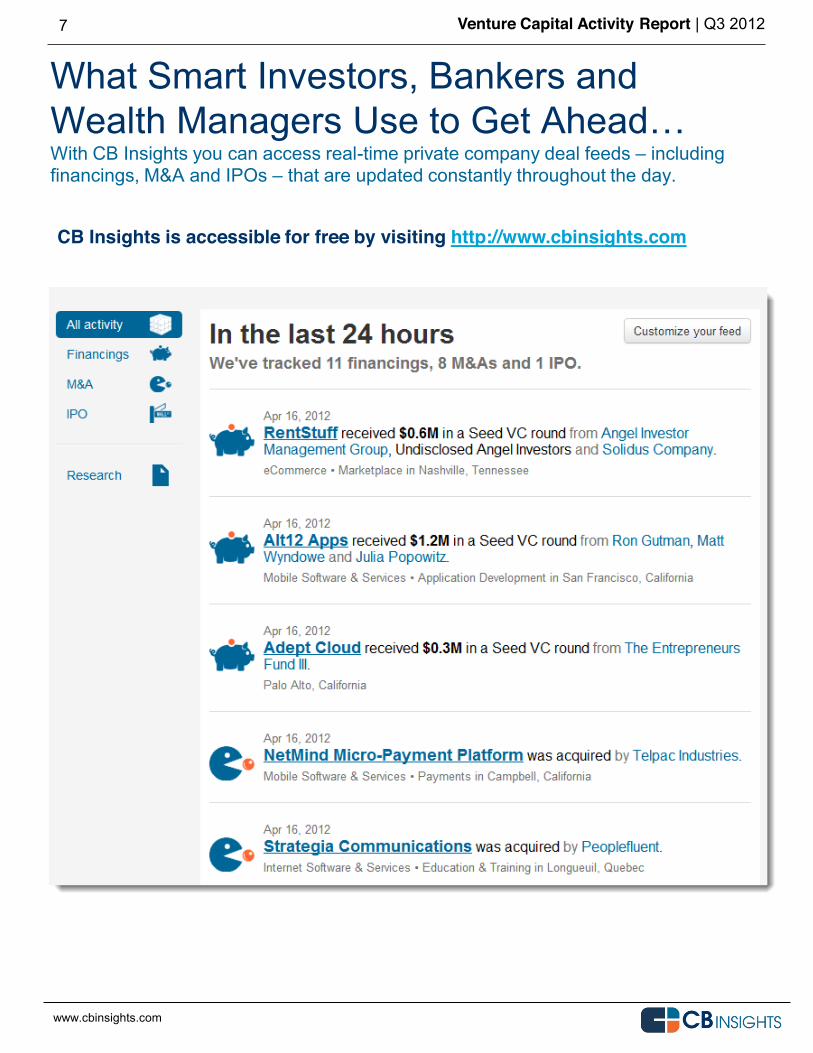
What Smart Investors, Bankers and
With CB Insights you can access real-time private company deal feeds including financings, M&A and IPOs that are updated constantly throughout the day.
CB Insights is accessible for free by visiting http://www.cbinsights.com
Venture Capital Activity Report | Q3 2012
www.cbinsights.com
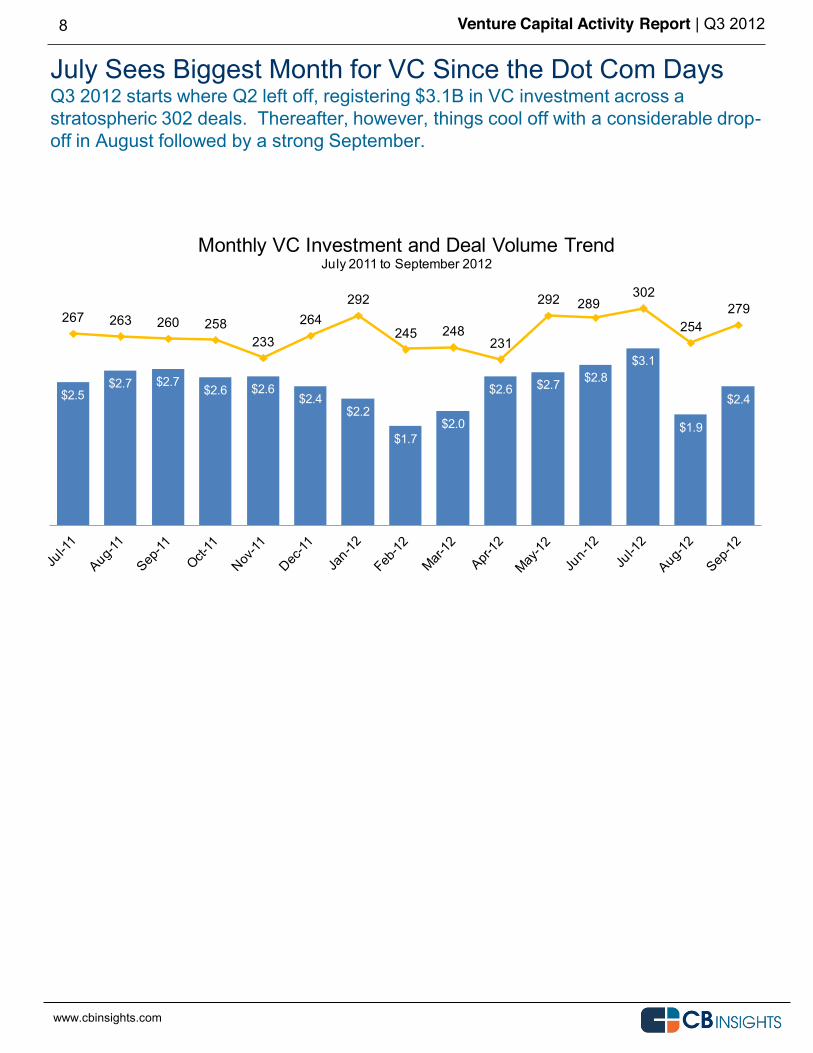
July Sees Biggest Month for VC Since the Dot Com Days Q3 2012 starts where Q2 left off, registering $3.1B in VC investment across a stratospheric 302 deals. Thereafter, however, things cool off with a considerable drop-off in August followed by a strong September.
8
$2.5$2.7 $2.7
$2.6 $2.6$2.4
$2.2
$1.7$2.0
$2.6 $2.7 $2.8$3.1
$1.9
$2.4
267 263 260 258233
264292
245 248231
292 289302
254279
Monthly VC Investment and Deal Volume TrendJuly 2011 to September 2012
www.cbinsights.com
Venture Capital Activity Report | Q3 2012
www.cbinsights.com
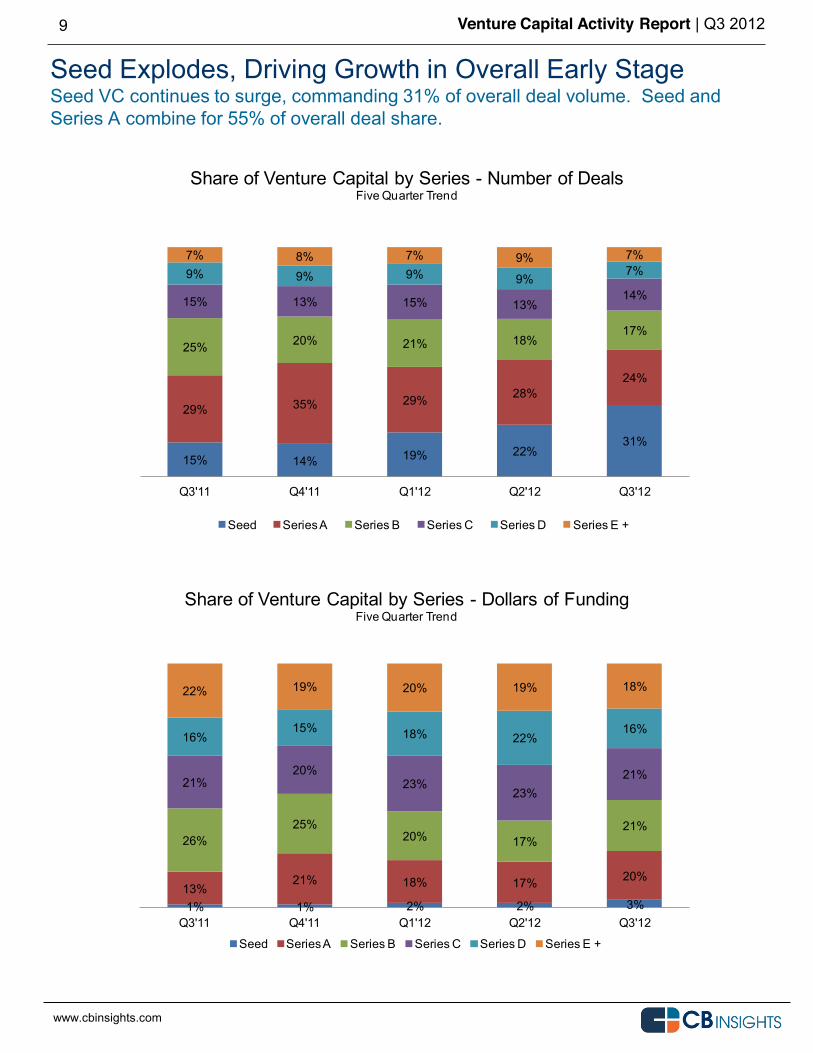
Seed Explodes, Driving Growth in Overall Early Stage Seed VC continues to surge, commanding 31% of overall deal volume. Seed and Series A combine for 55% of overall deal share.
9
15% 14% 19% 22%31%
29% 35% 29% 28%24%
25% 20% 21% 18%17%
15% 13% 15% 13%14%
9% 9% 9% 9%7%
7% 8% 7% 9% 7%
Q3'11 Q4'11 Q1'12 Q2'12 Q3'12
Share of Venture Capital by Series - Number of DealsFive Quarter Trend
Seed Series A Series B Series C Series D Series E +
www.cbinsights.com
1% 1% 2% 2% 3%13%
21% 18% 17% 20%
26%25%
20% 17%21%
21%20%
23%23%
21%
16%15% 18% 22%
16%
22% 19% 20% 19% 18%
Q3'11 Q4'11 Q1'12 Q2'12 Q3'12
Share of Venture Capital by Series - Dollars of FundingFive Quarter Trend
Seed Series A Series B Series C Series D Series E +
www.cbinsights.com
Venture Capital Activity Report | Q3 2012
www.cbinsights.com
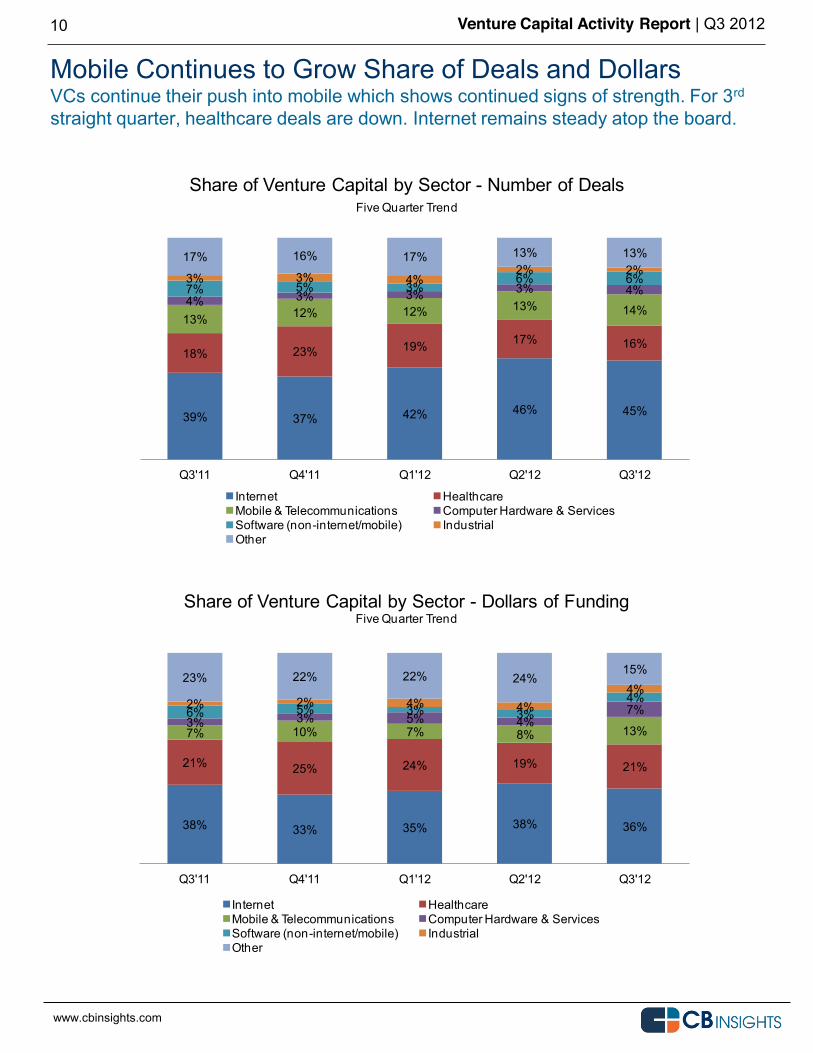
Mobile Continues to Grow Share of Deals and Dollars VCs continue their push into mobile which shows continued signs of strength. For 3rd straight quarter, healthcare deals are down. Internet remains steady atop the board.
10
39% 37% 42% 46% 45%
18% 23% 19% 17% 16%
13% 12% 12% 13% 14%4% 3% 3% 3% 4%7% 5% 3%
6% 6%3% 3% 4%2% 2%
17% 16% 17% 13% 13%
Q3'11 Q4'11 Q1'12 Q2'12 Q3'12
Share of Venture Capital by Sector - Number of DealsFive Quarter Trend
Internet HealthcareMobile & Telecommunications Computer Hardware & ServicesSoftware (non-internet/mobile) IndustrialOther
www.cbinsights.com
38% 33% 35% 38% 36%
21% 25% 24% 19% 21%
7% 10% 7% 8% 13%3% 3% 5% 4%
7%6% 5% 3% 3%4%2% 2% 4% 4%4%
23% 22% 22% 24%15%
Q3'11 Q4'11 Q1'12 Q2'12 Q3'12
Share of Venture Capital by Sector - Dollars of FundingFive Quarter Trend
Internet HealthcareMobile & Telecommunications Computer Hardware & ServicesSoftware (non-internet/mobile) IndustrialOther
www.cbinsights.com

Venture Capital Activity Report | Q3 2012
www.cbinsights.com
11
Get Started for Free with CB Insights Basic membership on CB Insights is free. Just visit http://www.cbinsights.com. Or connect with us via any of the following.
Twitter Follow us @cbinsights
Newsletter Click here to receive our weekly dealflow newsletter.
Email [email protected]
Telephone 212-292-3148
Venture Capital Activity Report | Q3 2012
www.cbinsights.com
INTERNET Q3 2012 Venture Capital
12
Venture Capital Activity Report | Q3 2012
www.cbinsights.com
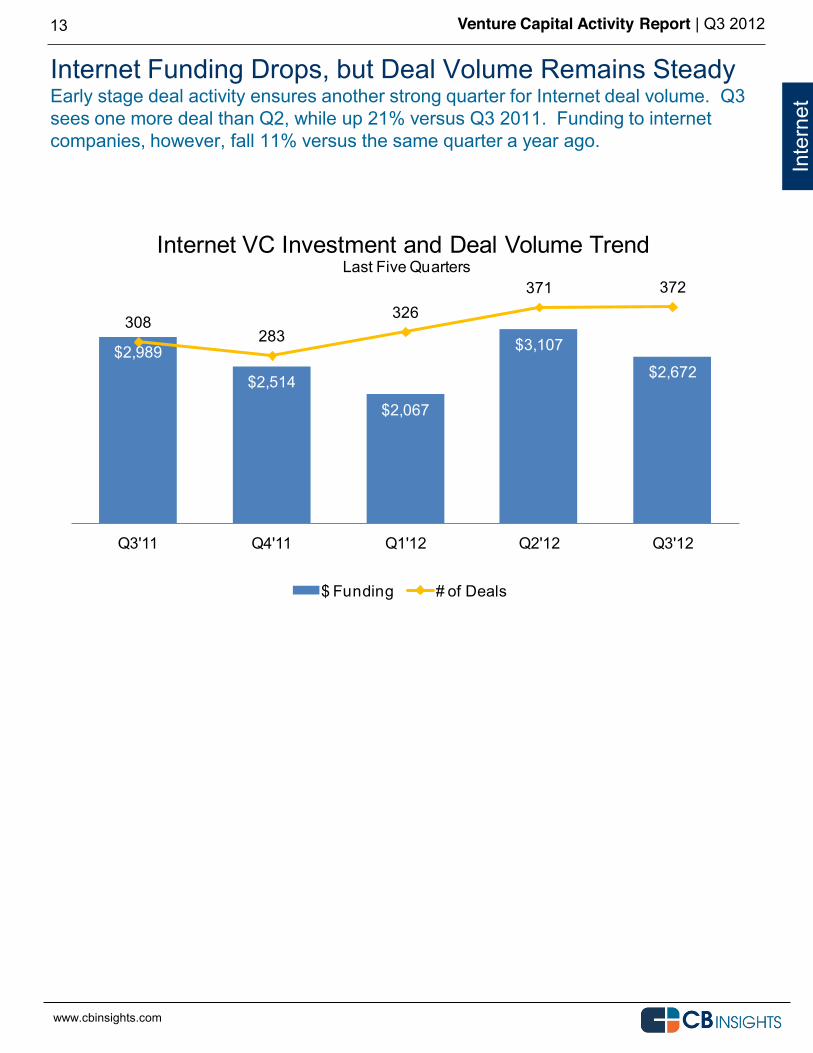
Internet Funding Drops, but Deal Volume Remains Steady Early stage deal activity ensures another strong quarter for Internet deal volume. Q3 sees one more deal than Q2, while up 21% versus Q3 2011. Funding to internet companies, however, fall 11% versus the same quarter a year ago.
13
Inte
rnet
$2,989
$2,514
$2,067
$3,107
$2,672
308283
326371 372
Q3'11 Q4'11 Q1'12 Q2'12 Q3'12
Internet VC Investment and Deal Volume Trend
$ Funding # of Deals
www.cbinsights.com
Last Five Quarters
Venture Capital Activity Report | Q3 2012
www.cbinsights.com
14
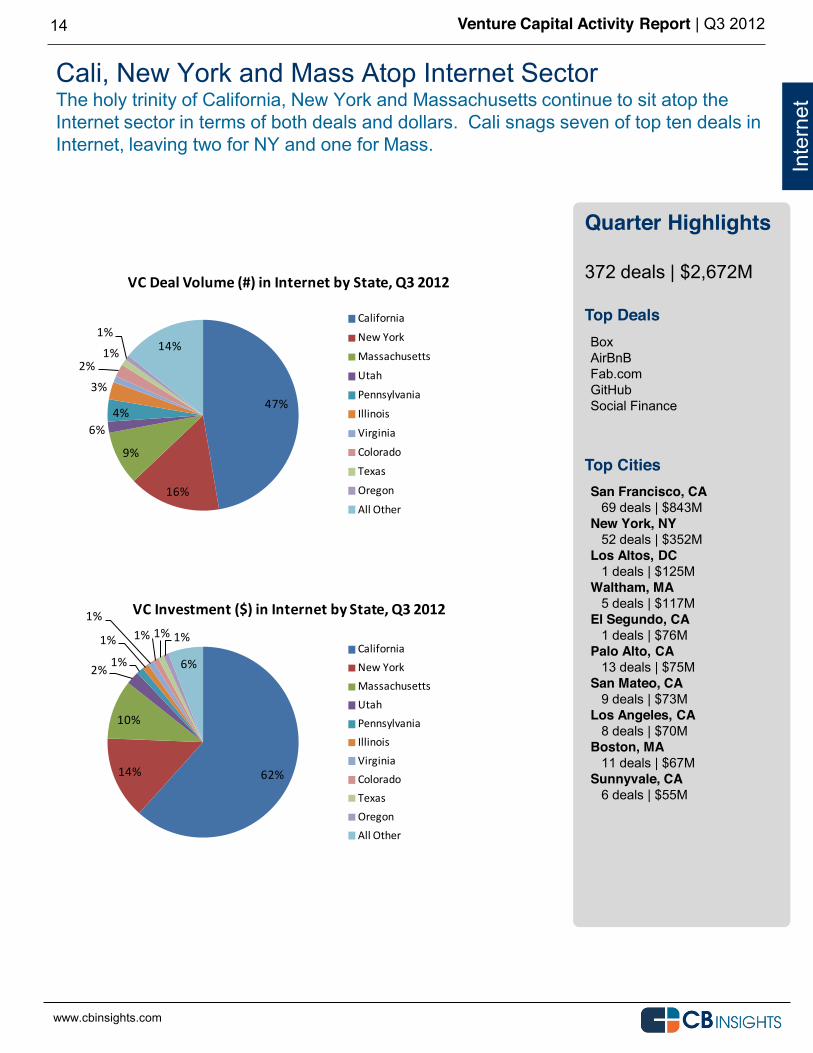
Quarter Highlights 372 deals | $2,672M Top Deals
Top Cities
Cali, New York and Mass Atop Internet Sector The holy trinity of California, New York and Massachusetts continue to sit atop the Internet sector in terms of both deals and dollars. Cali snags seven of top ten deals in Internet, leaving two for NY and one for Mass.
Inte
rnet
San Francisco, CA 69 deals | $843M New York, NY 52 deals | $352M Los Altos, DC 1 deals | $125M Waltham, MA 5 deals | $117M El Segundo, CA 1 deals | $76M Palo Alto, CA 13 deals | $75M San Mateo, CA 9 deals | $73M Los Angeles, CA 8 deals | $70M Boston, MA 11 deals | $67M Sunnyvale, CA 6 deals | $55M
Box AirBnB Fab.com GitHub Social Finance 47%
16%
9%
6%4%
3%
2%1%
1%14%
VC Deal Volume (#) in Internet by State, Q3 2012
California
New York
Massachusetts
Utah
Pennsylvania
Illinois
Virginia
Colorado
Texas
Oregon
All Other
www.cbinsights.com
62%14%
10%
2% 1%
1%
1%1% 1% 1%
6%
VC Investment ($) in Internet by State, Q3 2012
CaliforniaNew YorkMassachusettsUtahPennsylvaniaIllinoisVirginiaColoradoTexasOregonAll Other
www.cbinsights.com
Venture Capital Activity Report | Q3 2012
www.cbinsights.com
15
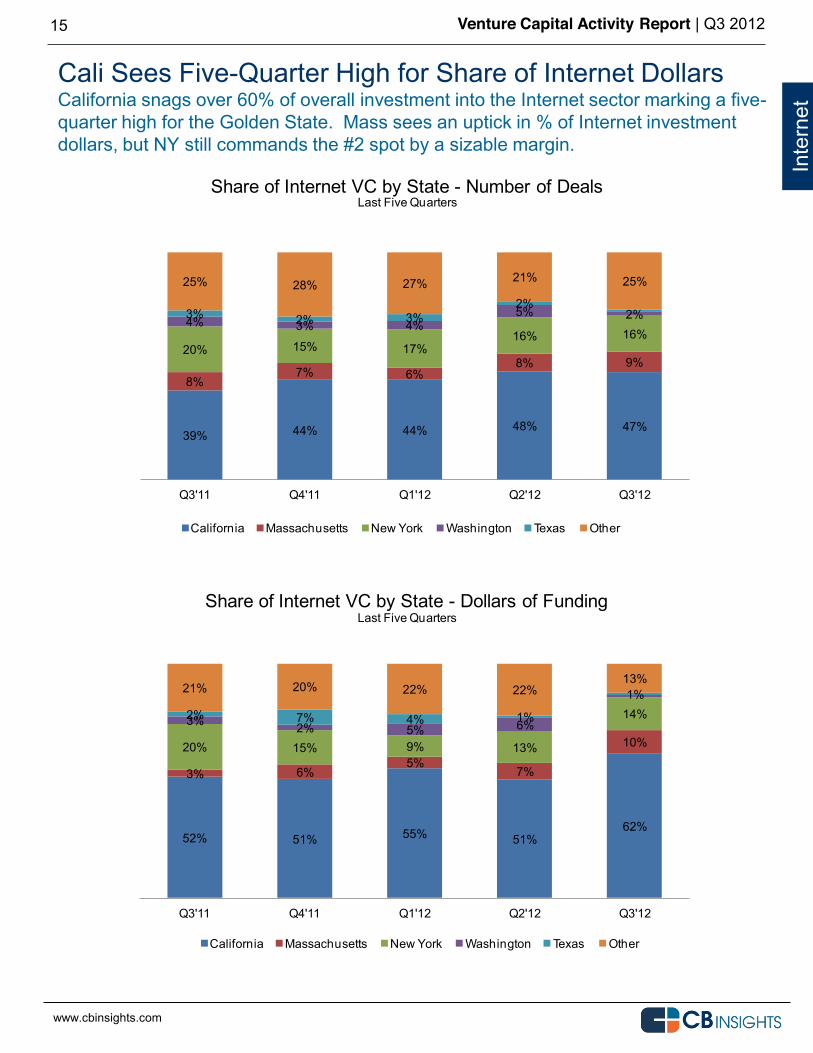
Cali Sees Five-Quarter High for Share of Internet Dollars California snags over 60% of overall investment into the Internet sector marking a five-quarter high for the Golden State. Mass sees an uptick in % of Internet investment dollars, but NY still commands the #2 spot by a sizable margin.
Inte
rnet
52% 51% 55% 51%
62%
3% 6%5%
7%
10%20% 15% 9% 13%
14%3% 2% 5% 6%2% 7% 4% 1%
1%21% 20% 22% 22%13%
Q3'11 Q4'11 Q1'12 Q2'12 Q3'12
Share of Internet VC by State - Dollars of Funding
California Massachusetts New York Washington Texas Other
www.cbinsights.com
Last Five Quarters
39% 44% 44% 48% 47%
8%7% 6%
8% 9%20% 15% 17%
16% 16%4% 3% 4%
5% 2%3% 2% 3%2%
25% 28% 27% 21% 25%
Q3'11 Q4'11 Q1'12 Q2'12 Q3'12
Share of Internet VC by State - Number of Deals
California Massachusetts New York Washington Texas Other
www.cbinsights.com
Last Five Quarters
Venture Capital Activity Report | Q3 2012
www.cbinsights.com
16
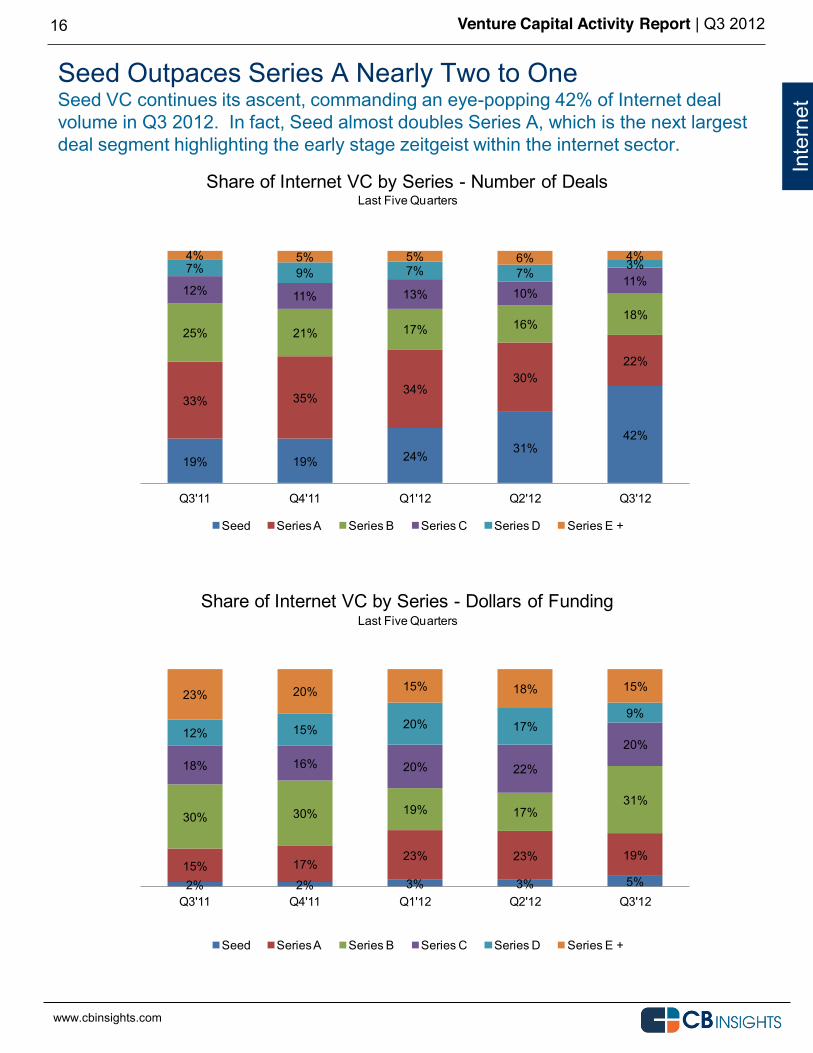
Seed Outpaces Series A Nearly Two to One Seed VC continues its ascent, commanding an eye-popping 42% of Internet deal volume in Q3 2012. In fact, Seed almost doubles Series A, which is the next largest deal segment highlighting the early stage zeitgeist within the internet sector.
Inte
rnet
19% 19% 24%31%
42%
33% 35%34%
30%22%
25% 21% 17% 16%18%
12% 11% 13% 10%11%
7% 9% 7% 7%3%
4% 5% 5% 6% 4%
Q3'11 Q4'11 Q1'12 Q2'12 Q3'12
Share of Internet VC by Series - Number of Deals
Seed Series A Series B Series C Series D Series E +
www.cbinsights.com
Last Five Quarters
2% 2% 3% 3% 5%15% 17%
23% 23% 19%
30% 30% 19% 17%31%
18% 16% 20% 22%
20%12% 15% 20% 17%
9%23% 20% 15% 18% 15%
Q3'11 Q4'11 Q1'12 Q2'12 Q3'12
Share of Internet VC by Series - Dollars of Funding
Seed Series A Series B Series C Series D Series E +
www.cbinsights.com
Last Five Quarters
Venture Capital Activity Report | Q3 2012
www.cbinsights.com
17
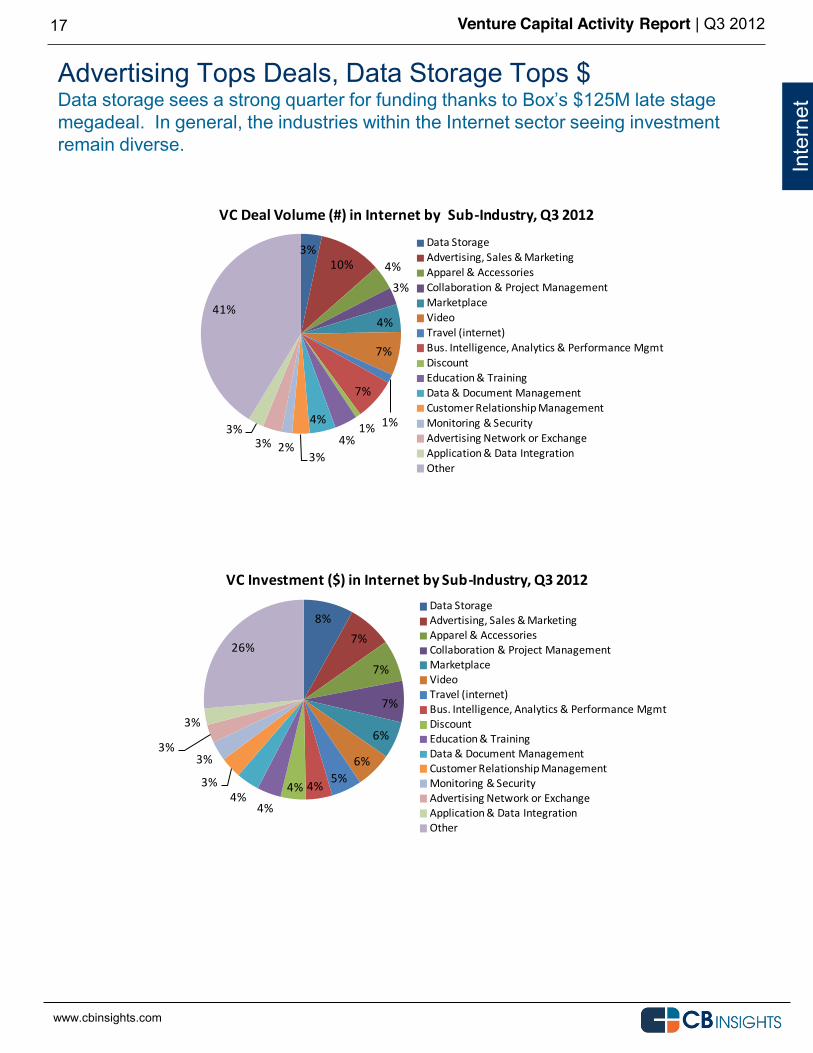
Advertising Tops Deals, Data Storage Tops $
megadeal. In general, the industries within the Internet sector seeing investment remain diverse.
Inte
rnet
8%7%
7%
7%
6%
6%5%4%4%
4%4%
3%
3%3%
3%
26%
VC Investment ($) in Internet by Sub-‐Industry, Q3 2012Data StorageAdvertising, Sales & MarketingApparel & AccessoriesCollaboration & Project ManagementMarketplaceVideoTravel (internet)Bus. Intelligence, Analytics & Performance MgmtDiscountEducation & TrainingData & Document ManagementCustomer Relationship ManagementMonitoring & SecurityAdvertising Network or ExchangeApplication & Data IntegrationOther
www.cbinsights.com
3%10% 4%
3%
4%
7%
1%
7%
1%4%
4%
3%2%3%
3%
41%
VC Deal Volume (#) in Internet by Sub-‐Industry, Q3 2012
Data StorageAdvertising, Sales & MarketingApparel & AccessoriesCollaboration & Project ManagementMarketplaceVideoTravel (internet)Bus. Intelligence, Analytics & Performance MgmtDiscountEducation & TrainingData & Document ManagementCustomer Relationship ManagementMonitoring & SecurityAdvertising Network or ExchangeApplication & Data IntegrationOther
www.cbinsights.com
Venture Capital Activity Report | Q3 2012
www.cbinsights.com
18
Inte
rnet
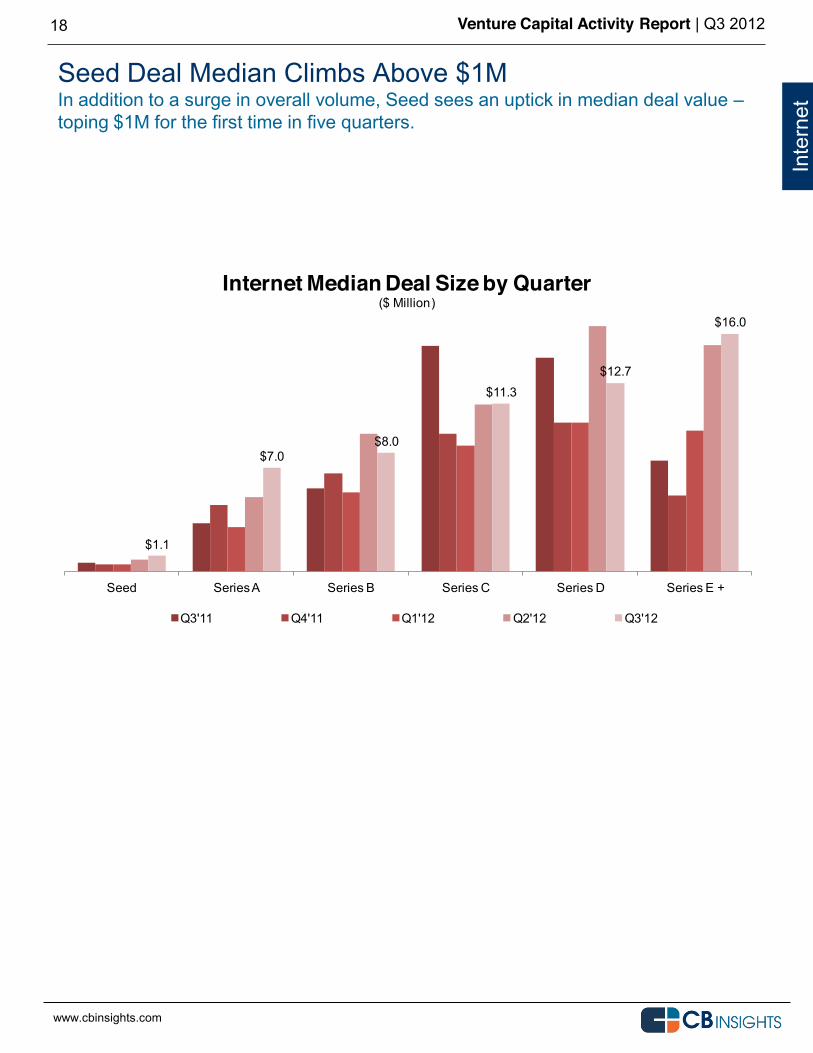
Seed Deal Median Climbs Above $1M In addition to a surge in overall volume, Seed sees an uptick in median deal value toping $1M for the first time in five quarters.
$1.1
$7.0$8.0
$11.3$12.7
$16.0
Seed Series A Series B Series C Series D Series E +
Internet Median Deal Size by Quarter($ Million)
Q3'11 Q4'11 Q1'12 Q2'12 Q3'12
www.cbinsights.com
Venture Capital Activity Report | Q3 2012
www.cbinsights.com
MOBILE & TELECOM Q3 2012 Venture Capital
19
Venture Capital Activity Report | Q3 2012
www.cbinsights.com
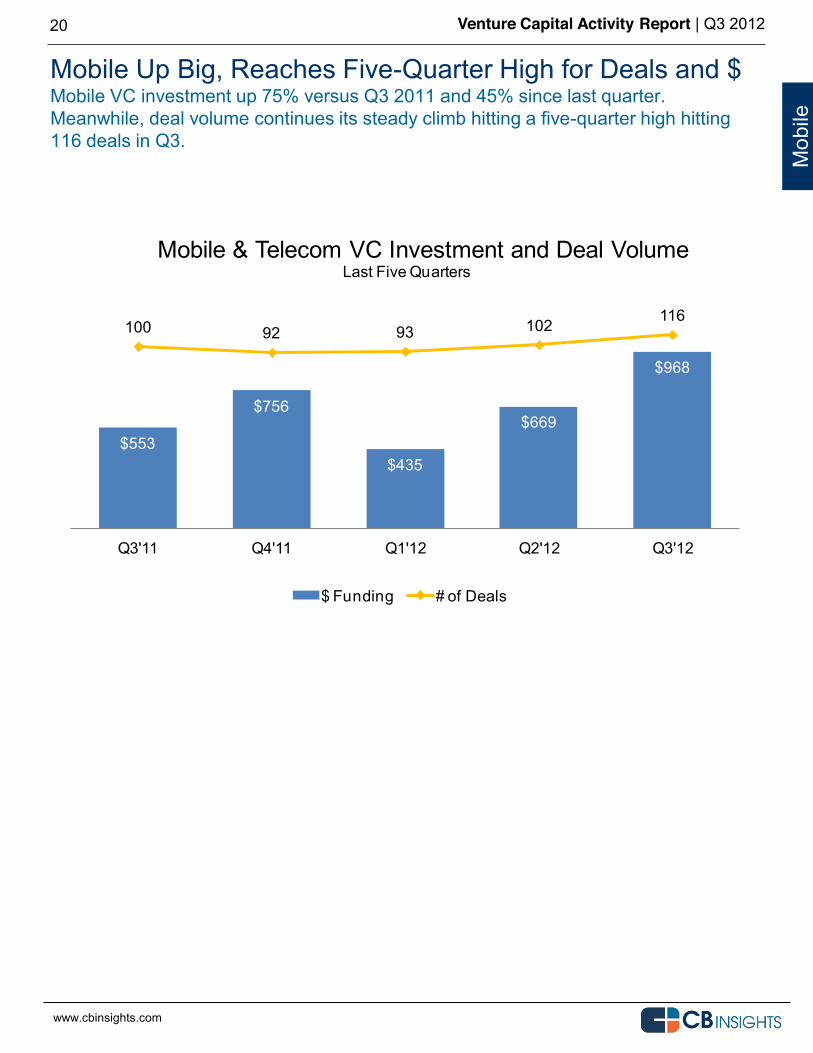
Mobile Up Big, Reaches Five-Quarter High for Deals and $ Mobile VC investment up 75% versus Q3 2011 and 45% since last quarter. Meanwhile, deal volume continues its steady climb hitting a five-quarter high hitting 116 deals in Q3.
20
Mob
ile
$553
$756
$435
$669
$968
100 92 93 102 116
Q3'11 Q4'11 Q1'12 Q2'12 Q3'12
Mobile & Telecom VC Investment and Deal Volume
$ Funding # of Deals
www.cbinsights.com
Last Five Quarters
Venture Capital Activity Report | Q3 2012
www.cbinsights.com
21
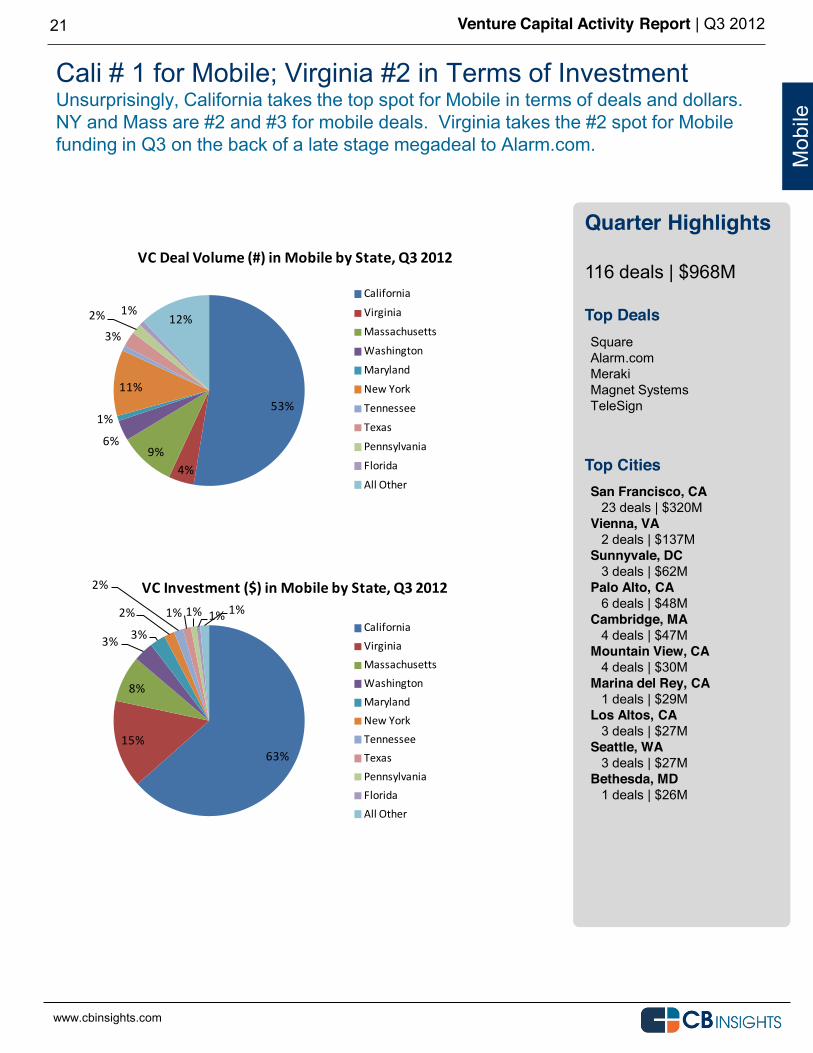
Quarter Highlights 116 deals | $968M Top Deals
Top Cities
Cali # 1 for Mobile; Virginia #2 in Terms of Investment Unsurprisingly, California takes the top spot for Mobile in terms of deals and dollars. NY and Mass are #2 and #3 for mobile deals. Virginia takes the #2 spot for Mobile funding in Q3 on the back of a late stage megadeal to Alarm.com.
Mob
ile
San Francisco, CA 23 deals | $320M Vienna, VA 2 deals | $137M Sunnyvale, DC 3 deals | $62M Palo Alto, CA 6 deals | $48M Cambridge, MA 4 deals | $47M Mountain View, CA 4 deals | $30M Marina del Rey, CA 1 deals | $29M Los Altos, CA 3 deals | $27M Seattle, WA 3 deals | $27M Bethesda, MD 1 deals | $26M
Square Alarm.com Meraki Magnet Systems TeleSign 53%
4%9%
6%
1%
11%
3%
2% 1%12%
VC Deal Volume (#) in Mobile by State, Q3 2012
California
Virginia
Massachusetts
Washington
Maryland
New York
Tennessee
Texas
Pennsylvania
Florida
All Other
www.cbinsights.com
63%15%
8%
3% 3%
2%
2%
1% 1% 1% 1%
VC Investment ($) in Mobile by State, Q3 2012
CaliforniaVirginiaMassachusettsWashingtonMarylandNew YorkTennesseeTexasPennsylvaniaFloridaAll Other
www.cbinsights.com
Venture Capital Activity Report | Q3 2012
www.cbinsights.com
22
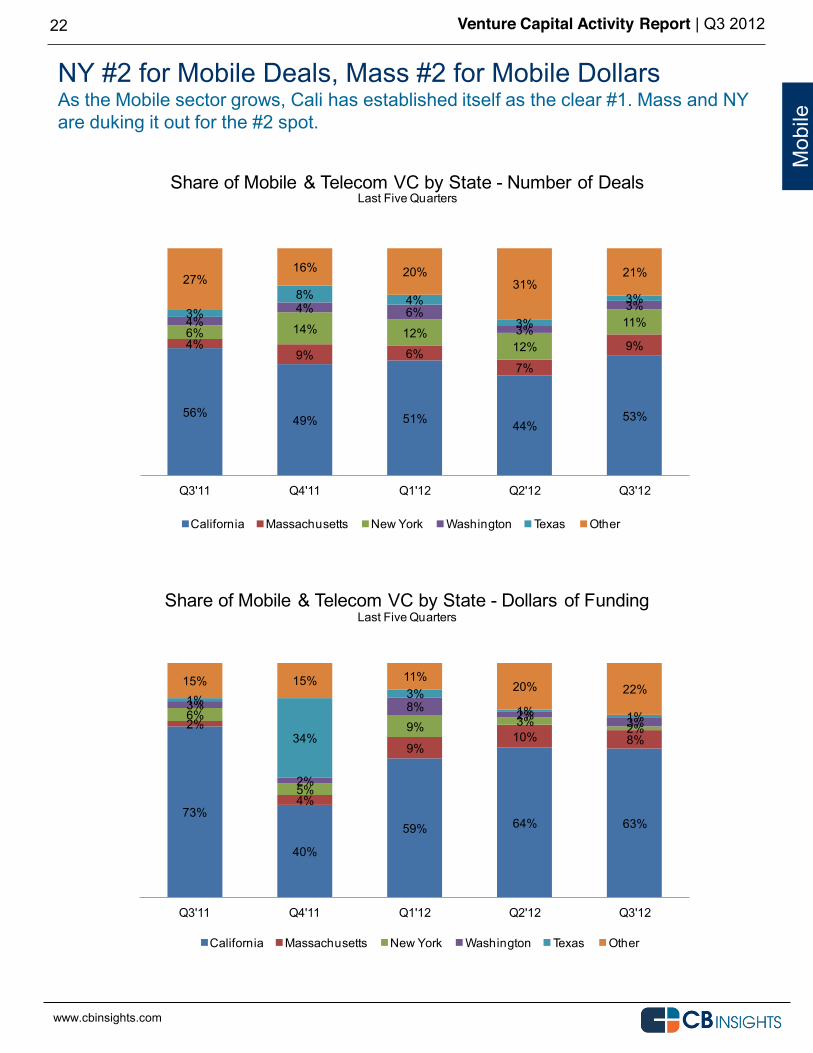
NY #2 for Mobile Deals, Mass #2 for Mobile Dollars As the Mobile sector grows, Cali has established itself as the clear #1. Mass and NY are duking it out for the #2 spot.
Mob
ile
73%
40%
59% 64% 63%
2%
4%
9%10% 8%
6%
5%
9% 3% 2%
3%
2%
8%2% 3%
1%
34%
3%1% 1%
15% 15% 11%20% 22%
Q3'11 Q4'11 Q1'12 Q2'12 Q3'12
Share of Mobile & Telecom VC by State - Dollars of Funding
California Massachusetts New York Washington Texas Other
www.cbinsights.com
Last Five Quarters
56% 49% 51% 44%53%
4%9% 6%
7%
9%6% 14% 12%
12%
11%4%4% 6%
3%
3%3%8% 4%
3%
3%27%
16% 20%31%
21%
Q3'11 Q4'11 Q1'12 Q2'12 Q3'12
Share of Mobile & Telecom VC by State - Number of Deals
California Massachusetts New York Washington Texas Other
www.cbinsights.com
Last Five Quarters

Venture Capital Activity Report | Q3 2012
www.cbinsights.com
23
Early Stage Reigns in the Mobile Sector Mobile follows suit with its big cousin, Internet, becoming a big time destination for seed funding. Overall early stage commands two-thirds of overall early stage volume.
Mob
ile
30% 24%33% 34%
42%
33% 44% 33% 33%25%
15%14% 14% 11%
18%8%
9% 10% 14%7%11% 1% 4% 3% 4%
3% 7% 5% 6% 4%
Q3'11 Q4'11 Q1'12 Q2'12 Q3'12
Share of Mobile & Telecom VC by Series - Number of Deals
Seed Series A Series B Series C Series D Series E +
www.cbinsights.com
Last Five Quarters
4% 4% 6% 5% 4%
23% 30% 30%22% 17%
19%
28% 18%27%
20%
14%
16%14%
29%
9%
31% 1% 14%
3%
28%
8%22% 19% 13%
22%
Q3'11 Q4'11 Q1'12 Q2'12 Q3'12
Share of Mobile & Telecom VC by Series - Funding Dollars
Seed Series A Series B Series C Series D Series E +
www.cbinsights.com
Last Five Quarters
Venture Capital Activity Report | Q3 2012
www.cbinsights.com
24
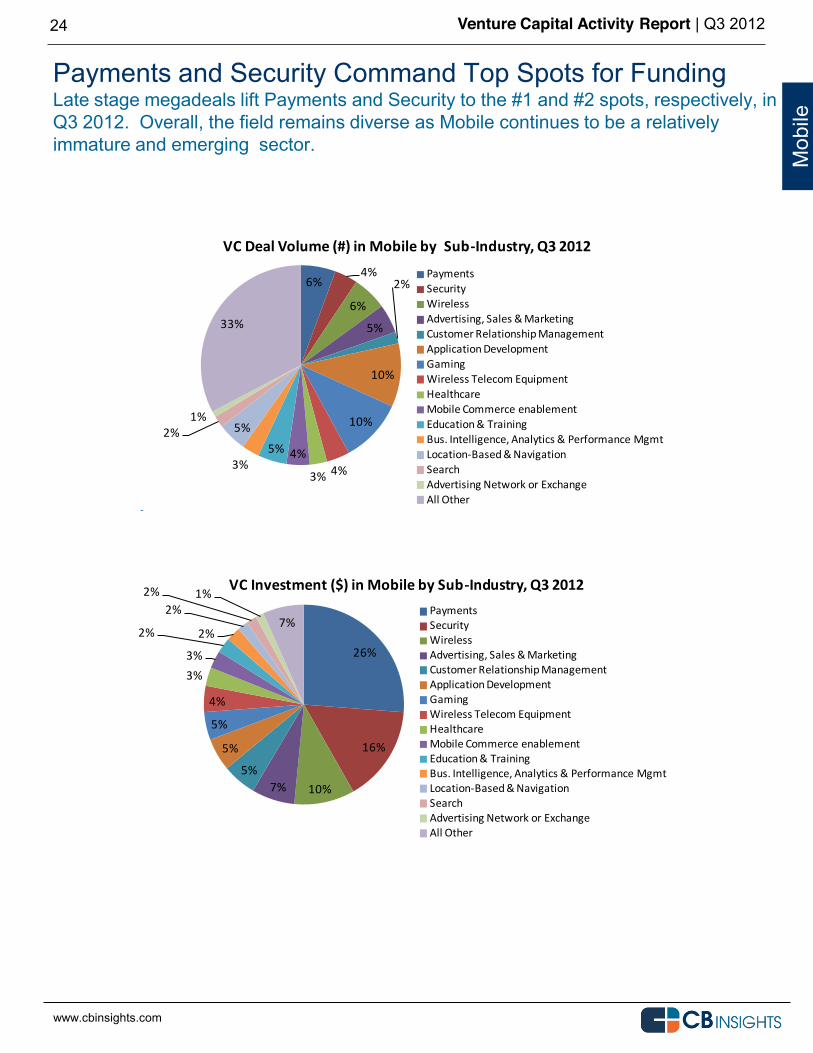
Payments and Security Command Top Spots for Funding Late stage megadeals lift Payments and Security to the #1 and #2 spots, respectively, in Q3 2012. Overall, the field remains diverse as Mobile continues to be a relatively immature and emerging sector.
Mob
ile
26%
16%
10%7%5%
5%
5%
4%
3%3%
2% 2%
2%2% 1%
7%
VC Investment ($) in Mobile by Sub-‐Industry, Q3 2012PaymentsSecurityWirelessAdvertising, Sales & MarketingCustomer Relationship ManagementApplication DevelopmentGamingWireless Telecom EquipmentHealthcareMobile Commerce enablementEducation & TrainingBus. Intelligence, Analytics & Performance MgmtLocation-‐Based & NavigationSearchAdvertising Network or ExchangeAll Other
www.cbinsights.com
6%4%
6%
5%
2%
10%
10%
4%3%
4%5%3%
5%2%1%
33%
VC Deal Volume (#) in Mobile by Sub-‐Industry, Q3 2012
PaymentsSecurityWirelessAdvertising, Sales & MarketingCustomer Relationship ManagementApplication DevelopmentGamingWireless Telecom EquipmentHealthcareMobile Commerce enablementEducation & TrainingBus. Intelligence, Analytics & Performance MgmtLocation-‐Based & NavigationSearchAdvertising Network or ExchangeAll Other
www.cbinsights.com
Venture Capital Activity Report | Q3 2012
www.cbinsights.com
25
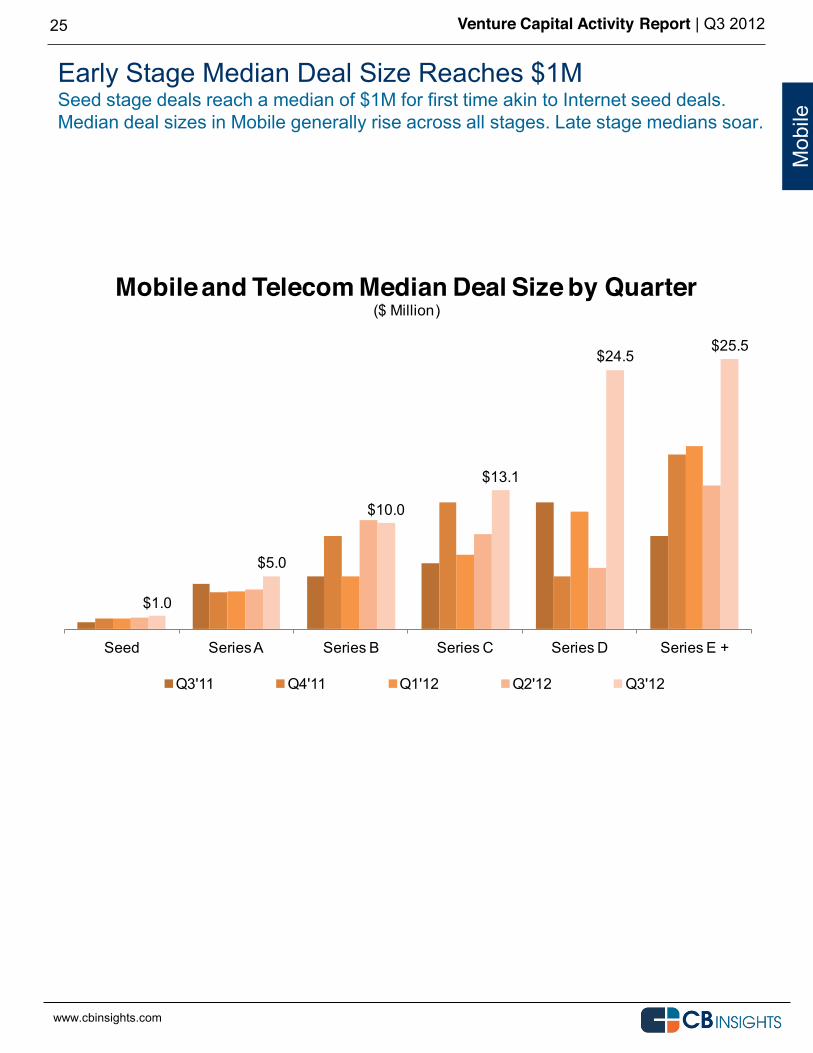
Early Stage Median Deal Size Reaches $1M Seed stage deals reach a median of $1M for first time akin to Internet seed deals. Median deal sizes in Mobile generally rise across all stages. Late stage medians soar.
Mob
ile
$1.0
$5.0
$10.0
$13.1
$24.5$25.5
Seed Series A Series B Series C Series D Series E +
Mobile and Telecom Median Deal Size by Quarter($ Million)
Q3'11 Q4'11 Q1'12 Q2'12 Q3'12
www.cbinsights.com
Venture Capital Activity Report | Q3 2012
www.cbinsights.com
HEALTHCARE Q3 2012 Venture Capital
26
Venture Capital Activity Report | Q3 2012
www.cbinsights.com
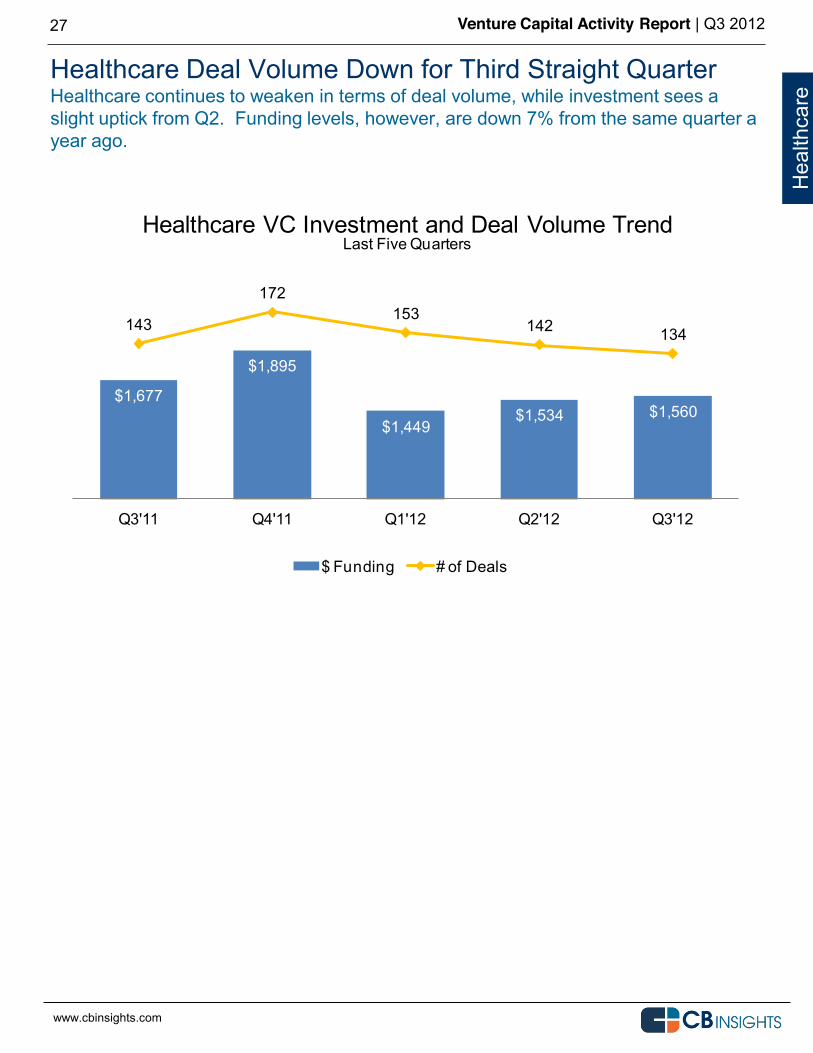
Healthcare Deal Volume Down for Third Straight Quarter Healthcare continues to weaken in terms of deal volume, while investment sees a slight uptick from Q2. Funding levels, however, are down 7% from the same quarter a year ago.
27
Hea
lthca
re
$1,677
$1,895
$1,449$1,534 $1,560
143
172153
142 134
Q3'11 Q4'11 Q1'12 Q2'12 Q3'12
Healthcare VC Investment and Deal Volume Trend
$ Funding # of Deals
www.cbinsights.com
Last Five Quarters
Venture Capital Activity Report | Q3 2012
www.cbinsights.com
28
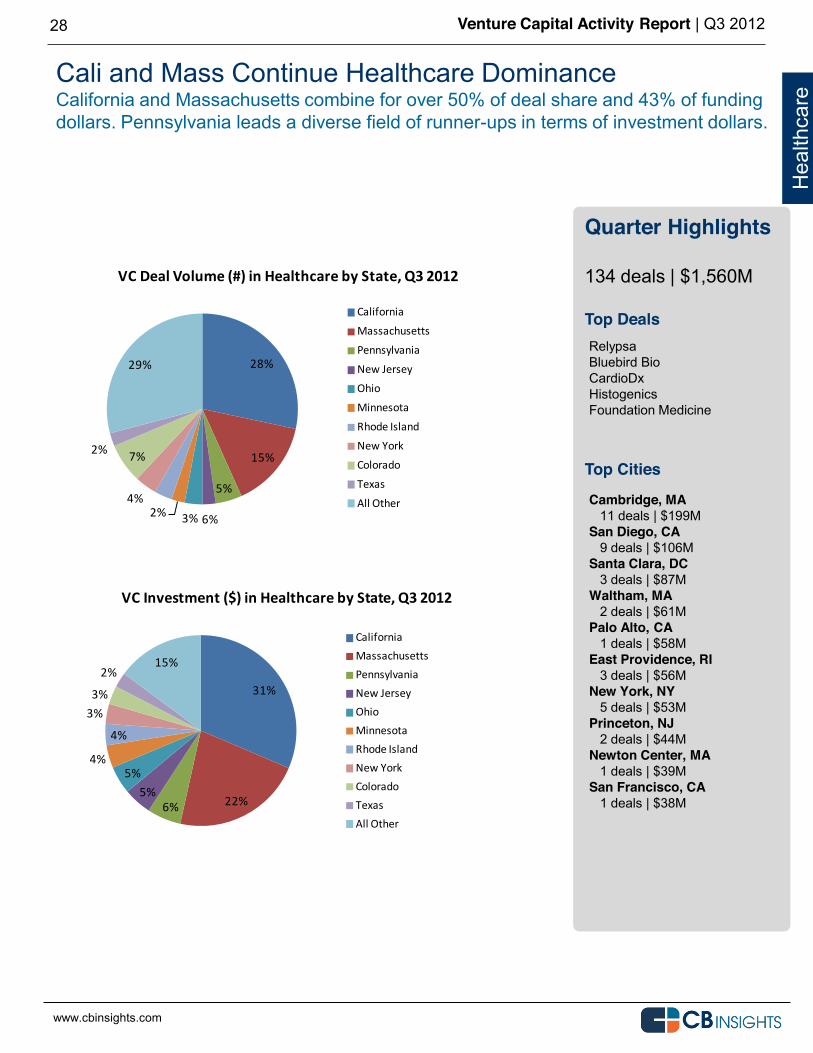
Cali and Mass Continue Healthcare Dominance California and Massachusetts combine for over 50% of deal share and 43% of funding dollars. Pennsylvania leads a diverse field of runner-ups in terms of investment dollars.
Quarter Highlights 134 deals | $1,560M Top Deals
Top Cities
Hea
lthca
re
Cambridge, MA 11 deals | $199M San Diego, CA 9 deals | $106M Santa Clara, DC 3 deals | $87M Waltham, MA 2 deals | $61M Palo Alto, CA 1 deals | $58M East Providence, RI 3 deals | $56M New York, NY 5 deals | $53M Princeton, NJ 2 deals | $44M Newton Center, MA 1 deals | $39M San Francisco, CA 1 deals | $38M
Relypsa Bluebird Bio CardioDx Histogenics Foundation Medicine
31%
22%6%5%
5%4%
4%
3%3%
2%15%
VC Investment ($) in Healthcare by State, Q3 2012
CaliforniaMassachusettsPennsylvaniaNew JerseyOhioMinnesotaRhode IslandNew YorkColoradoTexasAll Other
www.cbinsights.com
28%
15%
5%
6%3%2%4%
7%2%
29%
VC Deal Volume (#) in Healthcare by State, Q3 2012
California
Massachusetts
Pennsylvania
New Jersey
Ohio
Minnesota
Rhode Island
New York
Colorado
Texas
All Other
www.cbinsights.com
Venture Capital Activity Report | Q3 2012
www.cbinsights.com
29
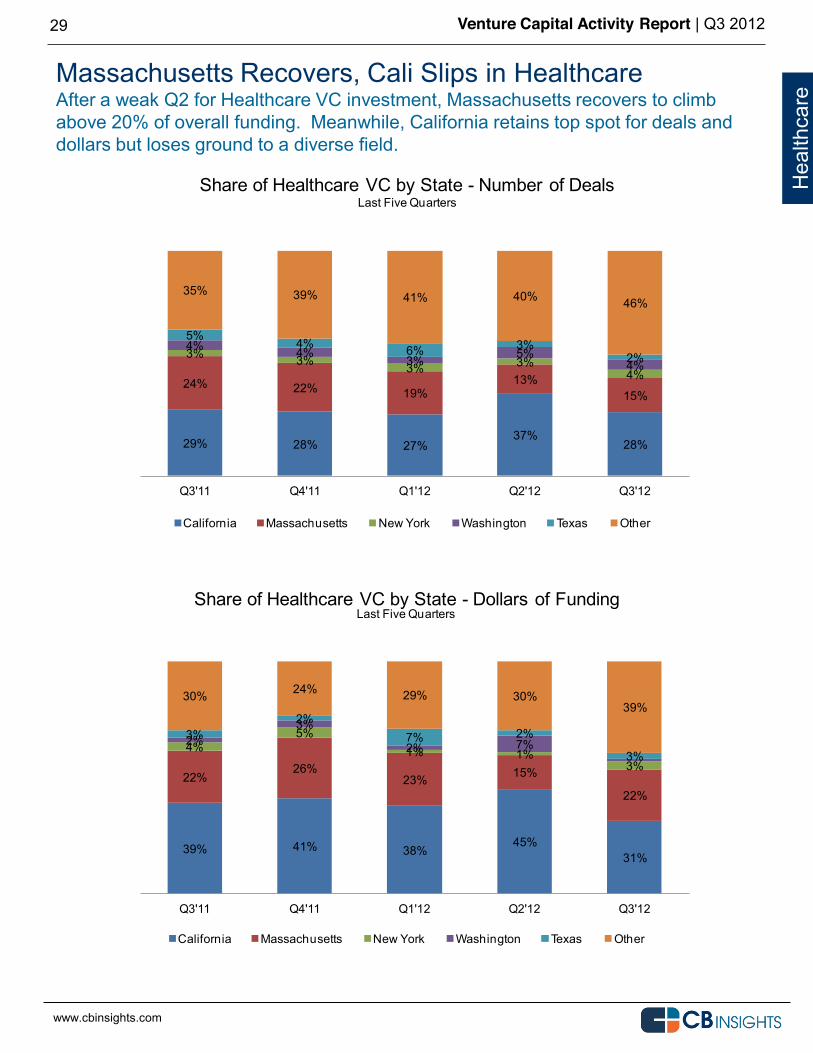
Massachusetts Recovers, Cali Slips in Healthcare After a weak Q2 for Healthcare VC investment, Massachusetts recovers to climb above 20% of overall funding. Meanwhile, California retains top spot for deals and dollars but loses ground to a diverse field.
Hea
lthca
re
29% 28% 27%37%
28%
24% 22% 19%13%
15%
3% 3% 3% 3%4%
4% 4%3% 5%
4%
5% 4% 6% 3%2%
35% 39% 41% 40% 46%
Q3'11 Q4'11 Q1'12 Q2'12 Q3'12
Share of Healthcare VC by State - Number of Deals
California Massachusetts New York Washington Texas Other
www.cbinsights.com
Last Five Quarters
39% 41% 38%45%
31%
22%26%
23% 15%
22%
4%5%
1% 1%3%
2%3%
2% 7%3%
2%7% 2%
3%
30% 24% 29% 30%39%
Q3'11 Q4'11 Q1'12 Q2'12 Q3'12
Share of Healthcare VC by State - Dollars of Funding
California Massachusetts New York Washington Texas Other
www.cbinsights.com
Last Five Quarters
Venture Capital Activity Report | Q3 2012
www.cbinsights.com
30
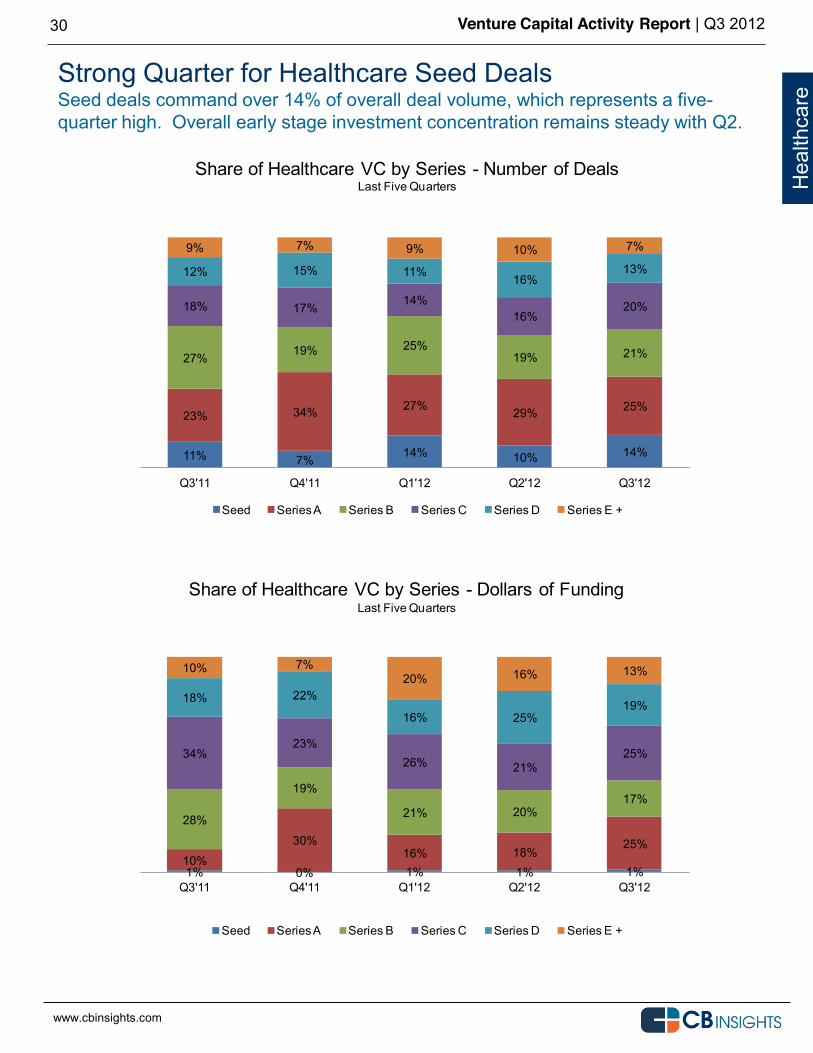
Strong Quarter for Healthcare Seed Deals Seed deals command over 14% of overall deal volume, which represents a five-quarter high. Overall early stage investment concentration remains steady with Q2.
Hea
lthca
re
11% 7% 14% 10% 14%
23% 34% 27% 29% 25%
27% 19% 25%19% 21%
18% 17% 14%16%
20%
12% 15% 11% 16%13%
9% 7% 9% 10% 7%
Q3'11 Q4'11 Q1'12 Q2'12 Q3'12
Share of Healthcare VC by Series - Number of Deals
Seed Series A Series B Series C Series D Series E +
www.cbinsights.com
Last Five Quarters
www.cbinsights.com
1% 0% 1% 1% 1%10%
30%16% 18%
25%
28%
19%
21% 20%17%
34%23%
26% 21%25%
18% 22%
16% 25%19%
10% 7%20% 16% 13%
Q3'11 Q4'11 Q1'12 Q2'12 Q3'12
Share of Healthcare VC by Series - Dollars of Funding
Seed Series A Series B Series C Series D Series E +
www.cbinsights.com
Last Five Quarters
Venture Capital Activity Report | Q3 2012
www.cbinsights.com
31
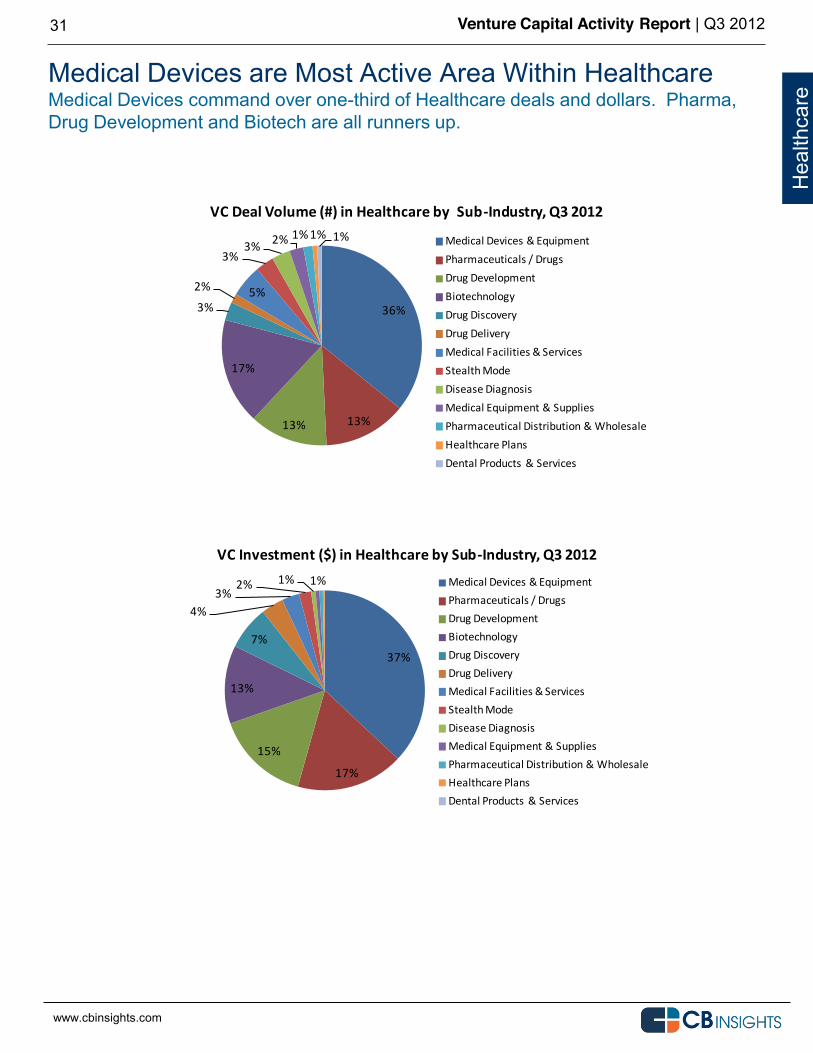
Medical Devices are Most Active Area Within Healthcare Medical Devices command over one-third of Healthcare deals and dollars. Pharma, Drug Development and Biotech are all runners up.
Hea
lthca
re
36%
13%13%
17%
3%
2% 5%
3%3% 2% 1%1% 1%
VC Deal Volume (#) in Healthcare by Sub-‐Industry, Q3 2012
Medical Devices & EquipmentPharmaceuticals / DrugsDrug DevelopmentBiotechnologyDrug DiscoveryDrug DeliveryMedical Facilities & ServicesStealth ModeDisease DiagnosisMedical Equipment & SuppliesPharmaceutical Distribution & WholesaleHealthcare PlansDental Products & Services
www.cbinsights.com
37%
17%
15%
13%
7%
4%3%
2% 1% 1%
VC Investment ($) in Healthcare by Sub-‐Industry, Q3 2012
Medical Devices & EquipmentPharmaceuticals / DrugsDrug DevelopmentBiotechnologyDrug DiscoveryDrug DeliveryMedical Facilities & ServicesStealth ModeDisease DiagnosisMedical Equipment & SuppliesPharmaceutical Distribution & WholesaleHealthcare PlansDental Products & Services
www.cbinsights.com
Venture Capital Activity Report | Q3 2012
www.cbinsights.com
32
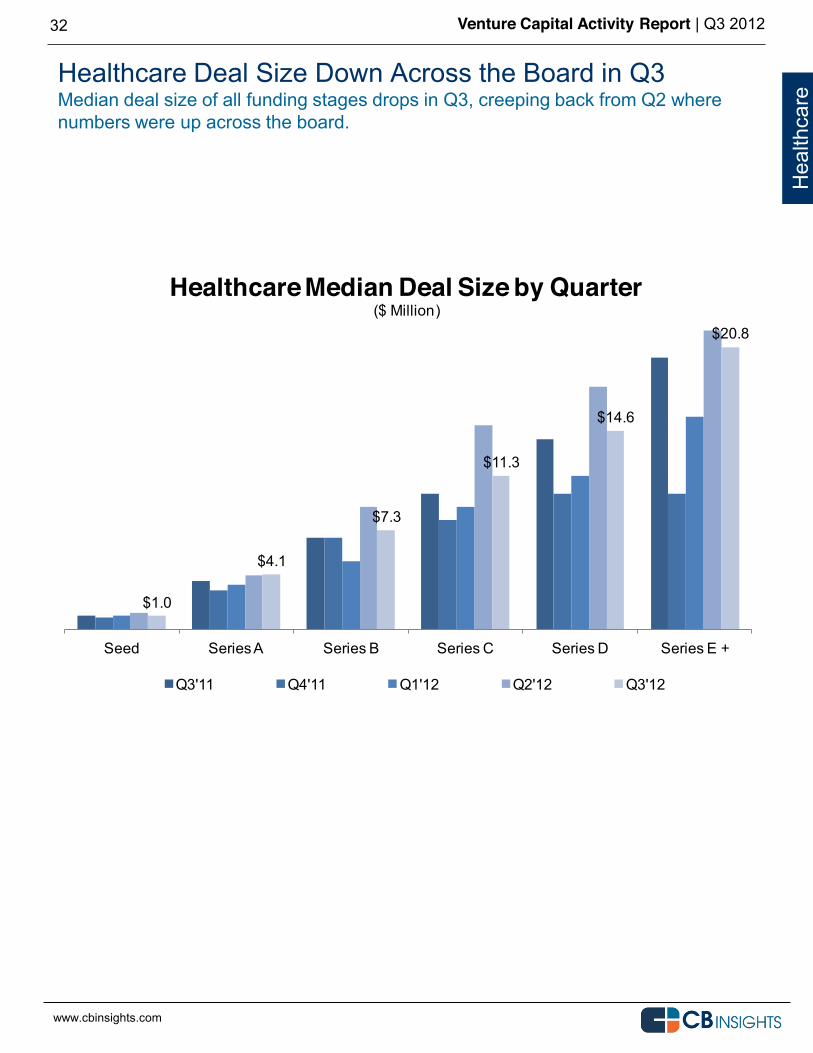
Healthcare Deal Size Down Across the Board in Q3 Median deal size of all funding stages drops in Q3, creeping back from Q2 where numbers were up across the board.
Hea
lthca
re
$1.0
$4.1
$7.3
$11.3
$14.6
$20.8
Seed Series A Series B Series C Series D Series E +
Healthcare Median Deal Size by Quarter($ Million)
Q3'11 Q4'11 Q1'12 Q2'12 Q3'12
www.cbinsights.com
Venture Capital Activity Report | Q3 2012
www.cbinsights.com
GREEN & CLEAN TECH Q3 2012 Venture Capital
33
Venture Capital Activity Report | Q3 2012
www.cbinsights.com
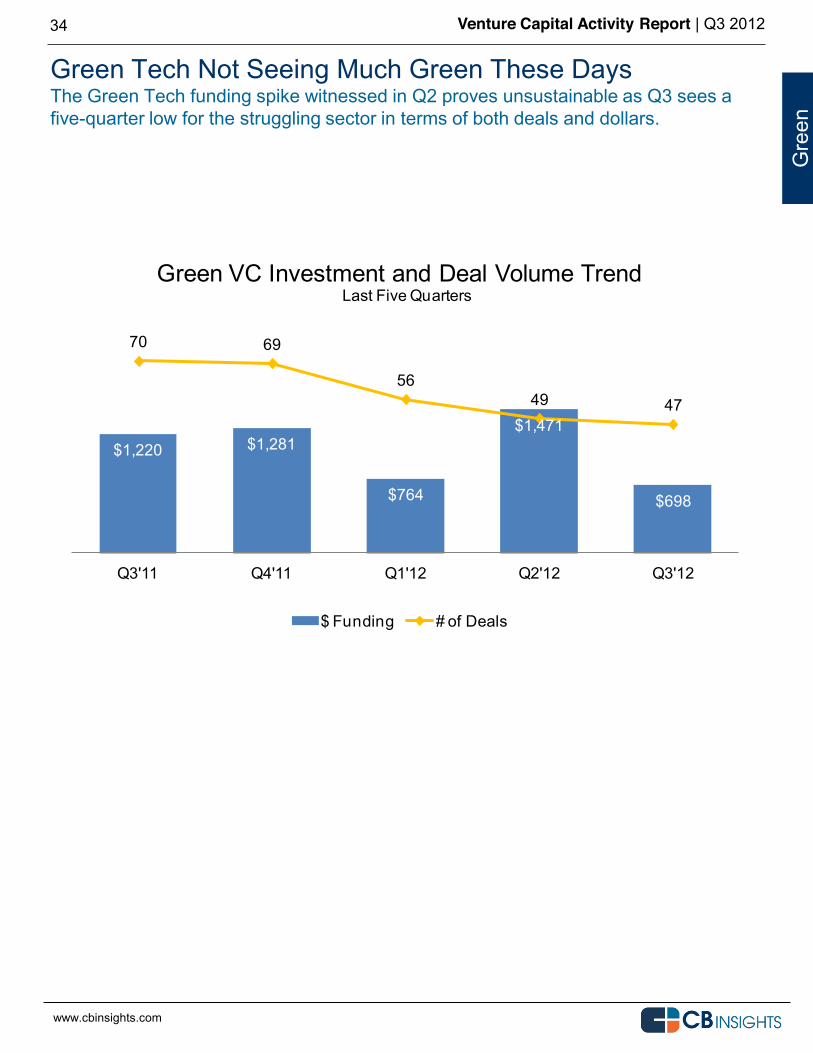
Green Tech Not Seeing Much Green These Days The Green Tech funding spike witnessed in Q2 proves unsustainable as Q3 sees a five-quarter low for the struggling sector in terms of both deals and dollars.
34
Gre
en
$1,220 $1,281
$764
$1,471
$698
70 69
5649 47
Q3'11 Q4'11 Q1'12 Q2'12 Q3'12
Green VC Investment and Deal Volume Trend
$ Funding # of Deals
www.cbinsights.com
Last Five Quarters
Venture Capital Activity Report | Q3 2012
www.cbinsights.com
35
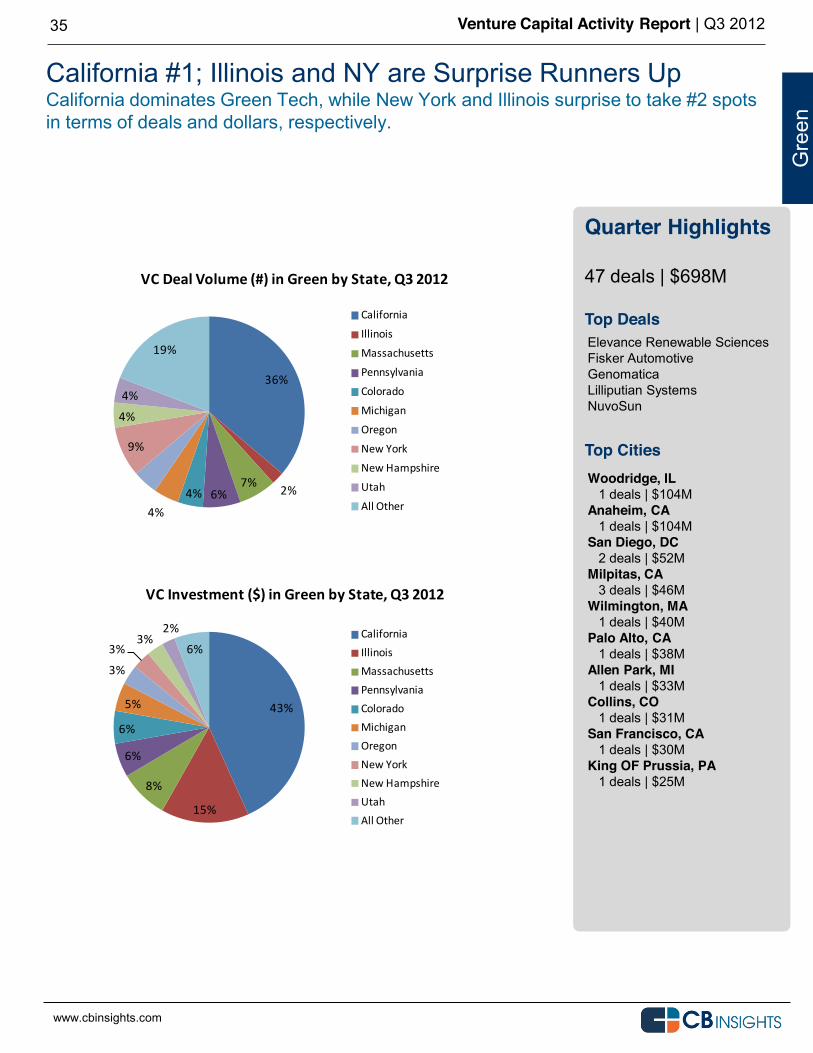
California #1; Illinois and NY are Surprise Runners Up California dominates Green Tech, while New York and Illinois surprise to take #2 spots in terms of deals and dollars, respectively.
Quarter Highlights 47 deals | $698M Top Deals
Top Cities
Gre
en
Woodridge, IL 1 deals | $104M Anaheim, CA 1 deals | $104M San Diego, DC 2 deals | $52M Milpitas, CA 3 deals | $46M Wilmington, MA 1 deals | $40M Palo Alto, CA 1 deals | $38M Allen Park, MI 1 deals | $33M Collins, CO 1 deals | $31M San Francisco, CA 1 deals | $30M King OF Prussia, PA 1 deals | $25M
Elevance Renewable Sciences Fisker Automotive Genomatica Lilliputian Systems NuvoSun
36%
2%7%6%4%
4%
9%
4%
4%
19%
VC Deal Volume (#) in Green by State, Q3 2012
California
Illinois
Massachusetts
Pennsylvania
Colorado
Michigan
Oregon
New York
New Hampshire
Utah
All Other
www.cbinsights.com
43%
15%
8%
6%
6%
5%
3%
3%3%
2%
6%
VC Investment ($) in Green by State, Q3 2012
CaliforniaIllinoisMassachusettsPennsylvaniaColoradoMichiganOregonNew YorkNew HampshireUtahAll Other
www.cbinsights.com
Venture Capital Activity Report | Q3 2012
www.cbinsights.com
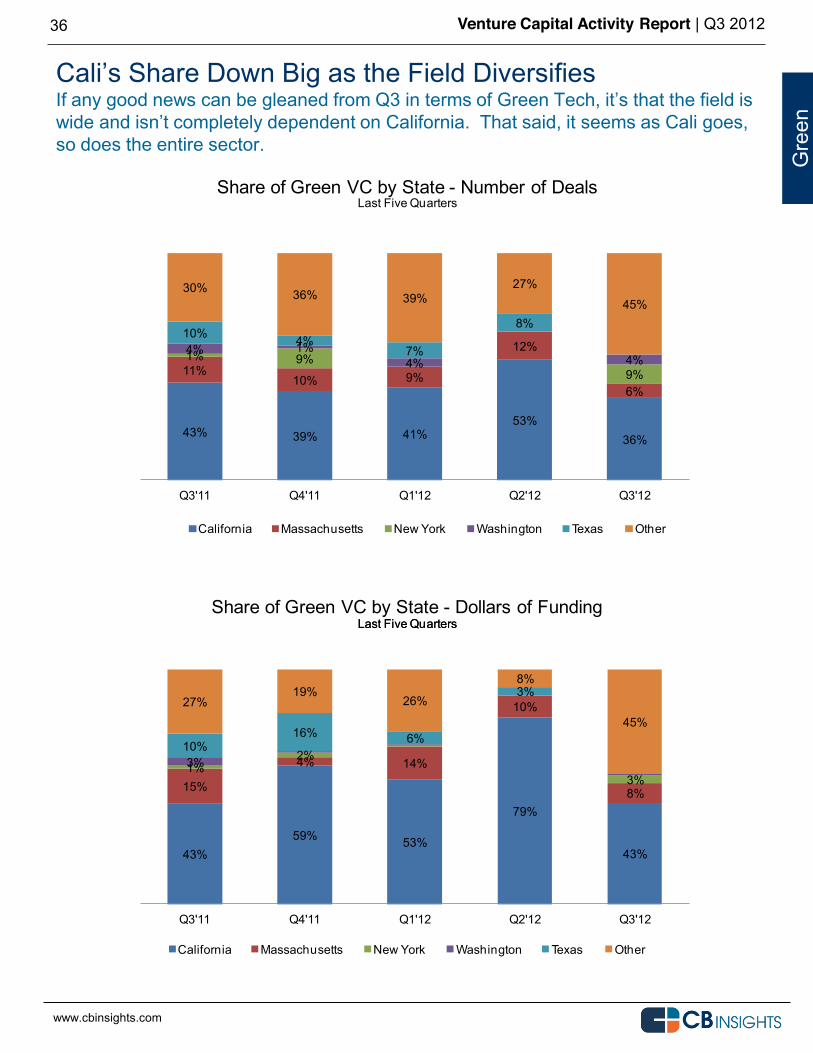
36
so does the entire sector.
Gre
en
43% 39% 41%53%
36%
11%10% 9%
12%
6%
1% 9%9%
4% 1%4% 4%
10% 4%7%
8%
30% 36% 39%27%
45%
Q3'11 Q4'11 Q1'12 Q2'12 Q3'12
Share of Green VC by State - Number of Deals
California Massachusetts New York Washington Texas Other
www.cbinsights.com
Last Five Quarters
43%59% 53%
79%
43%
15%
4% 14%
10%
8%
1%2%
3%3%
10%16% 6%
3%27%
19%26%
8%
45%
Q3'11 Q4'11 Q1'12 Q2'12 Q3'12
Share of Green VC by State - Dollars of Funding
California Massachusetts New York Washington Texas Other
www.cbinsights.com
Last Five Quarters
www.cbinsights.com
Last Five Quarters
Venture Capital Activity Report | Q3 2012
www.cbinsights.com
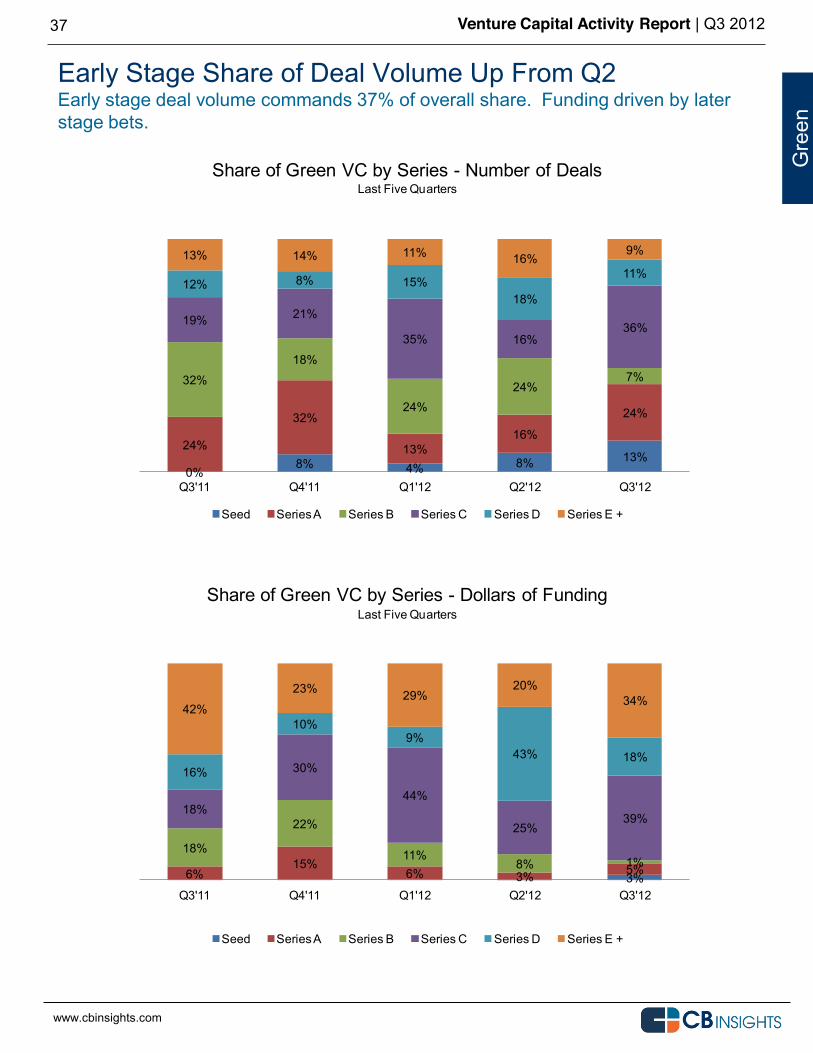
37
Early Stage Share of Deal Volume Up From Q2 Early stage deal volume commands 37% of overall share. Funding driven by later stage bets.
Gre
en
0%8% 4% 8% 13%
24%
32%
13%16%
24%
32%
18%
24%24%
7%
19% 21%
35% 16%36%
12% 8% 15%18%
11%13% 14% 11% 16%
9%
Q3'11 Q4'11 Q1'12 Q2'12 Q3'12
Share of Green VC by Series - Number of Deals
Seed Series A Series B Series C Series D Series E +
www.cbinsights.com
Last Five Quarters
3%6%15%
6% 3% 5%
18%
22%
11%8% 1%
18%
30%
44%
25%39%
16%
10%9%
43% 18%
42%
23% 29%20%
34%
Q3'11 Q4'11 Q1'12 Q2'12 Q3'12
Share of Green VC by Series - Dollars of Funding
Seed Series A Series B Series C Series D Series E +
www.cbinsights.com
Last Five Quarters
Venture Capital Activity Report | Q3 2012
www.cbinsights.com
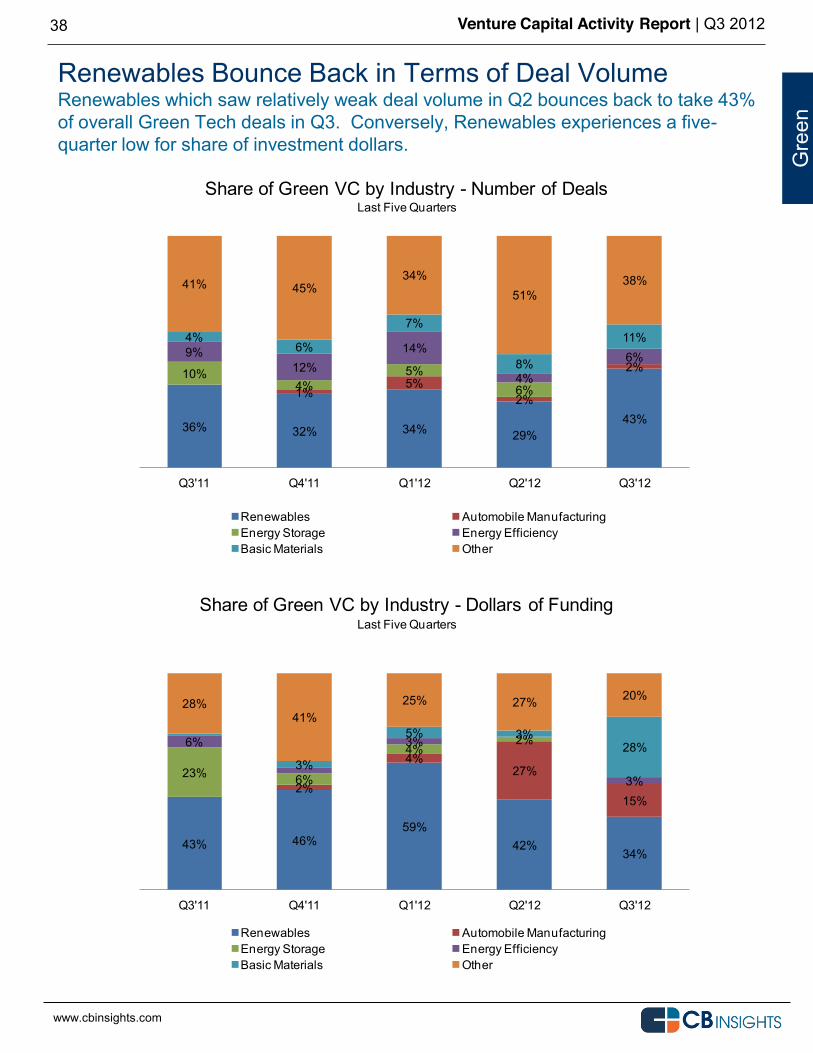
38
Renewables Bounce Back in Terms of Deal Volume Renewables which saw relatively weak deal volume in Q2 bounces back to take 43% of overall Green Tech deals in Q3. Conversely, Renewables experiences a five-quarter low for share of investment dollars.
Gre
en
43% 46%59%
42%34%
2%
4%27%
15%
23% 6%
4%2%6% 3%
3%3%
5% 3%28%
28%41%
25% 27% 20%
Q3'11 Q4'11 Q1'12 Q2'12 Q3'12
Share of Green VC by Industry - Dollars of Funding
Renewables Automobile ManufacturingEnergy Storage Energy EfficiencyBasic Materials Other
www.cbinsights.com
Last Five Quarters
36% 32% 34% 29%43%
1%5%
2%
2%10%4%
5%6%
9%12%
14%
4%
6%4%
6%
7%
8%
11%
41% 45%34%
51%38%
Q3'11 Q4'11 Q1'12 Q2'12 Q3'12
Share of Green VC by Industry - Number of Deals
Renewables Automobile ManufacturingEnergy Storage Energy EfficiencyBasic Materials Other
www.cbinsights.com
Last Five Quarters
Venture Capital Activity Report | Q3 2012
www.cbinsights.com
39
Gre
en
$3.0 $3.0 $3.0
$15.0
$33.0
$59.5
$8.8
Seed Series A Series B Series C Series D Series E + Overall
Green Median Deal Size by Quarter($ Million)
Q3'11 Q4'11 Q1'12 Q2'12 Q3'12
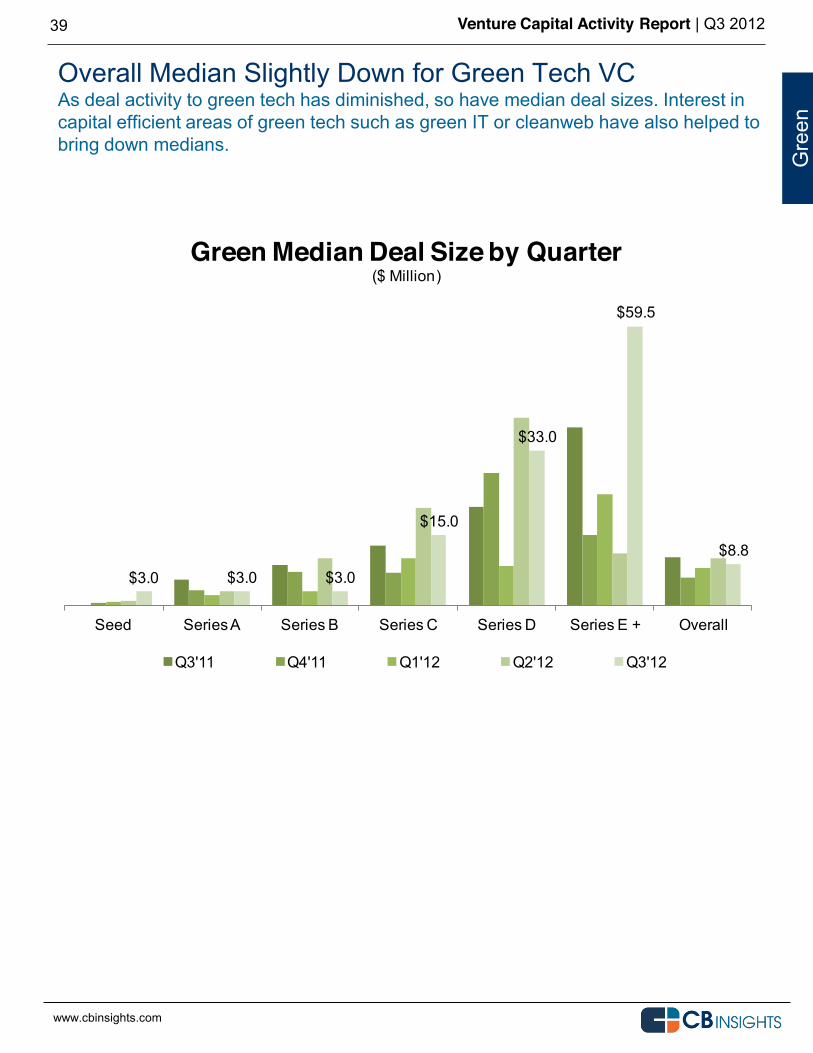
www.cbinsights.com
Overall Median Slightly Down for Green Tech VC As deal activity to green tech has diminished, so have median deal sizes. Interest in capital efficient areas of green tech such as green IT or cleanweb have also helped to bring down medians.
Venture Capital Activity Report | Q3 2012
www.cbinsights.com
CALIFORNIA Q3 2012 Venture Capital
40

Venture Capital Activity Report | Q3 2012
www.cbinsights.com
41
What Smart Investors, Bankers and
With CB Insights you can access deep private company info that was once exclusively available behind prohibitively expensive paywalls.
Coverage Universe
Venture Capital 1999 to present Angel Investment Private Equity Federal SBIR Grants 3 years State Grant Programs Incubators Over 300 Middle Market Private Companies
Sector Coverage
Green/clean tech Internet Mobile & Telecom Software Energy & Utilities Computer Hardware & Services Healthcare Industrial Automotive & Transportation Business Products & Services Consumer Products & Services Electronics Environmental Services & Equipment Financial Services Food & Beverages Leisure Media Metals & Mining Retail Risk & Security
CB Insights is accessible for free by visiting http://www.cbinsights.com
82,000+ Private Company Profiles.
Company & Investor Updates via Email. Add companies and investors of interest to your CBI Watchlist and get notified of changes and updates automatically.
Over 82,000 high value private company profiles across industries and sectors. Medical devices to mobile. Industrial to internet.
From Angel to Private Equity. Angel investment to venture capital to private equity to government funding to under the radar mid-market private companies.
Management & Board Information Find out about the people behind the companies including management and board of directors profiles.
Analytics & Reporting Downloadable reports and analytics which allow you to manipulate data when and how you want to.
Venture Capital Activity Report | Q3 2012
www.cbinsights.com
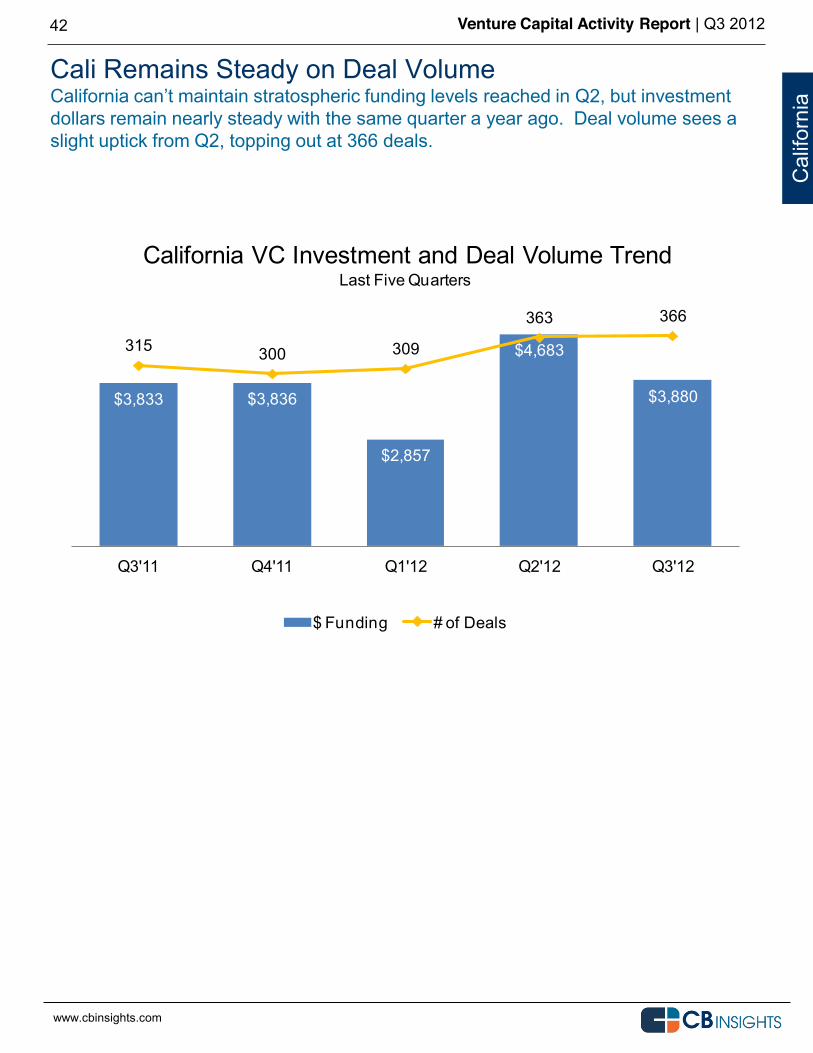
Cali Remains Steady on Deal Volume
dollars remain nearly steady with the same quarter a year ago. Deal volume sees a slight uptick from Q2, topping out at 366 deals.
42
Cal
iforn
ia
$3,833 $3,836
$2,857
$4,683
$3,880
315 300 309
363 366
Q3'11 Q4'11 Q1'12 Q2'12 Q3'12
California VC Investment and Deal Volume Trend
$ Funding # of Deals
www.cbinsights.com
Last Five Quarters
Venture Capital Activity Report | Q3 2012
www.cbinsights.com
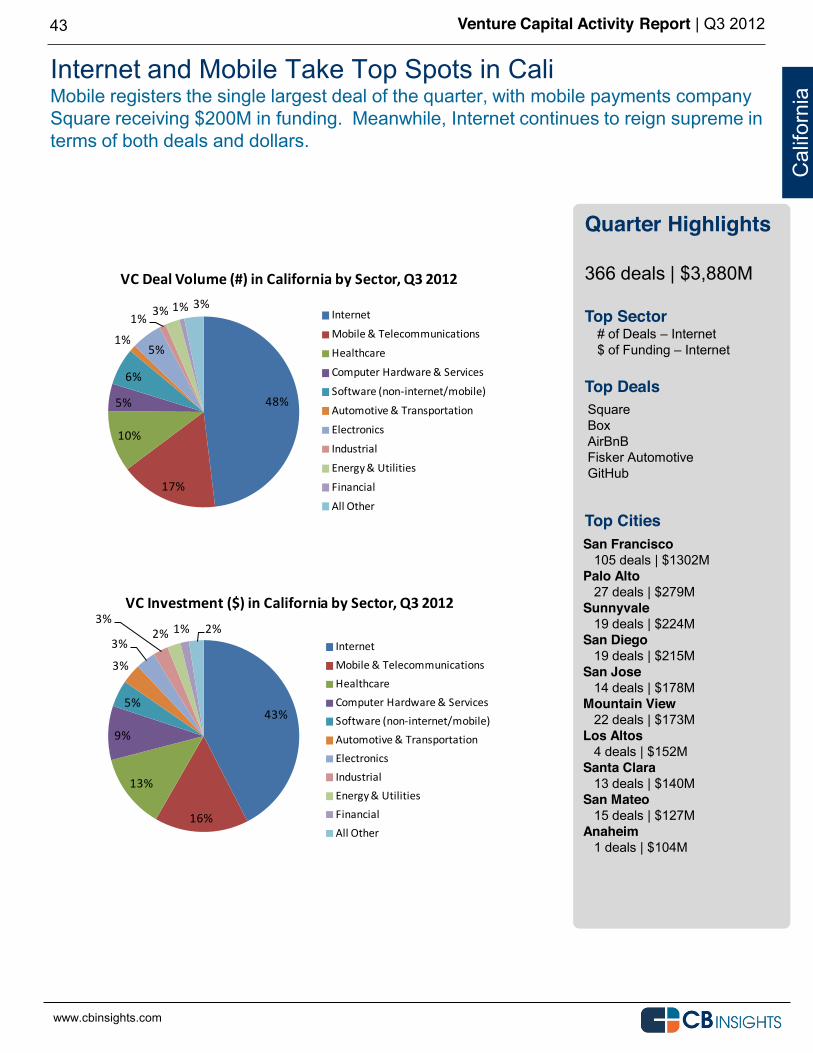
Internet and Mobile Take Top Spots in Cali Mobile registers the single largest deal of the quarter, with mobile payments company Square receiving $200M in funding. Meanwhile, Internet continues to reign supreme in terms of both deals and dollars.
43
Quarter Highlights 366 deals | $3,880M Top Sector
# of Deals Internet $ of Funding Internet
Top Deals Top Cities
San Francisco 105 deals | $1302M Palo Alto 27 deals | $279M Sunnyvale 19 deals | $224M San Diego 19 deals | $215M San Jose 14 deals | $178M Mountain View 22 deals | $173M Los Altos 4 deals | $152M Santa Clara 13 deals | $140M San Mateo 15 deals | $127M Anaheim 1 deals | $104M
Cal
iforn
ia
Square Box AirBnB Fisker Automotive GitHub
48%
17%
10%
5%
6%
1%5%
1% 3% 1% 3%
VC Deal Volume (#) in California by Sector, Q3 2012
Internet
Mobile & Telecommunications
Healthcare
Computer Hardware & Services
Software (non-‐internet/mobile)
Automotive & Transportation
Electronics
Industrial
Energy & Utilities
Financial
All Other
www.cbinsights.com
43%
16%
13%
9%
5%
3%
3%
3%2% 1% 2%
VC Investment ($) in California by Sector, Q3 2012
InternetMobile & TelecommunicationsHealthcareComputer Hardware & ServicesSoftware (non-‐internet/mobile)Automotive & TransportationElectronicsIndustrialEnergy & UtilitiesFinancialAll Other
www.cbinsights.com
Venture Capital Activity Report | Q3 2012
www.cbinsights.com
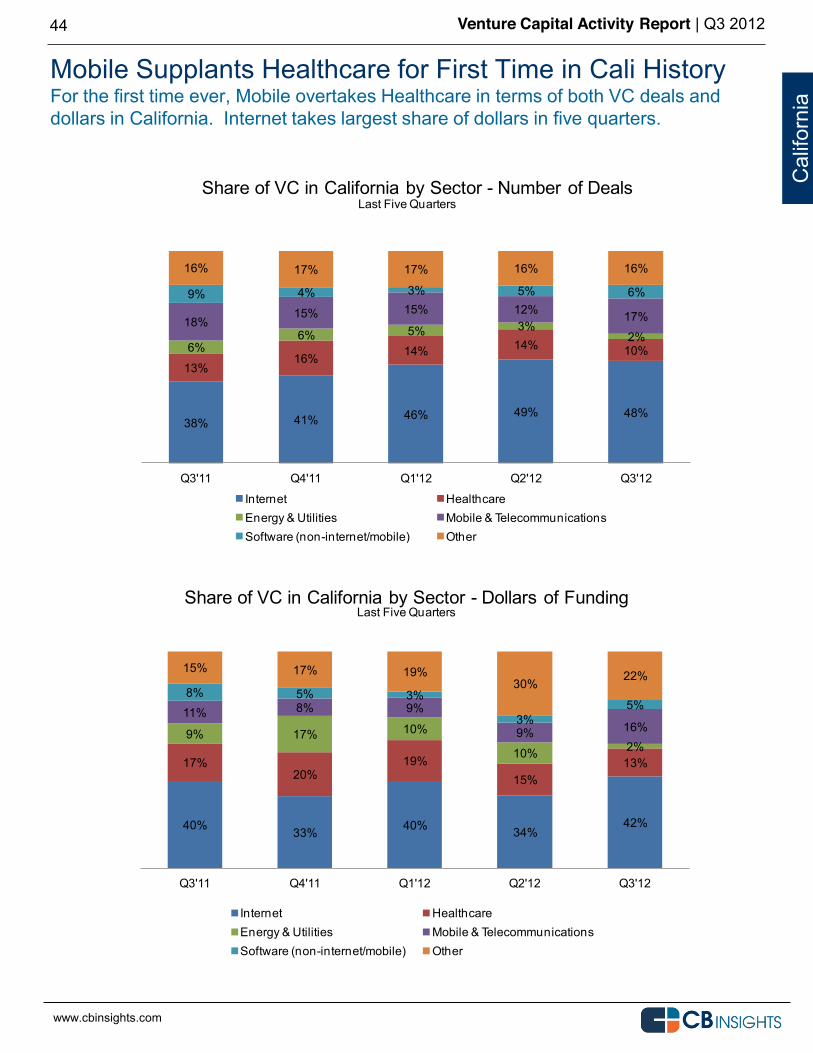
Mobile Supplants Healthcare for First Time in Cali History For the first time ever, Mobile overtakes Healthcare in terms of both VC deals and dollars in California. Internet takes largest share of dollars in five quarters.
44
Cal
iforn
ia
38% 41% 46% 49% 48%
13%16% 14% 14% 10%6%6% 5% 3%
2%18%
15% 15% 12% 17%
9% 4% 3% 5% 6%
16% 17% 17% 16% 16%
Q3'11 Q4'11 Q1'12 Q2'12 Q3'12
Share of VC in California by Sector - Number of Deals
Internet HealthcareEnergy & Utilities Mobile & TelecommunicationsSoftware (non-internet/mobile) Other
www.cbinsights.com
Last Five Quarters
40% 33% 40% 34%42%
17%20%
19%15%
13%
9% 17% 10%
10% 2%
11% 8% 9%
9% 16%
8% 5% 3%
3%5%
15% 17% 19%30% 22%
Q3'11 Q4'11 Q1'12 Q2'12 Q3'12
Share of VC in California by Sector - Dollars of Funding
Internet HealthcareEnergy & Utilities Mobile & TelecommunicationsSoftware (non-internet/mobile) Other
www.cbinsights.com
Last Five Quarters
Venture Capital Activity Report | Q3 2012
www.cbinsights.com
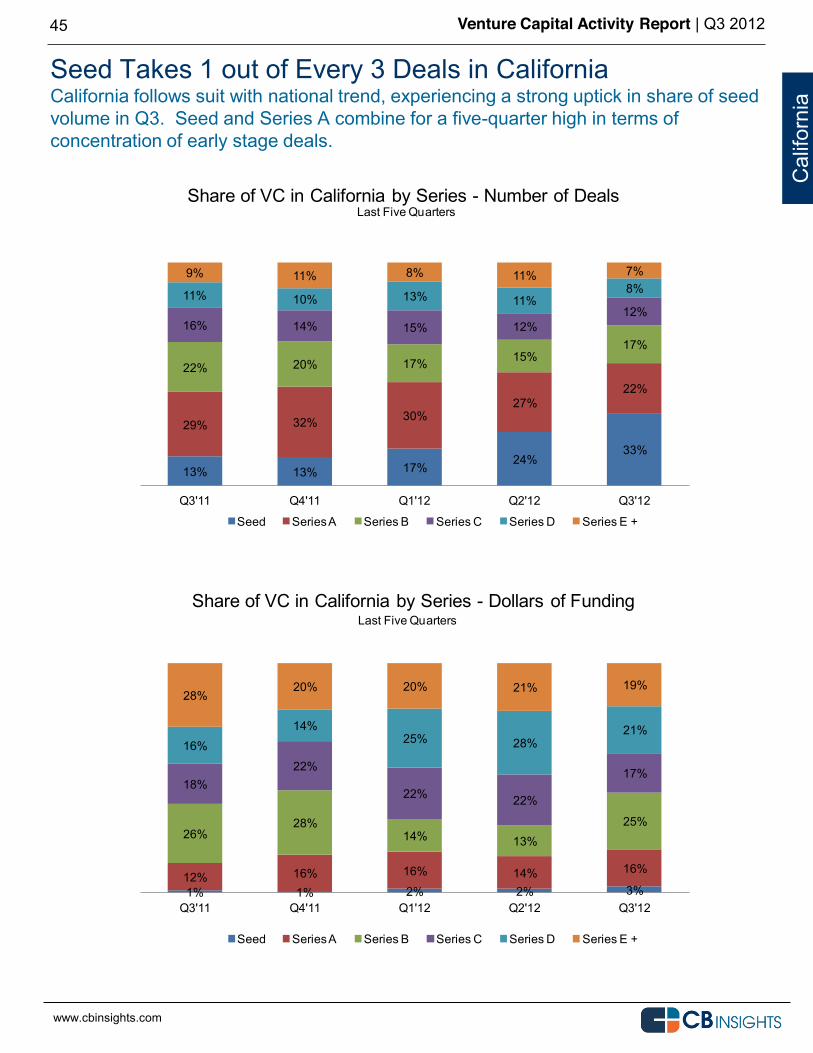
Seed Takes 1 out of Every 3 Deals in California California follows suit with national trend, experiencing a strong uptick in share of seed volume in Q3. Seed and Series A combine for a five-quarter high in terms of concentration of early stage deals.
45
Cal
iforn
ia
13% 13% 17%24%
33%
29% 32% 30%27%
22%
22% 20% 17% 15%17%
16% 14% 15% 12%12%
11% 10% 13% 11%8%
9% 11% 8% 11% 7%
Q3'11 Q4'11 Q1'12 Q2'12 Q3'12
Share of VC in California by Series - Number of Deals
Seed Series A Series B Series C Series D Series E +
www.cbinsights.com
Last Five Quarters
1% 1% 2% 2% 3%12% 16% 16% 14% 16%
26%28%
14% 13%25%
18%22%
22% 22%
17%
16%14%
25% 28%21%
28%20% 20% 21% 19%
Q3'11 Q4'11 Q1'12 Q2'12 Q3'12
Share of VC in California by Series - Dollars of Funding
Seed Series A Series B Series C Series D Series E +
www.cbinsights.com
Last Five Quarters
Venture Capital Activity Report | Q3 2012
www.cbinsights.com
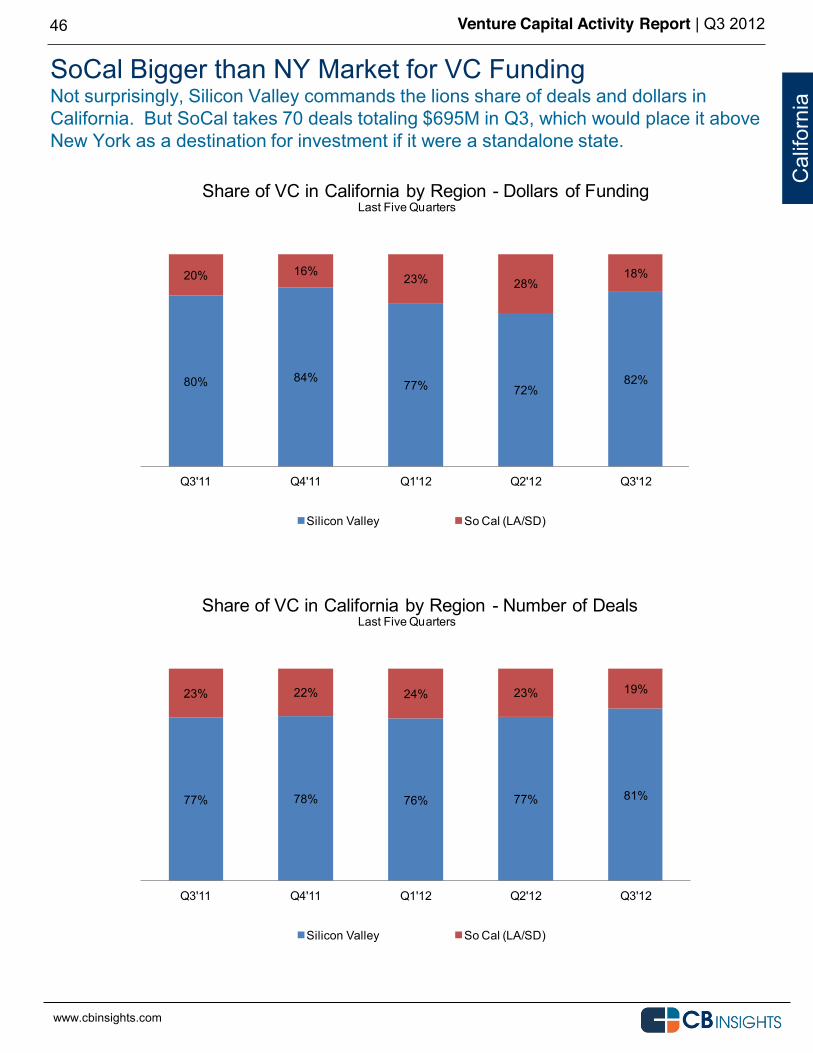
SoCal Bigger than NY Market for VC Funding Not surprisingly, Silicon Valley commands the lions share of deals and dollars in California. But SoCal takes 70 deals totaling $695M in Q3, which would place it above New York as a destination for investment if it were a standalone state.
46
Cal
iforn
ia
80% 84% 77% 72%82%
20% 16% 23% 28%18%
Q3'11 Q4'11 Q1'12 Q2'12 Q3'12
Share of VC in California by Region - Dollars of Funding
Silicon Valley So Cal (LA/SD)
www.cbinsights.com
Last Five Quarters
77% 78% 76% 77% 81%
23% 22% 24% 23% 19%
Q3'11 Q4'11 Q1'12 Q2'12 Q3'12
Share of VC in California by Region - Number of Deals
Silicon Valley So Cal (LA/SD)
www.cbinsights.com
Last Five Quarters
Venture Capital Activity Report | Q3 2012
www.cbinsights.com
MASSACHUSETTS Q3 2012 Venture Capital
47
Venture Capital Activity Report | Q3 2012
www.cbinsights.com
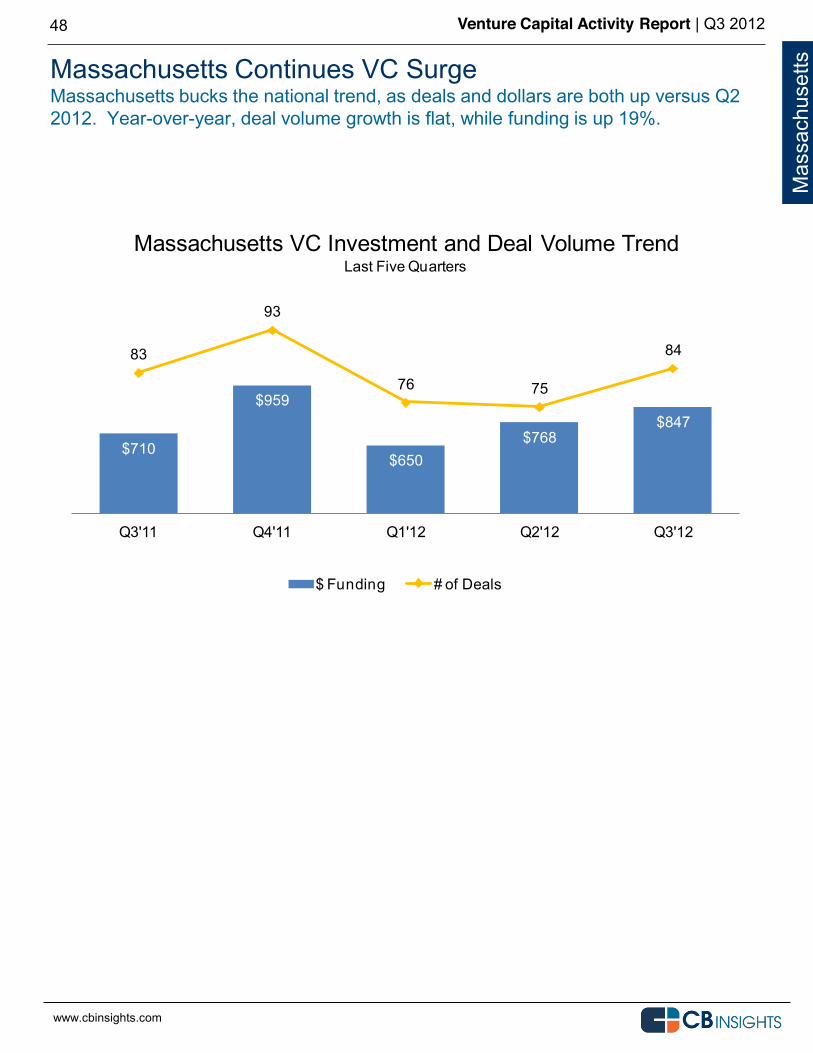
Massachusetts Continues VC Surge Massachusetts bucks the national trend, as deals and dollars are both up versus Q2 2012. Year-over-year, deal volume growth is flat, while funding is up 19%.
48
Mas
sach
uset
ts
$710
$959
$650$768
$847
83
93
76 75
84
Q3'11 Q4'11 Q1'12 Q2'12 Q3'12
Massachusetts VC Investment and Deal Volume Trend
$ Funding # of Deals
www.cbinsights.com
Last Five Quarters
Venture Capital Activity Report | Q3 2012
www.cbinsights.com
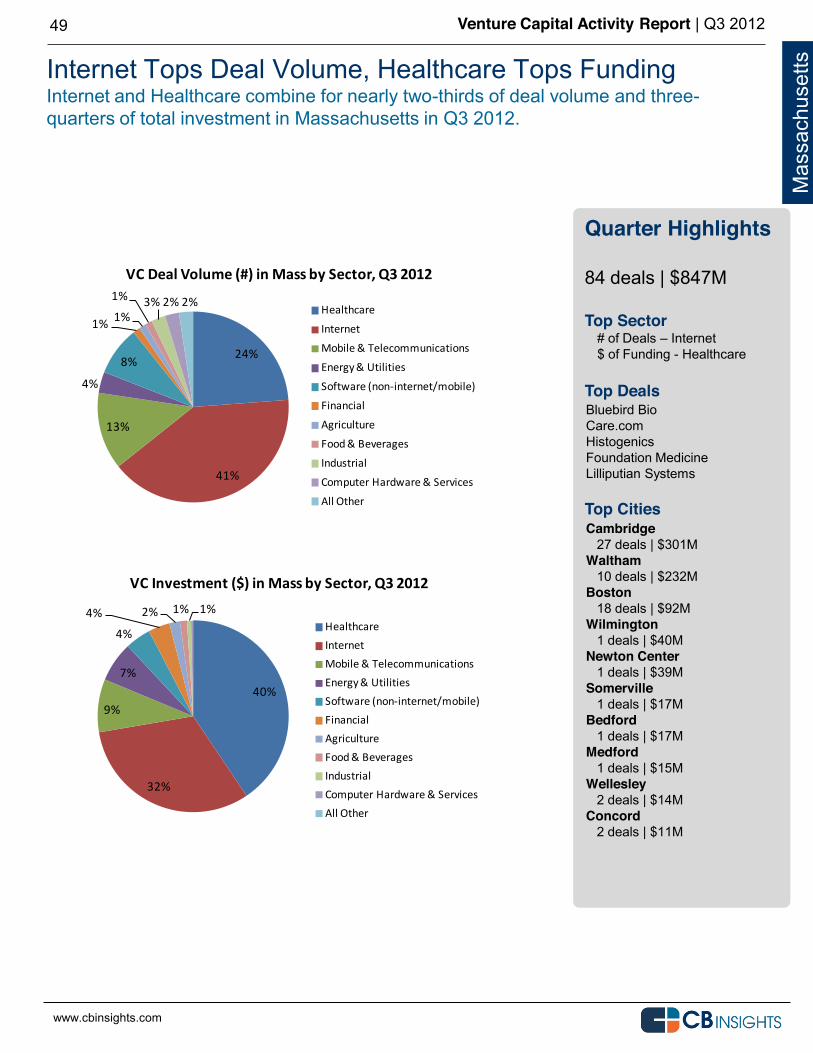
Internet Tops Deal Volume, Healthcare Tops Funding Internet and Healthcare combine for nearly two-thirds of deal volume and three-quarters of total investment in Massachusetts in Q3 2012.
49
Quarter Highlights 84 deals | $847M Top Sector
# of Deals Internet $ of Funding - Healthcare
Top Deals Top Cities
Cambridge 27 deals | $301M Waltham 10 deals | $232M Boston 18 deals | $92M Wilmington 1 deals | $40M Newton Center 1 deals | $39M Somerville 1 deals | $17M Bedford 1 deals | $17M Medford 1 deals | $15M Wellesley 2 deals | $14M Concord 2 deals | $11M
Mas
sach
uset
ts
Bluebird Bio Care.com Histogenics Foundation Medicine Lilliputian Systems
24%
41%
13%
4%
8%
1% 1%
1% 3% 2% 2%
VC Deal Volume (#) in Mass by Sector, Q3 2012
Healthcare
Internet
Mobile & Telecommunications
Energy & Utilities
Software (non-‐internet/mobile)
Financial
Agriculture
Food & Beverages
Industrial
Computer Hardware & Services
All Other
www.cbinsights.com
40%
32%
9%
7%
4%
4% 2% 1% 1%
VC Investment ($) in Mass by Sector, Q3 2012
HealthcareInternetMobile & TelecommunicationsEnergy & UtilitiesSoftware (non-‐internet/mobile)FinancialAgricultureFood & BeveragesIndustrialComputer Hardware & ServicesAll Other
www.cbinsights.com
Venture Capital Activity Report | Q3 2012
www.cbinsights.com
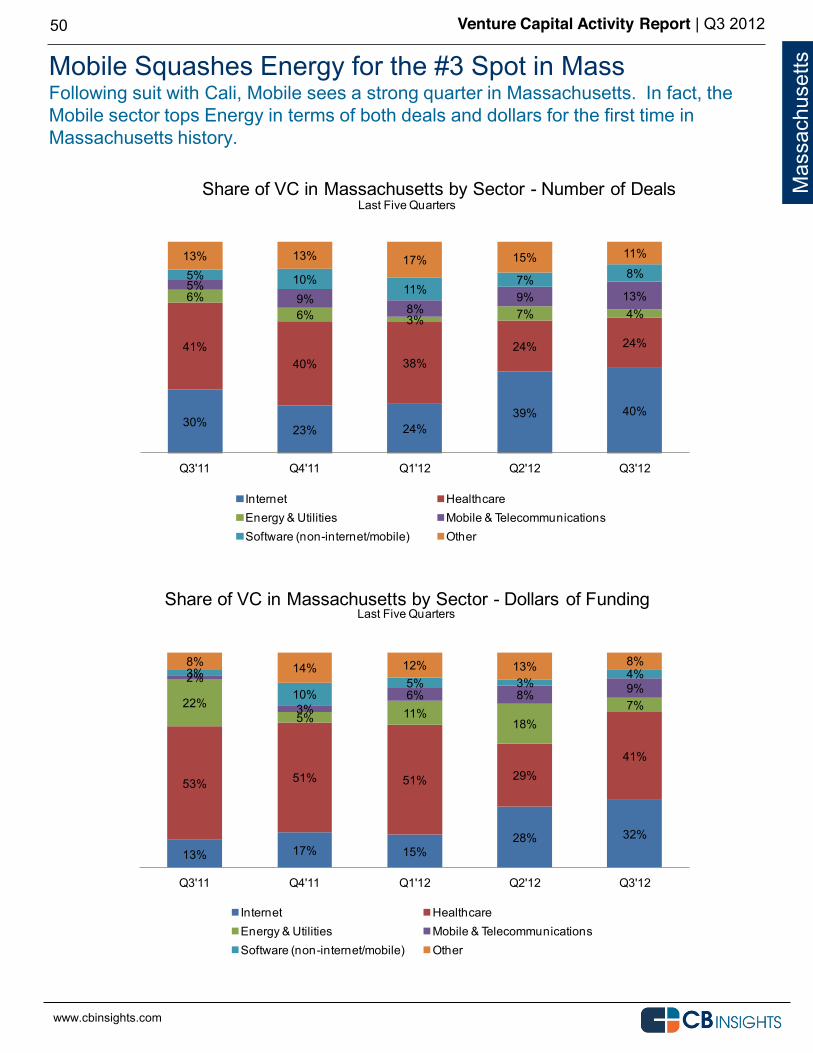
Mobile Squashes Energy for the #3 Spot in Mass Following suit with Cali, Mobile sees a strong quarter in Massachusetts. In fact, the Mobile sector tops Energy in terms of both deals and dollars for the first time in Massachusetts history.
50
Mas
sach
uset
ts
30% 23% 24%39% 40%
41%40% 38%
24% 24%
6%6% 3% 7% 4%
5%9%
8%9% 13%
5% 10%11%
7% 8%13% 13% 17% 15% 11%
Q3'11 Q4'11 Q1'12 Q2'12 Q3'12
Share of VC in Massachusetts by Sector - Number of Deals
Internet HealthcareEnergy & Utilities Mobile & TelecommunicationsSoftware (non-internet/mobile) Other
www.cbinsights.com
Last Five Quarters
13% 17% 15%28% 32%
53% 51% 51% 29%41%
22%5% 11%
18%7%
2%
3%6% 8% 9%
3%
10%5% 3%
4%8% 14% 12% 13% 8%
Q3'11 Q4'11 Q1'12 Q2'12 Q3'12
Share of VC in Massachusetts by Sector - Dollars of Funding
Internet HealthcareEnergy & Utilities Mobile & TelecommunicationsSoftware (non-internet/mobile) Other
www.cbinsights.com
Last Five Quarters
Venture Capital Activity Report | Q3 2012
www.cbinsights.com
51
Mas
sach
uset
ts
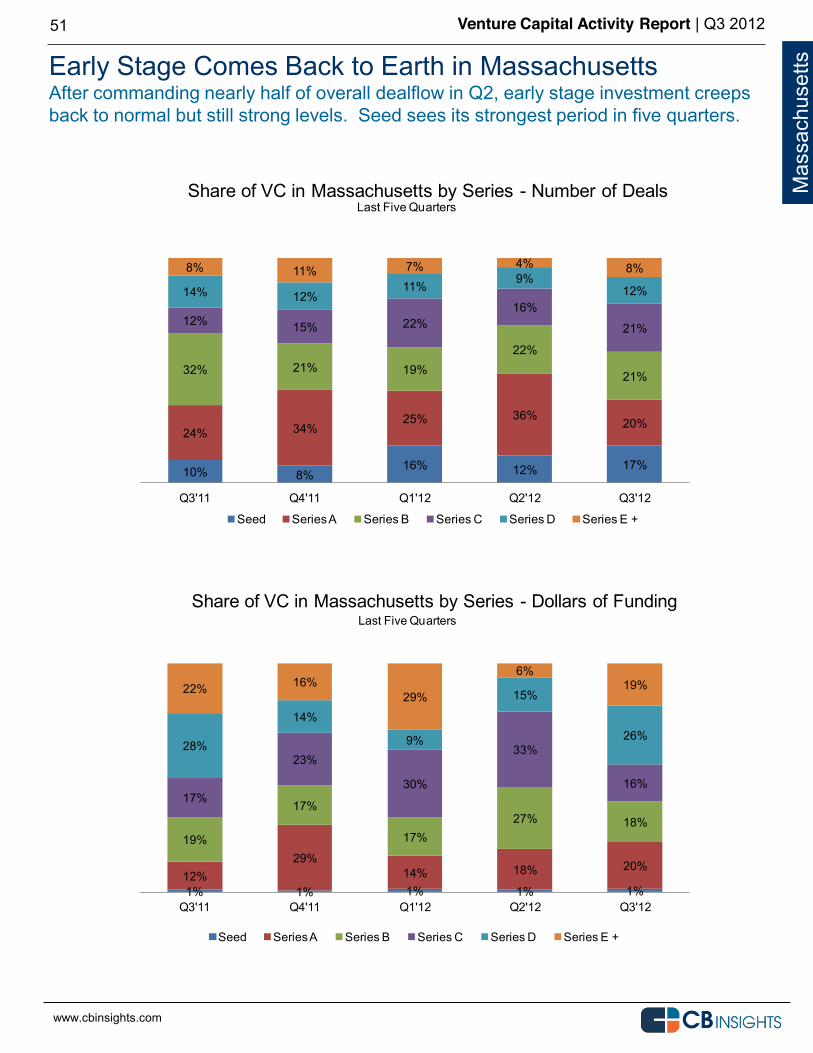
Early Stage Comes Back to Earth in Massachusetts After commanding nearly half of overall dealflow in Q2, early stage investment creeps back to normal but still strong levels. Seed sees its strongest period in five quarters.
10% 8%16% 12% 17%
24% 34%25% 36%
20%
32% 21% 19%22%
21%
12% 15% 22%16%
21%
14% 12%11% 9%
12%
8% 11% 7% 4% 8%
Q3'11 Q4'11 Q1'12 Q2'12 Q3'12
Share of VC in Massachusetts by Series - Number of Deals
Seed Series A Series B Series C Series D Series E +
www.cbinsights.com
Last Five Quarters
1% 1% 1% 1% 1%12%
29%14% 18% 20%
19%
17%
17%27% 18%
17%
23%
30%
33%
16%
28%
14%
9%
15%
26%
22% 16%29%
6%19%
Q3'11 Q4'11 Q1'12 Q2'12 Q3'12
Share of VC in Massachusetts by Series - Dollars of Funding
Seed Series A Series B Series C Series D Series E +
www.cbinsights.com
Last Five Quarters
Venture Capital Activity Report | Q3 2012
www.cbinsights.com
NEW YORK Q3 2012 Venture Capital
52
Venture Capital Activity Report | Q3 2012
www.cbinsights.com
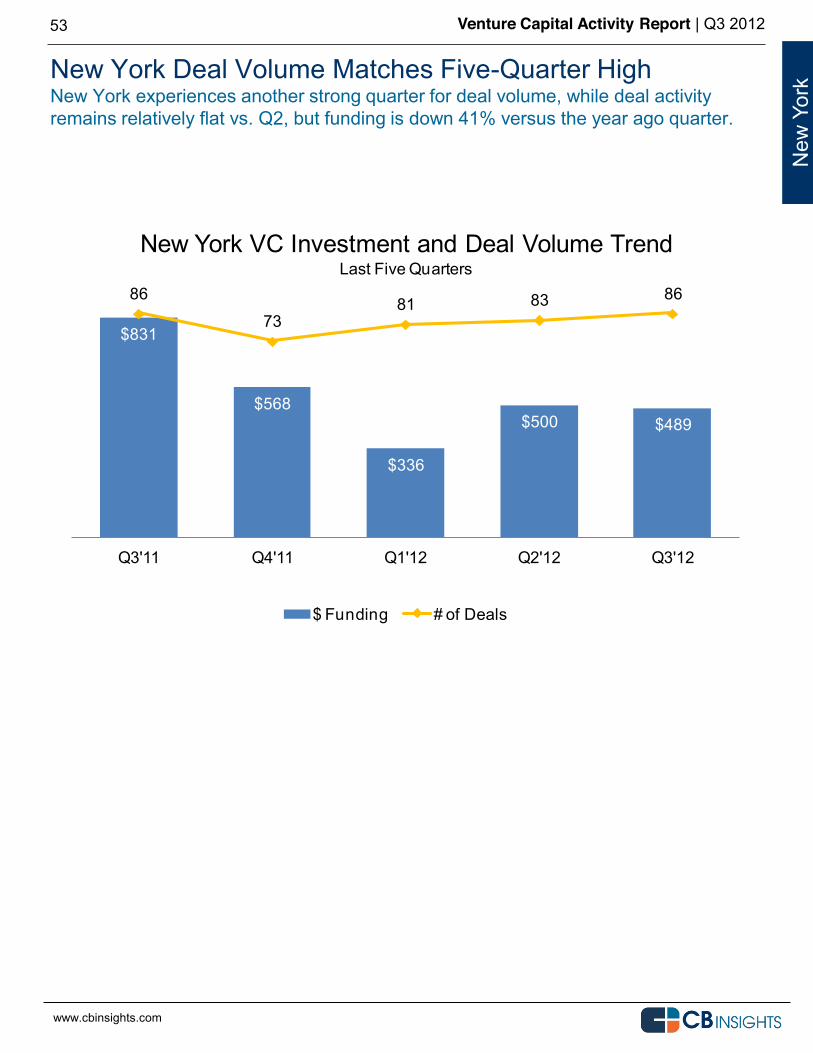
New York Deal Volume Matches Five-Quarter High New York experiences another strong quarter for deal volume, while deal activity remains relatively flat vs. Q2, but funding is down 41% versus the year ago quarter.
53
New
Yor
k
$831
$568
$336
$500 $489
86
7381 83 86
Q3'11 Q4'11 Q1'12 Q2'12 Q3'12
New York VC Investment and Deal Volume Trend
$ Funding # of Deals
www.cbinsights.com
Last Five Quarters
Venture Capital Activity Report | Q3 2012
www.cbinsights.com
54
Get Started for Free with CB Insights Basic membership on CB Insights is free. Just visit http://www.cbinsights.com. Or connect with us via any of the following.
Twitter Follow us @cbinsights
Newsletter Click here to receive our weekly dealflow newsletter.
Email [email protected]
Telephone 212-292-3148
Venture Capital Activity Report | Q3 2012
www.cbinsights.com
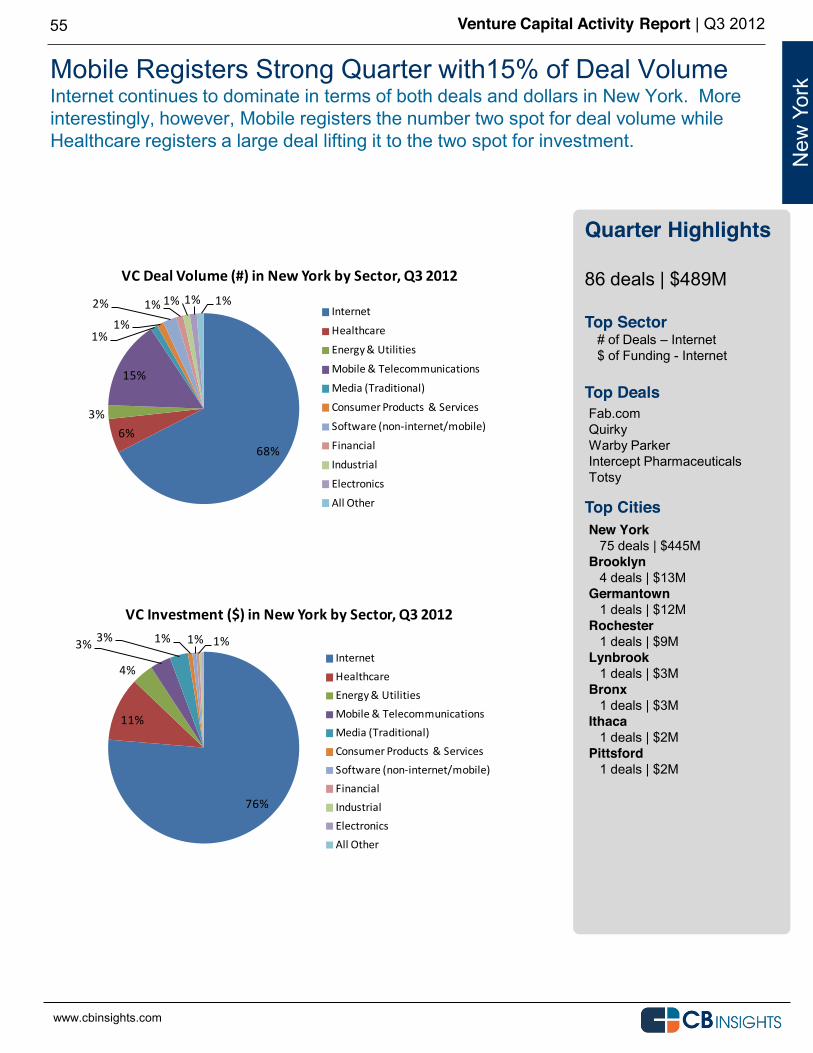
Mobile Registers Strong Quarter with15% of Deal Volume Internet continues to dominate in terms of both deals and dollars in New York. More interestingly, however, Mobile registers the number two spot for deal volume while Healthcare registers a large deal lifting it to the two spot for investment.
55
Quarter Highlights 86 deals | $489M Top Sector
# of Deals Internet $ of Funding - Internet
Top Deals Top Cities
New York 75 deals | $445M Brooklyn 4 deals | $13M Germantown 1 deals | $12M Rochester 1 deals | $9M Lynbrook 1 deals | $3M Bronx 1 deals | $3M Ithaca 1 deals | $2M Pittsford 1 deals | $2M
New
Yor
k
Fab.com Quirky Warby Parker Intercept Pharmaceuticals Totsy
76%
11%
4%
3% 3% 1% 1% 1%
VC Investment ($) in New York by Sector, Q3 2012
InternetHealthcareEnergy & UtilitiesMobile & TelecommunicationsMedia (Traditional)Consumer Products & ServicesSoftware (non-‐internet/mobile)FinancialIndustrialElectronicsAll Other
www.cbinsights.com
68%6%
3%
15%
1%1%
2% 1% 1% 1% 1%
VC Deal Volume (#) in New York by Sector, Q3 2012
Internet
Healthcare
Energy & Utilities
Mobile & Telecommunications
Media (Traditional)
Consumer Products & Services
Software (non-‐internet/mobile)
Financial
Industrial
Electronics
All Other
www.cbinsights.com
Venture Capital Activity Report | Q3 2012
www.cbinsights.com
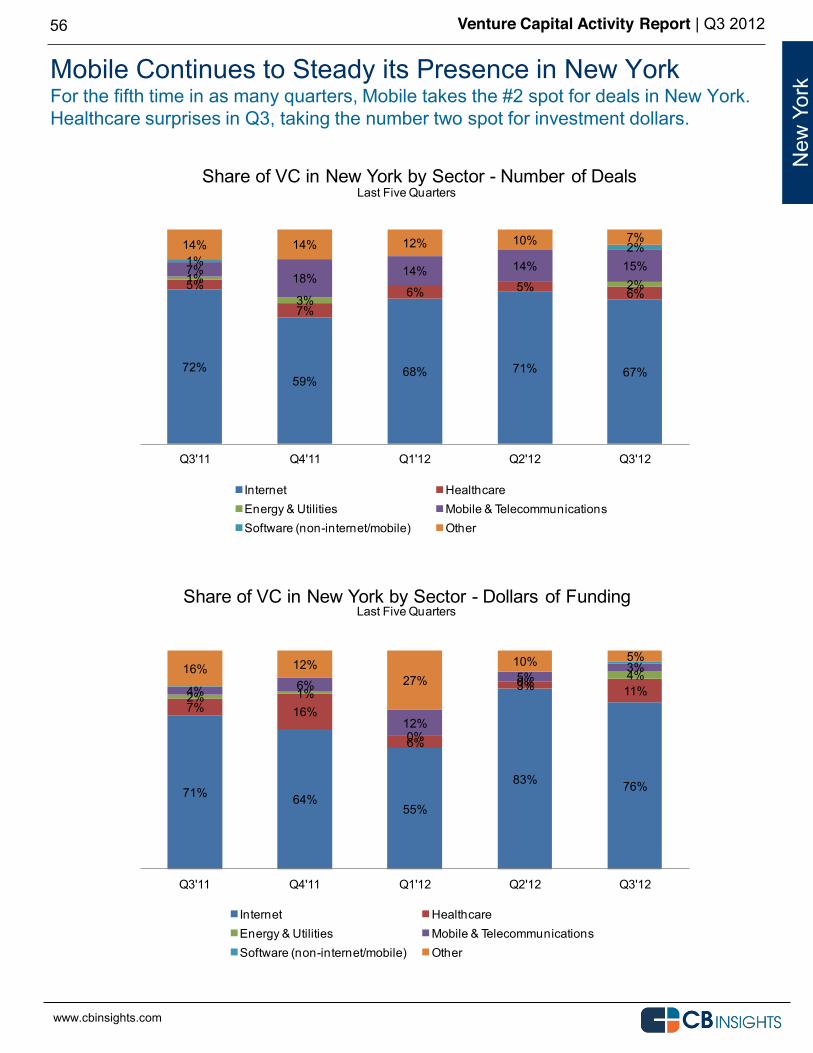
Mobile Continues to Steady its Presence in New York For the fifth time in as many quarters, Mobile takes the #2 spot for deals in New York. Healthcare surprises in Q3, taking the number two spot for investment dollars.
56
New
Yor
k
72%59%
68% 71% 67%
5%
7%6% 5% 6%
1%
3%2%
7%18% 14% 14% 15%1%
2%14% 14% 12% 10% 7%
Q3'11 Q4'11 Q1'12 Q2'12 Q3'12
Share of VC in New York by Sector - Number of Deals
Internet HealthcareEnergy & Utilities Mobile & TelecommunicationsSoftware (non-internet/mobile) Other
www.cbinsights.com
Last Five Quarters
71% 64%55%
83% 76%
7% 16%
6%
3% 11%2% 1%
0%
0% 4%4% 6%
12%
5%3%16% 12%
27%10% 5%
Q3'11 Q4'11 Q1'12 Q2'12 Q3'12
Share of VC in New York by Sector - Dollars of Funding
Internet HealthcareEnergy & Utilities Mobile & TelecommunicationsSoftware (non-internet/mobile) Other
www.cbinsights.com
Last Five Quarters
Venture Capital Activity Report | Q3 2012
www.cbinsights.com
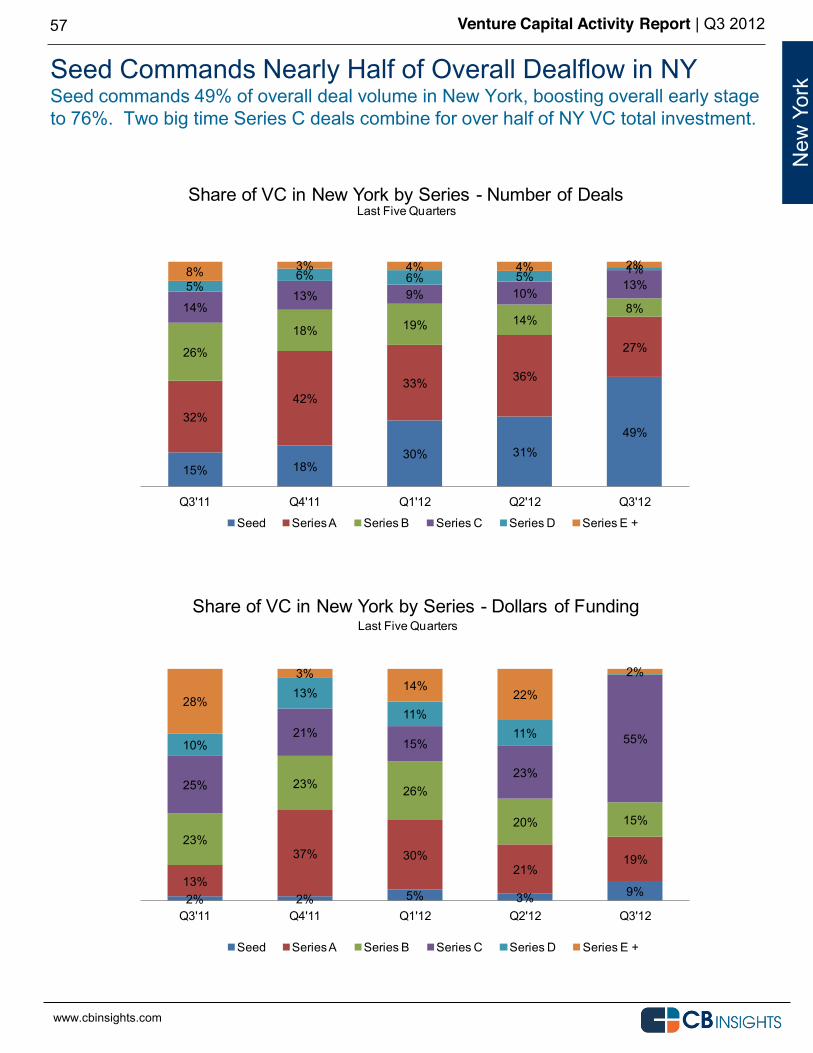
Seed Commands Nearly Half of Overall Dealflow in NY Seed commands 49% of overall deal volume in New York, boosting overall early stage to 76%. Two big time Series C deals combine for over half of NY VC total investment.
57
New
Yor
k
15% 18%30% 31%
49%32%
42%33% 36%
27%26%
18% 19% 14%8%14%
13% 9% 10%13%5%
6% 6% 5% 1%8% 3% 4% 4% 2%
Q3'11 Q4'11 Q1'12 Q2'12 Q3'12
Share of VC in New York by Series - Number of Deals
Seed Series A Series B Series C Series D Series E +
www.cbinsights.com
Last Five Quarters
2% 2% 5% 3% 9%13%
37% 30%21%
19%23%
23% 26%
20% 15%
25%
21%15%
23%
55%10%
13%
11%11%
28%
3%14%
22%
2%
Q3'11 Q4'11 Q1'12 Q2'12 Q3'12
Share of VC in New York by Series - Dollars of Funding
Seed Series A Series B Series C Series D Series E +
www.cbinsights.com
Last Five Quarters
Venture Capital Activity Report | Q3 2012
www.cbinsights.com
WASHINGTON Q3 2012 Venture Capital
58
Venture Capital Activity Report | Q3 2012
www.cbinsights.com
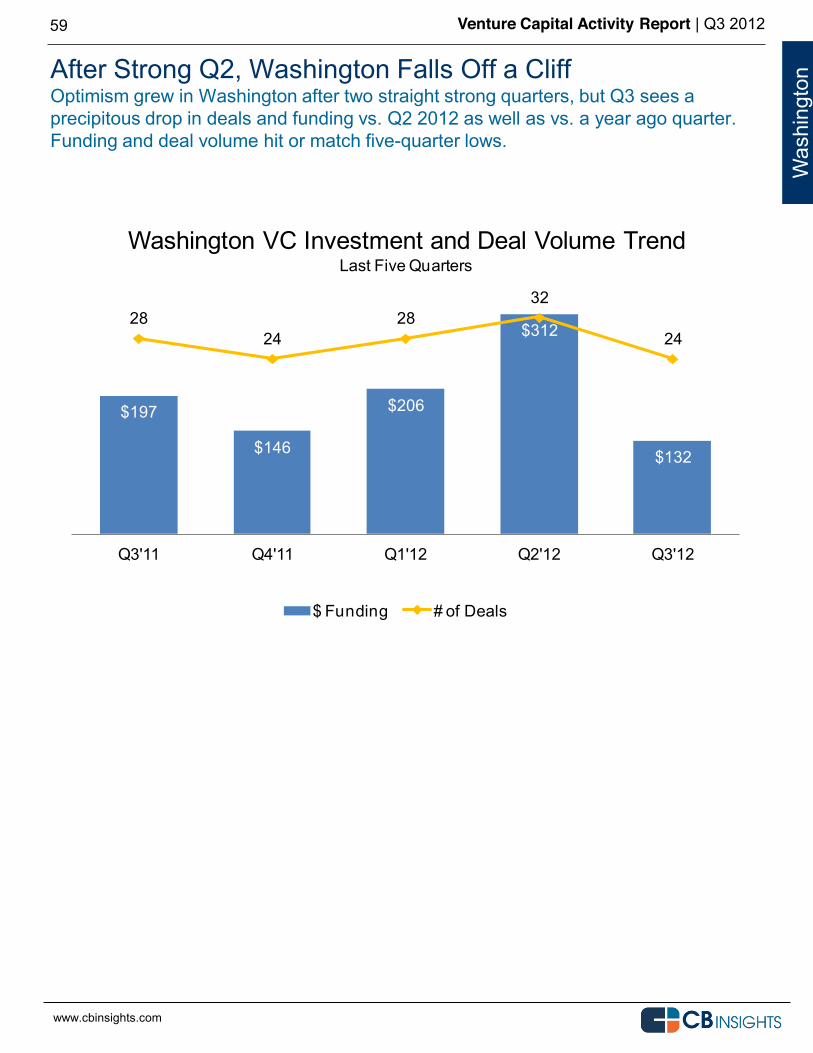
After Strong Q2, Washington Falls Off a Cliff Optimism grew in Washington after two straight strong quarters, but Q3 sees a precipitous drop in deals and funding vs. Q2 2012 as well as vs. a year ago quarter. Funding and deal volume hit or match five-quarter lows.
59
Was
hing
ton
$197
$146
$206
$312
$132
2824
2832
24
Q3'11 Q4'11 Q1'12 Q2'12 Q3'12
Washington VC Investment and Deal Volume Trend
$ Funding # of Deals
www.cbinsights.com
Last Five Quarters
Venture Capital Activity Report | Q3 2012
www.cbinsights.com
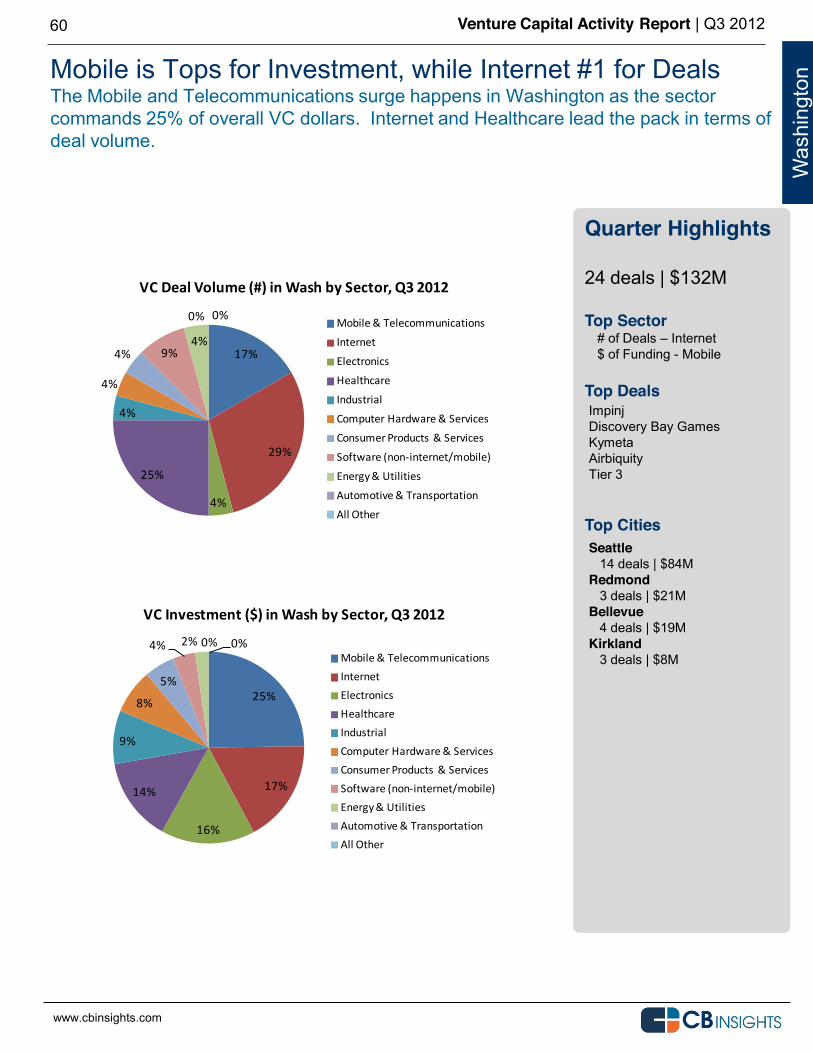
Mobile is Tops for Investment, while Internet #1 for Deals The Mobile and Telecommunications surge happens in Washington as the sector commands 25% of overall VC dollars. Internet and Healthcare lead the pack in terms of deal volume.
60
Quarter Highlights 24 deals | $132M Top Sector
# of Deals Internet $ of Funding - Mobile
Top Deals
Top Cities
Seattle 14 deals | $84M Redmond 3 deals | $21M Bellevue 4 deals | $19M Kirkland 3 deals | $8M
Was
hing
ton
Impinj Discovery Bay Games Kymeta Airbiquity Tier 3
17%
29%
4%
25%
4%
4%
4% 9%4%
0% 0%
VC Deal Volume (#) in Wash by Sector, Q3 2012
Mobile & Telecommunications
Internet
Electronics
Healthcare
Industrial
Computer Hardware & Services
Consumer Products & Services
Software (non-‐internet/mobile)
Energy & Utilities
Automotive & Transportation
All Other
www.cbinsights.com
25%
17%
16%
14%
9%
8%
5%
4% 2% 0% 0%
VC Investment ($) in Wash by Sector, Q3 2012
Mobile & TelecommunicationsInternetElectronicsHealthcareIndustrialComputer Hardware & ServicesConsumer Products & ServicesSoftware (non-‐internet/mobile)Energy & UtilitiesAutomotive & TransportationAll Other
www.cbinsights.com
Venture Capital Activity Report | Q3 2012
www.cbinsights.com
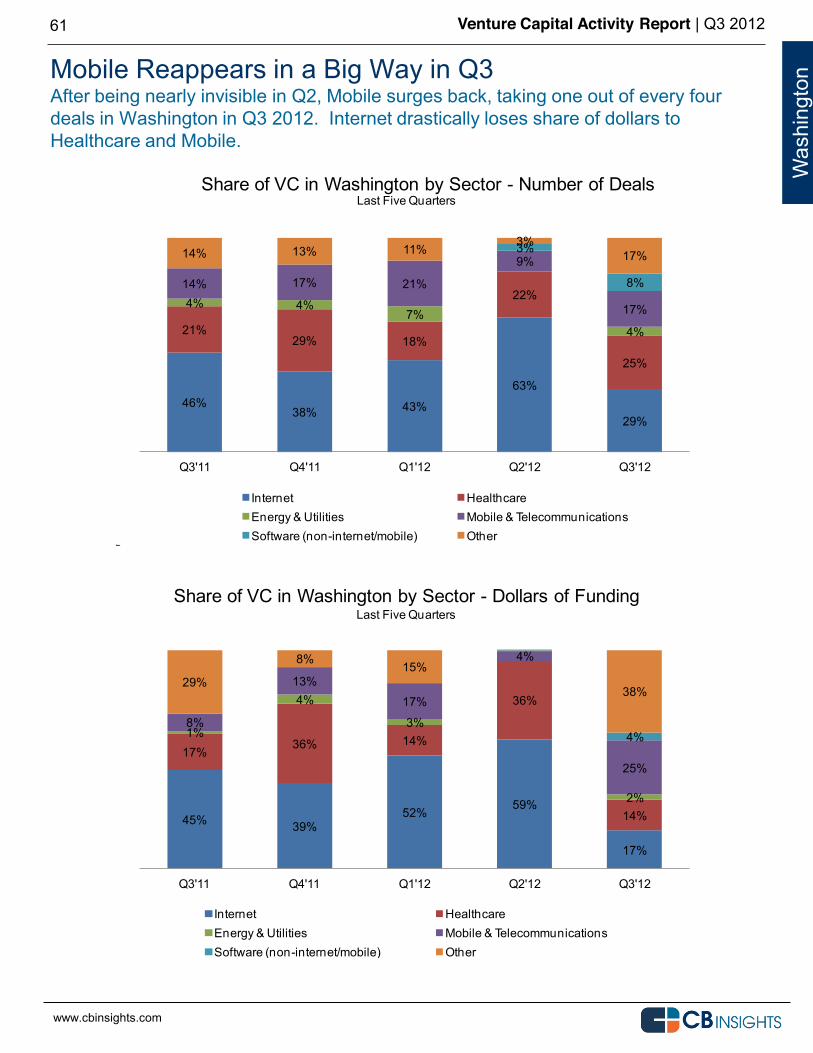
Mobile Reappears in a Big Way in Q3 After being nearly invisible in Q2, Mobile surges back, taking one out of every four deals in Washington in Q3 2012. Internet drastically loses share of dollars to Healthcare and Mobile.
61
Was
hing
ton
46%38% 43%
63%
29%
21%29% 18%
22%
25%
4% 4%7%
4%
14% 17% 21%
9%
17%
3%
8%
14% 13% 11%3%
17%
Q3'11 Q4'11 Q1'12 Q2'12 Q3'12
Share of VC in Washington by Sector - Number of Deals
Internet HealthcareEnergy & Utilities Mobile & TelecommunicationsSoftware (non-internet/mobile) Other
www.cbinsights.com
Last Five Quarters
45% 39%52% 59%
17%
17%36% 14%
36%
14%
1%
4%
3%
2%
8%
13%
17%
4%
25%
4%
29%
8% 15%
38%
Q3'11 Q4'11 Q1'12 Q2'12 Q3'12
Share of VC in Washington by Sector - Dollars of Funding
Internet HealthcareEnergy & Utilities Mobile & TelecommunicationsSoftware (non-internet/mobile) Other
www.cbinsights.com
Last Five Quarters
Venture Capital Activity Report | Q3 2012
www.cbinsights.com
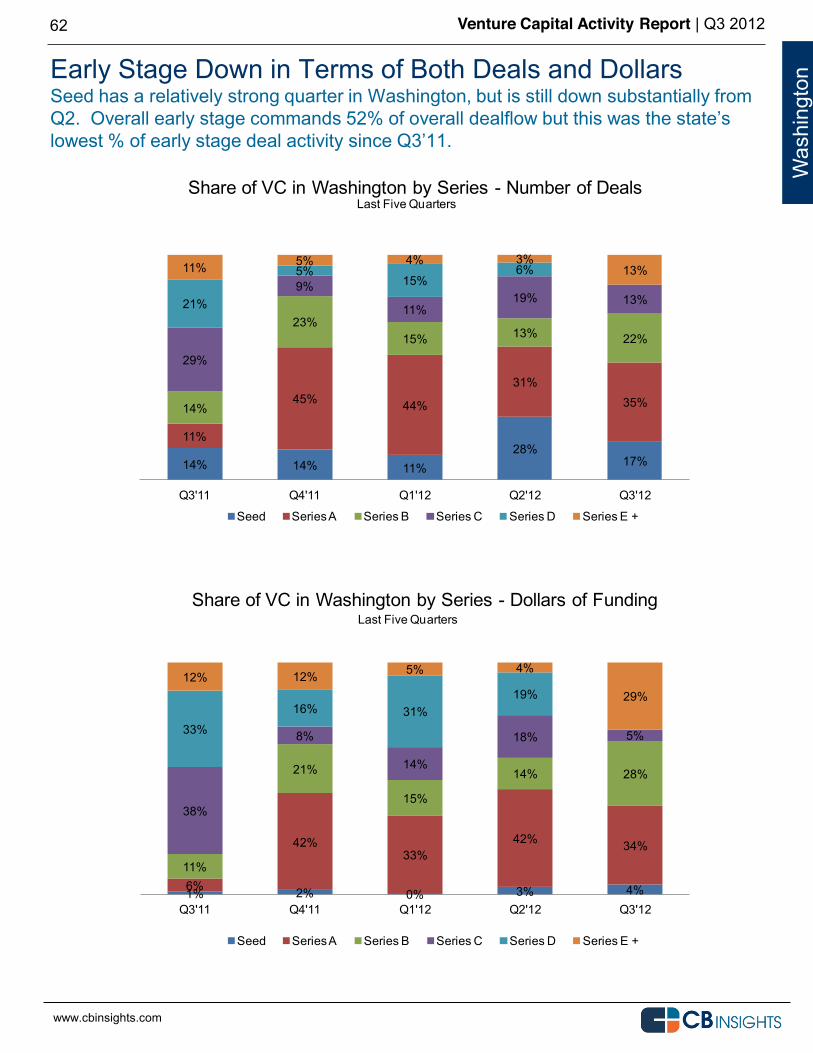
Early Stage Down in Terms of Both Deals and Dollars Seed has a relatively strong quarter in Washington, but is still down substantially from
62
Was
hing
ton
14% 14% 11%28%
17%
11%
45% 44%
31%35%14%
23%15% 13% 22%
29%
9%
11%19% 13%21%
5%15%
6%11% 5% 4% 3%13%
Q3'11 Q4'11 Q1'12 Q2'12 Q3'12
Share of VC in Washington by Series - Number of Deals
Seed Series A Series B Series C Series D Series E +
www.cbinsights.com
Last Five Quarters
1% 2% 0% 3% 4%6%
42%33%
42% 34%
11%
21%
15%
14% 28%
38%
8%
14%
18% 5%33%
16% 31%19%
12% 12% 5% 4%
29%
Q3'11 Q4'11 Q1'12 Q2'12 Q3'12
Share of VC in Washington by Series - Dollars of Funding
Seed Series A Series B Series C Series D Series E +
www.cbinsights.com
Last Five Quarters
Venture Capital Activity Report | Q3 2012
www.cbinsights.com
TEXAS Q3 2012 Venture Capital
63
Venture Capital Activity Report | Q3 2012
www.cbinsights.com
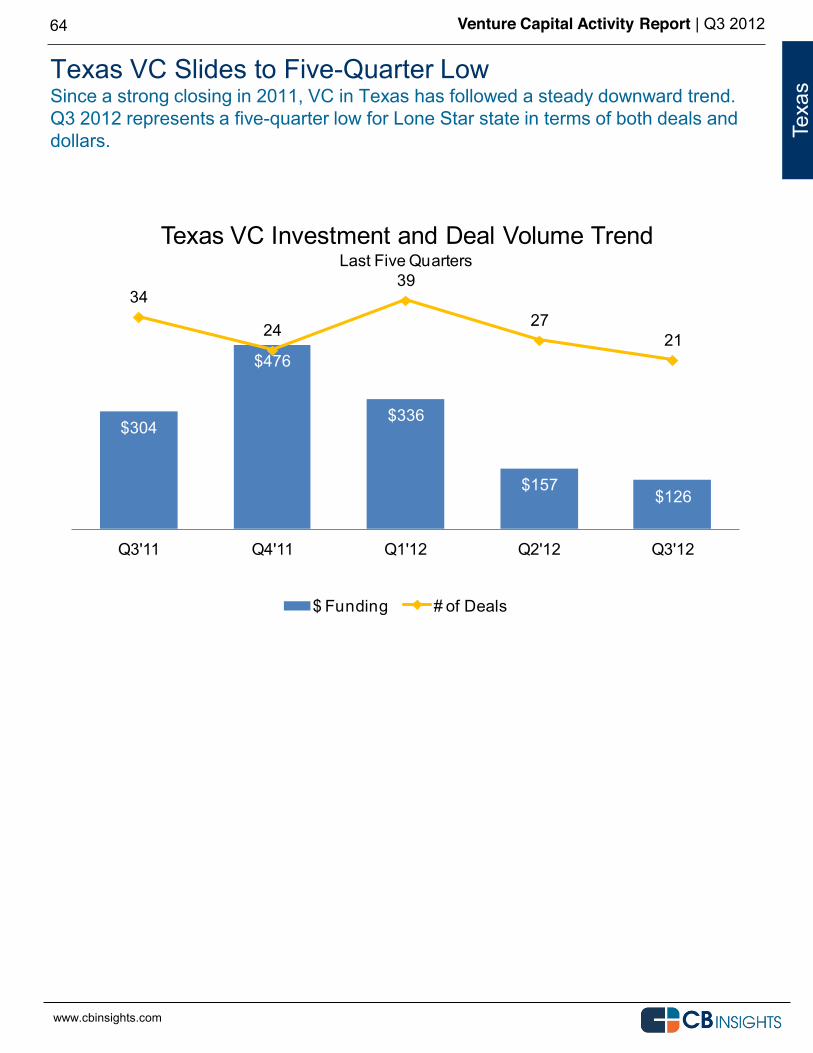
Texas VC Slides to Five-Quarter Low Since a strong closing in 2011, VC in Texas has followed a steady downward trend. Q3 2012 represents a five-quarter low for Lone Star state in terms of both deals and dollars.
64
Texa
s
$304
$476
$336
$157$126
34
24
39
2721
Q3'11 Q4'11 Q1'12 Q2'12 Q3'12
Texas VC Investment and Deal Volume Trend
$ Funding # of Deals
www.cbinsights.com
Last Five Quarters
Venture Capital Activity Report | Q3 2012
www.cbinsights.com
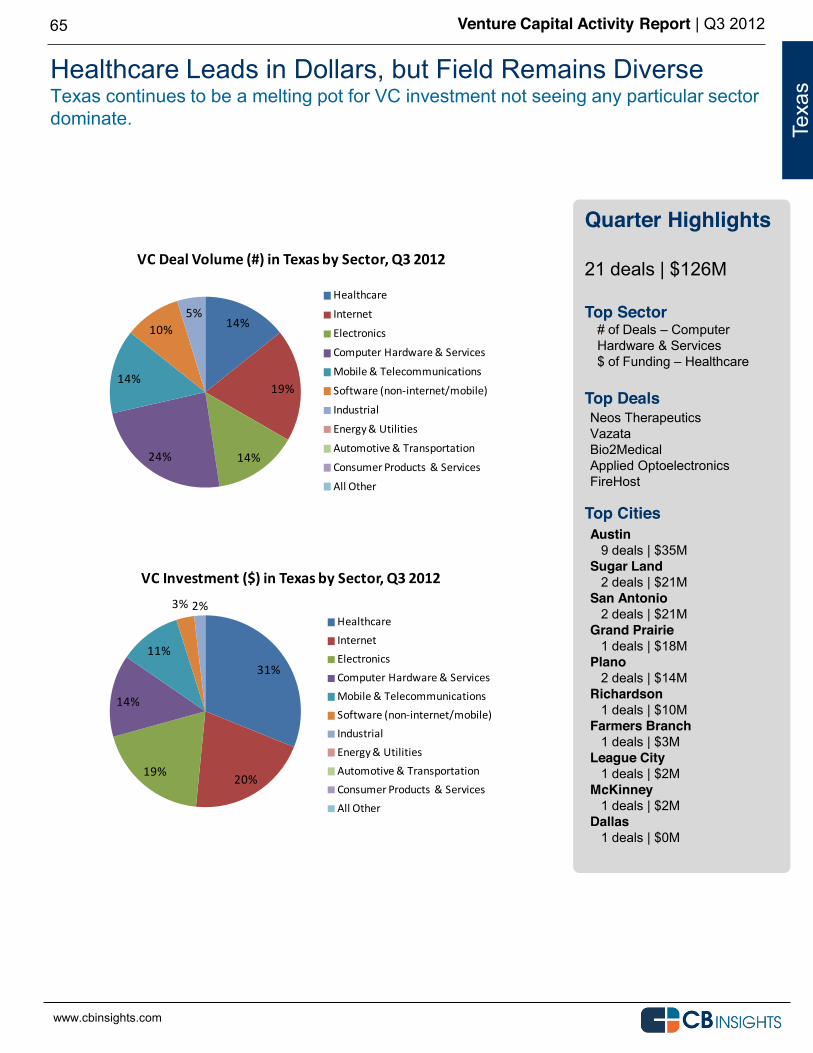
Healthcare Leads in Dollars, but Field Remains Diverse Texas continues to be a melting pot for VC investment not seeing any particular sector dominate.
65
Quarter Highlights 21 deals | $126M Top Sector
# of Deals Computer Hardware & Services $ of Funding Healthcare
Top Deals Top Cities
Austin 9 deals | $35M Sugar Land 2 deals | $21M San Antonio 2 deals | $21M Grand Prairie 1 deals | $18M Plano 2 deals | $14M Richardson 1 deals | $10M Farmers Branch 1 deals | $3M League City 1 deals | $2M McKinney 1 deals | $2M Dallas 1 deals | $0M
Texa
s
Neos Therapeutics Vazata Bio2Medical Applied Optoelectronics FireHost
14%
19%
14%24%
14%
10%5%
VC Deal Volume (#) in Texas by Sector, Q3 2012
Healthcare
Internet
Electronics
Computer Hardware & Services
Mobile & Telecommunications
Software (non-‐internet/mobile)
Industrial
Energy & Utilities
Automotive & Transportation
Consumer Products & Services
All Other
www.cbinsights.com
31%
20%19%
14%
11%
3% 2%
VC Investment ($) in Texas by Sector, Q3 2012
HealthcareInternetElectronicsComputer Hardware & ServicesMobile & TelecommunicationsSoftware (non-‐internet/mobile)IndustrialEnergy & UtilitiesAutomotive & TransportationConsumer Products & ServicesAll Other
www.cbinsights.com
Venture Capital Activity Report | Q3 2012
www.cbinsights.com
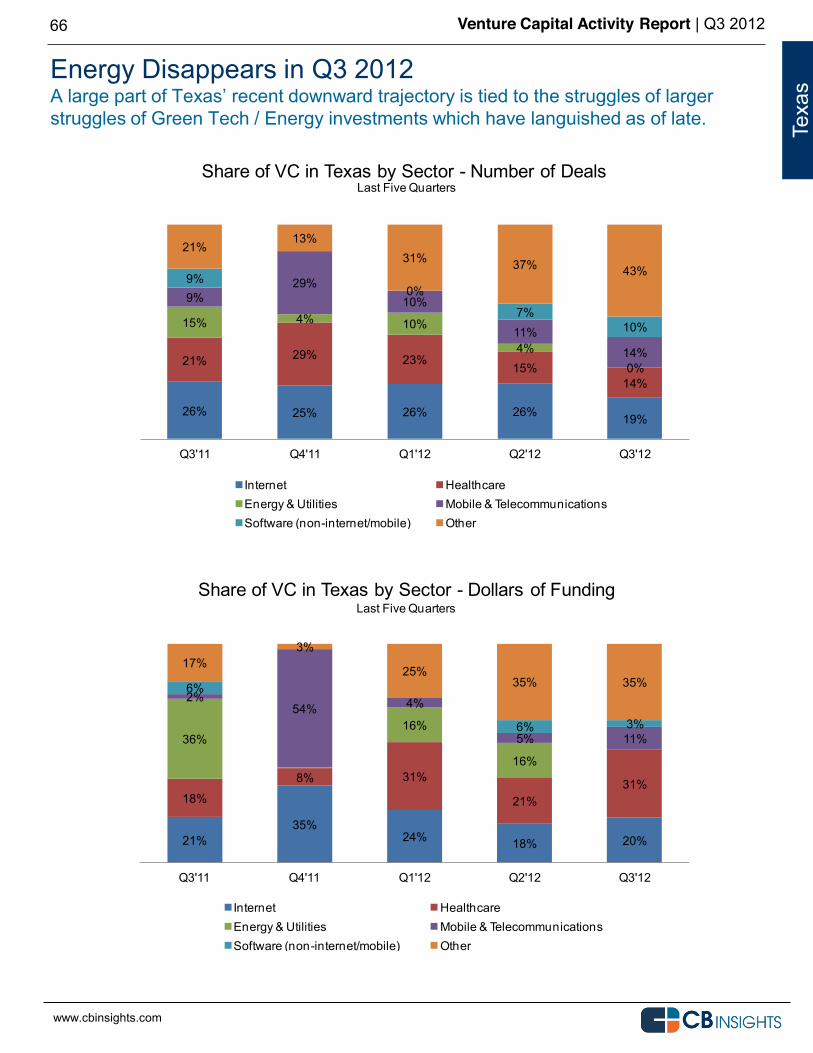
Energy Disappears in Q3 2012
struggles of Green Tech / Energy investments which have languished as of late.
66
Texa
s
26% 25% 26% 26% 19%
21% 29% 23%15%
14%
15% 4% 10%
4%0%
9%29%
10%
11%
14%
9%0%
7%10%
21%13%
31% 37% 43%
Q3'11 Q4'11 Q1'12 Q2'12 Q3'12
Share of VC in Texas by Sector - Number of Deals
Internet HealthcareEnergy & Utilities Mobile & TelecommunicationsSoftware (non-internet/mobile) Other
www.cbinsights.com
Last Five Quarters
21%35%
24% 18% 20%
18%
8% 31%
21%31%
36%16%
16%
2%54% 4%
5% 11%
6%
6% 3%
17%3%
25%35% 35%
Q3'11 Q4'11 Q1'12 Q2'12 Q3'12
Share of VC in Texas by Sector - Dollars of Funding
Internet HealthcareEnergy & Utilities Mobile & TelecommunicationsSoftware (non-internet/mobile) Other
www.cbinsights.com
Last Five Quarters
Venture Capital Activity Report | Q3 2012
www.cbinsights.com
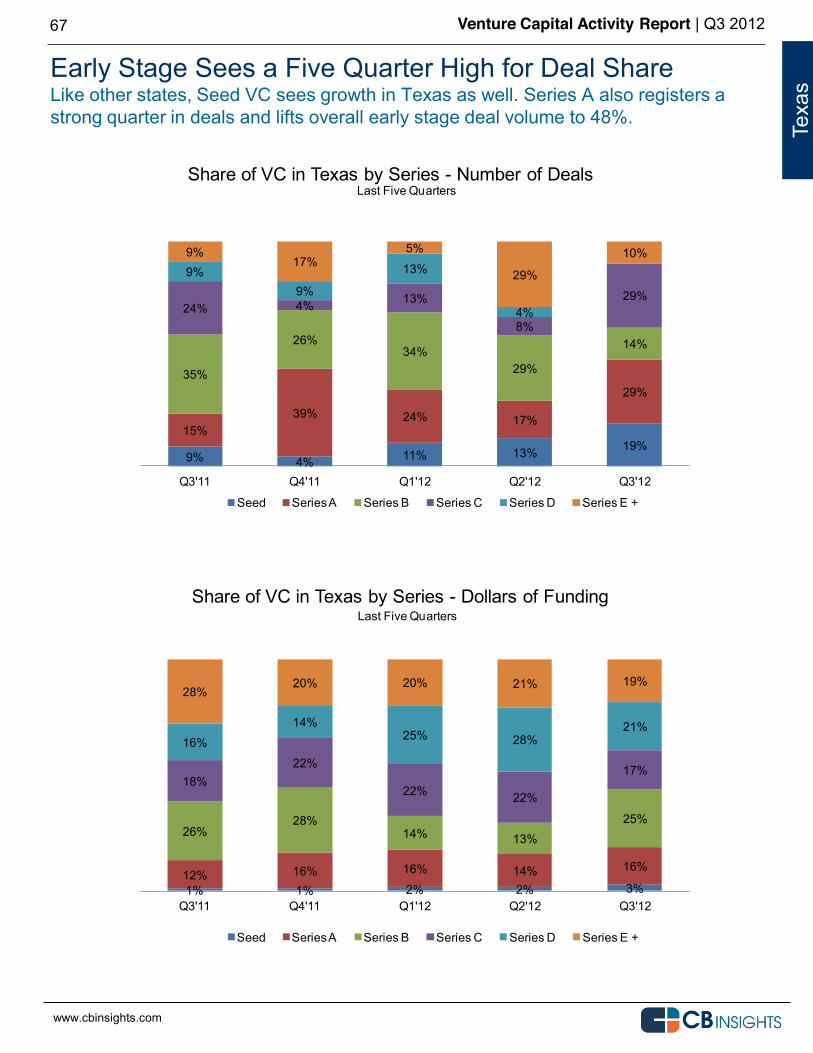
Early Stage Sees a Five Quarter High for Deal Share Like other states, Seed VC sees growth in Texas as well. Series A also registers a strong quarter in deals and lifts overall early stage deal volume to 48%.
67
Texa
s
9% 4% 11% 13% 19%15%
39% 24% 17%
29%35%
26%34%
29%
14%
24% 4% 13%
8%
29%
9%9%
13%
4%
9%17%
5%
29%
10%
Q3'11 Q4'11 Q1'12 Q2'12 Q3'12
Share of VC in Texas by Series - Number of Deals
Seed Series A Series B Series C Series D Series E +
www.cbinsights.com
Last Five Quarters
1% 1% 2% 2% 3%12% 16% 16% 14% 16%
26%28%
14% 13%25%
18%22%
22% 22%
17%
16%14%
25% 28%21%
28%20% 20% 21% 19%
Q3'11 Q4'11 Q1'12 Q2'12 Q3'12
Share of VC in Texas by Series - Dollars of Funding
Seed Series A Series B Series C Series D Series E +
www.cbinsights.com
Last Five Quarters
Venture Capital Activity Report | Q3 2012
www.cbinsights.com
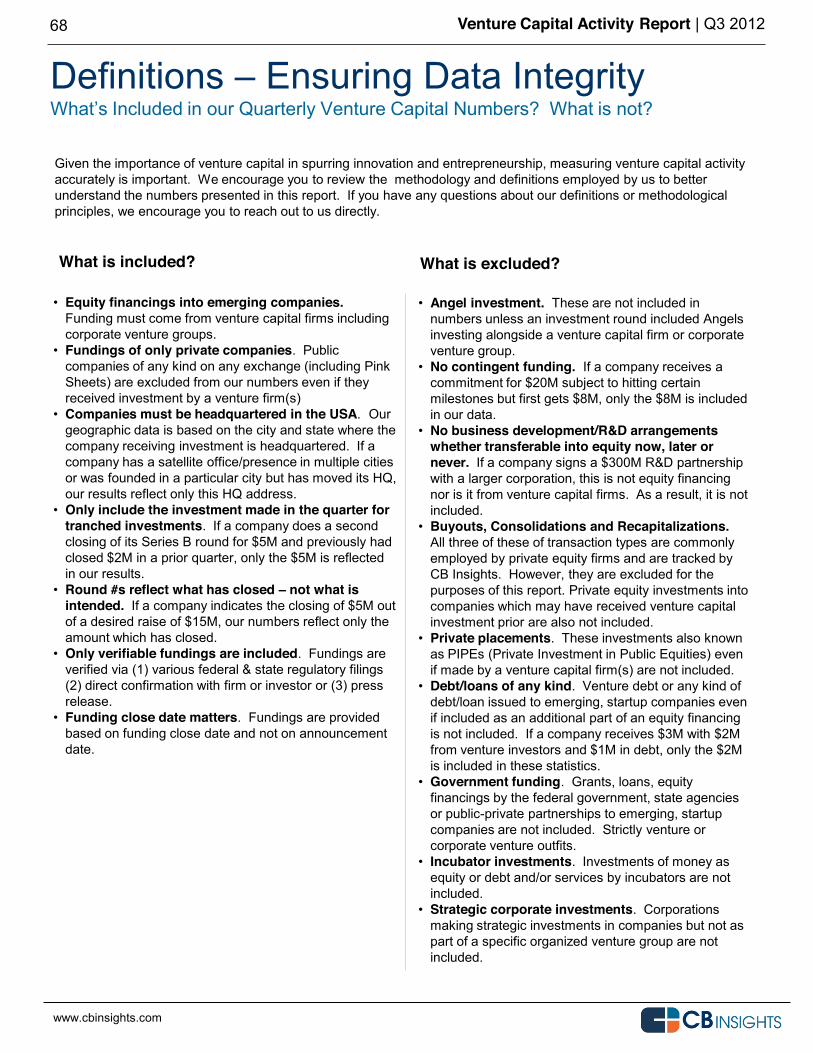
Definitions Ensuring Data Integrity
68
Given the importance of venture capital in spurring innovation and entrepreneurship, measuring venture capital activity accurately is important. We encourage you to review the methodology and definitions employed by us to better understand the numbers presented in this report. If you have any questions about our definitions or methodological principles, we encourage you to reach out to us directly.
Equity financings into emerging companies. Funding must come from venture capital firms including corporate venture groups. Fundings of only private companies. Public companies of any kind on any exchange (including Pink Sheets) are excluded from our numbers even if they received investment by a venture firm(s) Companies must be headquartered in the USA. Our geographic data is based on the city and state where the company receiving investment is headquartered. If a company has a satellite office/presence in multiple cities or was founded in a particular city but has moved its HQ, our results reflect only this HQ address. Only include the investment made in the quarter for tranched investments. If a company does a second closing of its Series B round for $5M and previously had closed $2M in a prior quarter, only the $5M is reflected in our results. Round #s reflect what has closed not what is intended. If a company indicates the closing of $5M out of a desired raise of $15M, our numbers reflect only the amount which has closed. Only verifiable fundings are included. Fundings are verified via (1) various federal & state regulatory filings (2) direct confirmation with firm or investor or (3) press release. Funding close date matters. Fundings are provided based on funding close date and not on announcement date.
Angel investment. These are not included in numbers unless an investment round included Angels investing alongside a venture capital firm or corporate venture group. No contingent funding. If a company receives a commitment for $20M subject to hitting certain milestones but first gets $8M, only the $8M is included in our data. No business development/R&D arrangements whether transferable into equity now, later or never. If a company signs a $300M R&D partnership with a larger corporation, this is not equity financing nor is it from venture capital firms. As a result, it is not included. Buyouts, Consolidations and Recapitalizations. All three of these of transaction types are commonly employed by private equity firms and are tracked by CB Insights. However, they are excluded for the purposes of this report. Private equity investments into companies which may have received venture capital investment prior are also not included. Private placements. These investments also known as PIPEs (Private Investment in Public Equities) even if made by a venture capital firm(s) are not included. Debt/loans of any kind. Venture debt or any kind of debt/loan issued to emerging, startup companies even if included as an additional part of an equity financing is not included. If a company receives $3M with $2M from venture investors and $1M in debt, only the $2M is included in these statistics. Government funding. Grants, loans, equity financings by the federal government, state agencies or public-private partnerships to emerging, startup companies are not included. Strictly venture or corporate venture outfits. Incubator investments. Investments of money as equity or debt and/or services by incubators are not included. Strategic corporate investments. Corporations making strategic investments in companies but not as part of a specific organized venture group are not included.
What is included? What is excluded?
Venture Capital Activity Report | Q3 2012
www.cbinsights.com
69
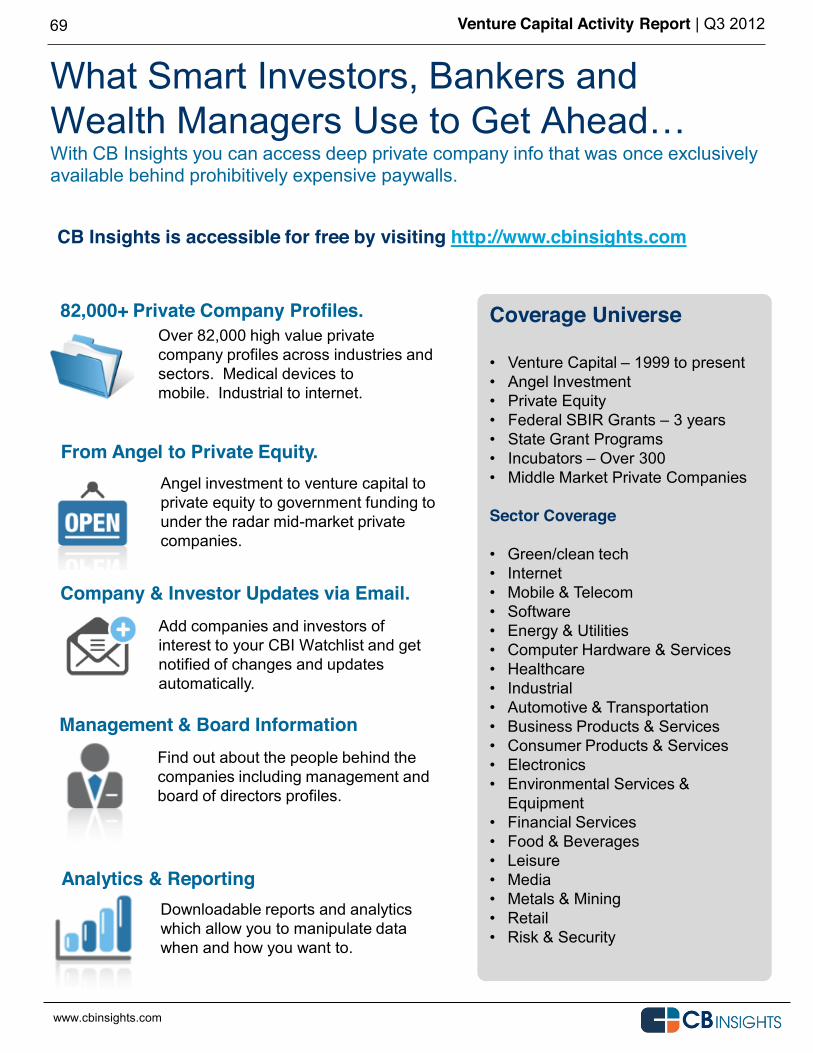
What Smart Investors, Bankers and
With CB Insights you can access deep private company info that was once exclusively available behind prohibitively expensive paywalls.
Coverage Universe
Venture Capital 1999 to present Angel Investment Private Equity Federal SBIR Grants 3 years State Grant Programs Incubators Over 300 Middle Market Private Companies
Sector Coverage
Green/clean tech Internet Mobile & Telecom Software Energy & Utilities Computer Hardware & Services Healthcare Industrial Automotive & Transportation Business Products & Services Consumer Products & Services Electronics Environmental Services & Equipment Financial Services Food & Beverages Leisure Media Metals & Mining Retail Risk & Security
CB Insights is accessible for free by visiting http://www.cbinsights.com
82,000+ Private Company Profiles.
Company & Investor Updates via Email. Add companies and investors of interest to your CBI Watchlist and get notified of changes and updates automatically.
Over 82,000 high value private company profiles across industries and sectors. Medical devices to mobile. Industrial to internet.
From Angel to Private Equity. Angel investment to venture capital to private equity to government funding to under the radar mid-market private companies.
Management & Board Information Find out about the people behind the companies including management and board of directors profiles.
Analytics & Reporting Downloadable reports and analytics which allow you to manipulate data when and how you want to.

Venture Capital Activity Report | Q3 2012
www.cbinsights.com
70
Get Started for Free with CB Insights Basic membership on CB Insights is free. Just visit http://www.cbinsights.com. Or connect with us via any of the following.
Twitter Follow us @cbinsights
Newsletter Click here to receive our weekly dealflow newsletter.
Email [email protected]
Telephone 212-292-3148