caustic management and reuse in the beverage … hub documents/research reports...caustic management...
TRANSCRIPT
Caustic Management and Reuse in the
Beverage Bottling Industry
Report to the
Water Research Commission
by
V L Pillay
Durban Institute of Technology
WRC Report No 1033/1/04
ISBN No 1-77005-115-5
FEBRUARY 2004
Disclaimer This report emanates from a project financed by the Water Research Commission (WRC) and is approved for publication. Approval does not signify that the contents necessarily reflect the views and policies of the WRC or the members of the project steering committee, nor does mention of trade names or commercial products constitute endorsement or recommendation for use.
ACKNOWLEDGEMENTS
The project team gratefully acknowledges the valuable input of the following
persons/organisations to this project :
(i) The Sugar Milling Research Institute, for providing waste caustic samples from
the sugar industry
(ii) ABI, Phoenix, for providing waste caustic samples from the bottle washers
(iii) Dr E P Jacobs and Mr D Koen, University of Stellenbosch, for providing flat-
sheet and capillary ultrafiltration membranes at no cost
(iv) PCI, England, for providing NF membranes at no cost
(v) The Project Steering Committee, for their valuable guidance and constructive
criticism
i
EXECUTIVE SUMMARY
INTRODUCTION
Sodium hydroxide solution (caustic) is widely used as a cleaning agent in the food and
beverage bottling industries. The two main uses are as a cleaning-in-place (CIP) solution and
in bottle washers. In CIP applications, a caustic solution with a strength ranging from 5 % to
about 20 %, is recirculated through the vessel to be cleaned. During the clean, the caustic
solution picks up suspended solids, organics, silicates etc., and hence deteriorates with each
clean. The CIP solution is usually used for four to eight cleans before being discarded to
drain. In the bottle washing process, the bottles are firstly plunged into a caustic bath ( 2 %
to 5 % caustic strength). The caustic bath serves to remove residual labels, glue, grit,
residual dehydrated organics etc from the bottles, and hence this bath progressively becomes
contaminated with these. When this contamination reaches an unacceptable level, the entire
contents of the bath are dumped. Generally, a caustic batch is used for 8 weeks to 10 weeks
before being dumped.
In both the CIP and bottle wash bath caustic effluents, the caustic strength of the waste
caustic stream is still high, and the stream is discarded solely because of the level of
contamination. If the level of contamination is reduced, the effective lifespan of the caustic
solution could be extended significantly, implying a significant savings in caustic usage.
Internationally membrane-based systems for the cleanup and reuse of spent caustic solutions
are readily available from various commercial vendors. In South Africa, however, cleanup of
spent caustic solutions and their subsequent reuse or recycling is rarely practiced. Possible
reasons for this include the high cost of imported caustic cleanup systems, the high cost of
obtaining spares and new membranes for imported systems, as well as the perception that
membranes are a very “high tech” technology that requires very high skills levels to operate
and maintain. This is exacerbated by the lack of a local expertise base to support these
systems in terms of operations, optimization, modifications etc.
There could be considerable benefit to the South African food and beverage industry and the
broader aspect of environmental protection, therefore, if a locally developed caustic cleanup
system was available which addressed the above concerns. This forms the overall objective
of this project.
ii
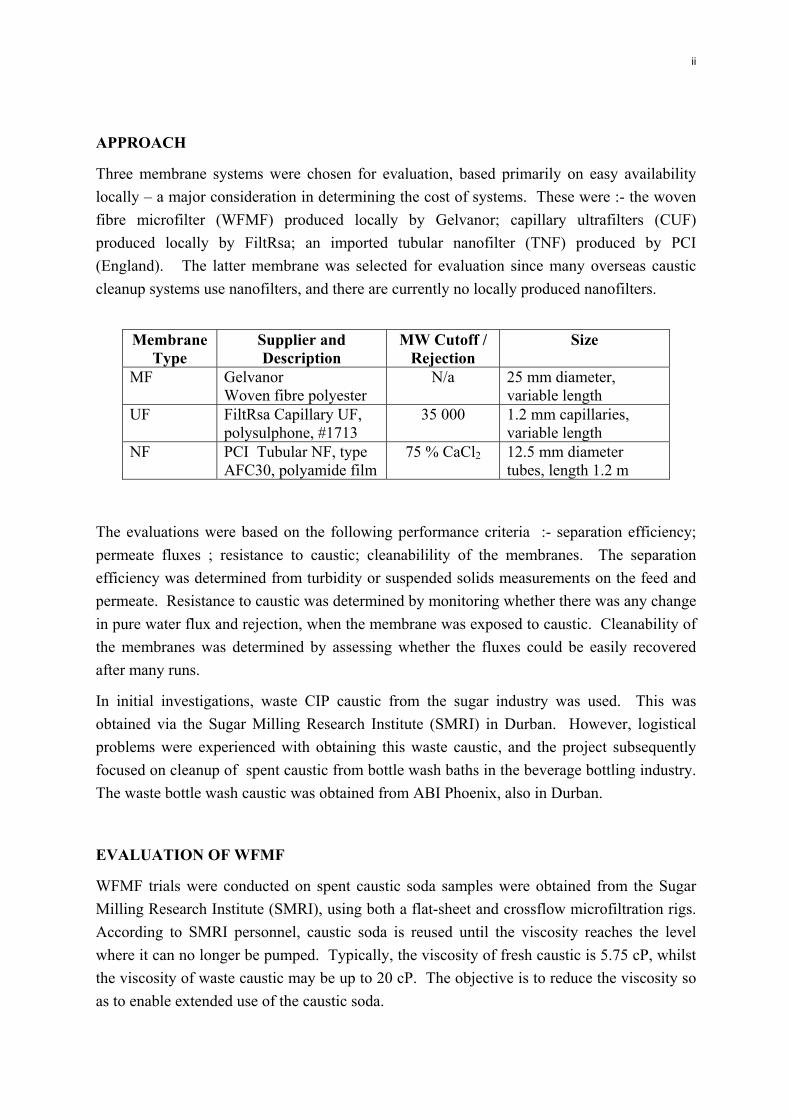
APPROACH
Three membrane systems were chosen for evaluation, based primarily on easy availability
locally – a major consideration in determining the cost of systems. These were :- the woven
fibre microfilter (WFMF) produced locally by Gelvanor; capillary ultrafilters (CUF)
produced locally by FiltRsa; an imported tubular nanofilter (TNF) produced by PCI
(England). The latter membrane was selected for evaluation since many overseas caustic
cleanup systems use nanofilters, and there are currently no locally produced nanofilters.
Membrane
Type Supplier and Description
MW Cutoff / Rejection
Size
MF Gelvanor Woven fibre polyester
N/a 25 mm diameter, variable length
UF FiltRsa Capillary UF, polysulphone, #1713
35 000 1.2 mm capillaries, variable length
NF PCI Tubular NF, type AFC30, polyamide film
75 % CaCl2 12.5 mm diameter tubes, length 1.2 m
The evaluations were based on the following performance criteria :- separation efficiency;
permeate fluxes ; resistance to caustic; cleanabilility of the membranes. The separation
efficiency was determined from turbidity or suspended solids measurements on the feed and
permeate. Resistance to caustic was determined by monitoring whether there was any change
in pure water flux and rejection, when the membrane was exposed to caustic. Cleanability of
the membranes was determined by assessing whether the fluxes could be easily recovered
after many runs.
In initial investigations, waste CIP caustic from the sugar industry was used. This was
obtained via the Sugar Milling Research Institute (SMRI) in Durban. However, logistical
problems were experienced with obtaining this waste caustic, and the project subsequently
focused on cleanup of spent caustic from bottle wash baths in the beverage bottling industry.
The waste bottle wash caustic was obtained from ABI Phoenix, also in Durban.
EVALUATION OF WFMF
WFMF trials were conducted on spent caustic soda samples were obtained from the Sugar
Milling Research Institute (SMRI), using both a flat-sheet and crossflow microfiltration rigs.
According to SMRI personnel, caustic soda is reused until the viscosity reaches the level
where it can no longer be pumped. Typically, the viscosity of fresh caustic is 5.75 cP, whilst
the viscosity of waste caustic may be up to 20 cP. The objective is to reduce the viscosity so
as to enable extended use of the caustic soda.

iii
Preliminary tests were conducted using a flat sheet test cell. These experiments were
conducted in dead-end mode at a pressure of 100 kPa. It was found that the WFMF reduced
the viscosity of the spent caustic from 17.2 cP down to 7.1 cP, quite close to that of the fresh
caustic. This reduction was regarded as excellent, and indicated that WFMF was capable of
cleaning up waste caustic to the point where it could be reused.
Unfortunately however, this excellent result obtained in initial trials could not be repeated in
subsequent flat-sheet trials and crossflow trials. Typically, in subsequent evaluations, the
WFMF system reduced the spent caustic viscosity from 19.2 cP to 13.2 cP. Whilst it was
clear that the WFMF system was effecting some cleanup of the caustic, the reduction in
viscosity was insufficient to reuse the caustic.
Various investigations were done to try and improve the performance of the WFMF system.
This included changing the operating pressure as well as precoating the membrane. These
had no significant effect on system performance. In all instances there was a definite
reduction in viscosity, but nothing close to the excellent results obtained initially.
It was concluded that WFMF alone is inadequate to recycle spent CIP solution from the sugar
industry. However, WFMF could play a role as a pretreatment step, if it is found that an
expensive or exotic membrane is necessary to remove the target contaminants that contribute
to the viscosity increase. In this instance, the WFMF could remove the grosser contaminants
and thus extend the life of the expensive membrane.
EVALUATION OF CUF
Preliminary trials on UF were conducted on a flat-sheet rig, using a 35kD cutoff UF
membrane obtained from the Institute of Polymer Science, University of Stellenbosch. Two
batches of waste caustic obtained from ABI Phoenix were investigated – 3 weeks old and 8
weeks old. The suspended solids content of the feed and permeate were measured as an
indication of separation efficiency. The feed suspended solids in the 3 weeks old batch
ranged from 100 mg/L to 300 mg/L, while the feed suspended solids in the 8 week old batch
was approximately 800 mg/L to 1000 mg/L. The separation efficiency was very good, with
the permeate suspended solids ranging from 2 mg/L to 30 mg/L – a reduction of 90 % to
99 %. Interestingly, the permeate suspended solids decreased as the feed suspended solids
increased.
This very good separation efficiency was repeatedly obtained in trials on capillary
ultrafiltration modules. Here turbidity was used to indicate separation efficiency. Once
again, the separation efficiency was a function of the age of the batch. For a 4 weeks old

iv
batch the feed turbidity ranged from 300 NTU to 500 NTU, while the permeate turbidity was
below 2 NTU. For a 8 week old batch the feed turbidity also ranged from 400 NTU to about
500 NTU. The permeate turbidities ranged from 1 NTU to 10 NTU, with some samples
registering 15 NTU. Overall, this indicates that CUF is capable of a very good turbidity
removal, and that CUF is capable of cleaning up waste caustic to the point where it could be
reused.
Permeate fluxes were measured at an operating pressure of 1 bar and a tube velocity of 1 m/s.
Typically, and without any form of flux enhancement, the permeate flux starts off at around
50 LMH and decreases to about 20 LMH after 3 hours of filtration. . Backflushing was
investigated as a form of flux enhancement, and proved to be highly effective. Backflushing
for 5 minutes after every 1.5 hours of filtration restored the permeate flux to over 90 % of its
initial value. This enabled the runtime to be extended substantially. In the longest run
performed with backflushing, an average flux of 35 LMH was maintained for 32 hours.
There is a weak dependency on batch age, with permeate fluxes decreasing slightly as the
batch age increases With backflushing, an average flux of 42 LMH was obtained for a 3 week
batch age, decreasing to 35 LMH for a 6 week batch age.
Three methods of cleaning fouled membranes were investigated – flushing with water,
backflushing, and chemical cleaning. Whilst the former two were not very effective in
removing the fouling layer, chemical cleaning consistently restored the pure water flux to
over 90 % of pure water flux of a new membrane. Chemical cleaning was also able to
restore an old fouled membrane that had been out of use for a while. The chemical cleaning
solution consisted of EDTA, sodium laurel sulphate and sodium hydroxide in equal parts,
made up to a 0.5 m/v solution.
The CUF system also seemed to be very stable when operated on the waste caustic, with no
change in separation efficiency, permeate fluxes or pure water fluxes after extended
operation.
EVALUATION OF TNF
Tubular nanofiltration trials were performed on the ABI caustic at a pressure of 20 bar and a
tube velocity of approximately 1 m/s. In between caustic runs, pure water fluxes were
determined at different operating pressures.
The permeate turbities range from 0.3 to 3 NTU, for feed turbidities of 250 to 400 NTU,
indicating an excellent turbidity rejection. However, these turbidities are higher than would
be expected of a nanofilter, where turbidities well below 1 NTU should be achieved.
v
The average permeate fluxes exhibited a very strange trend. In the first run, a flux of 30
LMH was obtained. In subsequent runs this increased rapidly to 60 LMH, decreased rapidly
to about 38 LMH, and then progressively increased back to 60 LMH. Investigations
indicated that this was not due to any change in the nature of the feed, but was most probably
due to a structural change in the membrane. This was concluded by examining the pure
water fluxes. The PWF started off at about 100 LMH, increased rapidly to 350 LMH,
decreased rapidly to 100 LMH and then slowly increased back to 300 LMH.
The pure water flux at a specified pressure can only increase if there is a change to the
structure of the membrane. It is most probable that some irreversible chemical change has
occurred due to either the caustic or some component of the waste caustic, causing the NF
membrane to become more “open”, resulting in a an increase in fluxes and a corresponding
decrease in separation efficiency.
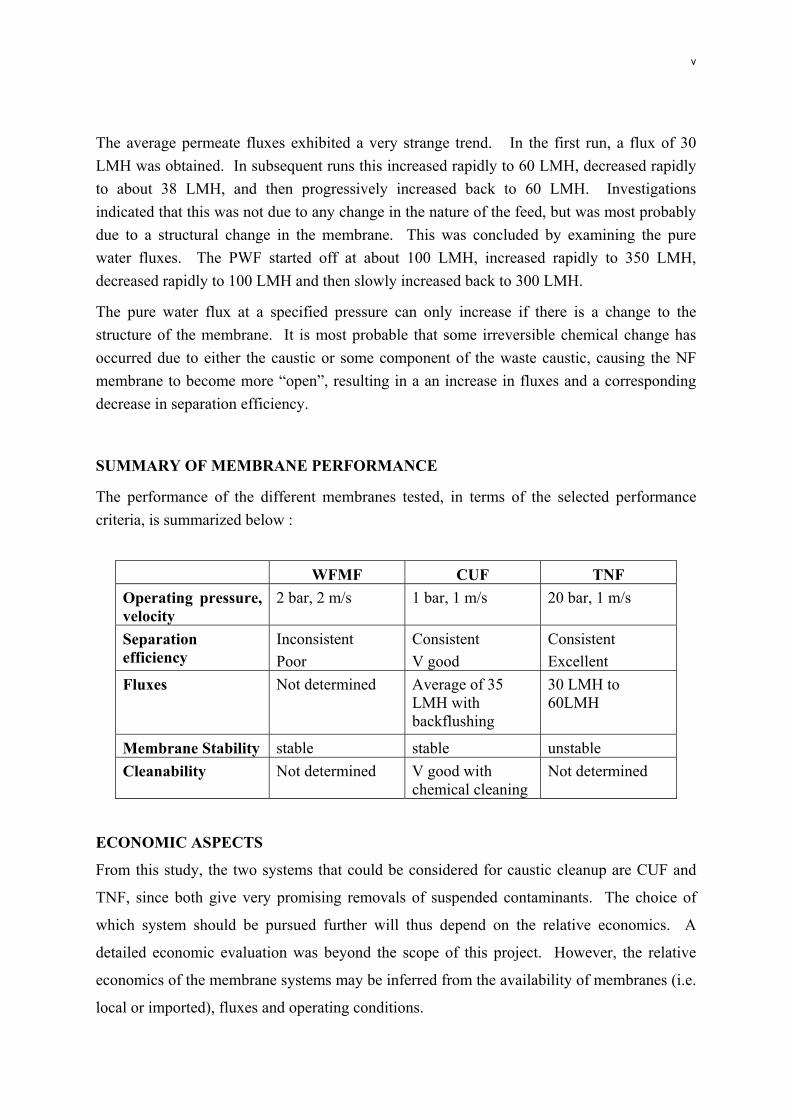
SUMMARY OF MEMBRANE PERFORMANCE
The performance of the different membranes tested, in terms of the selected performance
criteria, is summarized below :
WFMF CUF TNF
Operating pressure, velocity
2 bar, 2 m/s 1 bar, 1 m/s 20 bar, 1 m/s
Separation efficiency
Inconsistent
Poor
Consistent
V good
Consistent
Excellent
Fluxes Not determined Average of 35 LMH with backflushing
30 LMH to 60LMH
Membrane Stability stable stable unstable
Cleanability Not determined V good with chemical cleaning
Not determined
ECONOMIC ASPECTS
From this study, the two systems that could be considered for caustic cleanup are CUF and
TNF, since both give very promising removals of suspended contaminants. The choice of
which system should be pursued further will thus depend on the relative economics. A
detailed economic evaluation was beyond the scope of this project. However, the relative
economics of the membrane systems may be inferred from the availability of membranes (i.e.
local or imported), fluxes and operating conditions.
vi
Comparative capital costs
The TNF modules are available in areas up to 2.6 m2. The currently available CUF module
has a membrane area of approximately 7 m2. The fluxes obtained on TNF are up to 60 LMH,
while that obtained on CUF is approximately 35 LMH. Hence, for a specified duty Q (L/h),
the number of TNF modules required would be about 1.5 times the number of CUF modules
required.
The TNF system would have to constructed of stainless steel, due to the high operating
pressure. The CUF system is constructed of PVC, available locally.
Hence, even without detailed prices being available, it is clear that the capital cost of a TNF
system would be greater than that of a CUF system, for a specified duty.
Comparative energy costs
The operating pressure for the TNF system is 20 times that of the CUF system. Hence, the
energy requirements would be of a similar magnitude. There is not expected to be any
significant difference in operator requirements, since both systems could be designed to be
manually operated or fully automated. Hence, the operating cost for the CUF system is
expected to be substantially lower than that of the TNF system.
Maintenance and module replacement
There is not expected to be a significant difference in maintenance of a TNF and CUF
system. The replacement of membranes for the CUF system is expected to be less than the
TNF system, in view of the fact that they are imported, and in view of the poor prevailing
exchange rates.
Summary
In summary, both the capital and operating costs of the CUF are likely to be lower than that
of the TNF system. In view of the fact that the separation efficiency of the TNF system is
only marginally better than the CUF, it may be concluded that the CUF would be more
economically attractive for caustic cleanup.

vii
CONCLUSION
WFMF gave a very inconsistent product quality, ranging from poor to very good. The
system would not be suitable to clean up used caustic for reuse. In larger scale applications,
however, it may be preferable to use WFMF to pretreat the waste caustic, prior to cleanup by
CUF or NF.
CUF gave a very good product quality, from 1 NTU to 10 NTU, probably suitable for direct
reuse. Average fluxes range from 35 LMH to 42 LMH, and could be maintained for up to 32
hours with regular backflushing. The membrane was stable to caustic, and fouled membranes
could be recovered with chemical cleaning.
TNF gave an excellent product quality, generally around 1 NTU. However, the permeate
fluxes and pure water fluxes were inconsistent and changed drastically with time. This is
most probably indicative of a change in membrane structure, indicating possible instability
when operated on waste caustic.
In considering economic aspects, the capital cost of a CUF system is likely to be significantly
lower than a TNF system. The operating costs of the CUF system are also likely to be lower,
due to lower operating pressures. Maintenance costs may not differ musch between CUF and
TNF. Overall, therefore, the CUF system is likely to be more cost effective than a TNF
system, while the TNF produces a higher quality of product.
RECOMMENDATIONS
The following aspects need to be addressed further in order to progress to the industrialisation
of a local membrane system for caustic reuse :
(i) Criteria for reuse of caustic – The project team were unsuccessful in obtaining
from the beverage bottlers a clear indication of the criteria that recycled caustic
must meet to be considered for reuse, seemingly because caustic reuse had not
been given serious consideration previously. The caustic suppliers should have a
better understanding of the criteria that caustic cleaning solutions must meet, but
were reticent in revealing this information.
(ii) Economic evaluation – Ultimately, the cost of recycling caustic must be compared
to the cost of using fresh caustic. This requires information on criteria for reuse,
viii
additives in the caustic solution, and the cost of fresh caustic and additives. Once
again, this information could not be obtained from the bottlers.
(iii) Performance in batch concentration mode – The permeate fluxes obtained in this
study were obtained by operating in a constant concentration mode. This will
simulate the situation where a side stream is continuously drawn off from the
bottle wash bath and cleaned. Alternatively, the caustic cleanup could be done in
a batch concentration mode. Design fluxes for this mode cannot be inferred from
this study, but can easily be obtained experimentally.
ix
TABLE OF CONTENTS
1 Introduction .................................................................................................................. 1
1.1 Background to the project .............................................................................................. 1
1.2 Objectives ...................................................................................................................... 3
1.3 Performance Criteria ...................................................................................................... 3
2 Literature and internet survey ................................................................................... 4
3 Membranes and Test Suspensions .............................................................................. 5
3.1 Choice and Procurement of Membranes ........................................................................ 5
3.2 Test suspensions............................................................................................................. 6
4 Experimental ................................................................................................................ 7
4.1 Flat-sheet rig .................................................................................................................. 7
4.2 Crossflow Microfiltration (CFMF) Rig ......................................................................... 8
4.3 Crossflow Nanofiltration (CFNF) Rig ........................................................................... 9
4.4 Capillary Ultrafiltration (CUF) Rig ............................................................................... 9
5 Evaluation of Woven Fibre Microfiltration ............................................................ 10
5.1 Identification of contaminants contributing to the high viscosity ............................... 10
5.2 Development of analytical techniques ......................................................................... 11
5.2.1. Sodium species......................................................................................................... 11
5.2.2. Organics ................................................................................................................... 11
5.3 Preliminary microfiltration tests on flat-sheet test cell ................................................ 12
5.4 Trials on Crossflow Microfiltration rig ........................................................................ 12
5.5 Further Trials on the Flat Sheet WFMF ....................................................................... 13
5.5.1. Replicability of previous performance..................................................................... 13
5.5.2. Effect of Operating Pressure .................................................................................... 14
5.5.3. Effect of Precoating ................................................................................................ 15
5.6 Summary ...................................................................................................................... 15
6 Evaluation of Ultrafiltration ..................................................................................... 16
6.1 Flat-sheet Trials ........................................................................................................... 17
6.2 Capillary UF Trials ...................................................................................................... 18
x
6.2.1. Turbidity Rejection .................................................................................................. 18
6.2.2. Permeate Fluxes ....................................................................................................... 20
6.2.3. Cleanability .............................................................................................................. 24
6.3 Summary ...................................................................................................................... 27
7 Evaluation of Tubular Nanofiltration ...................................................................... 28
7.1 Turbidity Rejection ...................................................................................................... 28
7.2 Permeate Fluxes ........................................................................................................... 30
7.3 Summary ...................................................................................................................... 33
8 Comparative Evaluation of the Different Membrane Systems .............................. 34
8.1 Separation Efficiency ................................................................................................... 34
8.2 Stability of Membrane ................................................................................................. 34
8.3 Economics Aspects ...................................................................................................... 35
8.3.1. Comparative capital costs ........................................................................................ 35
8.3.2. Comparative energy costs ........................................................................................ 36
8.3.3. Maintenance and module replacement ..................................................................... 36
8.3.4. Summary .................................................................................................................. 36
9 Conclusion .................................................................................................................. 36
10 RECOMMENDATIONS ........................................................................................... 37
xi
TABLE OF FIGURES
Figure Description Page
1 Removal of Suspended Solids : Flat-sheet UF Rig with ABI Caustic 17
2 CUF turbidities obtained on a batch of waste caustic that was 8 weeks
old
19
3 CUF turbidities obtained on a batch of waste caustic that was 4 weeks
old
19
4 Typical flux-time profiles obtained on CUF of waste caustic 20
5 Effect of backflushing on permeate flux profile 21
6 Effect of backflushing : feed age of 3 weeks 22
7 Effective backflushing : feed age of 4 weeks 22
8 Effect of backflushing : feed age of 6 weeks 23
9 Permeate flux profiles obtained using a water wash 24
10 Effects of backwashing and chemical cleaning on PWF 26
11 Effect of backflushing and chemical clean on an old module 27
12 Turbidity Rejection : TNF on ABI Caustic 29
13 History of Turbidity Rejection : TNF on ABI Caustic 29
14 Permeate Flux Profiles : TNF on ABI Caustic 30
15 Summary of Average Permeate Fluxes : TNF on ABI Caustic 31
16 Pure Water Fluxes : TNF on ABI Caustic 32
17 Trend of Pure Water Flux at 20 bar : TNF of ABI Caustic 32

xii
TABLE OF TABLES
Table Description Page
1 Details of membranes evaluated in the study 6
2 Overall analysis of feed sample as provided by SMRI 10
3 Analysis of the feed and permeate samples from flat sheet WFMF rig 12
4 Viscosity Change in Flat Sheet WFMF 14
5 Summary of CUF Fluxes 23
1
1 INTRODUCTION
1.1 Background to the project
Sodium hydroxide solution (caustic) is widely used as a cleaning agent in the food and
beverage bottling industries. The two main uses are as a cleaning-in-place (CIP)
solution and in bottle washers.
In CIP applications, a caustic solution with a strength ranging from 5 % to about 20 %
is used, depending on the industry. The caustic is recirculated through the vessel to be
cleaned, and returned to a storage tank. During the clean, the caustic solution picks up
suspended solids, organics, silicates etc., and hence deteriorates with each clean. The
CIP solution is usually used for four to eight cleans before being discarded to drain.
The criteria for dumping differs from industry to industry.
In the bottle washing process, the bottles are firstly plunged into a caustic bath ( 2 % to
5 % caustic strength). The bottles are then drained and allowed to dry (with warm air
in some instances). The bottles then enter a series of three rinse baths, which are
operated in a counter current mode. The caustic bath serves to remove residual labels,
glue, grit, residual dehydrated organics etc from the bottles, and hence this bath
progressively becomes contaminated with these. When this contamination reaches an
unacceptable level, the entire contents of the bath are dumped. In some bottling plants,
an attempt is made to extend the life of the caustic by periodically pumping the contents
into a settling tank, allowing the grosser solids to settle out, and returning the
supernatent to the bath. The rinse baths remove any residual caustic from the bottles,
and prepare them for filling. The carryover of caustic from the caustic bath to the rinse
baths is not very high, but increases as the level of contamination in the caustic bath
increases. In general, there is a very low concentration of caustic in the effluent from
the rinse baths.
Thus, there are three main sources of caustic effluents from food and beverage bottling
plants:
(i) spent caustic from CIP. This has a relatively high concentration of caustic,
contaminated with suspended and some soluble contaminants
(ii) spent caustic from the bottle washer caustic bath. This has a relatively high
concentration of caustic, but is contaminated with suspended and some soluble
contaminants.
(iii) effluent from the rinsebaths. This is a very dilute caustic stream.
2
It must be noted that for CIP and bottle wash bath effluents, the caustic strength of the
waste caustic stream is still high, and the stream is discarded solely because of the level
of contamination. If the level of contamination is reduced, the effective lifespan of the
caustic solution could be extended significantly, implying a significant savings in
caustic usage.
Conversely, the effluent from the rinsebaths is very dilute. Here, the effluent streams
would have to be cleaned up and concentrated up, if the caustic is to be reused.
Internationally membrane-based systems for the cleanup and reuse of spent caustic
solutions are readily available from various commercial vendors. ZM Environmental
Systems (www.zmtech.com) uses a nanofiltration or ultrafiltration membrane to
remove suspended and dissolved solids, and procuse clean caustic for reuse in the
peeling and sanitizing industries. PCI-Memtech (www.pci_memtech.com) produces a
tubular nanofiltration membrane for spent caustic recovery. A ceramic membrane for
caustic cleanup is produced by FES International (www.fesintl.com). The AlkaSave
system uses nanofiltration modules produced by Koch (www.kockmembrane.com).
In South Africa, however, cleanup of spent caustic solutions and their subsequent reuse
or recycling is rarely practiced. One reason is that spent caustic solutions have not been
regarded as a problem. The practise of neutralization and disposal has been widely
applied. This is likely to change as environmental legislation is tightened up and
cleaner production philosophies become more popular. The other reasons for the lack
of membrane based caustic recycling locally include :
(i) The high cost of imported caustic cleanup systems
(ii) The high cost of obtaining spares and new membranes for imported systems
There is also the perception that membranes are a very “high tech” technology that
requires very high skills levels to operate and maintain. This is exacerbated by the lack
of a local expertise base to support these systems in terms of operations, optimization,
modifications etc.
There could be considerable benefit to the South African food and beverage industry
and the broader aspect of environmental protection, therefore, if a locally developed
caustic cleanup system was available which addressed the above concerns. This forms
the overall objective of this project.
3
1.2 Objectives
The specific objectives of the project are as follows :
(i) to develop a management strategy for caustic streams in the beverage bottling
industry
(ii) to develop a viable membrane-based system for the reuse and/or recovery of used
caustic solutions, and to demonstrate this to potential users
(iii) to develop a human resource skills base that is capable of implementing such
processes in industry
(iv) to develop a commercialisation strategy for the proposed processes
In view of the fact that off-the-shelf systems are available overseas, and in
consideration of the factors that make local industry reticent to use those systems, the
overall “guiding principles” for the project are :
(i) draw on existing South African membrane technology where available
(ii) where South African technology is not available focus on membranes and
modules that are readily available internationally, and where the vendor is
prepared to supply modules for inclusion in a locally constructed system. This
latter point is of significance since it is known that various vendors are only
prepared to supply full systems, and not individual modules.
1.3 Performance Criteria
In order for a membrane caustic recovery process to be attractive to users, it must be
able to reduce the level of contamination in the waste caustic to “adequate” levels, it
must be economically cost-effective, and it must be reliable and easily operable. The
definition of “adequate” would be dependant on the application, and would be defined
by the user.
Accordingly, the performance criteria determined for each membrane system were :
(i) separation efficiency
(ii) permeate fluxes
(iii) resistance to caustic.
(iv) cleanabilility of the membranes.
4
The separation efficiency was determined from turbidity and suspended solids
measurements on the feed and permeate. Resistance to caustic was determined by
monitoring whether there was any change in pure water flux and rejection, when the
membrane was exposed to caustic. Cleanability of the membranes was determined by
assessing whether the fluxes could be easily recovered after many runs.
2 LITERATURE AND INTERNET SURVEY
A literature search was performed to identify previous membrane based processes used
for caustic cleanup as well as caustic concentration. The databases surveyed were
Waterlit, Emily, SA Cat, and SA Citations. The keywords used for the literature were
sodium hydroxide recovery, caustic soda, membrane processes/systems and caustic
recovery. No significant information on membrane systems for caustic cleanup were
obtained. The one process that was found concerned the concentration of dilute caustic
solution, and was developed by the Pollution Research Group, University of Natal. The
system combines neutralisation together with three standard membrane techniques:-
cross-flow microfiltration, nanofiltration and electrochemical recovery. In addition, the
options of reverse osmosis or evaporation was considered as an effluent concentration
step.
In the internet search, however, numerous advertisements for caustic cleanup systems
based on membrane processes were found, indicating that these systems do exist but
seeming have not been reported in research literature. These systems use a
microfiltration (MF) or ultrafiltration (UF) system to remove suspended and colloidal
contaminants from caustic. This may be followed by a nanofiltration (NF) step to
remove small molecular weight organics.
Whilst the internet survey indicate that there were various processes for the cleanup of
caustic, sparse information was obtained on concentration of dilute caustic streams.
Various membrane suppliers were contacted to establish whether they had membranes
capable of concentrating up dilute caustic. PCI Membranes in England was visited by a
member of the project team in 1999, and this issue was raised with their technical
personnel. From all of this it emerged that commercial suppliers of reverse osmosis
membranes are extremely reticent about using their membranes/modules on caustic.
While membranes that specifically concentrate sodium do exist (Nafion), they are
extremely expensive, and would not be viable in large volume applications.
5
What emerged therefore, was that :
(i) systems for the cleanup of caustic (without concentration) are readily available
and have been widely tested. They use MF or UF to remove suspended solids
and colloids, possibly followed by NF for small organics.
(ii) systems for the concentration of caustic streams using membranes is not viable at
present.
Hence, the project would limit itself to processes for the clean-up of caustic streams,
i.e. spent CIP and bottle wash bath effluent, and will not consider the concentration of
rinse bath effluent.
3 MEMBRANES AND TEST SUSPENSIONS
3.1 Choice and Procurement of Membranes
South Africa had two locally developed membrane technologies :- MF and UF. The
MF technology is the woven fibre microfilter (WFMF) developed at the University of
Natal, and fabricated by Gelvanor. Two UF technologies are available. Tubular UF
(TUF) was developed by the Institute of Polymer Science, University of Stellenbosch,
and is manufactured by Envig. Capillary UF (CUF) was also developed by the Institute
of Polymer Science, and is available from FiltRsa. It was decided that WFMF and CUF
would be the first choices for MF and UF test membranes.
South Africa does not however have any locally developed NF or RO technologies that
could be used to remove very fine organics. Following on from the internet survey,
various overseas membrane suppliers were identified as possible suppliers of caustic
resistant NF membranes. Firstly, attempts were made to obtain further information and
membranes via their local agents. This did not prove successful, with most of the local
agents referring queries to their overseas principals. Next, various overseas suppliers
were contacted via email to obtain further data on their systems. However, in almost all
instances, communication from the supplier ceased when it was realized that this was
not a commercial enquiry.
The only company that proved helpful was PCI Membranes in England, following a
visit from a member of the project team. They indicated that they would be prepared to
supply membranes and modules, and would not insist on supplying systems. One of
their NF membranes had apparently been used in caustic cleanup. After various
negotiations, they supplied a set of test membranes (NF) at no charge.
6
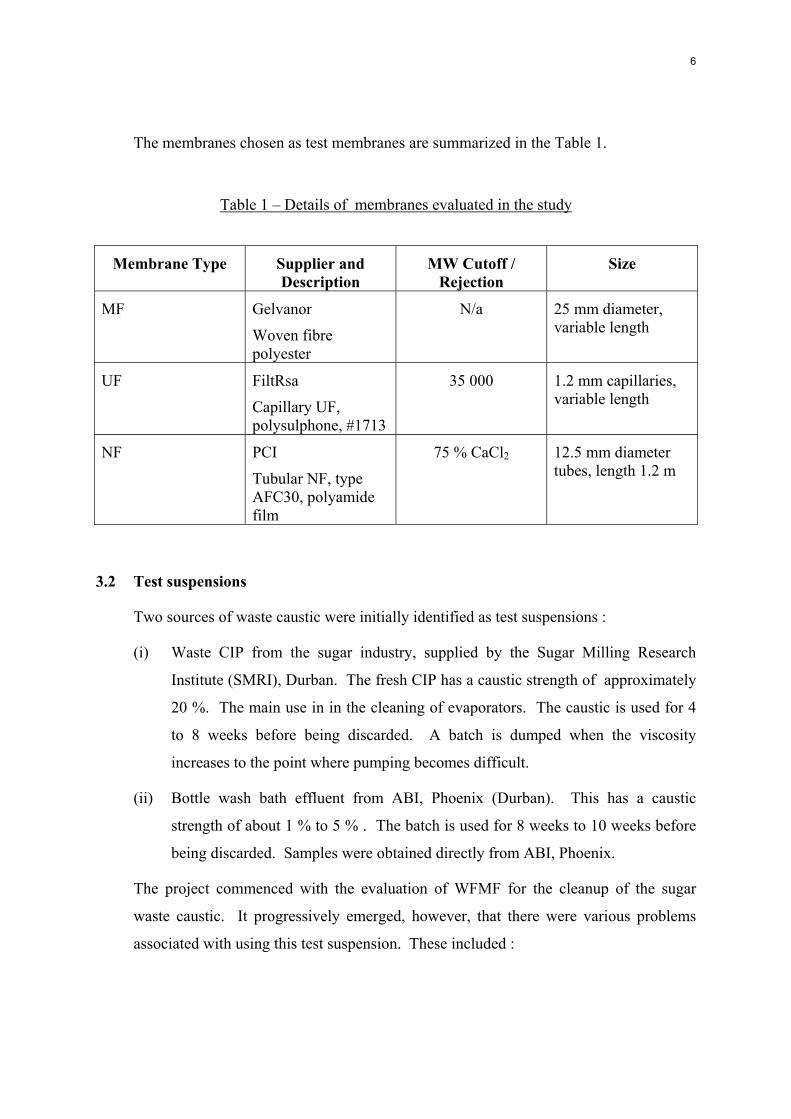
The membranes chosen as test membranes are summarized in the Table 1.
Table 1 – Details of membranes evaluated in the study
Membrane Type Supplier and Description
MW Cutoff / Rejection
Size
MF Gelvanor
Woven fibre polyester
N/a 25 mm diameter, variable length
UF FiltRsa
Capillary UF, polysulphone, #1713
35 000 1.2 mm capillaries, variable length
NF PCI
Tubular NF, type AFC30, polyamide film
75 % CaCl2 12.5 mm diameter tubes, length 1.2 m
3.2 Test suspensions
Two sources of waste caustic were initially identified as test suspensions :
(i) Waste CIP from the sugar industry, supplied by the Sugar Milling Research
Institute (SMRI), Durban. The fresh CIP has a caustic strength of approximately
20 %. The main use in in the cleaning of evaporators. The caustic is used for 4
to 8 weeks before being discarded. A batch is dumped when the viscosity
increases to the point where pumping becomes difficult.
(ii) Bottle wash bath effluent from ABI, Phoenix (Durban). This has a caustic
strength of about 1 % to 5 % . The batch is used for 8 weeks to 10 weeks before
being discarded. Samples were obtained directly from ABI, Phoenix.
The project commenced with the evaluation of WFMF for the cleanup of the sugar
waste caustic. It progressively emerged, however, that there were various problems
associated with using this test suspension. These included :

7
(i) vast differences between batches of waste caustic
(ii) difficulties with obtain regular test samples. All test samples had to be obtained
directly from SMRI, and could not be obtained directly from the refineries. Our
contact person at SMRI changed thrice due to resignations, and this eventually
impacted negatively on communications.
(iii) A lack of clear direction as to what we were supposed to achieve. For example,
we were informed that spent caustic was dumped when the viscosity reached a
certain value. However on a visit to Illovo sugar in Mtubatuba a member of the
project tea was told that this was not so. Three different caustic concentrations
are used, 30 %(new), 20 % and a low concentration caustic( 2 %), each with a
different cleaning application. The concentrated caustic is made up as required.
When the concentrated solution is “spent”, it is diluted for use in the other
cleaning applications.
It then emerged that SMRI was initiating its own investigations into the use of
membranes for caustic cleanup. The project team then decided to cease investigations
on the sugar spent caustic, and to focus on the bottle wash caustic from ABI.
Accordingly, the UF and NF investigations were performed on the ABI caustic only.
4 EXPERIMENTAL
Four experimental rigs were employed in this study, viz. flat-sheet batch filtration,
woven fibre crossflow microfiltration, tubular nanofiltration and capillary
ultrafiltration. These are described below.
4.1 Flat-sheet rig
The flat-sheet rig is a cylindrical stainless steel vessel of volume 400 ml. The vessel
comprises of two sections locked together by two bolts. The upper section has a volume
of 400 ml and serves as the feed tank. It is fitted with a magnetic stirrer. The bottom
section is merely a steel base within which is a porous plastic disc of diameter 76 mm.
When the base of the vessel is separated from the main cylinder by opening the two
bolts, this allows one to place any type of flat sheet filters onto the porous plastic disc.
An O-ring is used to keep the filtering discs in place and this ring also acts as a sealant
8
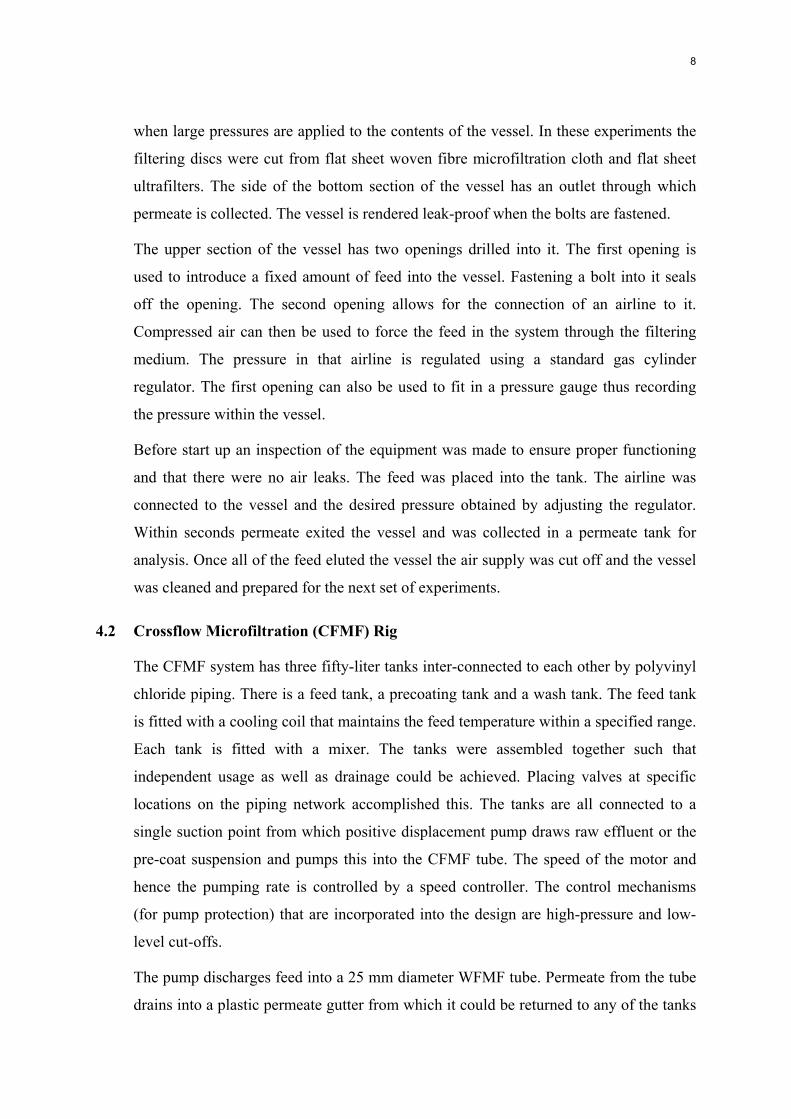
when large pressures are applied to the contents of the vessel. In these experiments the
filtering discs were cut from flat sheet woven fibre microfiltration cloth and flat sheet
ultrafilters. The side of the bottom section of the vessel has an outlet through which
permeate is collected. The vessel is rendered leak-proof when the bolts are fastened.
The upper section of the vessel has two openings drilled into it. The first opening is
used to introduce a fixed amount of feed into the vessel. Fastening a bolt into it seals
off the opening. The second opening allows for the connection of an airline to it.
Compressed air can then be used to force the feed in the system through the filtering
medium. The pressure in that airline is regulated using a standard gas cylinder
regulator. The first opening can also be used to fit in a pressure gauge thus recording
the pressure within the vessel.
Before start up an inspection of the equipment was made to ensure proper functioning
and that there were no air leaks. The feed was placed into the tank. The airline was
connected to the vessel and the desired pressure obtained by adjusting the regulator.
Within seconds permeate exited the vessel and was collected in a permeate tank for
analysis. Once all of the feed eluted the vessel the air supply was cut off and the vessel
was cleaned and prepared for the next set of experiments.
4.2 Crossflow Microfiltration (CFMF) Rig
The CFMF system has three fifty-liter tanks inter-connected to each other by polyvinyl
chloride piping. There is a feed tank, a precoating tank and a wash tank. The feed tank
is fitted with a cooling coil that maintains the feed temperature within a specified range.
Each tank is fitted with a mixer. The tanks were assembled together such that
independent usage as well as drainage could be achieved. Placing valves at specific
locations on the piping network accomplished this. The tanks are all connected to a
single suction point from which positive displacement pump draws raw effluent or the
pre-coat suspension and pumps this into the CFMF tube. The speed of the motor and
hence the pumping rate is controlled by a speed controller. The control mechanisms
(for pump protection) that are incorporated into the design are high-pressure and low-
level cut-offs.
The pump discharges feed into a 25 mm diameter WFMF tube. Permeate from the tube
drains into a plastic permeate gutter from which it could be returned to any of the tanks

9
or removed from the system. The reject from the WFMF tubes is returned to the feed
tank. A diaphragm valve located on the reject line controls the pressure in the tubes.
The rig is designed to also operate in a precoat, feed and wash cycle. This is achieved
by simply ensuring that the pump is drawing from the required tank. At the end of the
experiment the system is washed with water (adequate cleaning strategy) and prepared
for the next run.
4.3 Crossflow Nanofiltration (CFNF) Rig
The Nanofiltration rig has three one hundred liter tanks inter-connected to each other by
stainless steel piping. There is a feed tank, a permeate tank and a wash tank. The feed
tank is fitted with a cooling coil, which maintains the feed temperature within range.
Each tank can have a mixer fitted to it. The feed and wash tanks are assembled together
such that independent usage as well as drainage could be achieved. Placing valves at
specific locations on the piping network accomplishes this. The feed and wash tanks are
connected to a single suction point from which a centrifugal pump (fitted with a motor)
draws feed and pumps this into the nanofiltration tube. The speed of the motor and
hence the pumping rate is controlled by a speed controller. The control mechanisms
(for pump protection) that are incorporated into the design are high-pressure and low-
level cut-offs.
The pump discharges feed into a 12.5 mm diameter nanofiltration tube. Permeate from
the membrane drains into a plastic collecting tube holder around the membrane from
which it could be returned to any of the tanks or removed from the system via a
polyethylene hose. The reject from the nanofiltration tube is returned to the feed tank.
A needle valve located on the reject line controls the pressure in the tubes (up to 50
bar). The rig is designed to operate in a feed and wash cycle. This is achieved by simply
ensuring that the pump is drawing from the required tank. At the end of the experiment
the system is washed with water (adequate cleaning strategy) and prepared for the next
run.
4.4 Capillary Ultrafiltration (CUF) Rig
The capillary rig consists of a feed tank, pump and capillary membrane module. The
pump draws feed from the feed tank and pumps this into the capillaries. The required
backpressure in the capillaries is obtained by adjusting the diaphragm valve located on
10
the reject line, which empties into the feed tank. The permeate can be returned to the
feed tank or collected in a separate vessel and analyzed.
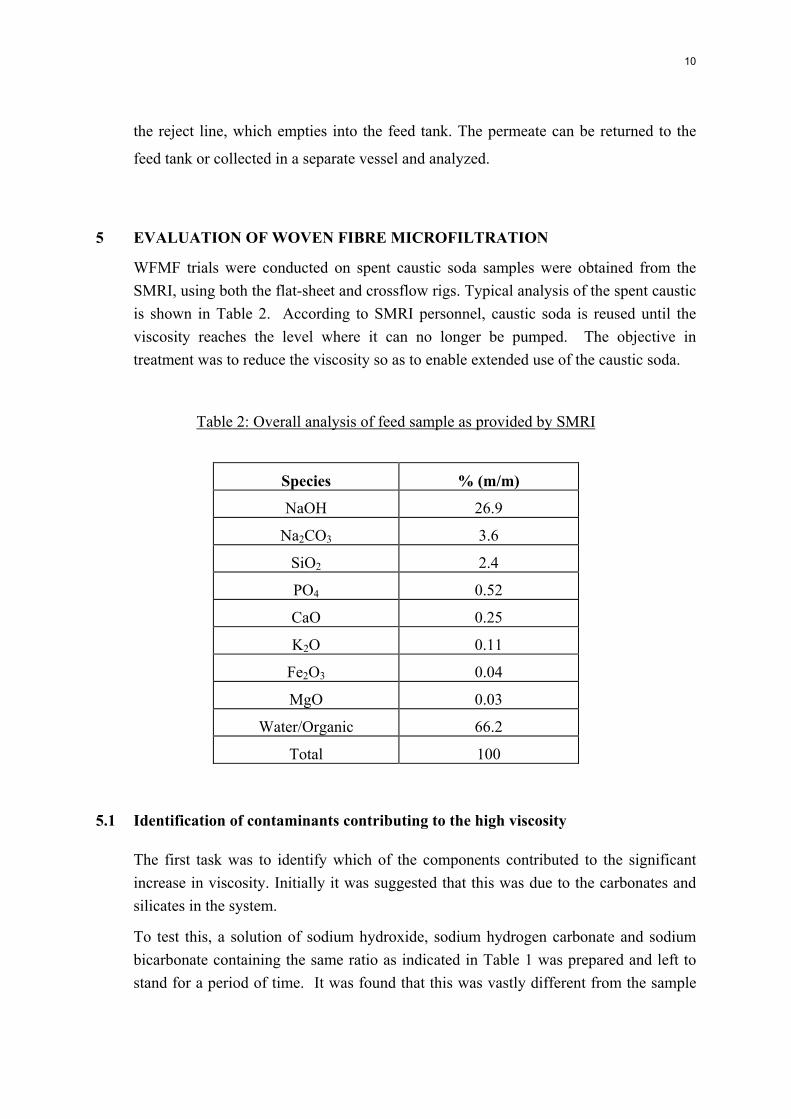
5 EVALUATION OF WOVEN FIBRE MICROFILTRATION
WFMF trials were conducted on spent caustic soda samples were obtained from the
SMRI, using both the flat-sheet and crossflow rigs. Typical analysis of the spent caustic
is shown in Table 2. According to SMRI personnel, caustic soda is reused until the
viscosity reaches the level where it can no longer be pumped. The objective in
treatment was to reduce the viscosity so as to enable extended use of the caustic soda.
Table 2: Overall analysis of feed sample as provided by SMRI
Species % (m/m)
NaOH 26.9
Na2CO3 3.6
SiO2 2.4
PO4 0.52
CaO 0.25
K2O 0.11
Fe2O3 0.04
MgO 0.03
Water/Organic 66.2
Total 100
5.1 Identification of contaminants contributing to the high viscosity
The first task was to identify which of the components contributed to the significant
increase in viscosity. Initially it was suggested that this was due to the carbonates and
silicates in the system.
To test this, a solution of sodium hydroxide, sodium hydrogen carbonate and sodium
bicarbonate containing the same ratio as indicated in Table 1 was prepared and left to
stand for a period of time. It was found that this was vastly different from the sample

11
obtained from SMRI. The solution was significantly less viscous than the sample of
caustic obtained from the SMRI.
The conclusion reached was that the viscosity increase was not due to the carbonates
but could be due to the organic contaminants as these were not added to the solution.
5.2 Development of analytical techniques
The next stage was to focus on establishing reliable analytical techniques for the system
i.e. quantifying the concentrations of sodium hydroxide, sodium hydrogen carbonate,
sodium bicarbonate and total organic content. This would be used to evaluate the
performance of the microfiltration membranes.
5.2.1. Sodium species
Analytical techniques to determine NaOH, Na2CO3, NaHCO3 concentrations were
established with the aid of the analytical chemistry department and the SMRI. It was
then decided to determine the reliability of these tests. A test solution was prepared and
the analysis for the sodium species was carried out. It was found that the experimental
values obtained for the various sodium species did not tally with the actual
concentrations. After much repetitions of the analysis, it was decided to consult a
private consultant, ChemScience Laboratories.
It was found that the analytical techniques were reliable and the discrepancies were due
to the constituents of the test solution. The problem was due to us using three basic
components (NaOH, Na2CO3, NaHCO3) and trying to determine their concentrations.
Due to the high pH and the high concentration of NaOH, only two of the three species
would exist in solution. That is the NaHCO3 would be converted into Na2CO3 using
NaOH. Thus by adding NaHCO3 to the sample resulted in a decrease in NaOH
concentration and an increase in Na2CO3 concentration.
5.2.2. Organics
Since it seemed that low concentrations of organic material could be the major
contributor to the increase in viscosity, a concerted effort was made to determine the
organic content and constituents of the spent caustic. Two methods were proposed, viz.
HPLC and TOC.
Consulting with analytical chemists at M L Sultan indicated that due to the high
concentration of NaOH, the HPLC could not be used as it would damage the column.
Similar problems were experienced with attempts to measure TOC. In the greater
Durban area, none of the laboratories contacted were prepared to do the analysis, since
12
concentrated caustic is too corrosive. The option of dilution was discarded since
significant dilution is required and the organics would fall below the detection limits of
the instruments.
After spending quite some effort on attempting to quantify organics, it wa eventually
decided that this was not easily achievable. The project team then decided to revert to
viscosity measurements as the indication of effectiveness of cleaning the spent caustic.
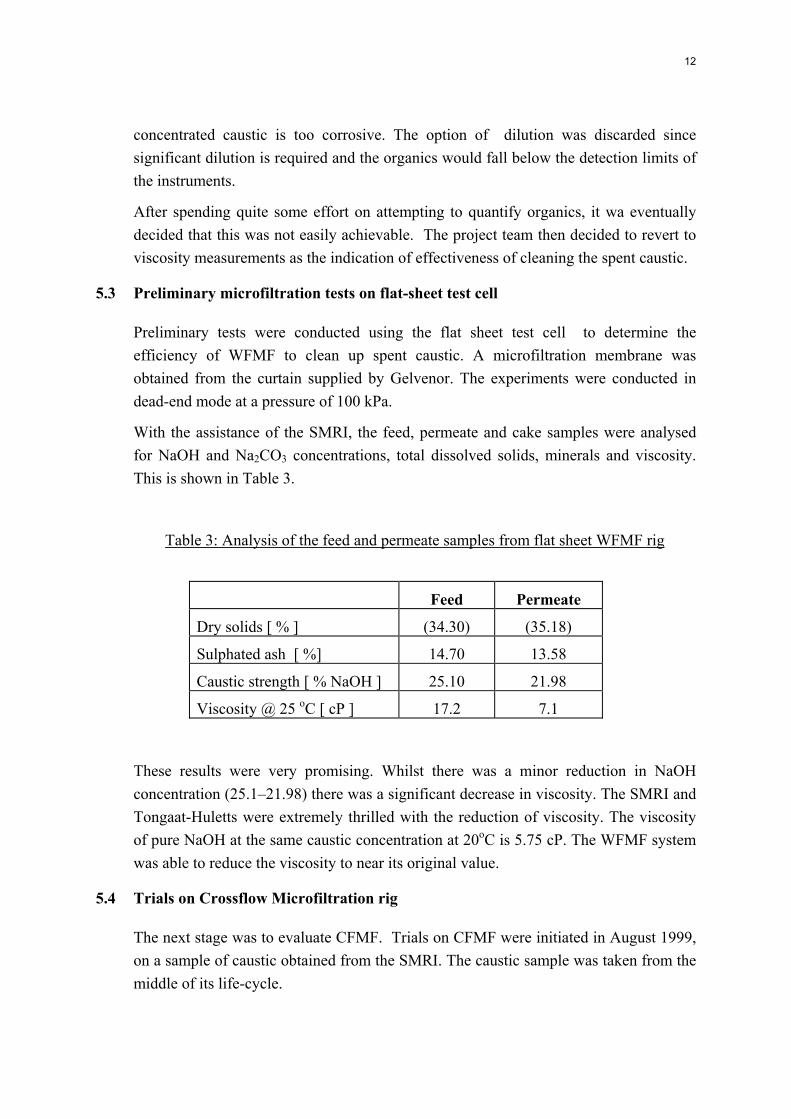
5.3 Preliminary microfiltration tests on flat-sheet test cell
Preliminary tests were conducted using the flat sheet test cell to determine the
efficiency of WFMF to clean up spent caustic. A microfiltration membrane was
obtained from the curtain supplied by Gelvenor. The experiments were conducted in
dead-end mode at a pressure of 100 kPa.
With the assistance of the SMRI, the feed, permeate and cake samples were analysed
for NaOH and Na2CO3 concentrations, total dissolved solids, minerals and viscosity.
This is shown in Table 3.
Table 3: Analysis of the feed and permeate samples from flat sheet WFMF rig
Feed Permeate
Dry solids [ % ] (34.30) (35.18)
Sulphated ash [ %] 14.70 13.58
Caustic strength [ % NaOH ] 25.10 21.98
Viscosity @ 25 oC [ cP ] 17.2 7.1
These results were very promising. Whilst there was a minor reduction in NaOH
concentration (25.1–21.98) there was a significant decrease in viscosity. The SMRI and
Tongaat-Huletts were extremely thrilled with the reduction of viscosity. The viscosity
of pure NaOH at the same caustic concentration at 20oC is 5.75 cP. The WFMF system
was able to reduce the viscosity to near its original value.
5.4 Trials on Crossflow Microfiltration rig
The next stage was to evaluate CFMF. Trials on CFMF were initiated in August 1999,
on a sample of caustic obtained from the SMRI. The caustic sample was taken from the
middle of its life-cycle.
13
The feed consisted of supernatent only, i.e. the samples were allowed to settle in their
containers and the supernatent was carefully poured off. The viscosity of the feed was
10 cP. For the first 17 minutes the pressure was maintained at 50 kPa and the tube
velocity set to 0.5 m/s. Thereafter the pressure was increased to 200 kPa and the
velocity was increased to 2 m/s.
It was found that the viscosity of the permeate started at a low value of 4.32 cP and
increased to 8.5 cP after 3 hours of operation. During the first 17 minutes the viscosity
increased from 4.32 cP to 6.72 cP. Two minutes after increasing the pressure to 200
kPa, the viscosity of the permeate was 7.39 cP.
The low feed viscosity is due to the fact that only the supernatant was used. Further,
the sample of the feed was taken from the feed tank and the low viscosity may also be
due to the water contained in the lines/pipes, which mixed with the supernatant. The
initial low viscosity of the product could also be due to dilution from residual water in
the piping. However the subsequent increase in viscosity on increasing the pressure
was unexpected. This indicated the possibility that the fouling layer may be gel-like,
and was being forced through the tube wall at higher pressures.
Due to the limited amount of sample available, as well as the spurious effects
introduced by the large dead volume in the crossflow rig, it was decided to revert to
experimentation on the flat sheet test cell.
5.5 Further Trials on the Flat Sheet WFMF
5.5.1. Replicability of previous performance
The objective here was to determine whether the excellent results obtained in the
preliminary trials were replicable.
A sample of mixed feed (i.e. the suspension was well mixed) was filtered using the flat
sheet cell with a woven fibre microfiltration membrane. The operating pressure was
200 kPa.
The feed viscosity was 19.2 cP, while the viscosity of the combined permeate was 13.2
cP.
This result indicated that the microfilter was able to reduce the viscosity significantly.
However this result differ significantly from the initial test conducted in 1999, where
the viscosity was reduced from 17.1 cP to 7.1 cP. The difference between these two

14
tests was operating pressure (200 kPa in this test, and 100 kPa previously). Hence, it
was decided that the effect of pressure should be investigated.
5.5.2. Effect of Operating Pressure
Two feed samples were used - a mixed feed, and a supernatent. For each feed a series
of runs were performed at different operating pressures. The results are presented in
Table 4 below.
Table 4 – Viscosity Change in Flat Sheet WFMF
Feed Type Mixed Supernatent
Feed Viscosity 15.12 12
Combined Permeate Viscosity (cP)
Operating Pressure
60 7.97
100 9.12
160 10.08
200 10.68
75 11.52
150 11.04
190 11.8
200 8.76
In experiments on the supernatent only, there is a progressive increase in permeate
viscosity as the operating pressure is increased. This seems to indicate that the foulants
are most probably forming an unstable gel-like fouling layer that is being forced
through the membrane at higher pressures. For the runs on the mixed feed, ther is no
clear trend with operating pressure.
Overall, however, the permeate viscosities are much higher than that obtained in the
preliminary test. This could possibly be due to a difference in the nature of the feed. In
the preliminary test, the feed sample was obtained at the end of the caustic life-cycle,
i.e. just before the caustic could be dumped. This would obviously have a high
15
concentration of contaminants, as indicated by the high viscosity of 17.1 cP. The
sample used in all the above experiments was obtained near the middle of the caustic
life-cycle, and accordingly has a lower viscosity (15.2 cP). It could occur that as the
concentration of contaminants increases, a more stable fouling layer forms, yielding a
better performance on the microfilter.
5.5.3. Effect of Precoating
In general, precoating a woven fibre microfilter increases it retention capabilities. The
effect of precoating the microfilter with powdered activated carbon (PAC) and
limestone was investigated.
For the PAC, a suspension of 15 g/l in water was made up, and the microfilter disc was
precoated with this at a pressure of 100 kPa. The feed sample was then introduced into
the cell and filtered at 200 kPa. For the PAC trial, only the supernatent was used.
The results were as follows :
Feed Viscosity (supernatent) = 11.04 cP
Permeate Viscosity = 10.56 cP
For the limestone experiment, a suspension of limestone (KULU 5) and water was
made to a concentration of 15 g/l. The microfilter was pre-coated using a pressure of
200 kPa. The feed sample was then introduced, and filtered at a pressure of 200 kPa.
For the limestone trials, both supernatent and mixed feed were investigated.
These results were as follows :
Feed Viscosity (supernatent) = 11.04 cP
Permeate Viscosity = 10.56 cP
Feed Viscosity (mixed feed) = 16.32 cP
Permeate Viscosity = 11.04 cP
The above indicated that precoating the microfilter did not yield any significant
improvement in performance.
5.6 Summary
Initial trials using WFMF on CIP waste from the sugar industry indicated that the
microfilter was capable of reducing the viscosity down to acceptable limits. However,
16
this performance could not be obtained consistently and repeatibly. In all trials, WFMF
did effect some reduction in viscosity, but this was generally inadequate for reuse. The
effects of varying the operating pressure and the effects of precoating the filter were
also investigated. Precoating did not achieve any significant improvement in
performance.
It must be concluded that WFMF alone is inadequate to recycle spent CIP solution from
the sugar industry.
However, WFMF could play a role as a pretreatment step, if it is found that an
expensive or exotic membrane is necessary to remove the target contaminants that
contribute to the viscosity increase. In this instance, the WFMF could remove the
grosser contaminants and thus extend the life of the expensive membrane.
6 EVALUATION OF ULTRAFILTRATION
All the ultrafiltration trials were conducted on spent bottle wash solution obtained from
ABI. Preliminary trials were conducted using the flat sheet rig, and these were
followed by trials on the CUF rig.
A major problem was experienced with establishing criteria for the reuse of spent
caustic. Various enquiries to various personnel at the ABI site proved negative, since it
seemed that recycling the spent caustic had not really been given serious consideration
previously.
The fresh caustic includes various proprietary additives to reduce foaming etc. The
spent caustic is contaminated with suspended material and probably some organics. It
is easy to quantify the suspended material, but more difficult to quantify the organic
content. The approach taken by the project team was to assume that the major
contaminant was the suspended solids. The objective would then be to determine
whether the suspended solids could be reduced to very low levels. If/when this is
achieved, the product (cleaned) caustic would have to be tested by the user to establish
whether its cleaning characteristics are similar or different to the fresh caustic.
17
6.1 Flat-sheet Trials
Caustic samples were collected every two weeks (over an eight week in-use cycle) from
ABI. These samples were filtered in a test cell at 1 bar using a flat sheet UF membrane
as the separating barrier. The flat-sheet UF membranes were obtained from the Institute
of Polymer Science, University of Stellenbosch, and were cut into disks from the flat
sheet cell. The flat sheets had a similar molecular weight cutoff to the capillary UF
membranes (35 000).
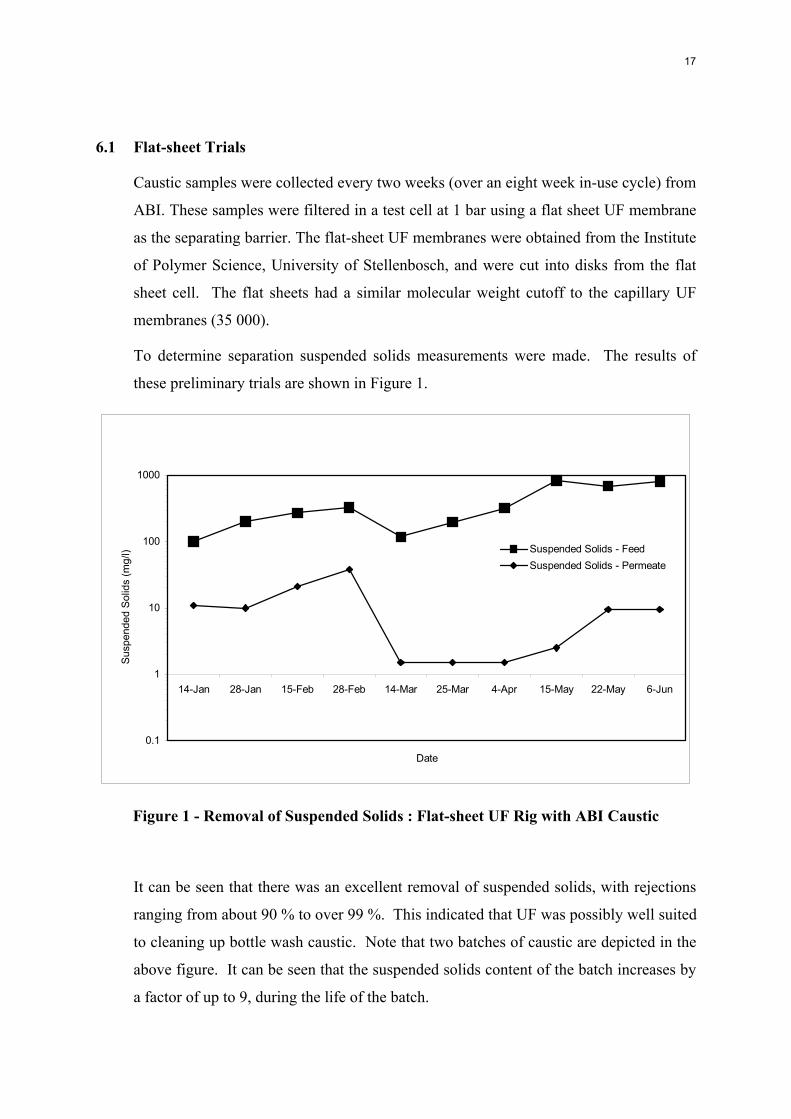
To determine separation suspended solids measurements were made. The results of
these preliminary trials are shown in Figure 1.
0.1
1
10
100
1000
14-Jan 28-Jan 15-Feb 28-Feb 14-Mar 25-Mar 4-Apr 15-May 22-May 6-Jun
Date
Sus
pend
ed S
olid
s (m
g/l) Suspended Solids - Feed
Suspended Solids - Permeate
Figure 1 - Removal of Suspended Solids : Flat-sheet UF Rig with ABI Caustic
It can be seen that there was an excellent removal of suspended solids, with rejections
ranging from about 90 % to over 99 %. This indicated that UF was possibly well suited
to cleaning up bottle wash caustic. Note that two batches of caustic are depicted in the
above figure. It can be seen that the suspended solids content of the batch increases by
a factor of up to 9, during the life of the batch.
18
6.2 Capillary UF Trials
The waste caustic is pumped from a 5-litre storage tank via a peristaltic pump into the
capillary module, which comprises 20 capillaries, each with a length of 0.22m and
inside diameter of 0.0012 m. A diaphragm valve downstream of the module was used
to regulate the operating pressure. A glycerine-filled pressure gauge is located between
the module and the diaphragm valve to monitor the pressure in the line. 30 ml samples
of permeate were collected periodically for analysis. The remainder of the permeate
and the concentrate were returned to the feed tank. The system was thus operated in an
approximate constant feed concentration mode.
All runs reported here were conducted at a pressure of approximately 1 bar, and at a
tube velocity of 1 m/s.
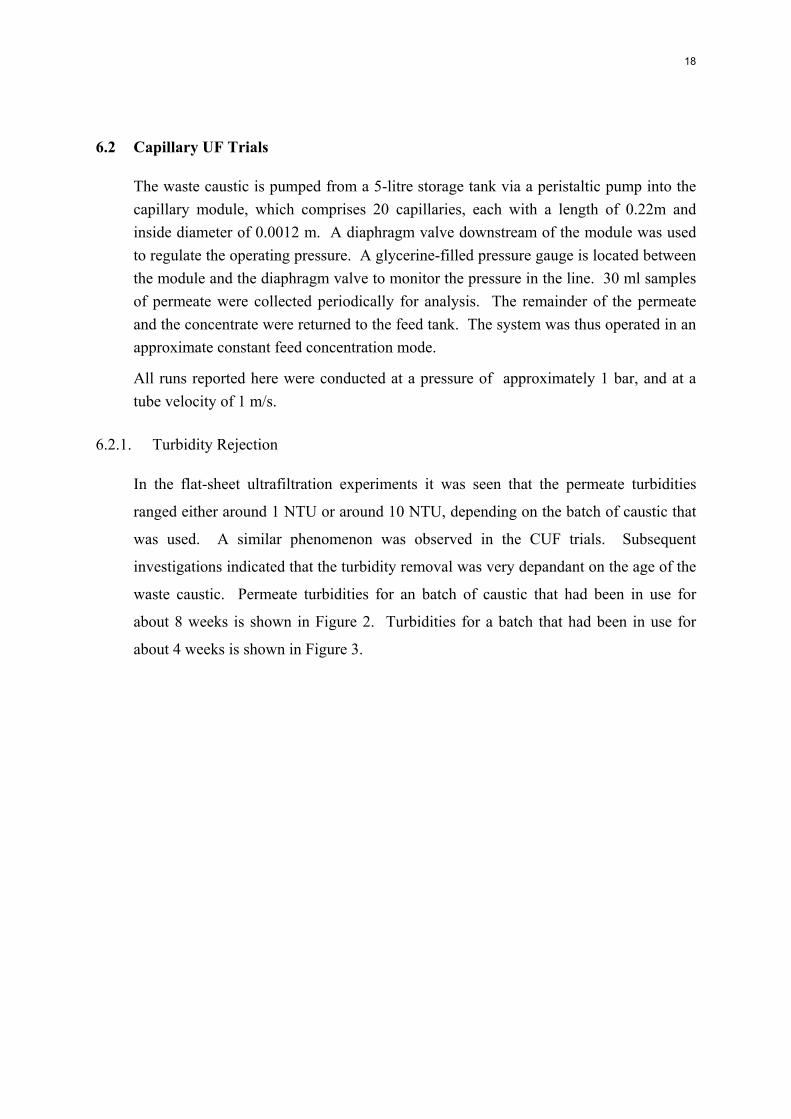
6.2.1. Turbidity Rejection
In the flat-sheet ultrafiltration experiments it was seen that the permeate turbidities
ranged either around 1 NTU or around 10 NTU, depending on the batch of caustic that
was used. A similar phenomenon was observed in the CUF trials. Subsequent
investigations indicated that the turbidity removal was very depandant on the age of the
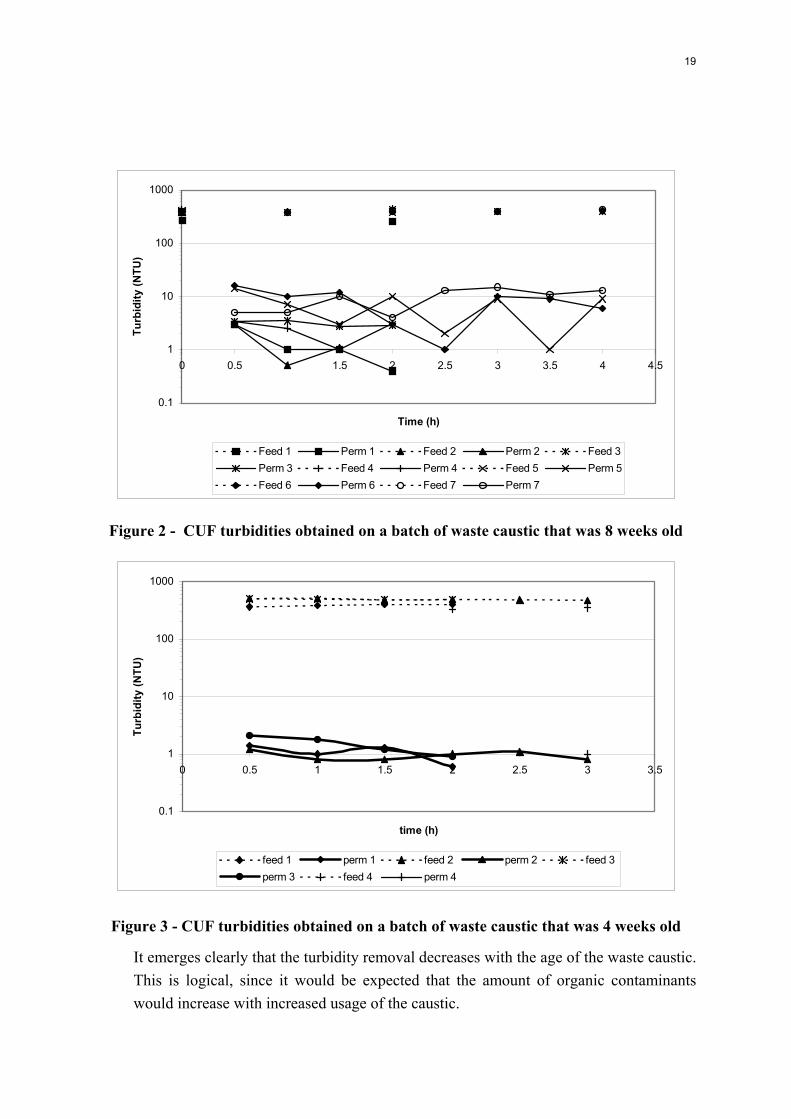
waste caustic. Permeate turbidities for an batch of caustic that had been in use for
about 8 weeks is shown in Figure 2. Turbidities for a batch that had been in use for
about 4 weeks is shown in Figure 3.
19
0.1
1
10
100
1000
0 0.5 1 1.5 2 2.5 3 3.5 4 4.5
Time (h)
Tu
rbid
ity
(NT
U)
Feed 1 Perm 1 Feed 2 Perm 2 Feed 3
Perm 3 Feed 4 Perm 4 Feed 5 Perm 5
Feed 6 Perm 6 Feed 7 Perm 7
Figure 2 - CUF turbidities obtained on a batch of waste caustic that was 8 weeks old
0.1
1
10
100
1000
0 0.5 1 1.5 2 2.5 3 3.5
time (h)
Tu
rbid
ity
(NT
U)
feed 1 perm 1 feed 2 perm 2 feed 3
perm 3 feed 4 perm 4
Figure 3 - CUF turbidities obtained on a batch of waste caustic that was 4 weeks old
It emerges clearly that the turbidity removal decreases with the age of the waste caustic.
This is logical, since it would be expected that the amount of organic contaminants
would increase with increased usage of the caustic.
20
Despite the above, however, the turbidity removal is still very good. In the instance of
caustic that had been in use for up to 4 weeks, final turbidities < 2 NTU are achieved
for feed turbidities ranging from 300 NTU to 500 NTU. In the instance of old caustic,
final turbidities of around 10 NTU are achieved for feed turbidities around 400 NTU to
500 NTU. From the point of turbidity removal, therefore, the CUF process is capable
of removing most of the suspended material in the waste caustic, enabling reuse of the
caustic.
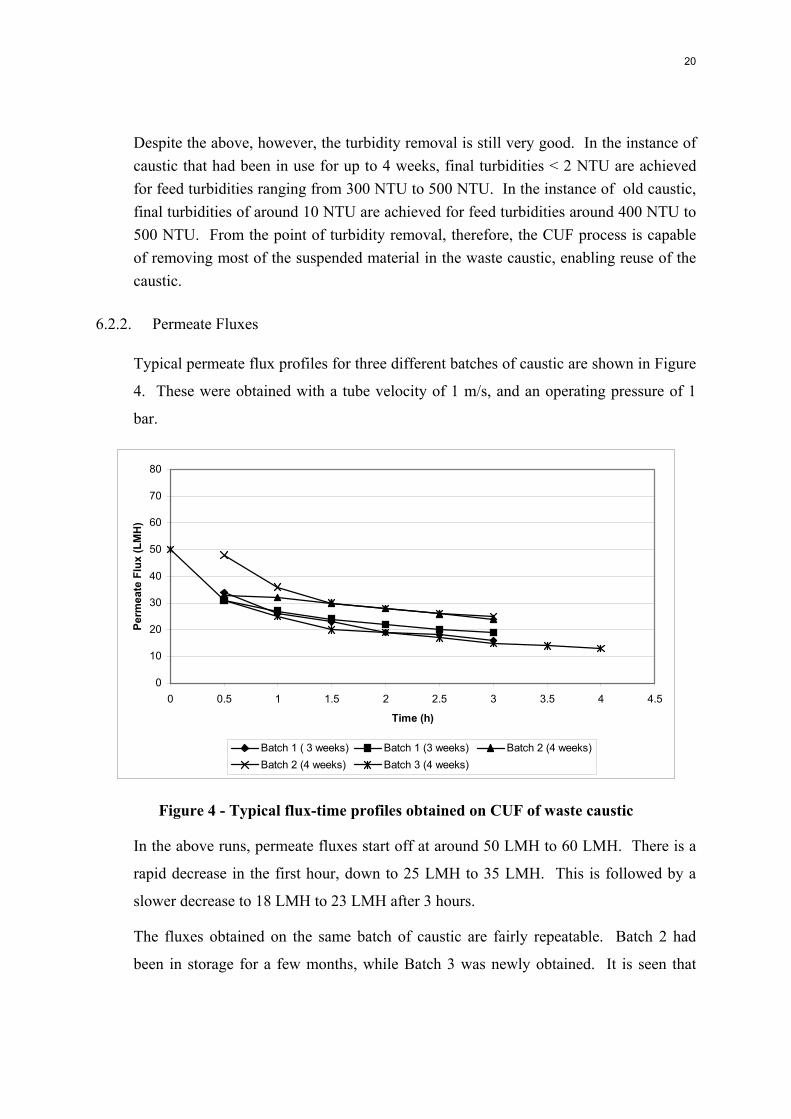
6.2.2. Permeate Fluxes
Typical permeate flux profiles for three different batches of caustic are shown in Figure
4. These were obtained with a tube velocity of 1 m/s, and an operating pressure of 1
bar.
0
10
20
30
40
50
60
70
80
0 0.5 1 1.5 2 2.5 3 3.5 4 4.5
Time (h)
Per
mea
te F
lux
(LM
H)
Batch 1 ( 3 weeks) Batch 1 (3 weeks) Batch 2 (4 weeks)
Batch 2 (4 weeks) Batch 3 (4 weeks)
Figure 4 - Typical flux-time profiles obtained on CUF of waste caustic
In the above runs, permeate fluxes start off at around 50 LMH to 60 LMH. There is a
rapid decrease in the first hour, down to 25 LMH to 35 LMH. This is followed by a
slower decrease to 18 LMH to 23 LMH after 3 hours.
The fluxes obtained on the same batch of caustic are fairly repeatable. Batch 2 had
been in storage for a few months, while Batch 3 was newly obtained. It is seen that

21
there is a difference in the permeate fluxes obtained, although both batches had been in
use online for the same period (4 weeks).
Backflushing, i.e. periodically reversing the direction of flow through the membrane, is
commonly used as a means of flux enhancement. During backflushing, the clean water
is pumped from the shell side through the walls of the capillaries, and into the capillary
lumens. This flow serves to remove some of the accumulated fouling layer, which is
exits in the concentrate. The effectiveness of backflushing in the current system was
investigated. A typical flux-time plot with backflushing is shown in Figure 5. Here,
the system was backflushed for 15 minutes after every hour and half of filtration time.
0
5
10
15
20
25
30
35
40
45
0 1 2 3 4 5 6 7 8
Time (hrs)
Per
mea
te F
lux
(LM
H)
Figure 5 - Effect of backflushing on permeate flux profile
On comparing Figures 4 and 5, it is clear that backflushing is very effective in
maintaining the permeate flux. In the above example, the backflushing period was 20
minutes. Investigations into the effect of backflushing period on backflush efficiency
were performed. It emerged that backflushing for 5 minutes, followed by flushing out
the system for a further 5 minutes, was as effective as backflushing for 20 minutes.
This was adopted as the backflush strategy in subsequent investigations.

22
The effect of feed age on backflush efficiency was investigated on waste caustic
obtained adter 3 weeks, 4 weeks and 6 weeks of utilisation respectively. The results are
shown in Figures 6 to 8.
0
10
20
30
40
50
60
70
0 1 2 3 4 5 6 7 8
Time (hrs)
Per
mea
te F
lux
(LM
H)
Figure 6 - Effect of backflushing : feed age of 3 weeks
0
5
10
15
20
25
30
35
40
45
50
0 1 2 3 4 5 6 7 8
Time (hrs)
Pe
rmea
te F
lux
(LM
H)
Figure 7 - Effective backflushing : feed age of 4 weeks
23
0
5
10
15
20
25
30
35
40
45
50
0 5 10 15 20 25 30 35
Time (hrs)
Per
mea
te F
lux
(LM
H)
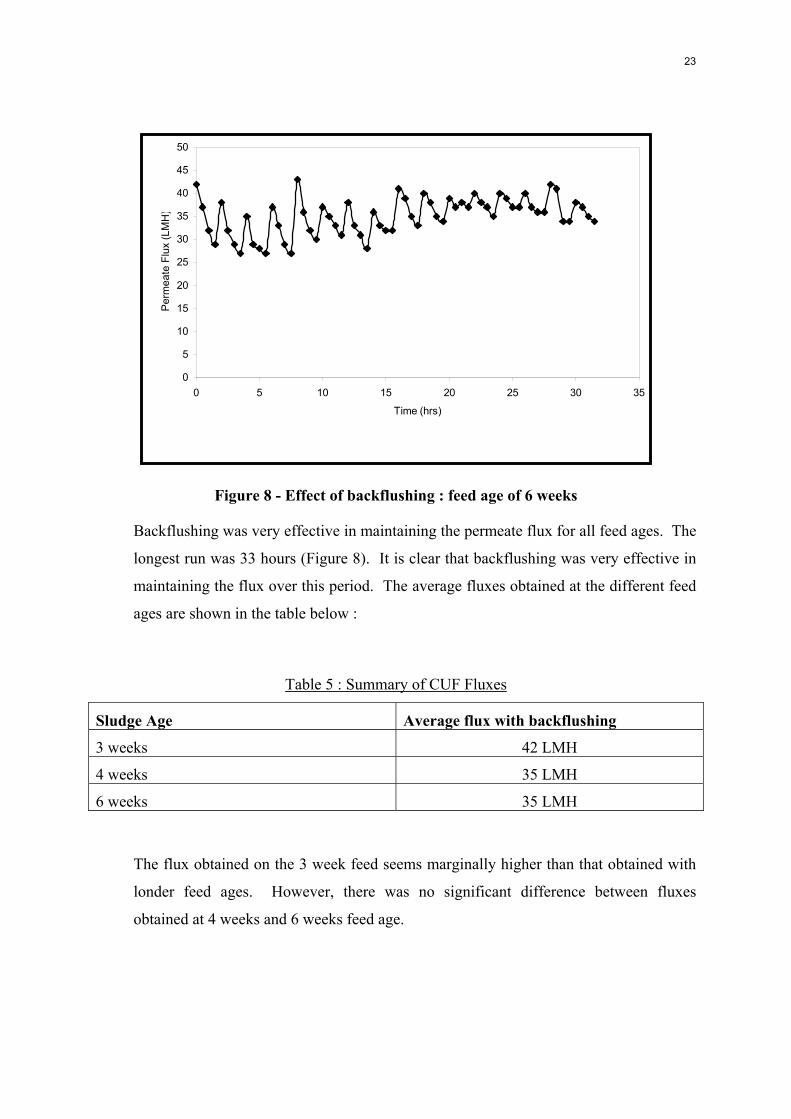
Figure 8 - Effect of backflushing : feed age of 6 weeks
Backflushing was very effective in maintaining the permeate flux for all feed ages. The
longest run was 33 hours (Figure 8). It is clear that backflushing was very effective in
maintaining the flux over this period. The average fluxes obtained at the different feed
ages are shown in the table below :
Table 5 : Summary of CUF Fluxes
Sludge Age Average flux with backflushing
3 weeks 42 LMH
4 weeks 35 LMH
6 weeks 35 LMH
The flux obtained on the 3 week feed seems marginally higher than that obtained with
londer feed ages. However, there was no significant difference between fluxes
obtained at 4 weeks and 6 weeks feed age.
24
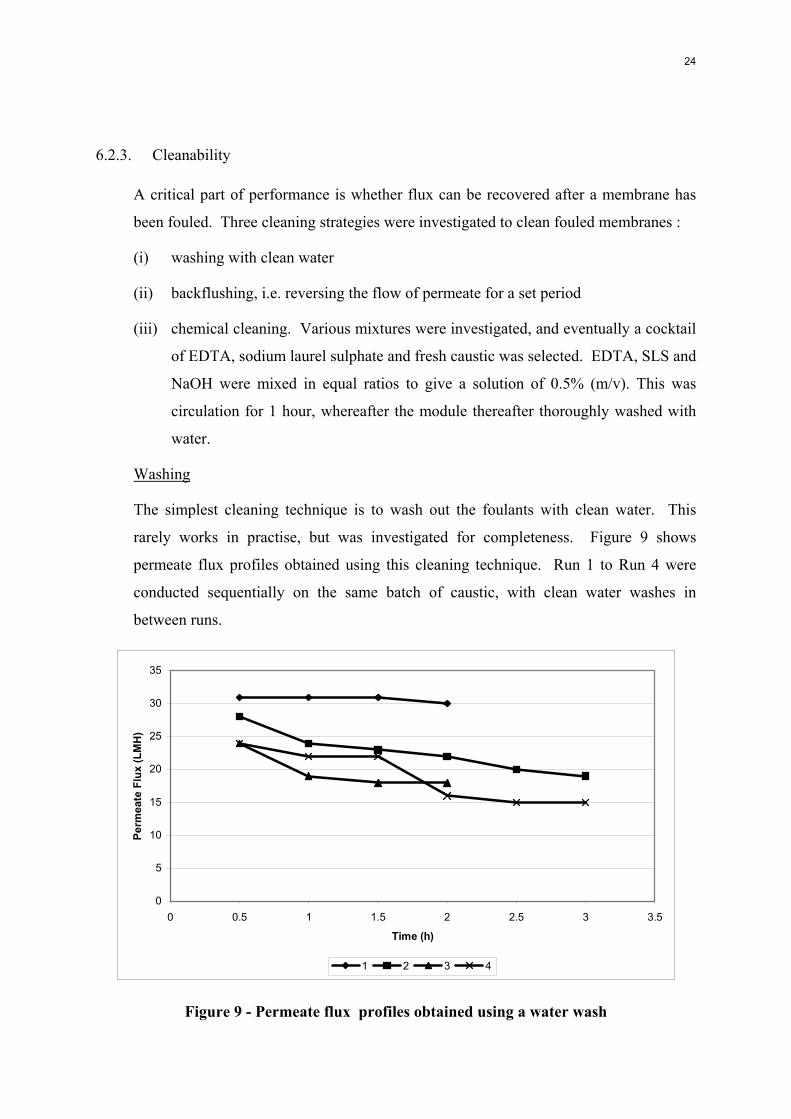
6.2.3. Cleanability
A critical part of performance is whether flux can be recovered after a membrane has
been fouled. Three cleaning strategies were investigated to clean fouled membranes :
(i) washing with clean water
(ii) backflushing, i.e. reversing the flow of permeate for a set period
(iii) chemical cleaning. Various mixtures were investigated, and eventually a cocktail
of EDTA, sodium laurel sulphate and fresh caustic was selected. EDTA, SLS and
NaOH were mixed in equal ratios to give a solution of 0.5% (m/v). This was
circulation for 1 hour, whereafter the module thereafter thoroughly washed with
water.
Washing
The simplest cleaning technique is to wash out the foulants with clean water. This
rarely works in practise, but was investigated for completeness. Figure 9 shows
permeate flux profiles obtained using this cleaning technique. Run 1 to Run 4 were
conducted sequentially on the same batch of caustic, with clean water washes in
between runs.
0
5
10
15
20
25
30
35
0 0.5 1 1.5 2 2.5 3 3.5
Time (h)
Per
mea
te F
lux
(LM
H)
1 2 3 4
Figure 9 - Permeate flux profiles obtained using a water wash

25
It is clear that washing with clean water has very little potential as a cleaning strategy.
The permeate fluxes for each run are lower than previous runs, and there is a
progressive decrease from 30 LMH to about 15 LMH.
Backflushing and Chemical Cleaning
The project team subsequently decided to use the membrane’s pure water flux (PWF)
as an indication of the efficacy of cleaning, rather than permeate fluxes obtained on
waste caustic. This would eliminate errors due to differing permeate fluxes amongst
different batches of waste caustic.
The procedure in these investigations was as follows :
(i) a new module was made up, and its PWF was measured at a range of pressures.
(ii) The module was then run on waste caustic for a period of three hours. The final
flux obtained on the waste caustic was noted.
(iii) The module was then backflushed for approximately 20 minutes. Firstly the feed
side was closed off, and clean water was pumped in via the shell side. The clean
water permeate the membranes from the outside in, and then left via the reject
side of the module. After about 15 minutes, the reject side was closed, and the
feed side was opened. After a further 5 minutes, the backflush was stopped, and
the module was flushed out by pumping clean water through the membranes, with
a negligible transmembrane pressure.
(iv) Following the backflush, the PWF was measured.
(v) The module was then subjected to a chemical clean. The chemical clean was
performed using EDTA, SLS and NaOH mixed in equal ratios (m/v). This
solution was circulated in the rig for 2 hours. Thereafter the rig was thoroughly
washed of traces of the cleaning solution with water.
(vi) The PWF was determined again.
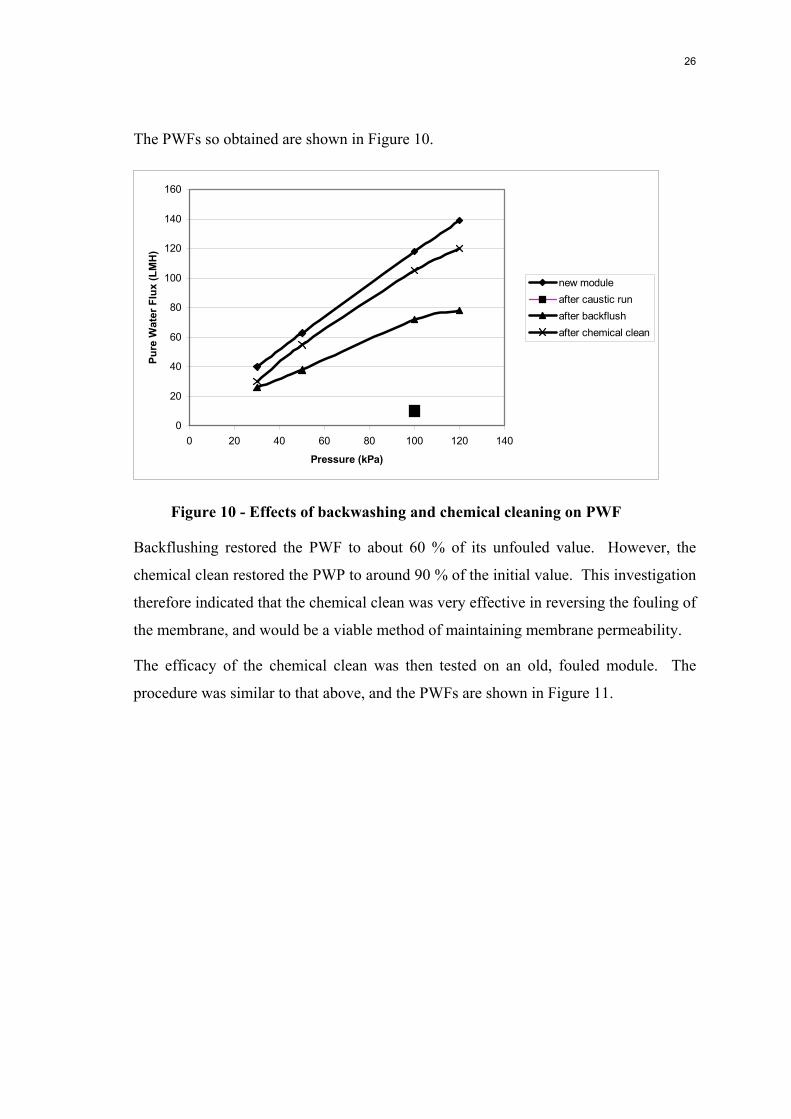
26
The PWFs so obtained are shown in Figure 10.
0
20
40
60
80
100
120
140
160
0 20 40 60 80 100 120 140
Pressure (kPa)
Pu
re W
ater
Flu
x (L
MH
)
new module
after caustic run
after backflush
after chemical clean
Figure 10 - Effects of backwashing and chemical cleaning on PWF
Backflushing restored the PWF to about 60 % of its unfouled value. However, the
chemical clean restored the PWP to around 90 % of the initial value. This investigation
therefore indicated that the chemical clean was very effective in reversing the fouling of
the membrane, and would be a viable method of maintaining membrane permeability.
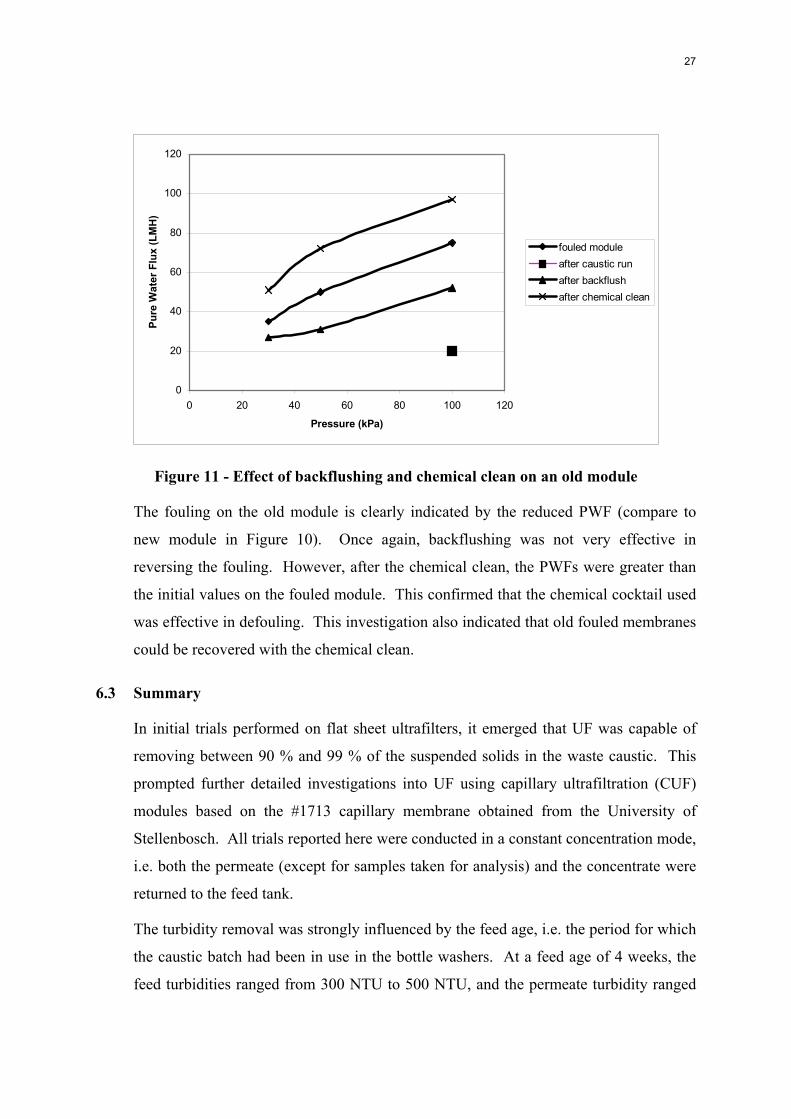
The efficacy of the chemical clean was then tested on an old, fouled module. The
procedure was similar to that above, and the PWFs are shown in Figure 11.
27
0
20
40
60
80
100
120
0 20 40 60 80 100 120
Pressure (kPa)
Pu
re W
ater
Flu
x (L
MH
)
fouled module
after caustic run
after backflush
after chemical clean
Figure 11 - Effect of backflushing and chemical clean on an old module
The fouling on the old module is clearly indicated by the reduced PWF (compare to
new module in Figure 10). Once again, backflushing was not very effective in
reversing the fouling. However, after the chemical clean, the PWFs were greater than
the initial values on the fouled module. This confirmed that the chemical cocktail used
was effective in defouling. This investigation also indicated that old fouled membranes
could be recovered with the chemical clean.
6.3 Summary
In initial trials performed on flat sheet ultrafilters, it emerged that UF was capable of
removing between 90 % and 99 % of the suspended solids in the waste caustic. This
prompted further detailed investigations into UF using capillary ultrafiltration (CUF)
modules based on the #1713 capillary membrane obtained from the University of
Stellenbosch. All trials reported here were conducted in a constant concentration mode,
i.e. both the permeate (except for samples taken for analysis) and the concentrate were
returned to the feed tank.
The turbidity removal was strongly influenced by the feed age, i.e. the period for which
the caustic batch had been in use in the bottle washers. At a feed age of 4 weeks, the
feed turbidities ranged from 300 NTU to 500 NTU, and the permeate turbidity ranged
28
from 0.7 NTU to 2 NTU. At a feed age of 8 weeks, the feed turbidity ranged from 400
NTU to 500 NTU, while the permeate turbidity ranged from 0.4 NTU to 10 NTU.
Permeate fluxes on a 3 week feed started off at around 50 LMH, and declined to about
20 LMH after 3 hours. However, it was found that backflushing was very effective in
maintaining the permeate flux. With backflushing, it was found that permeate fluxes
could be maintained at high values for up to 33 hours. Using a backflushing strategy of
5 minutes backflush every 1.5 hours, gave an average flux of 42 LMH for a 3 week
feed, declining to an average flux of 35 LMH for a 6 weeks old feed.
Three methods of cleaning the membrane were investigated :- cleaning with water;
backflushing; and chemical cleaning. The former two methods were not very effective
in restoring fouled membranes. However, it was found that a chemical cleaning using a
0.5 m/v solution of EDTA, SLS and NaOH in equal parts was very effective in
removing fouling. With this chemical concoction, fouled membranes were consistently
restored to over 90 % of their initial pure water fluxes. Further, it also emerged that old
fouled membranes that had been out of use for some time were also restored by the
chemical clean.
In overview, CUF emerged as been quite promising for the recovery of waste caustic,
with good permeate turbidities, reasonable and stable permeate fluxes, and good
cleanability.
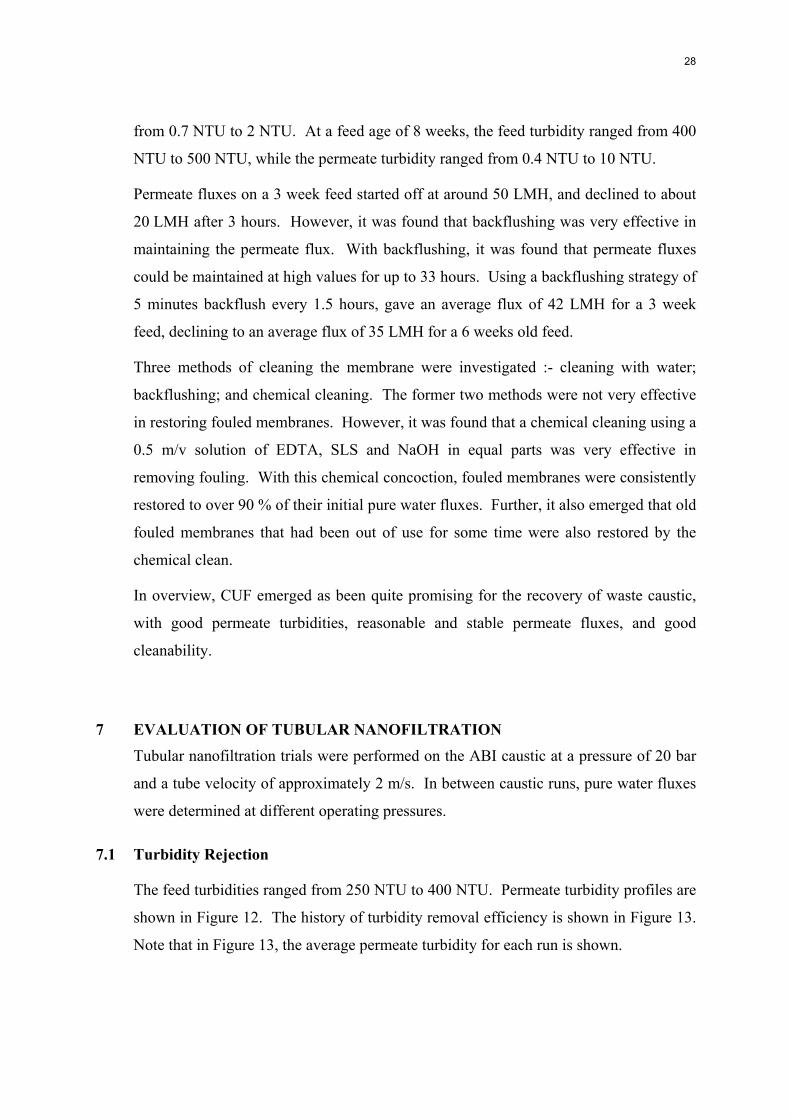
7 EVALUATION OF TUBULAR NANOFILTRATION
Tubular nanofiltration trials were performed on the ABI caustic at a pressure of 20 bar
and a tube velocity of approximately 2 m/s. In between caustic runs, pure water fluxes
were determined at different operating pressures.
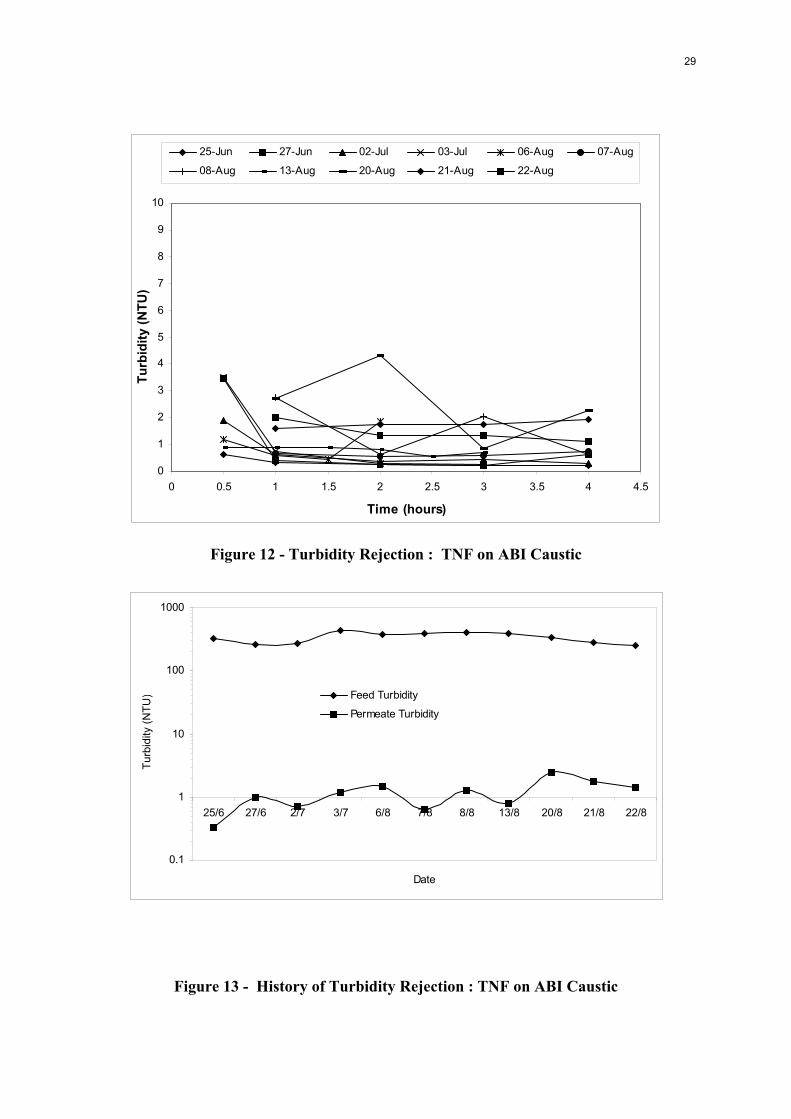
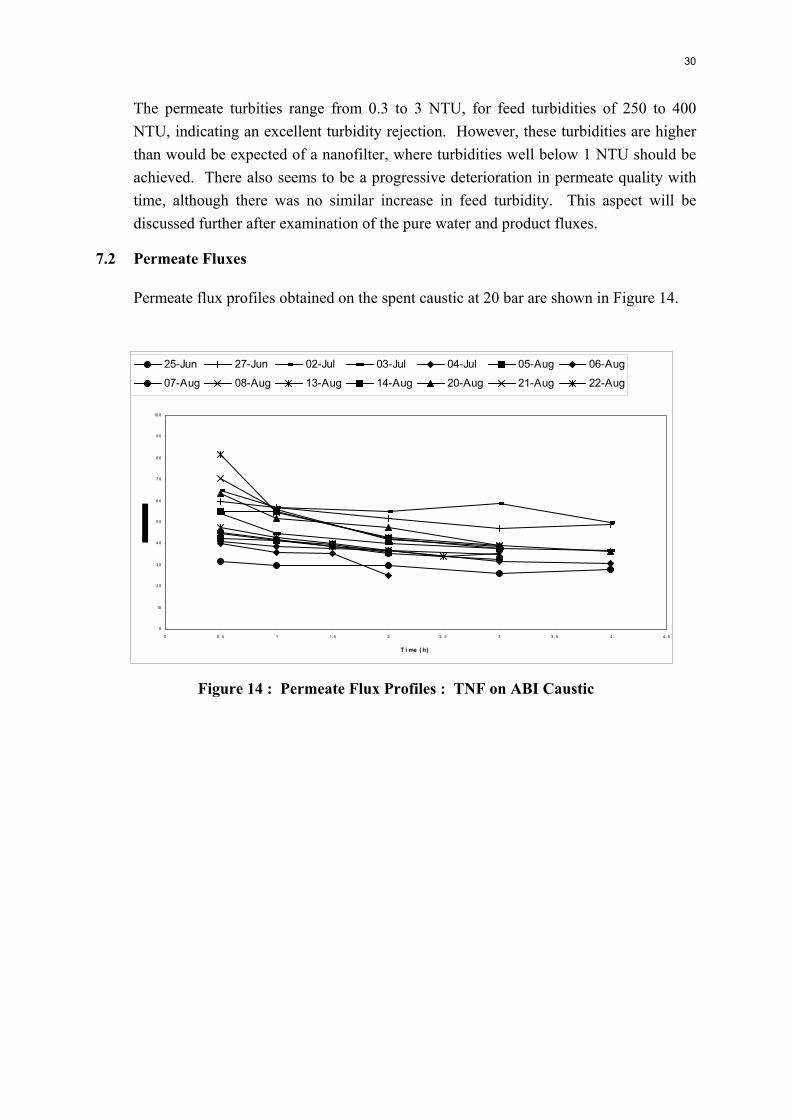
7.1 Turbidity Rejection
The feed turbidities ranged from 250 NTU to 400 NTU. Permeate turbidity profiles are
shown in Figure 12. The history of turbidity removal efficiency is shown in Figure 13.
Note that in Figure 13, the average permeate turbidity for each run is shown.
29
0
1
2
3
4
5
6
7
8
9
10
0 0.5 1 1.5 2 2.5 3 3.5 4 4.5
Time (hours)
Tu
rbid
ity
(NT
U)
25-Jun 27-Jun 02-Jul 03-Jul 06-Aug 07-Aug
08-Aug 13-Aug 20-Aug 21-Aug 22-Aug
Figure 12 - Turbidity Rejection : TNF on ABI Caustic
Figure 13 - History of Turbidity Rejection : TNF on ABI Caustic
0.1
1
10
100
1000
25/6 27/6 2/7 3/7 6/8 7/8 8/8 13/8 20/8 21/8 22/8
Date
Tur
bidi
ty (
NT
U) Feed Turbidity
Permeate Turbidity
30
The permeate turbities range from 0.3 to 3 NTU, for feed turbidities of 250 to 400
NTU, indicating an excellent turbidity rejection. However, these turbidities are higher
than would be expected of a nanofilter, where turbidities well below 1 NTU should be
achieved. There also seems to be a progressive deterioration in permeate quality with
time, although there was no similar increase in feed turbidity. This aspect will be
discussed further after examination of the pure water and product fluxes.
7.2 Permeate Fluxes
Permeate flux profiles obtained on the spent caustic at 20 bar are shown in Figure 14.
Figure 14 : Permeate Flux Profiles : TNF on ABI Caustic
0
10
2 0
3 0
4 0
5 0
6 0
7 0
8 0
9 0
10 0
0 0 . 5 1 1. 5 2 2 . 5 3 3 . 5 4 4 . 5
T i me ( h)
25-Jun 27-Jun 02-Jul 03-Jul 04-Jul 05-Aug 06-Aug
07-Aug 08-Aug 13-Aug 14-Aug 20-Aug 21-Aug 22-Aug
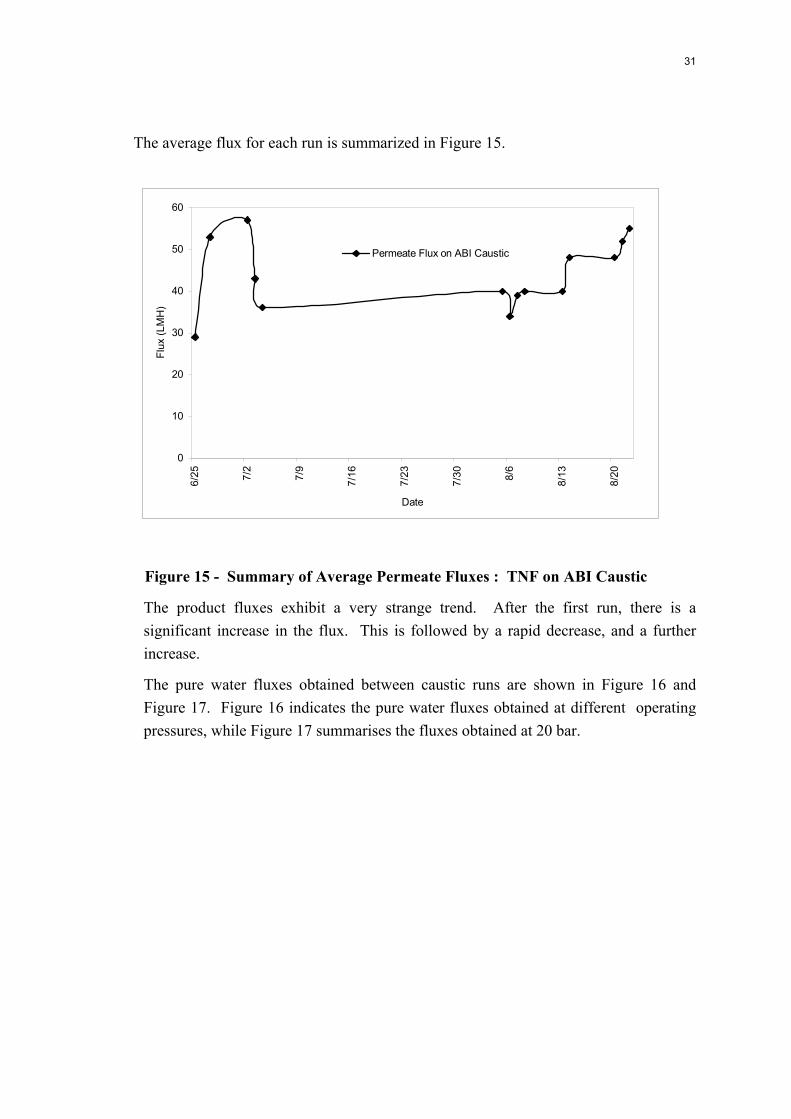
31
The average flux for each run is summarized in Figure 15.
Figure 15 - Summary of Average Permeate Fluxes : TNF on ABI Caustic
The product fluxes exhibit a very strange trend. After the first run, there is a
significant increase in the flux. This is followed by a rapid decrease, and a further
increase.
The pure water fluxes obtained between caustic runs are shown in Figure 16 and
Figure 17. Figure 16 indicates the pure water fluxes obtained at different operating
pressures, while Figure 17 summarises the fluxes obtained at 20 bar.
0
10
20
30
40
50
606/
25 7/2
7/9
7/16
7/23
7/30 8/6
8/13
8/20
Date
Flu
x (L
MH
)
Permeate Flux on ABI Caustic
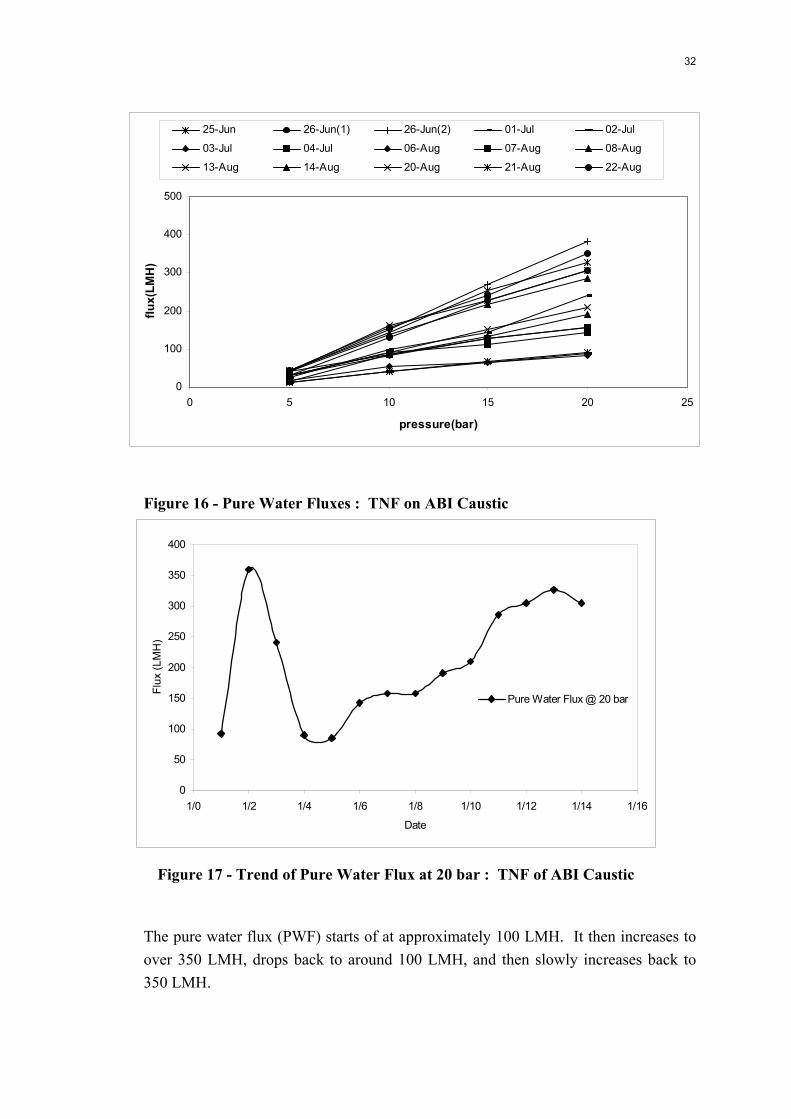
32
Figure 16 - Pure Water Fluxes : TNF on ABI Caustic
Figure 17 - Trend of Pure Water Flux at 20 bar : TNF of ABI Caustic
The pure water flux (PWF) starts of at approximately 100 LMH. It then increases to
over 350 LMH, drops back to around 100 LMH, and then slowly increases back to
350 LMH.
0
50
100
150
200
250
300
350
400
1/0 1/2 1/4 1/6 1/8 1/10 1/12 1/14 1/16
Date
Flu
x (L
MH
)
Pure Water Flux @ 20 bar
0
100
200
300
400
500
0 5 10 15 20 25
pressure(bar)
flu
x(L
MH
)
25-Jun 26-Jun(1) 26-Jun(2) 01-Jul 02-Jul
03-Jul 04-Jul 06-Aug 07-Aug 08-Aug
13-Aug 14-Aug 20-Aug 21-Aug 22-Aug
33
The pure water flux at a specified pressure can only increase if there is a change to the
structure of the membrane. It is postulated that the following has occurred :
The NF membrane has a thin NF skin on a porous support structure that could be
regarded as either an MF or an UF. On exposure to the caustic, or some component in
the caustic, some irreversible chemical change occurred in the NF layer, causing the NF
skin to slowly degrade. However, the porous support, acting as a MF or UF, retained
the suspended solids from the spent caustic. As the NF layer progressively deteriorated
further, the membrane became more “open”. This caused the permeate flux to increase,
and the turbidity rejection to decrease.
Irrespective of whether the above explanation is applicable, the changes in pure water
flux indicate that the membrane is most probably changing in response to the caustic, or
some component in the waste caustic. In either instance, the TNF membrane tested is
not stable when operated on waste caustic.
7.3 Summary
The TNF system gives an excellent turbidity rejection, and is capable of cleaning up the
spent caustic to the point where it could be reused. However, there are various
questions about the stability of the membrane to the spent caustic. In this study, the
product flux as well as the pure water flux exhibited very strange behavoirs that
possibly indicate a deterioration in the membrane structure.
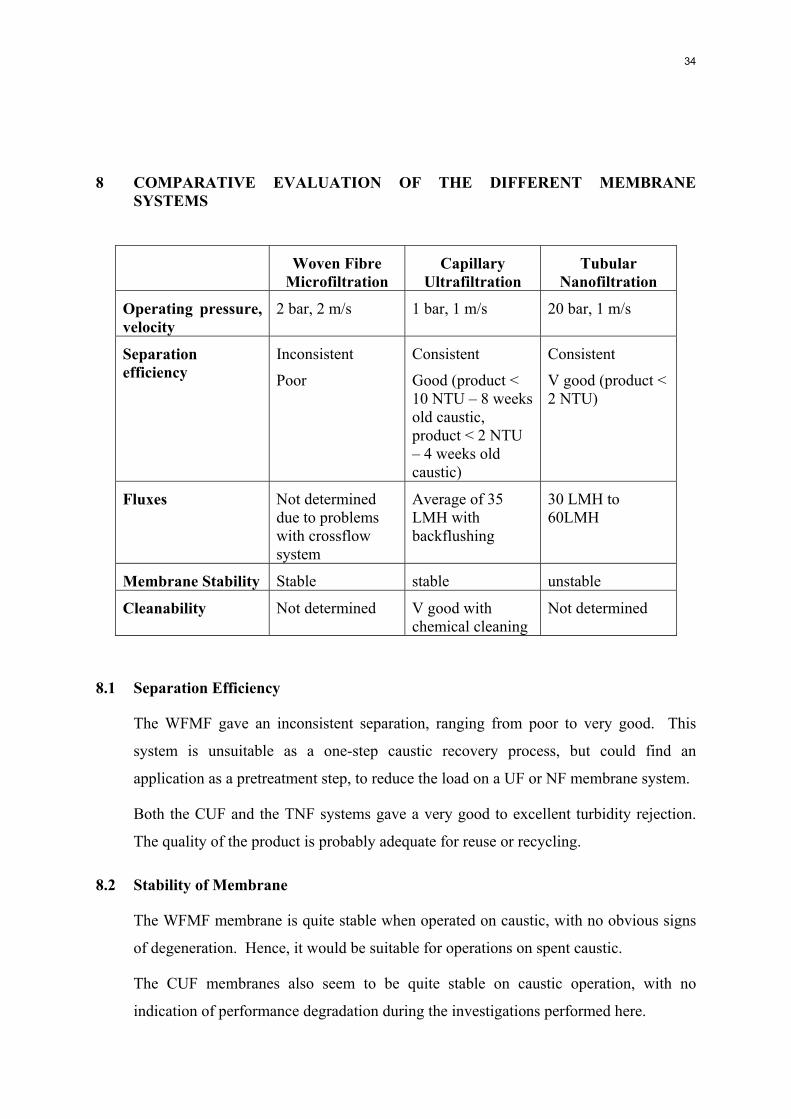
34
8 COMPARATIVE EVALUATION OF THE DIFFERENT MEMBRANE SYSTEMS
Woven Fibre Microfiltration
Capillary Ultrafiltration
Tubular Nanofiltration
Operating pressure, velocity
2 bar, 2 m/s 1 bar, 1 m/s 20 bar, 1 m/s
Separation efficiency
Inconsistent
Poor
Consistent
Good (product < 10 NTU – 8 weeks old caustic, product < 2 NTU – 4 weeks old caustic)
Consistent
V good (product < 2 NTU)
Fluxes Not determined due to problems with crossflow system
Average of 35 LMH with backflushing
30 LMH to 60LMH
Membrane Stability Stable stable unstable
Cleanability Not determined V good with chemical cleaning
Not determined
8.1 Separation Efficiency
The WFMF gave an inconsistent separation, ranging from poor to very good. This
system is unsuitable as a one-step caustic recovery process, but could find an
application as a pretreatment step, to reduce the load on a UF or NF membrane system.
Both the CUF and the TNF systems gave a very good to excellent turbidity rejection.
The quality of the product is probably adequate for reuse or recycling.
8.2 Stability of Membrane
The WFMF membrane is quite stable when operated on caustic, with no obvious signs
of degeneration. Hence, it would be suitable for operations on spent caustic.
The CUF membranes also seem to be quite stable on caustic operation, with no
indication of performance degradation during the investigations performed here.
35
The TNF system is unstable, with product and pure water fluxes exhibiting strange
trends. It is probable that this membrane is undergoing a chemical change on exposure
to caustic.
8.3 Economics Aspects
From this study, the two systems that could be considered for caustic cleanup are CUF
and TNF, since both give very promising removals of suspended contaminants. The
choice of which system should be pursued further will thus depend on the relative
economics. A detailed economic evaluation was beyond the scope of this project.
However, the relative economics of the membrane systems may be inferred from the
availability of membranes (i.e. local or imported), fluxes and operating conditions.
The TNF system gave the best quality of permeate at fluxes ranging from 30 LMH to
60 LMH, at an operating pressure of 20 bar. The CUF system gave a product of
slightly lower quality than the TNF, at an average flux of 35 LMH, and operating at 1
bar.
8.3.1. Comparative capital costs
The TNF modules are available in areas up to 2.6 m2. The currently available CUF
module has a membrane area of approximately 7 m2. The fluxes obtained on TNF are
up to 60 LMH, while that obtained on CUF is approximately 35 LMH. Hence, for a
specified duty Q (L/h), the number of TNF and CUF modules required are given by :
TNF = (Q/60)/2.6 = 0.0064 Q
CUF = (Q/35)/7 = 0.0041 Q
It is seen that for a given duty, the number of TNF modules required would be about
1.5 times the number of CUF modules required.
The TNF system would have to constructed of stainless steel, due to the high operating
pressure. The CUF system is constructed of PVC, available locally.
Hence, even without detailed prices being available, it is clear that the capital cost of a
TNF system would be greater than that of a CUF system, for a specified duty.
36
8.3.2. Comparative energy costs
The operating pressure for the TNF system is 20 times that of the CUF system. Hence,
the energy requirements would be of a similar magnitude. There is not expected to be
any significant difference in operator requirements, since both systems could be
designed to be manually operated or fully automated. Hence, the operating cost for the
CUF system is expected to be substantially lower than that of the TNF system.
8.3.3. Maintenance and module replacement
There is not expected to be a significant difference in maintenance of a TNF and CUF
system. The replacement of membranes for the CUF system is expected to be less than
the TNF system, in view of the fact that they are imported, and in view of the poor
prevailing exchange rates.
8.3.4. Summary
In summary, both the capital and operating costs of the CUF are likely to be lower than
that of the TNF system. In view of the fact that the separation efficiency of the TNF
system is only marginally better than the CUF, it may be concluded that the CUF would
be more economically attractive for caustic cleanup.
9 CONCLUSION
WFMF gave a very inconsistent product quality, ranging from poor to very good. The
system would not be suitable to clean up used caustic for reuse. In larger scale
applications, however, it may be preferable to use WFMF to pretreat the waste caustic,
prior to cleanup by CUF or NF.
CUF gave a very good product quality, from 1 NTU to 10 NTU, probably suitable for
direct reuse. Average fluxes range from 35 LMH to 42 LMH, and could be maintained
for up to 32 hours with regular backflushing. The membrane was stable to caustic, and
fouled membranes could be recovered with chemical cleaning.

37
TNF gave an excellent product quality, generally around 1 NTU. However, the
permeate fluxes and pure water fluxes were inconsistent and changed drastically with
time. This is most probably indicative of a change in membrane structure, indicating
possible instability when operated on waste caustic.
In considering economic aspects, the capital cost of a CUF system is likely to be
significantly lower than a TNF system. The operating costs of the CUF system are also
likely to be lower, due to lower operating pressures. Maintenance costs may not differ
musch between CUF and TNF. Overall, therefore, the CUF system is likely to be more
cost effective than a TNF system, while the TNF produces a higher quality of product.
10 RECOMMENDATIONS
The following aspects need to be addressed further in order to progress to the
industrialisation of a local membrane system for caustic reuse :
(i) Criteria for reuse of caustic – The project team were unsuccessful in obtaining
from the beverage bottlers a clear indication of the criteria that recycled caustic
must meet to be considered for reuse, seemingly because caustic reuse had not
been given serious consideration previously. The caustic suppliers should have a
better understanding of the criteria that caustic cleaning solutions must meet, but
were reticent in revealing this information.
(ii) Economic evaluation – Ultimately, the cost of recycling caustic must be
compared to the cost of using fresh caustic. This requires information on criteria
for reuse, additives in the caustic solution, and the cost of fresh caustic and
additives. Once again, this information could not be obtained from the bottlers.
(iii) Performance in batch concentration mode – The permeate fluxes obtained in this
study were obtained by operating in a constant concentration mode. This will
simulate the situation where a side stream is continuously drawn off from the
bottle wash bath and cleaned. Alternatively, the caustic cleanup could be done in
a batch concentration mode. Design fluxes for this mode cannot be inferred from
this study, but can easily be obtained experimentally.