causes of emissions from agricultural residue burning … · although a ban on burning residue was...
TRANSCRIPT

Causes of Emissions from Agricultural Residue Burning in North-West India: Evaluation of a Technology Policy Response
Ridhima Gupta
Working Paper, No 66–12

Published by the South Asian Network for Development and Environmental Economics (SANDEE)PO Box 8975, EPC 1056, Kathmandu, Nepal.Tel: 977-1-5003222 Fax: 977-1-5003299
SANDEE research reports are the output of research projects supported by the SouthAsian Network for Development and Environmental Economics. The reports have beenpeer reviewed and edited. A summary of the findings of SANDEE reports are alsoavailable as SANDEE Policy Briefs.
National Library of Nepal Catalogue Service:
Ridhima Gupta Causes of Emissions from Agricultural Residue Burning in North-West India: Evaluation of a Technology Policy Response
(SANDEE Working Papers, ISSN 1893-1891; WP 66–12)
ISBN: 978-9937-8521-6-6
Key words:
Rice Residue Burning
Emissions
Happy Seeder Technology
Punjab
SANDEE Working Paper No. 66–12

Causes of Emissions from Agricultural Residue Burning in North-West India: Evaluation of a Technology Policy Response
Ridhima GuptaIndian Statistical InstituteDelhi, India
January 2012
South Asian Network for Development and Environmental Economics (SANDEE) PO Box 8975, EPC 1056, Kathmandu, Nepal
SANDEE Working Paper No. 66–12

The South Asian Network for Development and Environmental Economics
The South Asian Network for Development and Environmental Economics (SANDEE) is a regional network that brings together analysts from different countries in South Asia to address environment-development problems. SANDEE’s activities include research support, training, and information dissemination. Please see www.sandeeonline.org for further information about SANDEE.
SANDEE is financially supported by the International Development Research Center (IDRC), The Swedish International Development Cooperation Agency (SIDA), the World Bank and the Norwegian Agency for Development Cooperation (NORAD). The opinions expressed in this paper are the author’s and do not necessarily represent those of SANDEE’s donors.
The Working Paper series is based on research funded by SANDEE and supported with technical assistance from network members, SANDEE staff and advisors.
AdvisorJean-Marie Baland
Technical EditorMani Nepal
English EditorCarmen Wickramagamage
Comments should be sent to Ridhima Gupta, Research Fellow, Indian Statistical Institute, Delhi, IndiaEmail: [email protected]

Contents Abstract
1. Introduction 1
2. Study Area and Sampling 2
3. Determinants of Rice Residue Burning 3
3.1 Descriptive Statistics 3 3.2 Model of Farmers’ Decision to Burn Rice Residue 4 3.3 Description of Variables 6 3.4 Discussion of Results 7 3.5 Determinants of Mode of Harvesting 7 3.6 Examination of an Available Alternative to the Problem of Burning: The Happy Seeder Technology 8
4. Development of the Happy Seeder Technology 9 4.1 Comparison of Profits across Users and Non-users of Happy Seeder Technology 9 4.1.1 Comparison of Yields 9 4.1.2 Comparison of Costs 10 4.1.3 Comparison of Profits 10 4.2 Empirical Results 10
5. Conclusions and Policy Implications 12
Acknowledgements 13
References 14
List of Tables Table 1: Variety-wise and Mode of Harvesting-wise Disaggregation of the Method of the Residue
Disposal in Punjab, 2010 15Table 2: District-wise Mean Rental Rate of Combine and Contract Labor during Harvest Time of
Rice Crop in Punjab, 2010 15Table 3: Description of the Variables Used in the Analysis 16Table 4: Marginal Effect of the Variables on Choice of Harvesting in Punjab 2010 17Table 5: Marginal Effect of the Variables on Choice of Residue Disposal in Punjab, 2010 18Table 6: Description of the Variables Used in the Analysis 19Table 7: Estimates of Yield, Cost and Profit per hectare from Wheat Production in Punjab in 2009-2010 21Table 8: Descriptive Statistics and Mean Differences between the Plots of Users and Non-Users
of Happy Seeder 22Table 9: Descriptive Statistics and Mean Differences between the Users and Non-Users of Happy Seeder 22
List of Figures Figure 1: District-wise Distribution of Gross Cropped Area under Basmati and Non-Basmati
Varieties in Punjab, 2010 23Figure 2: Variable Width Notched Box Plots of Field Preparation Costs (per hectare) Across plots
that was Cultivated using Happy Seeder Technology and Conventional Tillage 23
AppendixTable 1: Variety-wise and Mode of Harvesting-wise Disaggregation of the Residue Disposal
in Amritsar, 2010 24Table 2: Variety-wise and Mode of Harvesting-wise Disaggregation of the Residue Disposal
in Ludhiana, 2010 24Table 3: Variety-wise and Mode of Harvesting-wise Disaggregation of the Residue Disposal
in Sangrur, 2010 25

South Asian Network for Development and Environmental Economics6
Abstract
The burning of agricultural field residue, such as stalks and stubble,
during the wheat and rice harvesting seasons in the Indo-Gangetic
plains results in substantial emissions of trace gases and particles. This
pollution can have adverse health and climate impacts. Our paper uses
a representative sample of farmers from the seven districts of Punjab
to identify the determinants of emissions from open-field burning of
rice residue. The study finds that the use of coarse varieties of rice as
opposed to fine-grained varieties such as Basmati increases the likelihood
of farmers using the combine-harvester technology, which in turn makes
burning almost certain. Although a ban on burning residue was in effect in
Amritsar district during the year of the survey, it had moderate impact on
burning. We used a second sample of users of the Happy Seeder machine
in order to examine the potential for adoption of this new technology.
This machine plants seed into loose residue, making burning of residue
unnecessary. A comparison of the Happy Seeder with conventional
practice shows that the new technology does not increase the cost of
field preparation. We also found no evidence of an increase or decrease
in the mean yield of wheat from using the Happy Seeder. We conclude
that farmers will be slow to adopt the Happy Seeder since it has no strong
advantage or disadvantage from the view point of private profits. Thus,
the state would need to play a more significant role in promoting this
machine in order to reduce residue burning and associated costs that are
mostly external to the farmer.
Key Words: Rice Residue Burning, Emissions, Stalks and stubble, Happy
Seeder Technology, Punjab.
1
Causes of Emissions from Agricultural Residue Burning in NW India: Evaluation of a Technology Policy Response
Causes of Emissions from Agricultural Residue Burning in North-West India: Evaluation of a Technology Policy Response
1. Introduction
An important source of atmospheric pollution in the Indo-Gangetic plains is biomass burning (of agricultural field residue such as stalks and stubble) during wheat and rice harvesting periods (Venkataraman et al., 2006). This has adverse impacts not only on the health of the population (Long et al., 1998) but also on the regional climate and crop output (Auffhammer et al., 2006). In the present study, we therefore look for answers to the following questions: what factors explain the open-field burning of rice residue in Punjab, India and what are the available alternatives to this practice? Understanding why farmers resort to burning is essential for policy makers to arrive at suitable mitigation policies which would reduce rice- residue burning in the region.
The ‘rice-wheat cropping system’ (RWCS) is the dominant cropping system in South Asia (Hobbs and Morris, 1996). This system involves growing rice and wheat in rotation throughout the year where rice and wheat is either grown in the same plot in the same year or in different plots in the same year or in the same plot in different years. Uttar Pradesh, Punjab, Haryana, Bihar, Madhya Pradesh, and Himachal Pradesh have the largest areas under this system among the Indian states.
Koopmans and Koppejan (1997) estimated that India generated approximately 507.8 million tons of on-field crop residue during 1997, of which 43% was rice and 23% wheat. According to estimates from Streets et al. (2003), farmers burnt 16% of this crop residue. The results from Venkataraman et al. (2006) suggest that farmers in India burnt 116 million metric tons of crop residue in 2001, albeit with a strong regional variation. Their estimates suggest that, in all, open burning of crop residue accounted for about 25% of black carbon, organic matter, and carbon monoxide emissions, 9-13 % of fine particulate matter (P.M2.5) and carbon dioxide emissions and about 1% of sulphur dioxide emissions. Moreover, the authors found that a majority of the fires that occurred in the western Indo-Gangetic plain during the months of May and October corresponded with, the two major harvesting seasons for rice and wheat. Field burning in the major agricultural states of Punjab, Haryana and western Uttar Pradesh was the largest potential contributor to these emissions.
Gustafsson et al. (2009) employed radiocarbon analysis as an atmospheric tracer to measure biomass and fossil-fuel contributions to the South Asian atmospheric brown cloud. The technique they employed found the contribution of biomass combustion to black carbon emissions (at 46% for elemental carbon and at 68% for soot carbon) to be much larger than that detected by other tracer techniques. Thus, they proposed that- ‘both biomass combustion (such as residential cooking and agricultural burning) and fossil fuel combustion should be targeted to mitigate climate effects and improve air quality.’
Black carbon emissions are the second largest contributors to current global warming, after carbon dioxide emissions (Ramanathan and Carmichael, 2008). Long et al. (1998), who studied the health consequences from burning of agricultural residue, through a survey of 428 participants with underlying respiratory disorders and exposure to pollution from the burning of agricultural residue, found that people with underlying respiratory disorders were susceptible to the air pollution caused by burning of agricultural residue. Their study found that the pollution either aggravated underlying symptoms or induced additional air-pollution-related symptoms. Auffhammer et al. (2006) found that joint reductions in brown clouds and green-house gases had complementary, positive impacts on rice harvests in India over the period 1972-1998. Brown cloud attributed harvest reductions alone are estimated to have grown from 3.94% during the 1966-84 period to 10.6% during the 1985-1998 period. Biomass regulation, therefore, becomes both a national and international priority. In this paper we will determine the impacts of both open-fields burning of agricultural residue and of alternative technologies that eliminate the need for biomass burning.

South Asian Network for Development and Environmental Economics2
This is the first study that uses farm-level data in order to explore the possibility of regulating emissions from open field burning of rice residue in Punjab. We conducted two surveys for the purpose of generating the data. The first survey collected information on the method of residue disposal and its determinants for the purpose of identifying the factors that explain open-field burning of rice residue. We find that the use of coarse (as opposed to Basmati) varieties of rice increases the likelihood of farmers harvesting rice using the combine-harvester, which in turn scatters residue and therefore makes the burning of biomass almost certain.
We use the second survey to examine a technology called the Happy Seeder machine, which precludes the burning of rice residue. We conclude that this technology has the potential to reduce emissions from residue burning in Punjab. Happy Seeder is a tractor-mounted machine that cuts and lifts the rice straw, sows wheat into the bare soil, and deposits the straw over the sown area as mulch.1 Farmers can therefore sow wheat immediately after the rice harvest, precluding the need for burning rice residue.
We find that the use of the Happy Seeder does not increase the cost of field preparation for wheat that follows the rice harvest compared to conventional practice, which usually involves burning residue. This finding is based on comparisons of different plots of the same farmers, with and without the Happy Seeder technology. This result implies that, on its own, the Happy Seeder technology will spread only slowly since it has no strong advantage or disadvantage from the point of view of the private profitability of the farmer. Accordingly, there is a strong case for promoting the machine through extension and possibily subsidies in order to reduce residue burning, the costs of which are mostly external to the farmer. These are important results given that rice residue is the biggest contributor to emissions from open-field burning of crop residue in this region (Badarinath et al., 2006).
The open-field burning of crop residue generated from mechanized harvesting of cereal crops is not a problem peculiar to India. Yang et al. (2008) estimated the emissions from crop residue burning in the Suqian region of the Jiangsu Province of China. In Suqian, farmers practice the rice-wheat cropping system widely. According to the authors, farmers burnt about 82% of the wheat straw and 32% of the rice straw in the field during the period 2001-2005. They attribute the open-field burning of cereal residues to the practice of mechanized harvesting of cereal crops by a combine-harvester.
However, in the case of China, unlike Punjab, farmers burn more wheat than rice residue. One reason why farmers in China are busiest in the month of June is that wheat is harvested in June; whereas farmers in Punjab find themselves more hard-pressed during the months of October to December. Another reason is the universal preference for wheat residue as livestock feed by Punjabi farmers. Thus, in Punjab farmers collect wheat residues and trade the surplus. Farooq et al. (2007) also associate agricultural residue burning with the use of the combine-harvester to harvest crops in the Punjab province of Pakistan. There is also widespread use of wheat residue as animal feed in this region. Thus, the authors report intensive collection of wheat residue and large-scale burning of rice residue. These findings support our contention that the Happy Seeder technology can reduce rice-residue burning beyond the Indian Punjab.
The rest of the paper is organized as follows. In the next section we describe the sampling design. In Section 3, we discuss the factors that explain the rice residue burning in Punjab. Section 4 details the factors which explain field burning of rice residue in Punjab while in section 5 we analyze the profitability of the Happy Seeder technology. Section 6 concludes with policy implications.
2. Study Area and Sampling
The empirical analysis uses two samples, one, a representative sample of farmers and the other a sample of users of the Happy Seeder machine. We collected the two samples from the state of Punjab2 because the Happy Seeder technology is so far only available in this state. Moreover, with rice and wheat yields of 3858 kg per hectare and 4179 kg per hectare respectively in 2005-06, the state occupied the top position in the country in terms of food
1 A protective cover placed over the soil to retain moisture, reduce erosion, provide nutrients, and suppress weed growth and seed germination.
2 In 2006-2007, Punjab was the fourth largest producer of rice and the second largest producer of wheat in India, producing 11% of the country’s rice output and 19% of its wheat output (Ram, 2008)

3
Causes of Emissions from Agricultural Residue Burning in NW India: Evaluation of a Technology Policy Response
grain yield (Ram, 2008). The ratio of net irrigated area to net area sown stood at 0.95 in 2005-06 and is the highest in the country (Ram, 2008) because the Happy Seeder technology is so far only available in this state.
We selected the representative samples of farmers from the districts of Amritsar, Ludhiana and Sangrur. We chose these three districts because we wanted to capture geographical variation across Punjab. In the second stage, we selected ten villages for sampling from each of the three districts using the probability proportional to size technique. This technique ensured that farmers in the larger villages had the same probability of getting into the sample as farmers in the smaller villages and vice-versa. We obtained the list of villages from the 2001 Census of India. The voter list constituted the sampling frame within a village because a voter list assigns a unique house-hold number to each household in a village and specifies the names of all household members who are at least eighteen years of age at the time of preparation of the list.3 The data collected includes information on costs incurred by farmers in preparing the field for the wheat crop by conventional tillage.
We surveyed ten households within each village. Since there would be people who did not engage in any farming activity in each village, we randomly selected forty households from each voter list. If the first household among the forty house-holds was a farm household, we included it in the survey. If that was not the case, we dropped it and contacted the second household. We followed this procedure until the enumerator was able to complete nine interviews. In order to find out if farmers with large landholdings behaved differently from farmers with small land- holdings, we included one farmer with a large landholding from each village in the sample. We did this by asking the respondents to provide the names of the five largest landowners in their village. We randomly selected one farmer from this list for the interview.
For the purposes of the study, we defined a farm household as a group of individuals, related by blood or marriage, living on the same premises that share a kitchen and practice the rice-wheat cropping system. The respondents to the questionnaire were men who were actively involved in day-to-day farming activity.
We collected data at plot level since a farm may not be one consolidated unit. The total farm area for most farmers is distributed across plots and farmers follow different practices on different plots. We arrived at the size of a farm unit by summing up farm land owned and the farm land leased by farmers and subtracting from this the total farm land leased out by farmers.
We conducted another survey to gather similar information from users of the Happy Seeder machine. We obtained the list of users of Happy Seeder technology by contacting the manufacturer of the Happy Seeder machine and various government officials associated with its promotion. We collected data from 92 Happy Seeder users spread across the 7 districts of Punjab. Since the Happy Seeder is a new technology, most users experimented with it in a limited area while simultaneously practicing conventional tillage in the other areas.
We conducted the two surveys between January and April in 2010, with a follow-up via the telephone during June 2010 in order to obtain data on the yield of the wheat crop for all respondents.
3. Determinants of Rice Residue Burning
3.1 Descriptive Statistics
Presently, four options are available to the farmers for the disposal of residue, namely, the complete burning of residue, the partial burning of residue, the in-corporation of residue into field and removal of the residue from the field. The combine-harvester leaves two types of residue into the field: loose residue and intact residue. Intact residue is the stalk of the rice plant that is left standing in the field after the combine-harvester has cut the top-most portion of the plant that carries the grain. Its height varies from 8 to 10 inches. Loose residue is the residue that is scattered by the combine-harvester after the harvesting and threshing of the rice crop. This part of the residue is hard to retrieve as it is unevenly distributed over the field. Complete burning involves burning the loose
3 The decision to use the voter list as a sampling frame was taken after conducting a census of a village. The census revealed that the voter list is not grossly distorted. Hence we decided to use the voter list as a sampling frame.

South Asian Network for Development and Environmental Economics4
and intact residue while partial burning involves burning loose residue only. Some farmers plow the loose and intact residue into the fields. They do this typically by using a tractor-drawn machine called a Rotavator. It involves a single pass of shallow intensive tillage that incorporates the anchored residue and pulverizes the soil. The incorporation of residue refers to this practice.
We found the mode of harvesting to strongly influence the choice of crop residue disposal. According to our sample, farmers burnt 1% of the residue of the rice plant that they manually harvested while they burnt 90% of the residue of the rice crop that was left by the combine-harvester (see Table 1). This is because manual harvesting allows for easy retrieval of the rice residue since the rice plant is cut at near ground level and collected into bundles for subsequent threshing. The recovery of stalks and stubble after harvesting by a combine-harvester, on the other hand, is more problematic since the cut residues (loose residue) is scattered all over the harvested fields.
This Table also shows that the type of rice variety grown by the farmer in turn drives the choice of the mode of harvesting. While there are two choices open to the farmers regarding the type of rice variety that they may grow, i.e., coarse varieties and fine grain (Basmati) varieties, we observed that farmers were more likely to harvest Basmati varieties manually. Two factors explain this observed difference, the most striking being the price differential between Basmati and coarse varieties. We discovered that the Food Corporation of India (FCI) procures rice and wheat from farmers at the minimum support price (MSP) announced by the Government of India. Farmers are free to sell any quantity of grain at this price. The fine grain (Basmati) varieties however do not fall under this scheme. Since the FCI announced the minimum support price in August 2009, farmers had to rely on the prices that had prevailed during the previous season.4
The Food Corporation of India (FCI) further classifies coarse varieties into grade A and common varieties, with the minimum support prices for grade A variety and common variety fixed at INR 980 per quintal (or USD 21 per quintal) and INR 950 per quintal (or USD 20 per quintal) respectively in 2009. The fine grain varieties are however priced within the range of INR 2000-3500 per quintal (or USD 43-75) depending on its quality. Since the use of the combine-harvester results in a loss of grain and given that the price of Basmati rice far exceeds the price of coarse rice, farmers prefer to opt for manual harvesting of Basmati varieties in order to minimize this loss. But, on the other hand, it is also much cheaper and quicker to use combine-harvesters than to employ labor. These time savings are dear to the farmers as there is only a short time period between rice harvesting (mid October-early December) and the sowing of wheat, which takes place between November and early December. Any delay in planting reduces the productivity of the wheat crop (Gupta et al., 2004). Consequently, combine-harvesters are popular with farmers for coarse varieties. Table 2 displays the mean rental rate of combine-harvesters and the wages for contract labor across the 3 districts in Punjab. Farmers in Ludhiana save about USD 112 per hectare by opting for a combine-harvester. The corresponding figures for Amritsar and Sangrur are USD 56 and 102 respectively.
3.2 Model of Farmers’ Decision to Burn Rice Residue
As the above discussion implies, the mode of harvesting and the method of residue disposal are jointly determined by farmers. Since manual harvesting allows for maximum recovery of rice residue, farmers are less likely to burn this residue. On the other hand, since the combine harvester leaves much rice residue in the field, farmers have no choice but to burn it in order to ready the field for the wheat crop that follows almost immediately in the wake of the rice harvest.
Approximately, 90% of the respondents, when asked about the basis of variety choice, cited the price and yield of various varieties during the previous growing season as the key factors in arriving at this decision. For example, during the 2008-2009 period, the price of PUSA 1121 Basmati variety increased to INR 2000 (or USD 43) per quintal owing to its short supply in the market.5 Consequently, farmers increased the area cultivated under this variety during the following season. PUSA 1121 variety, as a result, comprised 75% of the area under Basmati in my sample. Hence, I assume here that the decision of farmers on the type of rice variety that they sow is exogenously determined by agro-climatic conditions and the price and yield of rice varieties previously grown by the farmer.
4 Rice is a kharif crop. There are 2 growing seasons in India i.e. kharif and rabi crop. Kharif crops are usually sown with the beginning of the rains in June-July, during the south-west monsoon season.
5 Amritsar Procurement Centre (Mandi).
5
Causes of Emissions from Agricultural Residue Burning in NW India: Evaluation of a Technology Policy Response
Taken as a whole, however, only 21% of the respondents in our sample cultivated Basmati varieties while 47% of the respondents cultivated coarse varieties. 32% of the respondents, on the other hand, grew both varieties. Figure 1 shows the district-wise distribution of gross cropped area under fine grain (Basmati) and coarse varieties for each of the three districts in our sample. In the sample, the area under Basmati and coarse varieties was 271 hectares and 869 hectares respectively but there was significant variation across districts. In Amritsar, for instance, 71% of the gross cropped area sown was Basmati while, in the case of Ludhiana, 52% of the gross cropped area sown was the coarse variety.
The reason for the predominance of fine grain varieties in Amritsar had to do with the agro-climatic conditions of this region that were conducive to growing Basmati varieties.6 The Punjab governments decision to launch a Integrated Pest Management technology in the Basmati-growing areas of Amritsar, Tarn Taran and Gurdaspur districts at a cost of about INR 10 million (or USD 2,17,391) for the year 2009-2010 further reflects the concentration of Basmati varieties in this region.
These 3 districts in fact comprise the Basmati belt of Punjab.7 Hence, we found the most precious Basmati varieties such as Super Basmati to be grown only in Amritsar although another variety called Muchal is sown in Sangrur. Therefore, although Basmati rice is produced in small quantities in other districts of Punjab, its characteristics quality- wise would not be the same as that of the fine indigenous varieties of Tarn Taran, Amritsar and Gurdaspur. Moreover, although shortage of labor compelled many farmers in our sample to resort to mechanical harvesting for Basmati varieties too, they always resorted to manual labor to harvest the expensive varieties of Basmati such as Super Basmati.
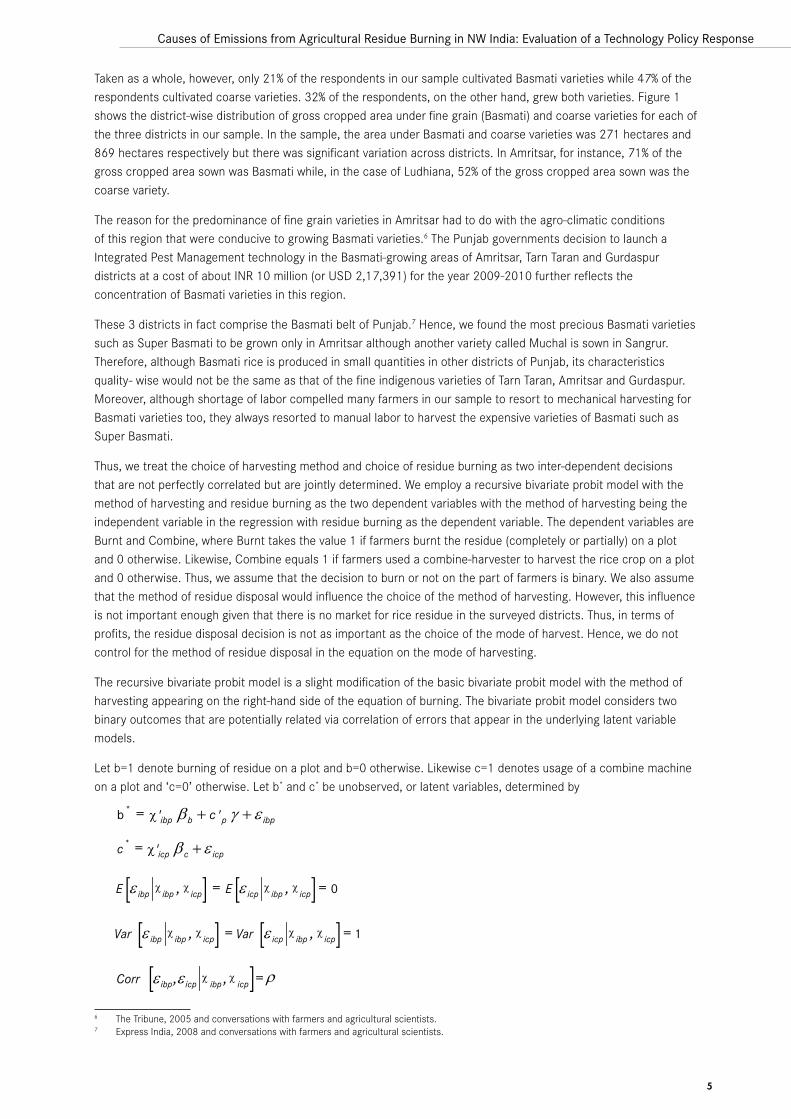
Thus, we treat the choice of harvesting method and choice of residue burning as two inter-dependent decisions that are not perfectly correlated but are jointly determined. We employ a recursive bivariate probit model with the method of harvesting and residue burning as the two dependent variables with the method of harvesting being the independent variable in the regression with residue burning as the dependent variable. The dependent variables are Burnt and Combine, where Burnt takes the value 1 if farmers burnt the residue (completely or partially) on a plot and 0 otherwise. Likewise, Combine equals 1 if farmers used a combine-harvester to harvest the rice crop on a plot and 0 otherwise. Thus, we assume that the decision to burn or not on the part of farmers is binary. We also assume that the method of residue disposal would influence the choice of the method of harvesting. However, this influence is not important enough given that there is no market for rice residue in the surveyed districts. Thus, in terms of profits, the residue disposal decision is not as important as the choice of the mode of harvest. Hence, we do not control for the method of residue disposal in the equation on the mode of harvesting.
The recursive bivariate probit model is a slight modification of the basic bivariate probit model with the method of harvesting appearing on the right-hand side of the equation of burning. The bivariate probit model considers two binary outcomes that are potentially related via correlation of errors that appear in the underlying latent variable models.
Let b=1 denote burning of residue on a plot and b=0 otherwise. Likewise c=1 denotes usage of a combine machine on a plot and ‘c=0’ otherwise. Let b* and c* be unobserved, or latent variables, determined by
6 The Tribune, 2005 and conversations with farmers and agricultural scientists.7 Express India, 2008 and conversations with farmers and agricultural scientists.
[ ] [ ] 0,, icpibp == icpibpicpibpχχEχχE εε
icpcicpχ εβ += 'c*
ibppbibp cχ εγβ ++= ''b *
Corr ε ibp,ε icpχ
ibp , χ icp = ρ
[ ] [ ] 1,, icpibp == icpibpicpibpχχVarχχVar εε
[ ]

South Asian Network for Development and Environmental Economics6
where i and p are farmer and plot specific subscripts. cibp and cicp is a vector of farmer and plot level attributes (for example, age, education, farm size, type of variety sown on a plot etc.) and eibp and eicp are disturbance terms having zero means.
A single equation probit method is inefficient in that it ignores the possibility of correlation between the disturbances and in the underlying latent variable models (Greene, 1998). In this case, the disturbances have a bivariate normal distribution and therefore, we need to estimate these equations using a bivariate probit model (Greene, 1998).
The model collapses into two separate probit models for b and c if r = 0 because when r is zero, the correlation between the disturbances equals zero. The most suitable technique of estimating a bivariate probit model is full information maximum likelihood. It turns out that despite the issue of endogeneity the terms that enter the likelihood of the recursive bivariate probit model are the same as those for the usual bivariate probit model (Greene, 1998).
Wilde (2000) has shown that identification by functional form is present in the recursive bivariate probit model in the absence of exclusion restrictions. However, the common practice is to impose restrictions to improve the identification of the model. In our model, we exclude the particular rice variety that farmers sow in order to identify the predicted value of c in the equation of burning. This is because the rice variety that farmers sow affects the method of residue disposal through its impact on the mode of harvesting. Once farmers make the choice regarding the mode of harvesting, the rice variety they sow plays no role in determining the method of residue disposal. So farmers never manually harvest coarse rice because the grain is not valuable enough to justify the extra cost. Conditional on combine harvesting, Table 1 therefore shows that there is little difference in residue disposal methods between Basmati and coarse varieties.
Incorporation of residue appears more common for Basmati varieties, but this is due to the prohibition on burning rice residue in Amritsar (see Appendix Table 1-3). The Deputy Commissioner (DC) of Amritsar enforced this ban for the first time in 2009 just prior to the rice-harvesting season in the district.8 The punishment meted out to violators of the ban was the permanent disconnection of the power supply by the Punjab State Electricity Board.
Since the authorities banned burning rice residue just prior to the rice-harvesting season, the ban did not influence the type of rice variety farmers grew in Amritsar. Moreover, there is no reason to believe that had this prohibition been in place before the rice sowing period, it could have influenced the variety decision. In fact, in order to maximize profits, a majority of the farmers in Amritsar flouted the ban and resorted to burning rice residue (See Appendix Table 1). This shows that farmers did not take the ban seriously and that profit considerations were the major factor in determining the choice of the method of residue disposal.
The absence of reaper harvesting technology in rice underscores even more clearly the very limited use for the rice residue that remains on the field after harvesting the rice plant via a combine-harvester. On the other hand, this technology is in widespread use for the wheat crop. It harvests the wheat residue left in the field by the combine-harvester by chopping it so that farmers can use it as fodder for livestock. As mentioned earlier, wheat residues have a scarcity value and farmers trade the surplus. In contrast, as mentioned earlier, there is no market for rice residue in the surveyed districts. Thus, rice residue is not valuable enough to drive the harvesting decision.
3.3 Description of Variables
The variables that we have used in this study to explain the choice of the method of residue disposal and the mode of harvesting come out of the profit maximizing exercise of the farmer. Although we do not model profits explicitly, the preceding discussion seeks to identify which heterogeneous characteristics of farmers and their growing conditions influence their choice of harvesting and residue disposal. This discussion implies that the mode of harvesting, proxies of scale of operation and technical ability of the farmer, family size, age of the farmer and farm location explain the choice of the method of residue disposal. The raw data in fact suggests that small-scale farmers are more likely to remove the residue from their fields for the purpose of feeding livestock.
8 The Tribune, 2009 and personal communication with the Deputy Commissioner.

7
Causes of Emissions from Agricultural Residue Burning in NW India: Evaluation of a Technology Policy Response
Introducing a dummy variable that equals 1 if the farmer used a combine-harvester to harvest the rice crop on a plot and 0 otherwise captures the mode of harvesting. Farm size indicates the effect of scale of operation while family size is proxied by the number of family members equal to or above 15 years of age in the household per hectare of farm area sown to rice. Years of education of the farmer, viewership of a television program related to farming, contact with extension services, and whether farmer reads agricultural magazines are proxies for the technical ability of the farmer.9 The dummy variable Amritsar represents location, which equals 1 if the plot is located in Amritsar and 0 otherwise.
The explanatory variables in the equation on the mode of harvesting are the rice variety farmers sow on a plot, ownership of livestock, farm size, family size, rental rate of a combine-harvester in the village, rental rate of contract labor in the village, age and education of the farmer, proxies of technical ability of the farmer and farm location. The rice variety that farmers sow has direct implications for the mode of harvesting (manual or combine). Small-scale farmers may be more inclined to use their own labor or employ labor to harvest Basmati varieties. Farmers who own livestock are more likely to harvest the crop manually. However, we allowed for this effect to vary with the rice variety that farmers sow since they prefer the residue of the Basmati variety for the purpose of feeding livestock. The location of the farm may influence the mode of harvesting even after controlling for the rice variety that farmers grow. This is because farmers in Amritsar plant high quality Basmati varieties that are more likely to be harvested manually.
The binary variable Coarse identifies the rice variety that farmers sow on a plot. It equals 1 if the variety of rice that farmers sow on a plot is coarse and 0 otherwise. The number of family members equal to or above 15 years of age in the household per hectare of farm area sown to rice is a proxy for family size. The number of livestock owned per hectare of farm area reflects ownership of livestock. Table 3 gives the descriptive statistics of the variables included in the analysis.
3.4 Discussion of Results
We estimated the recursive bivariate probit model using maximum likelihood. We corrected the standard errors for clustering at the farmer level. The estimated value of rho was -0.16. The t ratio on this coefficient was -0.86 suggesting that the un-observables may be uncorrelated. The likelihood ratio test of the null hypothesis that rho equals zero against the alternative that rho does not equal zero reaffirms this result. The p value of r = 0 is 0.39. Therefore, we cannot reject the null hypothesis at any conventional significance level, which indicates the validity of estimating the two equations separately. We however do not find this result surprising. The correlation coefficient measures the correlation between the outcomes after we have accounted for the influence of the explanatory variables. Thus, the value, -0.16, measures the effect of unobservables after we have already accounted for the influence of using a combine-harvester. However, as we will show later, the farmer’s decision to use a combine-harvester to harvest the rice crop or not is the single most important determinant of whether a farmer will burn the residue on a plot. Hence, we estimated each equation using single equation probit methods.
3.5 Determinants of Mode of Harvesting
The most important factor affecting the farmers’ choice of the mode of harvesting was the variety of rice that the farmer sowed (see Column 1, Table 4). We expected this result given the statistics in Table 2. On plots that were planted with coarse varieties, farmers were 63% more likely on overage to use combine-harvesters. The number of livestock owned per hectare of farm area had some impact on the decision regarding the mode of harvesting. The average change in the predicted conditional probability where combine harvester equals 1 for a 1 unit increase in livestock per hectare of farm area differed between coarse and Basmati varieties by 7% points, with coarse rice growers having higher marginal effects on livestock on average. Farmers in Amritsar on average were significantly less likely to use a combine-harvester. This reflects farmer preference for manually harvesting high-quality Basmati varieties in this region. It is noteworthy that the variable Amritsar turned out to be statistically insignificant when we computed the marginal effects fixing the values of the variables Coarse and Amritsar at 1 and keeping all the other variables fixed at their mean values. This shows that plot location was of no consequence to the mode of harvesting
9 If there were more than two active farmers in the same household, we used the information on the oldest farmer as a measure of the technical ability of that farming household.

South Asian Network for Development and Environmental Economics8
for coarse varieties. The location variable Amritsar was statistically significant in the regression that excluded the variable Coarse. The average partial effect of the variable Amritsar increased to -0.39. This is because the variable Amritsar was picking up the effect of the variable Coarse. Since we can assume the location of a farmer to be exogenous at a given point in time, we can also assume the variety of rice that farmers sow to be exogenous. To see this more closely, we ran 2 separate regressions for each of the varieties using a linear probability model with village-fixed effects. As predicted, Amritsar was statistically significant in the regression for the Basmati variety and insignificant in the regression for the coarse variety. As in the probit model, the location dummy Amritsar was significant in the regression that excluded the variable Coarse.
The model predicted 91% of the plots on which farmers were using a combine- harvester correctly as well as 91% of the plots on which farmers were resorting to manual labor correctly, with an overall correct prediction rate of 91%. As a robustness check, we estimated this model using a linear probability framework with farm-fixed effects and village-fixed effects. We report the results in Columns 2-3 of Table 4. These results are consistent with the results in column 1.
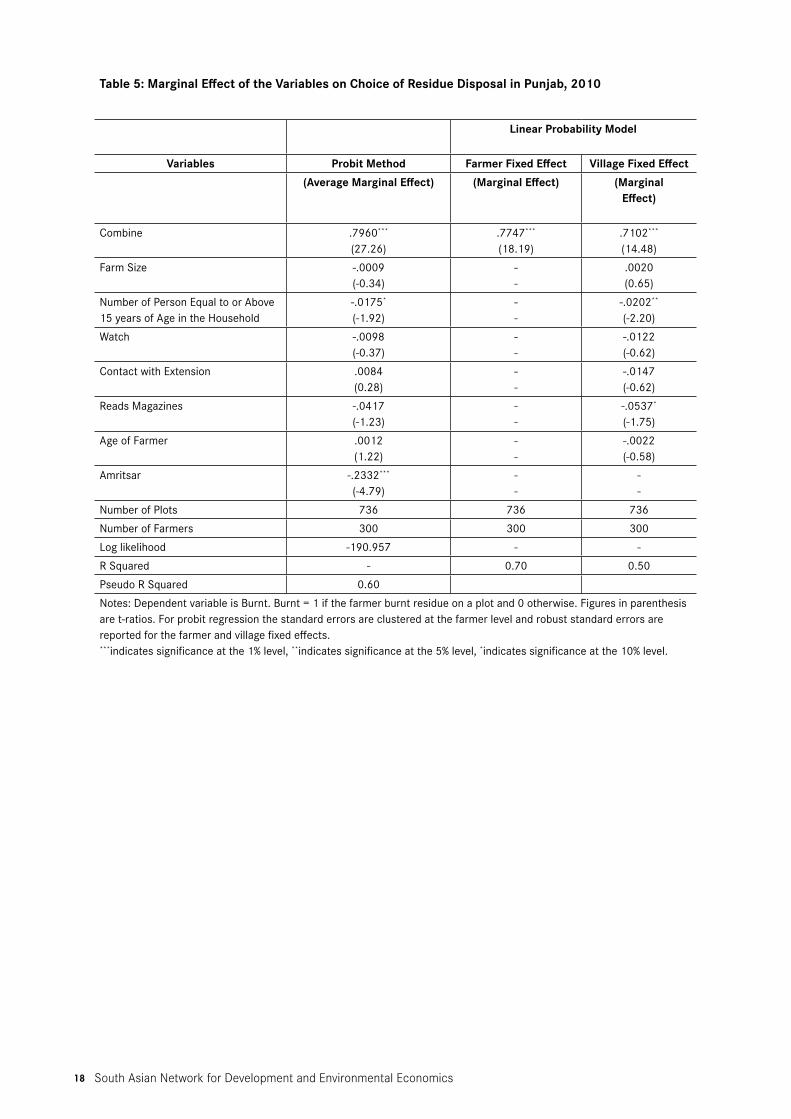
We show the average marginal effects of the variables in the equation on method of residue disposal in column 1 of Table 5. The results on the method of residue disposal model indicated that the model successfully predicted 99% of all plots on which farmers burnt rice residue as well as 74% of all plots on which farmers did not burn residue, with an overall correct prediction rate of 90%.
By far, the usage of a combine-harvester exerted the most substantial effect, on average, on the probability that farmers will burn residue on a plot. Residue, on plots on which farmers harvested a rice crop using a combine-harvester, was 80% more likely to be burnt on average than residue on plots on which farmers harvested the rice plant using farm labor. Another factor influencing the decision to burn the residue was farm location. Plots located in Amritsar on average were 24% less likely to get burnt than plots situated in Ludhiana and Sangrur. Farm size, age of the farmer and availability of human capital appeared to have no influence on the decision to burn rice residue. These findings are consistent with the results obtained from the models that include farmer-fixed effects and village-fixed effects (see columns 2-3 of Table 5).
3.6 Examination of an Available Alternative to the Problem of Burning: The Happy Seeder Technology
Our results imply that the most important determinant of the decision to burn rice residue is the use of a combine-harvester. While I find that the ban on the burning of residue imposed in Amritsar district has had, some impact on the frequency of burning, in the absence of any economically viable alternative to burning residue and adequate enforcement, it has not succeeded in eliminating the practice of residue burning. Furthermore, the use of a combine-harvester is not amenable to policy intervention because the advantages that combine-harvesters offer in terms of savings in money and time as well as reduced supervision of labor have made them immensely popular with today’s farmers. At present, farmers use combine-harvesters mainly to harvest coarse varieties of rice in Punjab but, as the discussion in Section 4 shows, farmers who face a labor shortage may also resort to mechanical harvesting in the case of the Basmati varieties. Thus, labor scarcity is likely to increase the use of combine-harvesters among farmers.
It is possible to make a modification to the combine-harvester enabling the residue to be collected separately. This raises questions about the utilization of residue. Given that rice residue is of limited value to the farmers, whether as livestock feed or non- feed use, it remains to be seen whether uses can be found for rice residue outside the agricultural sector. The Government has introduced balers in the district of Amritsar. In addition, a sugar mill in the district is also using the baled residue to generate electricity in this district. However, the baling of residue may not be a viable mitigation strategy as the supply of baled residue may outweigh its demand. We have no way to substantiate this claim since there is no data available on the quantities of residue that various industries in Punjab demand and the quantities supplied.
Another viable alternative is incentives to develop machines that allow farmers to plant wheat into the loose residue. The Happy Seeder technology performs this function in the context of rice residue. Thus, an important

9
Causes of Emissions from Agricultural Residue Burning in NW India: Evaluation of a Technology Policy Response
research question is whether the Happy Seeder technology is a viable alternative to open-field burning of rice residue. We address this question in the next section.
4. Development of the Happy Seeder Technology
Engineers of CSIRO Griffith at Punjab Agricultural University developed the first prototype of the Happy Seeder in July 2001. The machine consisted of a standard Indian seed drill with inverted T-boots attached by a three-point linkage behind a forage harvester with a modified chute. Although preliminary tests of this technology with about 6 t/ha of anchored and loose rice residue were very encouraging, in some situations, the establishment of the wheat crop was poor. To deal with this problem, the engineers modified the Happy Seeder technology in 2004. They added a narrow strip tillage assembly in front of the sowing tynes to improve the contact of the seed with the soil. However, since there were persistent problems with this technology, the manufacturer modified it again in 2005 and 2006. At the time of our field survey, a manufacturer at Ramdass in the district of Gurdaspur in Punjab was manufacturing the Happy Seeder which had been first sold to a farmer in the district in 2007. However, to date, the Happy Seeder technology is undergoing modifications in its design and engineers continue to test it for its performance.
4.1 Comparison of Profits across Users and Non-users of Happy Seeder Technology
4.1.1 Comparison of Yields
Since the Government of India determines the price of wheat, the use of the Happy Seeder can affect revenue from wheat production by affecting its yield. To determine the impact of Happy Seeder technology in comparison with conventional tillage with regard to yield per hectare of wheat sown, we estimated regressions that included farmer fixed effects. We used plot level data collected from the users of the Happy Seeder to conduct these regressions. As mentioned before, most farmers used Happy Seeder on a limited area while simultaneously using conventional tillage in other areas, thereby allowing us to control for farmer-fixed effects. The farmer-fixed effects eliminate any unobservable factors among farmers that might simultaneously affect yield and the performance of the Happy Seeder technology. Therefore, variations in yield were due to natural variations in the functioning of the Happy Seeder technology. We exploited this heterogeneity to estimate the effect of the new technology.
The explanatory variables include a set of plot-level and farmer-level characteristics (the size of the plot, soil type, quantity of fertilizers applied to a plot, age and education of the farmer and variables that measure the technical ability of the farmer such as whether the farmer watched a television program related to farming, etc.), and a binary variable named Happy Seeder that equals 1 if the farmers sow wheat on a plot using Happy Seeder technology and 0 otherwise.
It is not possible to control for the mode of irrigation as all farmers in the sample use a tube-well for irrigation. Since the government gives farmers electricity for free in Punjab, they are unable to provide information on the expenditure incurred on irrigation or the quantity of water used for irrigation. However, the farmer-fixed effect captures the effect of the quantity of water used for irrigation.
For the coefficient on the Happy Seeder variable to have a causal interpretation, the unobserved determinant of yield must remain uncorrelated with the Happy Seeder variable. Since farmer-fixed effects account for any potential confounding farmer-level characteristics, any correlation between yield and the treatment variable must be on account of unobserved plot-level characteristics. If the type of wheat variety that farmers sow on a plot affects yield and correlates with the Happy Seeder variable, the estimated coefficient on the Happy Seeder variable will be biased. Focus group discussions with farmers suggest that the type of wheat variety that farmers sow does not significantly affect the yield of wheat. We can expect the yields to differ at most by a magnitude of 1-2 quintals across varieties. However, to rule out the possibility of correlation between the type that farmers sow and the Happy Seeder variable, we control for the variety of wheat sown in the yield and the profit regressions. There may also be a plot-specific selection effect as farmers may choose to use the Happy Seeder on plots that they believe are more

South Asian Network for Development and Environmental Economics10
suited for this technology. We control for the type of soil in a plot to account for this effect. Since the Happy Seeder is a new technology, farmers may not be aware of the plot characteristics that are appropriate for this technology. Hence, we can assume plot selection to be random.
Farmers can plant the seedlings of the wheat crop manually or by machines. The term for the seeding of a crop into unplowed fields is zero-tillage or no tillage. Besides the Happy Seeder, manufacturers have developed other machines that can grow zero-tillage wheat. Although zero-tillage depends on the use of a zero-tillage seed drill, farmers in Punjab use zero-tillage seed drills on conventionally tilled fields. Hence, we treat sowing of the wheat crop by zero-tillage seed drill as conventional tillage. Another tillage system involves the use of the Rotavator. The Rotavator is a recent introduction in the agricultural system of Punjab but I will treat it as conventional tillage as its usage involves the burning of residue and tillage. On the other hand, conventional tillage for wheat implies the burning of the rice residue followed by multiple passes of the tractor to accomplish plowing, harrowing, raking and seeding operations.
4.1.2 Comparison of Costs
The second question that we investigate in this section is whether the Happy Seeder technology was a low or high cost alternative to conventional tillage. For this purpose, we estimate regressions taking the cost incurred per hectare in establishing the wheat crop as the dependent variable. The explanatory variables in these regressions include the controls in the yield regressions, the output of the wheat crop in a plot, and the mean price per kg of fertilizer paid by the farmer. Nine respondents had purchased the Happy Seeder technology and consequently did not incur any expenditure to hire it. We assigned to them the average cost of using the Happy Seeder that prevailed in their district.10
A prerequisite for using the Happy Seeder is that the loose rice straw left by the combine-harvester should be spread uniformly on the field. Farmers mostly employed labor for spreading this residue although combine-harvesters with a spreader attached to them are available. In addition, farmers incurred expenditure on the purchase and application of weedicide and fertilizers.
We assigned farmers who had utilized their own labor for applying weedicide or for spreading the loose residue the prevailing wage rate in their village of applying the same.
The cost per hectare to prepare the field using the Happy Seeder comprised the cost of hiring the Happy Seeder, the diesel expenses incurred (if any) to operate it, the amount spent on spreading the residue and to apply weedicide, and the amount spent on purchasing fertilizers and weedicide.
As with the Happy Seeder technology, the total cost per hectare of establishing wheat with conventional tillage comprised the cost of hiring farm equipment and the diesel expenses incurred (if any) to operate it, and the amount spent on the purchase and application of weedicide and fertilizers. For the owners of farm machinery, we used the prevailing village rental to hire this equipment in order to impute the value of the service cost of farm equipment.
4.1.3 Comparison of Profits
We now estimate regressions taking profit per hectare from wheat production as the dependent variable in order to see whether the Happy Seeder technology is a profitable alternative to conventional tillage. The controls in these regressions are similar to the controls in the cost regression except that we do not control for the yield of the wheat crop. We give the descriptive statistics of the variables used in the analysis in Table 6.
4.2 Empirical Results
Table 7 contains estimates of the effect of Happy Seeder technology on yield per hectare, cost per hectare and profit per hectare of wheat that farmers sow in a plot. In columns 1 to 3, we report the results of the regression model which has yield per hectare as the dependent variable. Column 1 shows the results of the random-effects
10 If village level rates were not available, we used district level estimates to impute these rates.

11
Causes of Emissions from Agricultural Residue Burning in NW India: Evaluation of a Technology Policy Response
model fitting them by generalized least squares. The coefficient on the Happy Seeder variable was negative (though small in magnitude) and insignificant. Thus, we do not find any impact on the yield of the wheat crop from using the Happy Seeder. The results in column 2 of Table 7 are estimates of the farmer-fixed effects model. We continued to find no effect on the yield of the wheat crop from operating the Happy Seeder. Column 3 presents the results of the pooled least squares estimation. The least squares results also imply that the Happy Seeder technology had no effect on the output of the wheat crop relative to conventional tillage.
Columns 4 to 6 display the results of the equation taking the cost incurred per hectare to prepare preparing the field of wheat as the dependent variable. The results from all the models (column 5) indicate that on average the Happy Seeder technology was a low-cost alternative compared to conventional tillage. The cost saving is highest in the fixed-effects model. Since the fixed-effects model controls for confounding factors at the farmer level, the result strongly indicates that among farmers who used the Happy Seeder technology, the plots that they cultivated using the Happy Seeder technology, on average, incurred a lower cost than those sowed using conventional tillage. This cost saving amounted to INR 1055 per hectare (USD 23).
In columns 7 to 9, we present the results of the model that estimates the effect of Happy Seeder technology on profitability. The results show that on average the Happy Seeder is not a more profitable alternative to conventional tillage, a finding that is consistent across specifications. These findings, however, are applicable to the users of the Happy Seeder technology. A question that is of relevance to policy is whether the Happy Seeder technology will work for the general population of farmers. In order to investigate whether the users of the Happy Seeder machine are comparable in farm characteristics to representative farmers, we compared the means of farm characteristics between the two samples in my study.
Table 8 shows the means of plot level characteristics between the users and non- users of the Happy Seeder. The Table also reports the test statistics for the difference in means across plots in the two samples (see columns 4, 5 and 6). The numbers in Table 8 indicate that the mean output of the wheat crop is similar across the three types of plots, i.e., those that were conventionally tilled and those that were cultivated using Happy Seeder technology. This is a noteworthy feature of the estimates. They imply that the mean yield of the wheat crop was not significantly different across plots that were conventionally tilled by users of the Happy Seeder and those by non-users of the Happy Seeder.
In Table 9, we report the statistics on farmer characteristics across the two samples. The users of the Happy Seeder were more educated and may be more technically able (as measured by indicators such as viewership of television programs on farming and subscription to agricultural magazines) than non-users of the Happy Seeder. We also found them to be better connected with the agricultural extension network. This is not surprising as the agricultural adoption literature highlights that a farmer’s education and his connectivity with the extension network play a crucial role in his decision to adopt a new technology Rahm and Huffman, 1984 Dorfman, 1996 Nkamleu and Adesina, 2000.
We also performed the two-sample Welsch test to determine whether the difference in mean yield per hectare of the three most popular varieties of wheat in Punjab is statistically significant across the two samples. We found that none of the three differences in means were statistically significant. However, this may partly be due to the small sample size in the Happy Seeder category.
We have already established that for users of the Happy Seeder technology, the Happy Seeder is less expensive to use than conventional tillage. Thus, we now compare the field preparation costs incurred per hectare by users of the Happy Seeder with the corresponding expenses of non-users of the Happy Seeder. Figure 2 shows that the Happy Seeder users as a group have lower field preparation costs than users of conventional tillage. The median of the field preparation cost using the Happy Seeder is less than the first quartile of the distribution of field preparation costs borne by farmers that fully burnt their plots prior to sowing wheat. The notches surrounding the median determine the significance of differences between the values. If notches about two medians in particular do not overlap in the graph, the differences between the medians are statistically significant at the 95% confidence level (McGill et al., 1978).

South Asian Network for Development and Environmental Economics12
This implies that the difference between the first box and the other boxes is significant. Users of the Happy Seeder saved around INR 1535 (or USD 33) per hectare in field preparation costs compared to non-users who completely burnt the residue. Incorporation of residue is the most expensive alternative. Hence it is not surprising that only 7.46% of the farmers in the sample incorporated the residue into the field.
Since the Happy Seeder technology is still in its infancy, the cost of hiring it varied considerably. The share of the cost of hiring a Happy Seeder machine in the total cost ranged from 0% to 98%. We re-estimated field preparation costs using the Happy Seeder technology assuming that the Happy Seeder machine is available for hiring for INR 1000 (or USD 21). This rate is the contract rate of a Roto broadcaster in Punjab that has similar power requirements and working width as the Happy Seeder technology (Singh et al., 2006). We expect the rental of the Happy Seeder machine to stabilize to this rate in the coming years. But the Happy Seeder machine continued to be a more viable option than the complete burning of rice residue among farmers using this technology.
In addition to the median, we also compared the means of field preparation costs for the 2 samples in our study. The difference in the means of field preparation costs of Happy Seeder users and those who had completely burnt their plots was INR. 2029 (or USD 44) per hectare. This difference was statistically significant at the 1% level with a ratio of -8.97. Thus, the cost saving per hectare of field preparation of wheat tends to be higher when the mean of the distribution of the field preparation costs are compared with the median.
5. Conclusions and Policy Implications
We find that the use of coarse (as opposed to Basmati) varieties of rice increases the likelihood of harvest by combine- harvesters. In plots that were planted with coarse varieties, farmers, on average, were 63% more likely to use combine-harvesters. The use of the combine-harvester makes burning of residue almost certain. Rice residue left behind by the combine- harvester was 80% more likely to be burnt than residue left after harvesting the rice crop using manual labor. The ban on burning residue imposed in Amritsar district had some impact on the frequency of burning. The number of livestock per hectare of farm area, farm size, and variables that measure the availability of human capital did not seem to have an impact on the probability of burning rice residue.
We conclude that rice residue is largely burnt because it is of limited value to the farmers both as livestock feed and non-feed use. Since the machinery for planting wheat into loose rice residue was hitherto unavailable, farmers burnt the rice residue. The Happy Seeder technology overcomes this problem by planting wheat into the loose residue. Our results imply that the Happy Seeder technology is a viable alternative to open-field burning of rice residue in Punjab. Operators of this technology saved about INR.1000-1060 (or USD 23) on average in field preparation costs compared to plots that were conventionally tilled. We also found that the Happy Seeder technology was a cheaper alternative to conventional tillage for non-users of this technology. Specifically, the median of the field preparation cost using the Happy Seeder was INR 6353 (or USD 138) per hectare whereas the median of field preparation costs incurred by farmers who fully burnt their plots prior to sowing wheat was INR 7888 (USD 171) per hectare.
The difference between the two medians of INR 1535 (or USD 33) was statistically significant. This cost saving was higher when we compared the means of these two distributions. Increasing the availability of combine- harvesters that have a spreader attached to them can further lower the costs of using the Happy Seeder technology. This enables farmers to evenly spread the loose residue. In fact, Singh et al., suggest that the yield of the wheat crop may also be negatively impacted if the loose residue is unevenly spread on the field (2006). This latter feature merits the development of more such harvesters.
However, this decrease in cost may or may not be significant enough to motivate farmers to switch to the Happy Seeder technology. Therefore, policymakers must take measures to demonstrate to the farmers that they enjoy substantial savings in time because the Happy Seeder can be brought into the field immediately after the rice harvest enabling farmers to sow wheat while the rice straw is still too green to burn. The Happy Seeder technology is beneficial given the externalities generated by residue burning. Thus, with the current available information on this technology, policy-makers and other interested parties should play a more proactive role in promoting its further used through extension services and the possible use of subsidies. Subsequent experience with this technology will inform about its long term impact on soil fertility and yield.

13
Causes of Emissions from Agricultural Residue Burning in NW India: Evaluation of a Technology Policy Response
According to the findings of our study, the Happy Seeder therefore has no strong advantage or disadvantage from the point of view of the private profitability of the farmer. Our study clearly demonstrates that, left to itself, the Happy Seeder can be expected to spread only slowly. Therefore, policy-makers and other interested parties should play a more proactive role in promoting its use through extension and subsidies in der to reduce residue burning, the costs of which are mostly external to the farmer as a private individual but borne by the entirety of the society and of the planet. However, there needs to be further research in order to assess the long term impact of the Happy Seeder technology on soil fertility and yield when promoting its use as an alternative technology to conventional tillage among farmers.
Acknowledgements
This research was supported by a grant from the South Asian Network for Development and Environmental Economics (SANDEE), Nepal. I am grateful to E. Somanathan, Jean Marie Baland, Mani Nepal, Abhiroop Mukhopadhyay, Kensuke Kubo, Jeffrey Vincent and Priya Shyamsundar for their suggestions on this research. I thank Harjit Singh and Shyam Kumar for an excellent implementation of the surveys. Last but not least, I am deeply indebted to the farmers of Punjab, who are too numerous to mention individually, but without whose cooperation this study would not have been possible. Errors, if any, are my own.

South Asian Network for Development and Environmental Economics14
References
Ai, C; Norton, E (2003). ‘Interaction terms in logit and probit models’, Economics Letters 80(1): 123–129
Auffhammer, M; Ramanathan, V; Vincent, J (2006) ‘Integrated model shows that atmospheric brown clouds and greenhouse gases have reduced rice harvests in India’, Proceedings of the National Academy of Sciences 103(52): 19668
Badarinath, K; Chand, T; Prasad, V (2006) ‘The Indo-Gangetic Plains–A study using IRS-P6 AWiFS satellite data’, Current Science 91(8): 1085
Businessworld (2009) ‘Returns from Pusa 1121 Variety May Dip’, Available at: http://www.businessworld.in/bw/2009_10_03_Returns_From_PUSA_1121_Basmati_Variety_My_Dip.html?storyInSinglePage=true. [Accessed on 20.01.2011]
Dorfman, J (1996) ‘Modeling multiple adoption decisions in a joint framework’, American Journal of Agricultural Economics 78(3): 547–557
Express India (2008). ‘Farmers fear ban on Basmati Export’, Available at http://www.expressindia.com/latest-news/farmers-fear-ban-on-basmati-export/295374/#.[Accessed on: 20.01.2011]
Farooq, U; Sharif, M; Erenstein, O (2007) ‘Adoption and impacts of zero- tillage in the rice-wheat zone of irrigated Punjab, Pakistan’, Impact Studies 56095
Greene, W (1998) Gender economics courses in liberal arts colleges: Further results, The Journal of Economic Education 29(4): 291–300
Gupta, P; Sahai, S; Singh, N; Dixit, C; Singh, D; Sharma, C; Tiwari, M; Gupta, R; Garg, S (2004) ‘Residue burning in rice-wheat cropping system: causes and implications’, Current Science 87(12): 1713–1717
Gustafsson, O; Krusa, M; Zencak, Z; Sheesley, R; Granat, L; Engstrom, L; Praveen, P; Rao, P; Leck, C; Rodhe, H (2009) ‘Brown Clouds over South Asia: Biomass or Fossil Fuel Combustion?’ Science 323(5913): 495
Hobbs, P; Morris, M (1996) ‘Meeting South Asia’s future food requirements from rice-wheat cropping systems: priority issues facing researchers in the post- Green Revolution era’, NRG paper 96(01)
Koopmans, A; Koppejan, J (1997) ‘Agricultural and Forest Residues-Generation, Utilization and Availability’, Paper presented at the Regional Consultation on Modern Applications of Biomass Energy 6: 10
Long, W; Tate, R; Neuman, M; Manfreda, J; Becker, A; Anthonisen, N (1998) ‘Respiratory symptoms in a susceptible population due to burning of agricultural residue’, Chest 113(2): 351
McGill, R; Tukey, J; Larsen, W (1978) ‘Variations of box plots’, The American Statistician 32(1): 12–16
Nkamleu, G; Adesina, A (2000) ‘Determinants of chemical input use in peri urban lowland systems: bivariate probit analysis in Cameroon’, Agricultural systems 63(2): 111–121
Rahm, M; Huffman, (1984) ‘The adoption of reduced tillage: The role of human capital and other variables’, American Journal of Agricultural Economics 66(4): 405
Ram, G (2008) ‘Agricultural Statistics at a Glance’, Ministry of Agriculture, Government of India
Ramanathan, V; Carmichael, G (2008) ‘Global and regional climate changes due to black carbon’, Nature Geoscience 1(4): 221–227
Singh, R; Dhaliwal, H; Singh, TH (2006) ‘A financial assessment of the Happy Seeder for rice–wheat systems in Punjab, India’, Permanent Beds and Rice- residue Management for Rice–Wheat Systems in the Indo-Gangetic Plain 7:182
Streets, D; Yarber, K; Woo, J; Carmichael, G (2003) ‘Biomass burning in Asia: Annual and seasonal estimates and atmospheric emissions’, Global Biogeochemical Cycles 17(4): 1099
The Tribune, Amritsar Plus (2005) Indo-Pak ties being fed on pure basmati rice, Available at http://www.tribuneindia.Com/2005/20050901/aplus .htm#1. [Accessed on 20.01.2011]
The Tribune, Amritsar Plus (2009) ‘27 Farmers Lose Power to Tubewells, 38 Booked’, Available at http://www.tribuneindia. Com/2009/20091024/aplus .htm#2. [Accessed on 20.01.2011]
Venkataraman, C; Habib, G; Kadamba, D; Shrivastava, M; Leon, J; Crouzille, B; Boucher, O; Streets, D (2006) ‘Emissions from open biomass burning in India: Integrating the inventory approach with high-resolution Moderate Resolution Imaging Spectroradiometer (MODIS) active-fire and land cover data’, Global biogeochemical cycles 20(2): GB2013
Wilde, J (2000) ‘Identification of multiple equation probit models with endogenous dummy regressors’, Economics Letters 69(3): 309–312

15
Causes of Emissions from Agricultural Residue Burning in NW India: Evaluation of a Technology Policy Response
Tables
Table 1: Variety-wise and Mode of Harvesting-wise Disaggregation of the Method of the Residue Disposal in Punjab, 2010
Variety of Rice – BasmatiMode of Harvesting
Manual CombineMethod of Disposal % of the Area
Sown of Basmati that is Harvested
using Labor
No. of Hectares % of the AreaSown of Basmati that is Harvested
using Combine
No. of Hectares
Fully BurntPartially BurntIncorporatedRemoved
100
99
200
175
5716189
5315179
Total 100 177 100 94Variety of Rice- Coarse
Fully BurntPartially BurntIncorporatedRemoved
----
0000
761644
6571413338
Total - 0 100 869
Table 2: District-wise Mean Rental Rate of Combine and Contract Labor during Harvest Time of Rice Crop in Punjab, 2010
District Mean Rental Rate of Combine INR per Hectare
(USD in Parenthesis)
Mean Rental Rate of Contract Labor INR per
Hectare(USD in Parenthesis)
Ratio of Mean Rate Labor to Mean Rental
Combine
Amritsar 2304(49)
4993(105)
2
Ludhiana 1621(35)
6871(147)
4
Sangrur 1619(35)
6378(136)
4
Notes: The exchange rate used through out the analysis is as on September 7, 2008 i.e. USD 1= INR 46.82

South Asian Network for Development and Environmental Economics16
Table 3: Description of the Variables Used in the Analysis
Variables Description Unit of Measurement
Variables
Mean S.D.Burnt Indexes the method of residue
disposal on a plot. 1 = residue is burnt , 0 = otherwise
Percent of Plots 0.64 0.48
Combine Whether or not farmer useda Combine to harvest rice on a plot.1 = Combine machine is used, 0 = otherwise
Number of Plots 0.74 0.44
Coarse Type of variety of rice sown by the farmer on a plot. 1 = coarse, 0 = Basmati
Number of Plots 0.64 0.48
Farm Size Size of a farm unit Hectares 5.03 5.51
Livestock per hectare of farm area Number 2.46 1.96
Watch Whether or not farmer watcheda television program on farming.1 = Watches, 0 = Does not watch
Number of Farmers
0.56 0.50
Contact with Extension Whether or not an extension agent visited the farmerin the year preceding the survey1 = Yes, 0 = No
Number of Farmers
0.24 0.43
Reads Magazines Does the farmer read agricultural magazines?1 = Yes, 0 = No
Number of Farmers
0.20 0.40
Age of the Farmer Number 51.73 14.21
Education of the Farmer Number 8.16 4.1
Number of Persons Equal to or Above15 years of Age in the Householdper hectare of Farm Area Sown to Rice
Number 2.71 2.91
Rental Rate of Combine-Harvester in Village
Rupees per Hectare
1889.55($16.34)
400.05
Rental Rate of Contract Labor in Village Rupees per Hectare
5882.717($50.84)
1460.73
Amritsar Dummy Variable that equals 1 if a plot is located in Amritsar, 0 otherwise
Number of Plots 0.32 0.47
Number of Plots Number of plots in the sample Number 604
Number of Farmers Number of farmers in the sample Number 268

17
Causes of Emissions from Agricultural Residue Burning in NW India: Evaluation of a Technology Policy Response
Table 4: Marginal Effect of the Variables on Choice of Harvesting in Punjab 2010
Linear Probability ModelVariables Probit Method
(Average Marginal Effect)Farmer Fixed
Effect(Marginal Effect)
Village Fixed Effect(Marginal Effect)
Coarse .6275***
(17.98).5036***
(8.38).5123***
(7.42)
Livestock per hectare -.0254***
(-2.75)--
-0.0535***
Livestock per hectare *Coarse .0710**
(2.33).0669***
(3.46).0537***
(3.07)
Farm Size .0009(0.48)
--
.00103(0.55)
Number of Persons Equal to or Above 15 years of Age In the Household
.0226
(0.42)
-
-
.00009
(0.01)
Rental Rate of Contract LaborIn Village
-.00003***
(-3.42)--
--
Rental Rate of Combine-HarvesterIn Village
-.00004(-1.44)
--
--
Watch -.0008(-0.03)
--
-.00009(-0.00)
Contact with Extension .0374(1.51)
--
.0193(0.76)
Reads Magazines -.0689***
(-2.95)--
-.0421(-1.53)
Age of Farmer .0016**
(2.23)--
.0019*
(1.92)
Education of Farmer .0013(0.40)
--
.0017(0.46)
Amritsar -.1191**
(-3.34)--
--
Number of Plots 736 736 736
Numbers of Farmers 300 300 300
Log Likelihood -151.01 - -
R Squared — 0.51 0.49
Psuedo R Squared 0.64
Notes: Dependent variable is Combine. Combine = 1 if the farmer used a combine–harvester on a plot and 0 otherwise. Figures in parenthesis are t-ratios. For probit regression the standard errors are clustered at the farmer level and robust standard errors are reported for the farmer and village fixed effects. ***indicates significance at the 1% level, **indicates significance at the 5% level, *indicates significance at the 10% level.
South Asian Network for Development and Environmental Economics18
Table 5: Marginal Effect of the Variables on Choice of Residue Disposal in Punjab, 2010
Linear Probability Model
Variables Probit Method Farmer Fixed Effect Village Fixed Effect(Average Marginal Effect) (Marginal Effect) (Marginal
Effect)
Combine .7960***
(27.26).7747***
(18.19).7102***
(14.48)
Farm Size -.0009(-0.34)
--
.0020(0.65)
Number of Person Equal to or Above 15 years of Age in the Household
-.0175*
(-1.92)--
-.0202**
(-2.20)
Watch -.0098(-0.37)
--
-.0122(-0.62)
Contact with Extension .0084(0.28)
--
-.0147(-0.62)
Reads Magazines -.0417(-1.23)
--
-.0537*
(-1.75)
Age of Farmer .0012(1.22)
--
-.0022(-0.58)
Amritsar -.2332***
(-4.79)--
--
Number of Plots 736 736 736
Number of Farmers 300 300 300
Log likelihood -190.957 - -
R Squared - 0.70 0.50
Pseudo R Squared 0.60
Notes: Dependent variable is Burnt. Burnt = 1 if the farmer burnt residue on a plot and 0 otherwise. Figures in parenthesis are t-ratios. For probit regression the standard errors are clustered at the farmer level and robust standard errors are reported for the farmer and village fixed effects. ***indicates significance at the 1% level, **indicates significance at the 5% level, *indicates significance at the 10% level.

19
Causes of Emissions from Agricultural Residue Burning in NW India: Evaluation of a Technology Policy Response
Table 6: Description of the Variables Used in the Analysis
Variables Description Unit Means (Standard Deviationin Parenthesis)
Plots sown with Conventional
Tillage
Plots sown using Happy
Seeder
EntireSample
Yield per hectare
Quantity of wheat produced per hectare on a plot
Quintals 43.81(4.317)
43.31(6.193)
43.57(5.286)
Cost per hectare
Per hectare expenditure incurred on preparing the field of wheat
INR 7288.54(2657.56)
6225.3(1235.1)
6780.322161.80)
Profit per hectare
Per hectare profit earned from wheat production
INR 40024.4(5318.05)
40548.27(6644.97)
40274.81(5975.51)
Happy Seeder Whether or not farmer used Happy Seeder to sow wheat on a plot1 = happy Seeder is used, 0 = otherwise
No. of plots - - (0.48)(0.50)
Plot Size Size of a plot He ctares 6.039(5.760)
5.342(5.630)
5.706(5.691)
Fertilizer Quantity of fertilizers applied per hectare of wheat
Kg 473.09(87.88)
461.00(97.09)
467.28(92.30)
Price of Fertilizer
Mean price of fertilizers Price per kg - - 7.14(12.75)
Age Age of farmer No. of farmers
48.92(13.08)
49.83(12.45)
49.35(12.75)
Education Years of Education of Farmer No. of farmers
10.30(2.67)
10.05(3.27)
10.18(2.96)
Watch Whether or not farmer watched a television programme on farming 1 = Watches, 0 = Does not watch
No. of farmers
0.57(0.50)
0.59(0.50)
0.58(0.50)
Contact with Extension
Whether or not an extension agent visited the farmer in the year preceding the survey 1 = Yes, 0 = No
No. of farmers
0.69(0.47)
0.65(0.48)
0.67(0.47)
Reads Magazines
Does the farmer read agricultural magazines?1 = Yes, 0 = No
No. of farmers
0.48(0.50)
0.49(0.50)
0.48(0.50)
Variety 1 If the variety sown on a plot is of type 11 = Yes, 0 = No
No. of plots 0.28(0.45)
0.22(0.42)
0.25(0.44)
Variety 2 If the variety sown on a plot is of type 21= Yes, 0 = No
No. of plots 2.20(0.41)
0.29(0.46)
0.25(0.43)
Variety 3 If the variety sown on a plot is of type 31 = Yes, 0 = No
No. of plots 0.25(0.44)
0.30(0.46)
0.28(0.45)
Variety 4 If the variety sown on a plot is of type 41 = Yes, 0 = No
No. of plots 0.07(0.26)
0.05(0.22)
0.06(0.24)
Variety 5 If the variety sown on a plot is of type 51 = Yes, 0 = No
No. of plots 0.19(0.40)
0.13(0.34)
0.16(0.37)

South Asian Network for Development and Environmental Economics20
Variables Description Unit Means (Standard Deviationin Parenthesis)
Plots Sown withConventional
Tillage
Plots Sown using
Happy Seeder
EntireSample
Soil Type 1 If the soil type on a plot is of type 11=Yes, 0=No
No. ofPlots
0.10(0.30)
0.07(0.25)
0.08(0.27)
Soil Type 2 If the soil type on a plot is of type 21=Yes, 0=No
No. ofPlots
0.04(0.19)
0.11(0.31)
0.07(0.25)
Soil Type 3 If the soil type on a plot is of type 31=Yes, 0=No
No. ofPlots
0.40(0.49)
0.43(0.50)
0.42(0.49)
Soil Type 4 If the soil type on a plot is of type 41=Yes, 0=No
No. ofPlots
0.19(0.40)
0.12(0.33)
0.16(0.37)
Soil Type 5 If the soil type on a plot is of type 51=Yes, 0=No
No. ofPlots
0.05(0.22)
0.04(0.20)
0.04(0.21)
Soil Type 6 If the soil type on a plot is of type 61=Yes, 0=No
No. ofPlots
0.22(0.42)
0.24(0.43)
0.23(0.42)
Number of Plots Number of plots in the sample No. 83 76 159
Percentage of plots
Percent of plots in the sample No. 52 48 100
Number of Farmers
Number of farmers in the sample No. 66 66 66
Notes: The Happy Seeder technology was made available to 22 respondents free of cost whereas 1 farmer could not be contacted for obtaining the data on the yield of the wheat crop. 3 farmers burnt the rice stubble prior to using Happy Seeder. This reduced the sample size to 66 farmers for the profitability analysis. We do not report the descriptive statistics for soil type and type of variety of wheat sown for the sake of brevity.

21
Causes of Emissions from Agricultural Residue Burning in NW India: Evaluation of a Technology Policy Response
Table 7: Estimates of Yield, Cost and Profit per hectare from Wheat Production in Punjab in 2009-2010
Yield per Hectare Cost per Hectare Profit per Hectare
Variables RE(1)
FE(2)
POLS(3)
RE(4)
FE(5)
POLS(6)
RE(7)
FE(8)
POLS(9)
Happy Seeder
-0.509(-0.70)
-0.692(-0.95)
-0.385(-0.49)
-1063.0***
(-3.04)-1054.5***
(-3.13)-997.1****
(-2.61)571.2(0.57)
598.6(0.61)
466.1(0.44)
Yield per Hectare
- - -18.65(0.59)
4.704(0.10)
24.31(0.81)
- - -
Plot Size 0.0950*
(1.94) -0.0661(-0.01)
-0.11*
(2.12)38.68(1.28)
-36.06(-1.87)
113.7***
(3.19)11.84(0.20)
64.97(1.29)
-52.70(-0.67)
Fertilizer 0.0654***
(3.35)-0.00405
(-0.05)0.0673***
(3.60)- - - - - -
Fertilizer Squared
-0.00001***
(-3.33)-0.00002
(-0.35)-0.00008***
(-3.52)- - - - - -
Price of Fertilizer
- - -449.2**
(2.09)-
636.5**
(2.60)-3452.0****
(-2.93)-
-3805.4***
(-291)
Age 0.005(0.13)
- 0.0008(0.02)
-7.065(-0.42)
- -10.68(-0.55)
-34.52(0.64)
-25.96(0.47)
Education -0.421**
(-1.98)- -0.446**
(-2.08)32.82(0.62)
- 25.61(0.39)
-97.98(-0.45)
- -86.62(-0.38)
Watch 0.553(0.50)
- 0.184(0.16)
730.6(1.36) -
508.5(0.91)
-1598.1(-1.16)
- -1790.6(-0.36)
Contact with Extension
-0.933(-0.75)
- -1.345(-1.11)
170.1(0.38)
- 319.3(0.60)
-279.5(-0.20)
--739.5(-0.51)
Reads Magazines
-0.200(-0.17)
- -0.077(-0.06)
-272.0(-0.58)
- -458.9(-0.89)
-438.9(-0.30)
- -249.4(0.17)
Variety 1-0.729(-0.41)
-0.555(-0.25)
-1.199(-0.69)
- - -236.9(0.15)
293.9(0.16)
726.6(0.43)
Variety 2-2.191(0.30)
-2.506(0.59)
-1.447(-5.52)
- - --78.58(-0.04)
-607.5(0.28)
612.5(0.32)
Variety 3-1.514(-0.97)
-1.370(-0.77)
-1.886(-1.24)
- - - -641.7(-0.42)
-463.4(-0.31)
-745.3(-0.42)
Variety 4-0.525(-0.33)
0.0716(0.04)
-1.099(-0.71)
- - - -5119.3***
(0.56)293.9(0.31)
726.6(0.79)
Soil Type 10.126(0.11)
0.615(0.41)
-0.605(-0.44)
-818.9(-1.290
-110.6(-0.39)
-643.7(-0.73)
-1390.9(-0.84)
-1863.1(-1.41)
-2463.3(-1.32)
Soil Type 22.414(1.33)
3.913(1.44)
2.090(0.99)
-62.09(-0.10)
-40.67(-0.12)
-81.26(-0.11)
744.2(0.32)
920.4(0.43)
473.3(0.17)
Soil Type 30.895(0.91)
0.544(0.41)
1.468(1.29)
-1023.0**
(-2.10)-390.8(-1.19)
-1280.7**
(-2.18)1142.3(0.88)
-1877.5**
(-2.08)1989.5(1.33)
Soil Type 40.590(0.40)
0.960(0.43)
0.543 (0.39)
-929.8(-1.44)
-438.2(-1.37)
-962.0(-1.21)
523.5(0.34)
-2644.4*
(-1.8901032.3(0.59)
Soil Type 55.210**
(2.08)3.107(0.84)
5.678**
(2.20)-841.4(-0.81)
-414.8(-1.11)
56.83(0.04)
5629.9***
(3.72)6860.7***
(4.73)4624.7**
(2.19)
Number of Plots
223 223 223 159 159 159 159 159 159
Number of Farmers
88 88 88 66 66 66 66 66 66
Notes: The dependent variable in column 1 to 3 is yield per hectare of wheat in a plot. The dependent variable in column 3 to 6 is cost incurred per hectare (in INR) on field preparation of wheat in a plot. The dependent variable in column 7 to 9 is per hectare profit earned (in INR) from wheat production in a plot. Figures in parenthesis are t-ratios. For OLS regressions the standard errors are clustered at the farmer level and robust standard errors are reported for the farmer fixed and random effects. The coefficients on the soil type and variety of wheat sown are not reported for the sake of brevity. *** indicates significance at the 1% level, ** indicates significance at the 5% level, * indicates significance at the 10% level.

South Asian Network for Development and Environmental Economics22
Table 8: Descriptive Statistics and Mean Differences Between the plots of Users and Non-Users of Happy Seeder
Means, Sample of Plots
Cultivated using
Conventional Tillage by
Non-users of Happy Seeder
Means, Sample of Plots
Cultivatedusing
ConventionalTillage by Usersof Happy Zeeder
Means, Sample of Plots
Cultivatedusing Happy
Seederby Users
of Happy Seeder
T-test,Differences
betweenMeans in
Column 1 and Column 2
T-test,Differences
betweenMeans inColumn 1
and Column 3
T-testDifferences
betweenMeans in
Column 2 and Column 3
Characteristics (1) (2) (3) (4) (5) (6)Yield Per Hectare 43.84
(0.269)43.67
(0.468)43.65
(0.736)0.169
(0.566)0.194
(0.662)0.025
(0.844)
Quantity of FertilizerApplied per hectare
505.31(4.80)
472.91(7.92)
456.86(9.22)
32.40***
(10.02)48.45***
(10.94)16.05
(12.08)
Per Hectare Expenditureon Weedicide
1115.09(19.97)
980.73(33.54)
899.39(47.13)
134.37***
(41.66)215.71***
(47.23)81.33
(56.24)
Number of Plots 438 122 101
Number of Farmers 267 70 88
Notes: Figures in parenthesis are standard errors. 1 farmer who was a non-user of Happy Seeder could not be contacted for obtaining the data on the yield of the wheat crop reducing the sample size further to 267. 3 farmers burnt the rice stubble prior to using Happy Seeder whereas 1 farmer could not be contacted for obtaining the data on the yield of the wheat crop reducing the sample size of Happy Seeder users to 88.*** Significant at the 1% level
Table 9: Descriptive Statistics and Mean Differences between the Users and Non-Users of Happy Seeder
Means, Sample of Farmers that used
Conventional Tillage
Means, Sample ofFarmers that used
Happy Seeder
T-test, Differencesbetween Means in
Column 1 and Column 2
Characteristics (1) (2) (3)Age of the Farmer 51.81
(0.87)49.36(1.34)
2.45(1.70)
Number of Years of Education of the Farmer 8.16(0.25)
9.95(0.36)
-1.80***
(0.48)
Number of Farmers that Watched a Television Programme on Farming
0.55(0.03)
0.61(0.05)
-0.06***
(0.06)
Number of Farmers that were contacted by an Extension Agent in the year preceding the survey
0.24(0.03)
0.64(0.05)
-0.40***
(0.05)
Number of Farmers hat read Agricultural Magazines 0.19(0.02)
0.47(0.05)
-0.27***
(0.05)
Number of Farmers 267 88
Notes: Figures in parenthesis are standard errors.*** Significant at the 1% level

23
Causes of Emissions from Agricultural Residue Burning in NW India: Evaluation of a Technology Policy Response
Figures
Figure 1: District-wise Distribution of Gross Cropped Area under Basmati and Non-Basmati Varieties in Punjab, 2010
500
400
300
200
100
0
Area
(in
hect
are)
sow
n to
eac
h va
riety
of r
ice
Amritsar Ludhiana Sangrur
Basmati Coarse
Figure 2: Variable Width Notched Box Plots of Field Preparation Costs (per hectare) across Plots that were Cultivated using Happy Seeder Technology and Conventional Tillage
●
●
●
●
●
Rs 8748 Rs 7888 Rs 7744
Rs 6353 ●
●
Happy Seeder Complete Burning Partial Burning Incorporation
1400
012
000
1000
080
0060
0040
00
Fiel
d pr
epar
atio
n co
st in
INR
(per
hec
tare
) of
whe
at in
200
9-10
in P
unja
b
Note: Each box plot has been made proportional to the square root of the number of plots in the corresponding group.

South Asian Network for Development and Environmental Economics24
Appendix
Table 1: Variety-wise and Mode of Harvesting-wise Disaggregation of the Residue Disposal in Amritsar, 2010
Variety of Rice – BasmatiMode of Harvesting
Manual CombineMethod of Disposal % of the Area
Sown of Basmati that is Harvested
using Labor
No. of Hectares % of the Areasown of Basmati that is Harvested
using Combine
No. of Hectares
Fully BurntPartially BurntIncorporatedRemoved
000
100
000
130
48171511
2911177
Total 100 130 100 64Variety of Rice- Coarse Fully BurntPartially BurntIncorporatedRemoved
----
0000
3232288
28282247
Total - 0 100 87
Table 2: Variety-wise and Mode of Harvesting-wise Disaggregation of the Residue Disposal in Ludhiana, 2010
Variety of Rice – BasmatiMode of Harvesting
Manual CombineMethod of Disposal % of the Area
Sown of Basmati that is Harvested
using Labor
No. of Hectares % of the Area sown of Basmati that is Harvested
using Combine
No. of Hectares
Fully BurntPartially BurntIncorporatedRemoved
000
100
000
31
34410
26
3302
Total 100 31 100 8Variety of Rice- Coarse Fully BurntPartially BurntIncorporatedRemoved
----
0000
732026
327918
25
Total - 0 100 451

25
Causes of Emissions from Agricultural Residue Burning in NW India: Evaluation of a Technology Policy Response
Table 3: Variety-wise and Mode of Harvesting-wise Disaggregation of the Residue Disposal in Sangrur, 2010
Variety of Rice – BasmatiMode of Harvesting
Manual CombineMethod of Disposal % of the Area
Sown of Basmati that is Harvested
using Labor
No. of Hectares % of the Areasown of Basmati that is Harvested
using Combine
No. of Hectares
Fully BurntPartially BurntIncorporatedRemoved
1100
89
200
14
877170
22220
Total 100 16 100 26Variety of Rice- Coarse Fully BurntPartially BurntIncorporatedRemoved
----
0000
91702
3032307
Total - 0 100 333


South Asian Network for Development and Environmental Economics30
SANDEEP.O. Box 8975, E.P.C 1056, Lalitpur, Nepal
Street address: c/o ICIMOD, Khumaltar, Lalitpur, Nepal
Tel: 977 1 5003222, Fax: 977 1 5003299, Email: [email protected] Web: www.sandeeonline.org
SANDEE Sponsors