category title - european environment agency
TRANSCRIPT

EMEPEEA air pollutant emission inventory guidebook 2019 1
Category Title
NFR 1A1 Energy industries
SNAP 01 Combustion in energy and transformation industries
ISIC
Version Guidebook 2019
Coordinator
Carlo Trozzi
Contributing authors (including to earlier versions of this chapter)
Ole-Kenneth Nielsen Marlene Plejdrup Otto Rentz Dagmar Oertel Mike Woodfield and Robert
Stewart
1A1 Energy industries
EMEPEEA air pollutant emission inventory guidebook 2019 2
Contents
1 Overview 3
2 Description of sources 4
21 1A1a Public electricity and heat production 4
22 1A1b Petroleum refining 5
23 1A1c Manufacture of solid fuel and other energy industries 6
3 1A1a Public electricity and heat production 7
31 Techniques 7
32 Emissions 8
33 Controls 11
34 Methods 12
4 1A1b Petroleum refining 38
41 Techniques 38
42 Emissions 38
43 Controls 40
44 Methods 40
5 1A1c Manufacture of solid fuels and other energy industries 53
51 Techniques 53
52 Emissions 53
53 Controls 53
54 Methods 54
6 Data quality 60
61 Completeness 60
62 Avoiding double counting with other sectors 60
63 Verification 60
64 Developing a consistent time series and recalculation 63
65 Uncertainty assessment 63
66 Inventory quality assurancequality control QAQC 64
67 Mapping 64
68 Reporting and documentation 64
7 Glossary 65
8 References 66
9 Point of enquiry 69
Annex A Summary of combustion plant and NFR codes 70
Annex B Further details on emissions and controls 72
Annex C Sulphur content in fuels 80
Annex D Emission factors derived from emission limit values 81
Annex E Calculation of emission factors from concentrations 85
Annex F Emission factors from older versions of the Guidebook 91
1A1 Energy industries
EMEPEEA air pollutant emission inventory guidebook 2019 3
1 Overview
This chapter describes the methods and data needed to estimate emissions from NFR Sector 1A1
Energy industries The activity covers combustion and conversion of fuels to produce energy for
example electricity or heat from point sources
1A1a mdash Public electricity and heat production
1A1b mdash Petroleum refining
1A1c mdash Manufacture of solid fuels
The information provided in this chapter is also appropriate for assessing stationary combustion
emissions within other NFR categories (for example industrial combustion mdash 1A2) Smaller scale
combustion (generally lt 50 MWth) is considered in Chapter 1A4
Emissions arising from storage and transport of fuels combustion residues abatement feedstock
and abatement residues are not included these are in the fugitive emission NFR code 1B Guidance
for estimating emissions from waste combustion processes is not included here (see the separate
chapters concerning waste combustion mdash 6Ca 6Cb 6Cc and 6Ce) However if there is heat
recovery or power generation in the incineration process the emission should be reported under
the appropriate 1A1 activity
The range of activities relevant to Chapter 1A is summarised in Section 2 below information on
sectors which include combustion activities is provided in Appendix A
The most important pollutants emitted to the atmosphere from the activities are summarised in
Table 1-1
Table 1-1 Pollutants with potential for 1A1 combustion activities to be a key category
Source releases Substance
Activity PM
(To
tal su
spe
nd
ed
pa
rticula
tes
(TS
P))
PM
10
PM
25
Oxid
es o
f sulp
hu
r
Oxid
es o
f nitro
ge
n
Oxid
es o
f carb
on
Hyd
rog
en
chlo
ride
fluo
ride
Vo
latile
org
an
ic com
po
un
ds
Me
tals (e
xclu
din
g m
ercu
ry a
nd
cad
miu
m) a
nd
the
ir com
po
un
ds
Me
rcury
Ca
dm
ium
PA
H
Dio
xin
s PC
B H
CB
Am
mo
nia
Hyd
rog
en
sulp
hid
e
Bla
ck C
arb
on
Boilers and
furnaces
X X X X X X X X X X X X X
Gas turbine X X X X X X X X
CI engine X X X X X X X X X X X
Refinery
activities
X X X X X X X X X X X X X
Coke ovens X X X X X X X X X X X X X X
1A1 Energy industries
EMEPEEA air pollutant emission inventory guidebook 2019 4
2 Description of sources
21 1A1a Public electricity and heat production
This activity covers emissions from combustion plant as point sources In general this activity
addresses emission from larger combustion appliance (gt 50 MWth) Within the European Union
different criteria are applied for the reporting of emissions from combustion plants according to the
Industrial Emissions Directive - IED - 201075EC) [EC-IED 2010]
The emissions considered in this activity are released by a controlled combustion process (boiler
emissions furnace emissions emissions from gas turbines or stationary engines) and are mainly
characterised by the types of fuels used Furthermore a characterisation of the combustion sources
may be developed according to the size and type of plants as well as from primary or secondary
reduction measures For example solid liquid or gaseous fuels are used and there are a range of
emission abatement measures (for example PM SO2 and NOx control)
Emissions from autoproducers (public or private undertakings that generate electricityheat wholly
or partly for their own use as an activity that supports their primary activity) should be assigned to
the sector where they were generated and not under 1A1a
With the complexity of plant activities and inter-relationships there may not always be a clear
separation between autoproducers and main activity producers The most important issue is that all
facilities be accounted under the most appropriate category and in a complete and consistent
manner For more information on autoproducers please refer to IPCC 2006 Guidelines [IPCC 2006]
wwwipcc-nggipigesorjppublic2006glindexhtm
A number of process schemes can be applied for the activities depending on the specific application
typical process schemes are provided in Figure 2-1 Figure 2-2 and Figure 2-3
Figure 2-1 Process scheme for heat plant adapted from IPCC Figure 22 in the energy
industries chapter
Fugitive
Emissions
Chapter 1B1
NMVOC PM10
CombustionFuel Heat
1A1 Energy industries
EMEPEEA air pollutant emission inventory guidebook 2019 5
Figure 2-2 Process scheme for power plant adapted from IPCC Figure 22 in the energy
industries chapter
Figure 2-3 Process scheme for combined power and heat plant adapted from IPCC
Figure 22 in the energy industries chapter
22 1A1b Petroleum refining
This activity covers emissions released from production and combustion processes within a refinery
Combustion processes include the heating of crude and petroleum products without contact
between flame and products Combustion activities are generally similar to the activities described
in 1A1a but include fuels such as refinery gas Production processes such as thermal cracking and
catalyst regenerator units as well as venting flaring and fugitive emissions are covered in Chapters
relating to 1B2
Fugitive
Emissions
Chapter 1B1
NMVOC PM10
CombustionFuel Generator Electricity
Fugitive
Emissions
Chapter 1B1
NMVOC PM10
CombustionFuel GeneratorElectricity
Heat
1A1 Energy industries
EMEPEEA air pollutant emission inventory guidebook 2019 6
Figure 2-4 Process scheme for petroleum refinery adapted from IPCC Figure 23 in the
energy industries chapter
23 1A1c Manufacture of solid fuel and other energy industries
Note that extraction of coal and initial treatment is covered in Chapter 1B Under 1A1c the activity
covers coke production and emissions associated with combustion in the coke oven Fugitive
emissions from (for example) extinction (quenching) and door leakage is covered in Chapter 1B
Most coke production is associated with iron and steel production
Figure 2-5 Process scheme for coke ovens adapted from IPCC Figure 23 in the energy
industries chapter
Fugitive and
Process
Emissions
Chapter 1B2
ProcessCrude Oil Product
Fugitive and
Extinction
Emissions
Chapter 1B1 PAH
NMVOC PM H2S
NH3
ProcessCoal Product
Fugitive and
Extinction
Emissions
Chapter 1B1 PAH
NMVOC PM H2S
NH3
ProcessCoal Product
1A1 Energy industries
EMEPEEA air pollutant emission inventory guidebook 2019 7
3 1A1a Public electricity and heat
production
31 Techniques
Details of technologies used in this activity for combustion of solid liquid and gaseous fuels can be
found within the Best Available Techniques Reference Note (BREF) for energy installations [European
Integrated Pollution Prevention and Control Bureau (EIPPCB) 2015 ] and the US Environmental
Protection Agency (USEPA) emission factor handbook (USEPA AP-42) In general the size of an
installation under this NFR category will exceed 50 MWth guidance on estimating emissions from
smaller appliances can be found within Chapter 1A4
Some general details on technologies are provided here but despite the comparatively small number
of installations there is a wide range of fuel types combustion technologies and abatement
technologies in use
311 Combustion of coal and other solid mineral fuels
Coal is largely burnt as a pulverised fuel with corner (tangential) wall or downfired furnaces The dry
bottom boiler (DBB) has typical combustion temperatures of 900 up to 1 200 degC leading to dry ash
discharge from the combustion chamber due to combustion temperatures from This type of boiler
is mainly used for the combustion of hard coal and brown coallignite and is applied all over Europe
The wet bottom boiler (WBB) has typical combustion temperatures exceeding 1 400 degC which leads
to a liquid slag discharge from the combustion chamber This type of boiler is used for hard coal with
a low content of volatiles and is mainly applied in Germany
In fluidised bed combustion (FBC) the combustion of fuel takes place by injection of combustion air
through the bottom of the boiler into a turbulent bed The typical relatively low emissions are
achieved by air staging limestone addition and low combustion temperatures of about 750ndash950 degC
FBC is in particular adapted to coals rich in ash Only few large combustion plants are equipped with
the FBC technique in the category of thermal capacities 300 MW mostly circulating fluidised bed
combustion (CFBC) is installed Other types of furnace include grate firing (GF) technologies but
these tend to be comparatively small units
312 Combustion of biomass
The combustion of biomass (straw wood landfill gas etc) is increasingly relevant for countries to
meet the drive for renewable or sustainable energy sources Co-firing is undertaken with other fuels
in many types of combustion plant but plants burning only biomass tend to use FBC (mostly CFBC)
and grate-firing (GF) technologies
313 Combustion of peat
The combustion of peat is relevant for several countries and is generally undertaken using milled
peat in FBC in modern facilities but other technologies do exist
1A1 Energy industries
EMEPEEA air pollutant emission inventory guidebook 2019 8
314 Combustion of gas and oil
31411 Boilers and furnaces
The technologies in use range from comparatively small package firetube boilers (capacities up to
about 20 MWth) to large water tube boilers of up to about 2 000 MWth capacity
31412 Gas turbines
Gas turbines are installed with a thermal capacity ranging from several hundred kW up to about
1 000 MWth Gaseous fuels are mainly used such as natural gas or in some instances process gases
or gasification products Liquid fuels are used such as light distillates (eg naphtha kerosene or gas
oil) but in general use of liquid fuels is limited to specific applications or as a standby fuel
Gas turbines are aero-derivative designs (ie based on multiple shaft engines derived from aircraft
engine types) or industrial heavy-duty gas turbines (based on single shaft designs) Gas turbines for
electricity generation can be open (simple) cycle units but are often installed as a part of a combined
cycle gas turbine (CCGT) In a CCGT installation a heat recovery steam generator (HRSG) is used to
recover waste heat from the combustion gases providing steam to power a steam turbine which
drives an alternator providing more electricity The net rated efficiency of a modern CCGT is in excess
of 50
Gas turbines are often found in co-generation plant the gas turbine directly coupled to an electricity
generator and the energy from hot exhaust gases recovered in a suitable HRSG (boiler) or used
directly (for example drying) Supplementary burners are commonly used to provide additional heat
input to the exhaust gases
Integrated coal gasification combined cycle gas turbine (IGCC) plants use fuel gas derived from coal
Note that for IGCC plants the only emission relevant unit considered here is the gas turbine
31413 Stationary engines
Stationary engines are spark-ignition engines and compression-ignition engines (2- and 4-stroke)
with electrical outputs ranging from less than 100 kW to over 20 MW Both types represent relevant
emission sources Such units are common as island generators (away from a supply grid) small
combined heat and power CHP units or for cogeneration and standby or emergency uses
32 Emissions
The contributions of point source emissions released by combustion plants to the total emissions
reported by countries to the Convention on Long-Range Transboundary Air Pollution (CLRTAP) can
be found in the emission databases hosted by the EMEP Centre on Emission Inventories and
projections (1)
The main pollutants are described below with further details provided (from the previous Guidebook
chapter) in Appendix B
Note that the inventory methodologies for Greenhouse gas emissions (carbon dioxide methame
and nitrous oxide) are not included ndash refer to IPCC guidance [IPCC 2006]
(1) Available here httpwwwceipat
1A1 Energy industries
EMEPEEA air pollutant emission inventory guidebook 2019 9
32111 Sulphur oxides
In the absence of flue gas desulphurisation (FGD) technology the emissions of sulphur oxides (SOx)
are directly related to the sulphur content of the fuel The sulphur content of refined natural gas is
negligible The majority of SOx is sulphur dioxide (SO2) although small proportions of sulphur trioxide
(SO3) can arise
32112 Nitrogen oxides
Emissions of nitrogen oxides (nitric oxide and nitrogen dioxide mdash NOx) arise from nitrogen in the
fuel (mainly relevant to solid and liquid fuels) and from reaction of atmospheric nitrogen
Combustion control can provide a high degree of NOx emission control (low NOx burner technology)
and this may be supplemented by use of selective catalytic reduction (SCR) or selective non-catalytic
reduction techniques (SNCR)
32113 Non-methane volatile organic compounds (NMVOC)
Emissions of non-methane volatile organic compounds (NMVOC) eg olefins ketones aldehydes
result from incomplete combustion Furthermore unreacted fuel compounds such as ethane (C2H6)
can be emitted The relevance of NMVOC and CH4 emissions from boilers which are often reported
together as VOC is very low for large-sized combustion plants VOC emissions tend to decrease as
the plant size increases (Rentz et al 1993)
32114 Carbon monoxide (CO)
Carbon monoxide (CO) appears always as an intermediate product of the combustion process and
in particular under sub-stoichiometric combustion conditions However the relevance of CO
released from combustion plants is not very high compared to CO2 The formation mechanisms of
CO and VOC are similarly influenced by combustion conditions Substantial emissions of CO can
occur if combustion conditions are poor
32115 Ammonia (NH3)
Emissions of ammonia (NH3) are not generally associated with a combustion process emissions can
result from incomplete reaction of NH3 additive in NOx abatement systems mdash selective catalytic and
non-catalytic reduction (SCR and SNCR)
32116 Particulate matter
Particulate matter (PM) emissions from large combustion installations (gt 50 MW) burning solid fuels
are often lower than emissions from smaller plants (per unit of energy input) the physical and
chemical characteristics of the PM also differ This is because different combustion and abatement
techniques are applied
Combustion of fuels can generate solid residues which may be deposited within combustion
chambers (furnace bottom ash) within the furnace boiler surfaces or ducting (fly ash) or on heat
exchanger surfaces (soot and fly ash) Coal and other fuels with significant ash content have the
highest potential to emit PM Suspended ash material in exhaust gases may be retained by
particulate abatement or other emission abatement equipment (abatement residues) Material
which remains in the flue gases beyond the abatement equipment and passes to the atmosphere is
primary PM Secondary PM is formed by chemical and physical processes after discharge to
atmosphere and is NOT considered here
1A1 Energy industries
EMEPEEA air pollutant emission inventory guidebook 2019 10
A number of factors influence the measurement and determination of primary PM emissions from
activities and the quantity of PM determined in an emission measurement depends to a large extent
on the measurement conditions This is particularly true of activities involving high temperature and
semi-volatile emission components ndash in such instances the PM emission may be partitioned between
a solidaerosol phase and material which is gaseous at the sampling point but which can condense
in the atmosphere The proportion of filterable and condensable material will vary depending on the
temperature of the flue gases and in sampling equipment
A range of filterable PM measurement methods are applied around the world typically with filter
temperatures of 70-160degC (the temperature is set by the test method) Condensable fractions can
be determined directly by recovering condensed material from chilled impinger systems
downstream of a filter ndash note that this is condensation without dilution and can require additional
processing to remove sampling artefacts Another approach for total PM includes dilution where
sampled flue or exhaust gases are mixed with ambient air (either using a dilution tunnel or dilution
sampling systems) and the filterable and condensable components are collected on a filter at lower
temperatures (but depending on the method this can be 15-52degC) The use of dilution methods
however may be limited due to practical constraints with weight andor size of the equipment
The PM emission factors (for TSP PM10 and PM25) can represent the total primary PM emission or
the filterable PM fraction The basis of the emission factor is described (see individual emission
factor tables)
32117 Black carbon (BC)
Combustion of fossil fuel and biomass is the main source of black carbon (BC) emission (Diehl et al
2012) Black carbon is the term for a wide range of carbon containing compounds but is determined
by assessment of the optical properties of collected particulate matter It covers large polycyclic
species charred plants to highly graphitized soot Other commonly used classifications include
elemental carbon (EC) and organic carbon (OC) which refer to carbon species that have been
classified chemically EC and OC are always co-emitted but in different proportions dependent upon
the fuel properties and the combustion conditions
Using these classifications BC and EC (as the more light absorbing refractory species) are often
treated as equal In reality there may be small differences in the PM fraction of BC and EC resulting
from the different classification techniques used Black Carbon was selected as the term identified
within the Gothenburg Protocol with the requirement that Parties develop emission inventories and
projections for BC and it is proposed that a similar requirement be included under the new NECD
As such in this guidebook emission factors are presented as BC
Literature values of emission factors for BC are often derived by thermal chemical techniques
representative of EC It is therefore important for inventory compilers to understand that the tier 1
BC emission factors presented in this guidance are assumed to be equal to the emission factors for
EC and therefore some uncertainty is introduced Where possible appendices of full carbon
speciation are provided for key sources Country-specific (higher tier) methods will be preferable
where this is feasible
The same emission control techniques that limit the emission of PM will also reduce the emission of
BC However measurement data that address the abatement efficiencies for BC are limited This
means that in general it is assumed that the BC emission can be reduced proportionally to the
filterable PM emission and in particular PM25 emission Consequently for inventory development
the BC emission factors are expressed as percentage of the PM25 emission It must be noted that
1A1 Energy industries
EMEPEEA air pollutant emission inventory guidebook 2019 11
measurement of BC emissions is not a standardised technique and that particle number or surface
area may be relevant metrics However the approach adopted in the present chapter is to develop
a mass inventory based on the PM25 inventory
32118 Metals
Most of the heavy metals considered (As Cd Cr Cu Hg Ni Pb Se Zn and V) are normally released
as compounds (eg oxides chlorides) in association with particulates Only Hg and Se are at least
partly present in the vapour phase The content of heavy metals in coal is normally several orders of
magnitude higher than in oil (except occasionally for Ni and V in heavy fuel oil) and in natural gas
For natural gas emissions of mercury and arsenic are relevant During the combustion of coal
particles undergo complex changes which lead to vaporisation of volatile elements The rate of
volatilisation of heavy metal compounds depends on fuel characteristics (eg concentrations in coal
fraction of inorganic components such as calcium) and on technology characteristics (eg type of
boiler operation mode)
33 Controls
Details of relevant abatement technologies for combustion plant are described in the BREF note for
large combustion plant ( httpeippcbjrceceuropaeureference) some further detail on NOx and
SO2 emission controls are also provided in Appendix B Relevant abatement technologies for
selected pollutants are outlined below
331 Sulphur oxides
There are in-furnace technologies which incorporate injection of an absorbent material (typically
lime) into the furnace Use of such systems is quite common in FBC where the lime can be added to
the bed and high recirculation is possible
Post combustion flue gas desulphurisation (FGD) processes are more common and are designed to
remove SO2 from the flue gas of combustion installations Most processes like the wet scrubbing
process (WS) the spray dryer absorption (SDA) the dry sorbent injection (DSI) and the Walther
process (WAP) are based on the reaction of the SO2 with an alkaline agent added as solid or as
suspensionsolution of the agent in water to form the respective salts In secondary reactions SO3
fluorides and chlorides are also removed In the case of some processes the SO2 is recovered as
sulphur or sulphuric acid Use of FGD processes can also reduce particulate and metal emissions
The most common technologies are described below
33111 Limelimestone wet scrubbing (WS)
The pollutants are removed from the flue gas by chemical reactions with alkaline slurry (suspension
of calcium compounds in water) The main product is gypsum The WS process represents the main
technology used by FGD-equipped electrical capacity installed in European Organisation for
Economic Co-operation and Development (OECD) countries Facilities are in operation at combustion
units using hard coal lignite and oil with sulphur contents from about 08 to more than 30 wt The
SO2 reduction efficiency is gt 90
1A1 Energy industries
EMEPEEA air pollutant emission inventory guidebook 2019 12
33112 Spray dryer (semi-dry) absorption (SDA)
The SDA process removes the pollutant components from flue gas of fossil-fired combustion units
by injection of Ca(OH)2 slurry The process forms a dry by-product requiring downstream collection
of PM The SO2 reduction efficiency is gt 90
33113 Dry sorbent injection (DSI)
The DSI process is based on a gassolid reaction of the flue gas and a dry sorbent (typically lime but
sodium hydrogen carbonate NaHCO3 is used in some smaller applications)
332 Nitrogen oxides
33211 Primary measures
Primary measures minimise formation of NOx in the furnace or combustion chamber and include
low-NOx burners (LNB) staged air supply flue gas recirculation overfire air reburn watersteam
injection and related technology These measures can be retrofitted to existing boilers to achieve
varying degrees of NOx reduction Modern gas turbines can achieve very low NOx emissions by
application of dry low NOx (DLN) burner technology without secondary measures
33212 Secondary measures mdash DeNOx processes
The principal abatement measures are selective non-catalytic reduction (SNCR) and selective
catalytic reduction (SCR) The reduction of nitrogen oxides in the flue gas is based on the selective
reaction of NOx The SNCR process involves injection of ammonia or urea near the furnace Emission
reduction with SNCR can be limited (up to 50 ) and is lower than with SCR An SCR system is based
on selective reactions with injected additives in the presence of a catalyst The additives used are
mostly ammonia (gaseous and in solution) but also urea The NOx reduction efficiency can be
between 70 and 90
333 Particulate matter
The main technology in use is electrostatic precipitation (EP) however fabric filters (FF) are also used
Removal of particulate also reduces emissions of most heavy metals as these are mainly in the
particulate phase Both modern EP and FF can represent Best Available Techniques (BAT) but note
that EP performance can vary widely between older and modern equipment FGD can also be an
effective PM abatement device DSI and SDA systems often incorporate FF for sorbent and PM
removal Wet scrubbing systems can also achieve BAT achievable emission levels for PM
Multicyclone devices can be found on smaller older combustion units or as an initial treatment
stage
34 Methods
341 Choice of method
Figure 3-1 presents the procedure to select the methods for estimating process emissions from
combustion in energy and transformation industries The basic concept is
if detailed information is available use it
if the source category is a key source a Tier 2 or better method must be applied and detailed
input data must be collected The decision tree directs the user in such cases to the Tier 2
method since it is expected that it is easier to obtain the necessary input data for this approach
1A1 Energy industries
EMEPEEA air pollutant emission inventory guidebook 2019 13
than to collect facility-level data needed for a Tier 3 estimate However the inventory compiler
should be aware that because the number of sources may be comparatively small in many
instances the data required for a Tier 3 approach may be only a little more difficult to obtain
than at Tier 2
detailed process modelling is not explicitly included in this decision tree However detailed
modelling will usually be done at facility level and results of such modelling could be seen as
lsquofacility datarsquo (Tier 3) in the decision tree
Figure 3-1 Decision tree for combustion in energy transformation industries
Start
Are all single
sources in the source
category Measured
reported
Use Tier 3
Facility data
only
Is a detailed
estimation model
available
Use Tier 2
technology specific
activity data
and EFs
Key source
Get
technology stratified
activity data
and EFs
Apply Tier 1
default EFs
Yes
Yes
Yes
Yes
No
No
Is specific fuel
use data available
for the source
Use measurements Tier
3 approach and
combine with country
specific EFs from Tier 2
Can modelled fuel
consumption be reconciled
with national fuel statistics
from independent
sources
Use model Tier 3
approach
No
No
No
Yes
1A1 Energy industries
EMEPEEA air pollutant emission inventory guidebook 2019 14
342 Tier 1 default approach
3421 Algorithm
The Tier 1 approach for process emissions from combustion uses the general equation
pollutantptionfuelconsumpollutant EFARE (1)
Epollutant annual emission of pollutant
EFpollutant emission factor of pollutant
ARfuel consumption activity rate by fuel consumption
This equation is applied at the national level using annual national total fuel use (disaggregated by
fuel type) Information on fuel consumption suitable for estimating emissions using the simpler
estimation methodology is widely available from UN statistical yearbooks or national statistics
The Tier 1 emission factors assume an average or typical technology and abatement
implementation
In cases where specific combustion technology and abatement techniques are to be taken into
account a Tier 1 method is not applicable and a Tier 2 or Tier 3 approach must be used Some
further detail on NOx and SO2 emission controls and abatement efficiency are provided in
Appendix B
3422 Default Tier 1 emission factors (EF)
The Tier 1 default emission factors derived from available data and information have been
developed for key fuel groups (Table 3-1) and are given in Table 3-2 to Table 3-7
Table 3-1 Tier 1 fuel classifications
Tier 1 Fuel type Associated fuel types
Hard coal Coking coal other bituminous coal sub-bituminous coal coke manufactured
lsquopatentrsquo fuel
Brown coal Lignite oil shale manufactured lsquopatentrsquo fuel peat
Gaseous fuels Natural gas natural gas liquids liquefied petroleum gas refinery gas (EFs for
refinery gas are available in section 42) gas works gas coke oven gas blast
furnace gas
Heavy fuel oil Residual fuel oil refinery feedstock petroleum coke orimulsion bitumen
Light oil Gas oil kerosene naphtha shale oil
Biomass Wood charcoal vegetable (agricultural) waste
Note The associated fuel types indicated in Table 3-2 are based on the emission characteristics and are not to
be used for categorising fuels into the main fuel groups (solid liquid gaseous biomass) used for reporting
The emission factors provided in Table 3-2 to Table 3-7 have been derived from available materials
taking into account the results of an assessment of emission factors included in previous versions
of the Guidebook and elsewhere including the newer information from the BREF document on Best
Available Techniques in Large Combustion Plants (European Commission 2006) The emission
factors are grouped by major fuel types In the absence of detail on types and relative use of types
1A1 Energy industries
EMEPEEA air pollutant emission inventory guidebook 2019 15
of combustion or abatement technology which will be different for each country the proposed
factors represent a mean for the range of technologies in use with the 95 figures a measure of the
range of emissions in the sector The factors will represent a very wide range of combustion
technologies and emissions they do not represent BAT or unabated emissions
Note that NOx emission factors are expressed as NO2 and that PCDDF emission factors are
presented as I-TEQ (NATO) toxic equivalents
Emission factors for sulphur oxides are provided in the Tier 1 tables but these assume no SO2
abatement and a defined fuel sulphur content Where countries have no FGD and have knowledge
of fuel sulphur content then it is recommended that a sulphur oxides emission factor is calculated
from fuel sulphur content assuming 100 conversion to SO2 and no retention in ash
EF SO2 = [S] x 20000 CVNet
where
EF SO2 is the SO2 emission factor (gGJ)
[S] is sulphur content of the fuel ( ww)
CVNet is fuel CV (GJtonne net basis)
For emission factors for the combustion of waste please refer to Chapters 6Ca 6Cb and 6Cc
depending on the type of waste that is being combusted
The BC emission factors presented in this Guidance are derived on the basis of EC and it is therefore
assumed that BC=EC
Table 3-2 Tier 1 emission factors for source category 1A1a using hard coal
Tier 1 default emission factors
Code Name
NFR Source Category 1A1a Public electricity and heat production
Fuel Hard Coal
Not applicable
Not estimated NH3
Pollutant Value Unit 95 confidence
interval
Reference
Lower Upper
NOx 209 gGJ 200 350 US EPA (1998) chapter 11
CO 87 gGJ 615 15 US EPA (1998) chapter 11
NMVOC 10 gGJ 06 24 US EPA (1998) chapter 11
SOx 820 gGJ 330 5000 See Note
TSP 114 gGJ 3 300 US EPA (1998) chapter 11
PM10 77 gGJ 2 200 US EPA (1998) chapter 11
PM25 34 gGJ 09 90 US EPA (1998) chapter 11
BC 22 of PM25 027 808 See Note
Pb 73 mgGJ 516 12 US EPA (1998) chapter 11
Cd 09 mgGJ 0627 146 US EPA (1998) chapter 11
Hg 14 mgGJ 102 238 US EPA (1998) chapter 11
As 71 mgGJ 504 118 US EPA (1998) chapter 11
Cr 45 mgGJ 32 746 US EPA (1998) chapter 11
Cu 78 mgGJ 0233 155 Expert judgement derived
from EMEPEEA (2006)
Ni 49 mgGJ 344 803 US EPA (1998) chapter 11
Se 23 mgGJ 16 373 US EPA (1998) chapter 11
1A1 Energy industries
EMEPEEA air pollutant emission inventory guidebook 2019 16
Zn 19 mgGJ 775 155 Expert judgement derived
from EMEPEEA (2006)
PCB 33 ng WHO-
TEGGJ
11 99 Grochowalski amp
Konieczyński 2008
PCDDF 10 ng I-
TEQGJ
5 15 UNEP (2005) Coal fired
power boilers
Benzo(a)pyrene 07 microgGJ 0245 221 US EPA (1998) chapter 11
Benzo(b)fluoranthene 37 microgGJ 37 370 Wenborn et al 1999
Benzo(k)fluoranthene 29 microgGJ 29 290 Wenborn et al 1999
Indeno(123-cd)pyrene 11 microgGJ 0591 236 US EPA (1998) chapter 11
HCB 67 microgGJ 22 201 Grochowalski amp
Konieczyński 2008
Notes
The default tier 1 emission factors are based on the tier 2 emission factors for dry bottom boilers For conversion
of the US EPA data the heating value as provided in the reference has been used (26 MMBTUton) This has been
converted to NCV using a factor of 095 Furthermore units have been converted using 10550559 JBTU and
45359237 glb
The EFs for benzo(b)fluoranthene and benzo(k)fluoranthene are converted using the average NCV for other
bituminous coal of 241 GJton from Energy Statistics Manual (OECDIEA 2005)
The factor for SOx assumes no SO2 abatement and is based on 1 mass sulphur content using EF calculation
from subsection 3422 of the present chapter 95 confidence intervals calculated using range from Table C-1
in Appendix C
The BC share is derived as the average of data from Henry amp Knapp (1980) Olmez et al (1988) Watson et al
(2001) Fisher et al (1979) Griest amp Tomkins (1984) Engelbrecht et al (2002) Chow et al (2004) and Speciate (US
EPA 2011)
The TSP PM10 and PM25 emission factors represent filterable PM emissions and are based on an ash content of
82 Note that condensable PM emission factors are also provided in US EPA (1998) Chapter 11
Table 3-3 Tier 1 emission factors for source category 1A1a using brown coal
Tier 1 default emission factors
Code Name
NFR Source Category 1A1a Public electricity and heat production
Fuel Brown Coal
Not applicable
Not estimated NH3 PCB HCB
Pollutant Value Unit 95 confidence
interval
Reference
Lower Upper
NOx 247 gGJ 143 571 US EPA (1998) chapter 17
CO 87 gGJ 672 605 US EPA (1998) chapter 17
NMVOC 14 gGJ 084 336 US EPA (1998) chapter 17
SOx 1680 gGJ 330 5000 See Note
TSP 117 gGJ 12 117 US EPA (1998) chapter 17
PM10 79 gGJ 1 79 US EPA (1998) chapter 17
PM25 32 gGJ 1 32 US EPA (1998) chapter 17
BC 1 of PM25 01 4 Kupiainen and Klimont 2007
Pb 15 mgGJ 106 247 US EPA (1998) chapter 17
Cd 18 mgGJ 129 3 US EPA (1998) chapter 17
Hg 29 mgGJ 209 488 US EPA (1998) chapter 17
As 143 mgGJ 103 241 US EPA (1998) chapter 17
Cr 91 mgGJ 655 153 US EPA (1998) chapter 17
Cu 10 mgGJ 02 5 EMEPEEA (2006)
Ni 97 mgGJ 706 165 US EPA (1998) chapter 17
Se 45 mgGJ 328 765 US EPA (1998) chapter 17
Zn 88 mgGJ 0504 168 EMEPEEA (2006)
1A1 Energy industries
EMEPEEA air pollutant emission inventory guidebook 2019 17
PCBs 33 ng WHO-
TEGGJ
11 99 Grochowalski amp Konieczyński 2008
PCDDF 10 ng I-
TEQGJ
5 15 UNEP (2005) Coal fired power boilers
Benzo(a)pyrene 13 microgGJ 026 65 US EPA (1998) chapter 17
Benzo(b)fluoranthene 37 microgGJ 37 370 Wenborn et al 1999
Benzo(k)fluoranthene 29 microgGJ 29 290 Wenborn et al 1999
Indeno(123-cd)pyrene 21 microgGJ 042 105 US EPA (1998) chapter 17
HCB 67 microgGJ 22 201 Grochowalski amp Konieczyński 2008
Notes
The tier 1 default emission factors are based on the tier 2 emission factors for drywet bottom boilers
For conversion of the US EPA data the heating value as provided in the reference has been used (6500 BTUlb)
This has been converted to NCV using a factor of 095 Furthermore units have been converted using 10550559
JBTU 2000 lbton and 45359237 glb The EFs for Cu and Zn are converted using the average NCV 119 GJMg
from IPCC Guidelines (IPCC 2006)
The factor for SOx assumes no SO2 abatement and is based on 1 mass sulphur content using EF calculation
from subsection 3422 of the present chapter 95 confidence intervals calculated using range from Table C-1
in Appendix C
The TSP PM10 and PM25 emission factors represent filterable PM emissions and are based on an ash content of
5 Note that condensable PM emission factors are also provided in US EPA (1998) Chapter 17
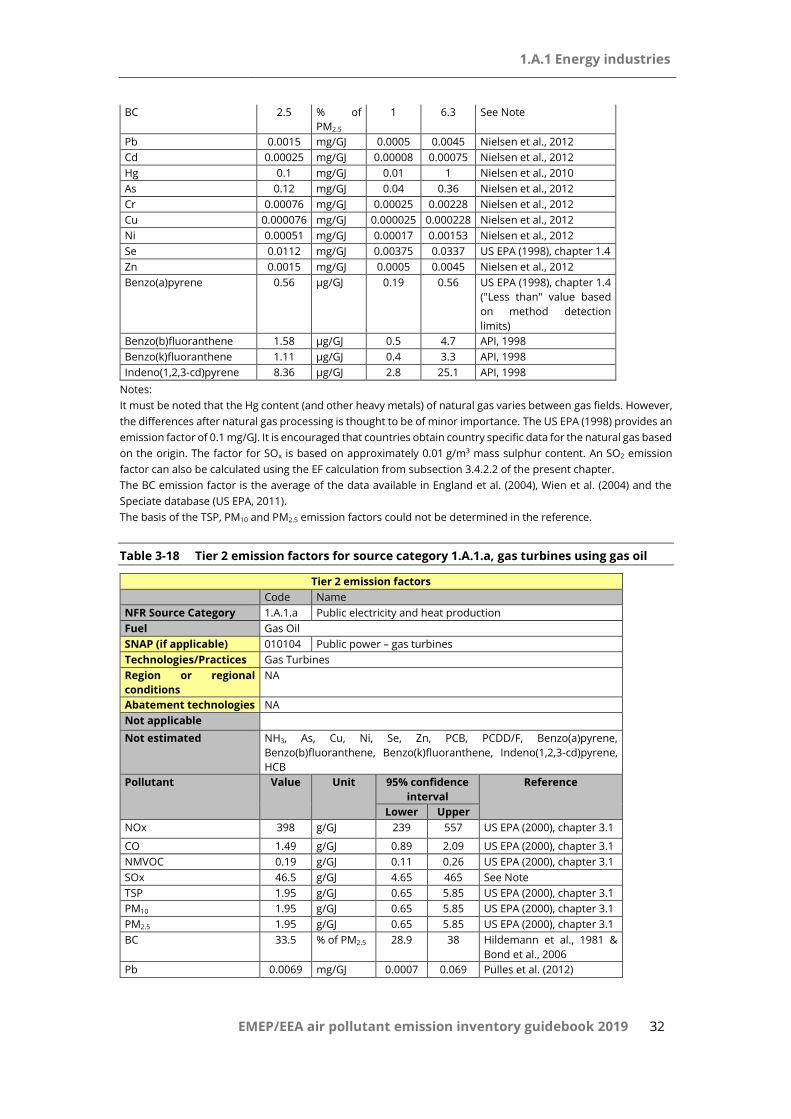
Table 3-4 Tier 1 emission factors for source category 1A1a using gaseous fuels
Tier 1 default emission factors
Code Name
NFR Source Category 1A1a Public electricity and heat production
Fuel Gaseous fuels
Not applicable
Not estimated NH3 PCBs HCB
Pollutant Value Unit 95 confidence
interval
Reference
Lower Upper
NOx 89 gGJ 15 185 US EPA (1998) chapter 14
CO 39 gGJ 20 60 US EPA (1998) chapter 14
NMVOC 26 gGJ 065 104 US EPA (1998) chapter 14
SOx 0281 gGJ 0169 0393 US EPA (1998) chapter 14
TSP 089 gGJ 0445 134 US EPA (1998) chapter 14
PM10 089 gGJ 0445 134 US EPA (1998) chapter 14
PM25 089 gGJ 0445 134 US EPA (1998) chapter 14
BC 25 of PM25 1 63 See Note
Pb 00015 mgGJ 00005 00045 Nielsen et al 2012
Cd 000025 mgGJ 000008 000075 Nielsen et al 2012
Hg 01 mgGJ 001 1 Nielsen et al 2010
As 012 mgGJ 004 036 Nielsen et al 2012
Cr 000076 mgGJ 000025 000228 Nielsen et al 2012
Cu 0000076 mgGJ 0000025 0000228 Nielsen et al 2012
Ni 000051 mgGJ 000017 000153 Nielsen et al 2012
Se 00112 mgGJ 000375 00337 US EPA (1998) chapter 14
Zn 00015 mgGJ 00005 00045 Nielsen et al 2012
PCDDF 05 ng I-
TEQGJ
025 075 UNEP (2005)
Benzo(a)pyrene 056 microgGJ 019 056 US EPA (1998) chapter 14 (Less
than value based on method
detection limits)
1A1 Energy industries
EMEPEEA air pollutant emission inventory guidebook 2019 18
Benzo(b)fluoranthene 084 microgGJ 028 084 US EPA (1998) chapter 14 (Less
than value based on method
detection limits)
Benzo(k)fluoranthene 084 microgGJ 028 084 US EPA (1998) chapter 14 (Less
than value based on method
detection limits)
Indeno(123-cd)pyrene 084 microgGJ 028 084 US EPA (1998) chapter 14 (Less
than value based on method
detection limits)
Notes
For conversion of the US EPA data the heating value as provided in the reference has been used (102 BTUscf)
This has been converted to NCV using a factor of 090 Furthermore units have been converted using 10550559
JBTU and 45359237 glb
The factor for SOx is based on approximately 001 gm3 mass sulphur content Emission factor for PCDDF is stated
to be applicable light fuel oil and natural gas use in power station boilers but is based mainly on data from oil
combustion UNEP also reports limited data for gas combustion of between 002 and 003 ng TEQGJ for natural
gas-fired boilers
The BC emission factor is the average of the data available in England et al (2004) Wien et al (2004) and the
Speciate database (US EPA 2011)
The TSP PM10 and PM25 emission factors represent filterable PM emissions Note that condensable PM emission
factors are also provided in US EPA (1998) Chapter 14
Table 3-5 Tier 1 emission factors for source category 1A1a using heavy fuel oil
Tier 1 default emission factors
Code Name
NFR Source Category 1A1a Public electricity and heat production
Fuel Heavy Fuel Oil
Not applicable
Not estimated NH3 PCBs Benzo(a)pyrene HCB
Pollutant Value Unit 95 confidence
interval
Reference
Lower Upper
NOx 142 gGJ 70 300 US EPA (2010) chapter 13
CO 151 gGJ 906 211 US EPA (2010) chapter 13
NMVOC 23 gGJ 14 32 US EPA (2010) chapter 13
SOx 495 gGJ 146 1700 See Note
TSP 354 gGJ 2 200 US EPA (2010) chapter 13
PM10 252 gGJ 15 150 US EPA (2010) chapter 13
PM25 193 gGJ 09 90 US EPA (2010) chapter 13
BC 56 of PM25 022 869 See Note
Pb 456 mgGJ 228 911 US EPA (2010) chapter 13
Cd 12 mgGJ 06 24 US EPA (2010) chapter 13
Hg 0341 mgGJ 017 0682 US EPA (2010) chapter 13
As 398 mgGJ 199 797 US EPA (2010) chapter 13
Cr 255 mgGJ 127 51 US EPA (2010) chapter 13
Cu 531 mgGJ 266 106 US EPA (2010) chapter 13
Ni 255 mgGJ 127 510 US EPA (2010) chapter 13
Se 206 mgGJ 103 412 US EPA (2010) chapter 13
Zn 878 mgGJ 439 176 US EPA (2010) chapter 13
PCDDF 25 ng I-
TEQGJ
125 375 UNEP (2005) Heavy fuel
fired power boilers
Benzo(b)fluoranthene 45 microgGJ 15 135 US EPA (2010) chapter 13
Benzo(k)fluoranthene 45 microgGJ 15 135 US EPA (2010) chapter 13
Indeno(123-cd)pyrene 692 microgGJ 346 138 US EPA (2010) chapter 13
Note
1A1 Energy industries
EMEPEEA air pollutant emission inventory guidebook 2019 19
For conversion of the US EPA data the heating value as provided in the reference has been used (150 MMBTU103
gal) This has been converted to NCV using a factor of 095 Furthermore units have been converted using
10550559 JBTU and 45359237 glb
The factor for SOx assumes no SO2 abatement and is based on 1 mass sulphur content using EF calculation
from subsection 3422 of the present chapter 95 confidence intervals calculated using range from Table C-1
in Appendix C
The BC emission factor is derived as the average of the data found in Olmez et al (1988) England et al (2007)
and the Speciate database (US EPA 2011)
The TSP PM10 and PM25 emission factors represent filterable PM emissions and are based on a sulphur content
of 1 Note that condensable PM emission factors are also provided in US EPA (1998) Chapter 13
Table 3-6 Tier 1 emission factors for source category 1A1a using gas oil
Tier 1 default emission factors
Code Name
NFR Source Category 1A1a Public electricity and heat production
Fuel Gas oil
Not applicable
Not estimated NH3 PCB Benzo(a)pyrene Benzo(b)fluoranthene
Benzo(k)fluoranthene HCB
Pollutant Value Unit 95 confidence
interval
Reference
Lower Upper
NOx 65 gGJ 22 195 US EPA (1998) chapter 13
CO 162 gGJ 4 65 US EPA (1998) chapter 13
NMVOC 08 gGJ 048 128 US EPA (1998) chapter 13
SOx 465 gGJ 465 465 See Note
TSP 65 gGJ 2 20 US EPA (1998) chapter 13
PM10 32 gGJ 1 10 US EPA (1998) chapter 13
PM25 08 gGJ 03 25 US EPA (1998) chapter 13
BC 335 of PM25 289 38 Hildemann et al 1981 amp
Bond et al 2006
Pb 407 mgGJ 041 40 US EPA (1998) chapter 13
Cd 136 mgGJ 014 15 US EPA (1998) chapter 13
Hg 136 mgGJ 014 15 US EPA (1998) chapter 13
As 181 mgGJ 018 20 US EPA (1998) chapter 13
Cr 136 mgGJ 014 15 US EPA (1998) chapter 13
Cu 272 mgGJ 027 30 US EPA (1998) chapter 13
Ni 136 mgGJ 014 15 US EPA (1998) chapter 13
Se 679 mgGJ 068 70 US EPA (1998) chapter 13
Zn 181 mgGJ 018 20 US EPA (1998) chapter 13
PCDDF 05 ng I-
TEQGJ
025 1 UNEP 2005
Indeno(123-cd)pyrene 692 microgGJ 346 138 US EPA (1998) chapter 13
Note
For conversion of the US EPA data the heating value as provided in the reference has been used (140 MMBTU103
gal) This has been converted to NCV using a factor of 095 Furthermore units have been converted using
10550559 JBTU and 45359237 glb
The factor for SOx assumes no SO2 abatement and is based on 01 mass sulphur content
The TSP PM10 and PM25 emission factors represent filterable PM emissions Note that condensable PM emission
factors are also provided in US EPA (1998) Chapter 13
1A1 Energy industries
EMEPEEA air pollutant emission inventory guidebook 2019 20
Table 3-7 Tier 1 emission factors for source category 1A1a using biomass
Tier 1 default emission factors
Code Name
NFR Source Category 1A1a Public electricity and heat production
Fuel Biomass
Not applicable
Not estimated NH3
Pollutant Value Unit 95 confidence
interval
Reference
Lower Upper
NOx 81 gGJ 40 160 Nielsen et al 2010
CO 90 gGJ 45 180 Nielsen et al 2010
NMVOC 731 gGJ 244 219 US EPA (2003) chapter 16
SOx 108 gGJ 645 151 US EPA (2003) chapter 16
TSP 172 gGJ 86 344 US EPA (2003) chapter 16
PM10 155 gGJ 77 310 US EPA (2003) chapter 16
PM25 133 gGJ 66 266 US EPA (2003) chapter 16
BC 33 of PM25 16 66 See Note
Pb 206 mgGJ 124 289 US EPA (2003) chapter 16
Cd 176 mgGJ 106 247 US EPA (2003) chapter 16
Hg 151 mgGJ 0903 211 US EPA (2003) chapter 16
As 946 mgGJ 568 132 US EPA (2003) chapter 16
Cr 903 mgGJ 542 126 US EPA (2003) chapter 16
Cu 211 mgGJ 126 295 US EPA (2003) chapter 16
Ni 142 mgGJ 851 199 US EPA (2003) chapter 16
Se 12 mgGJ 0722 169 US EPA (2003) chapter 16
Zn 181 mgGJ 108 253 US EPA (2003) chapter 16
PCB 35 microgGJ 035 35 US EPA (2003) chapter 16
PCDDF 50 ng I-
TEQGJ
25 75 UNEP (2005) (for clean
wood)
Benzo(a)pyrene 112 mgGJ 0671 157 US EPA (2003) chapter 16
Benzo(b)fluoranthene 0043 mgGJ 00215 00645 US EPA (2003) chapter 16
Benzo(k)fluoranthene 00155 mgGJ 000774 00232 US EPA (2003) chapter 16
Indeno(123-cd)pyrene 00374 mgGJ 00187 00561 US EPA (2003) chapter 16
HCB 5 microgGJ 05 50 Bailey 2001
Note For conversion of the US EPA data units have been converted using 10550559 JBTU and 45359237 glb
The BC emission factor is an average of the data in Dayton amp Bursey (2001) and the Speciate database (US EPA
2011)
The TSP PM10 and PM25 emission factors represent filterable PM emissions Note that a condensable PM
emission factor is also provided in US EPA (1998) Chapter 16
3423 Tier 1 activity data
Information on the use of energy and production of power suitable for estimating emissions using
the Tier 1 simpler estimation methodology is available from national statistics agencies or the
International Energy Agency (IEA)
Further guidance is provided in the 2006 IPCC Guidelines for National Greenhouse Gas Inventories
volume 2 on Stationary Combustion
wwwipcc-nggipigesorjppublic2006glpdf2_Volume2V2_2_Ch2_Stationary_Combustionpdf
The activity rate and the emission factor have to be determined on the same level of aggregation
depending on the availability of data The activity statistic should be determined within the
considered country or region by using adequate statistics The activity should refer to the energy
input of the emission sources considered (net or inferior fuel consumption in [GJ])
1A1 Energy industries
EMEPEEA air pollutant emission inventory guidebook 2019 21
343 Tier 2 technology-specific approach
3431 Algorithm
The Tier 2 approach is similar to the Tier 1 approach To apply the Tier 2 approach both the activity
data and the emission factors need to be applied according to a countryrsquos fuel usage and installed
combustion technologies These techniques may include
relative mix of fuels
types of combustion plant
There are two approaches possible
disaggregate the fuel use in the country to model the different combustion and abatement types
into the inventory by
a) defining the activity data using each of the identified process types (together called
lsquotechnologiesrsquo in the formulae below) separately and
b) applying technology-specific emission factors for each process type
estechnologi
pollutanttechnologytechnologyproductionpollutant EFARE (2)
develop country-specific emission factors from the understanding of the relative contributions of
the different technologies within the national combustion plant portfolio (and relative fuel use)
and apply this country-specific emission factor for the national fuel use
pollutantcountryproductionpollutant
estechnologi
pollutanttechnologytechnologypollutantcountry
EFARE
EFnPenetratioEF
(3)
Both approaches are mathematically very similar or even identical Using one or the other
approach depends mainly on the availability of data If the activity data are indeed available the
first approach seems to be more appropriate If however no direct activity data are available
penetration of different technologies within the industry could be estimated from data on
capacities or other surrogate data that reflect relative sizes of facilities using the different
technologies
3432 Technology-specific emission factors
Applying a Tier 2 approach for the process emissions from public power and heat production
technology-specific emission factors are needed The main technology distinction is by combustion
unit type (boiler technologies gas turbine stationary engine) and fuel type Note that factors for
smaller combustion units (lt 50 MWth) are provided in Chapter 1A4 where available size-based
factors for boilers are also provided for Example factors are provided in this section however it
should be noted that these cannot address every fuel combustion and abatement combination that
can exist The number of sources in this activity is usually comparatively small and the inventory
compiler may wish to consider gathering data to allow a Tier 3 approach as a more robust
methodology Knowledge of emission concentrations and emission limit values (ELVs) can allow a
first estimation of emission factors without detailed knowledge of plant combustion and abatement
technology
1A1 Energy industries
EMEPEEA air pollutant emission inventory guidebook 2019 22
Emission factors derived from the achievable emission levels values (AELs) as defined in the BREF
document are provided in subsection 631 for comparison In addition ELVs for selected emission
instruments are provided as emission factors in Appendix D
Table 3-8 Technology-specific Tier 2 factors
Combustion technology Relevant fuels
Dry bottom boiler Coking coal steam coal sub-bituminous coal brown coal lignite
wood peat coke oven coke residual oil natural gas
Wet bottom boiler Coking coal steam coal sub-bituminous coal brown coal lignite
Fluid bed boiler Hard coal brown coal
Gas turbine Natural gas gas oil refinery gas blast furnace gas
Stationary engine Natural gas gas oil
This section provides a series of technology-specific pollutant emission factors for combustion these
factors represent a wider range of fuels and combustion technologies than for Tier 1 They do not
represent specific combustion and abatement technologies (which would be needed in a Tier 3
approach) but do offer more disaggregation than Tier 1 Extension of Tier 2 to reflect emission
abatement is possible through use of factors derived from emission data
The BC emission factors presented in this Guidance are derived on the basis of EC and it is therefore
assumed that BC=EC
1A1 Energy industries
EMEPEEA air pollutant emission inventory guidebook 2019 23
Table 3-9 Tier 2 emission factors for source category 1A1a dry bottom boilers using
coking coal steam coal and sub-bituminous coal
Tier 2 emission factors
Code Name
NFR Source Category 1A1a Public electricity and heat production
Fuel Coking Coal Steam Coal amp Sub-Bituminous Coal
SNAP (if applicable) 010101
010102
Public power - Combustion plants gt= 300 MW (boilers)
Public power - Combustion plants gt= 50 and lt 300 MW (boilers)
TechnologiesPractices Dry Bottom Boilers
Region or regional
conditions
NA
Abatement technologies Abatement assumed except for SO2 EF
Not applicable
Not estimated NH3
Pollutant Value Unit 95 confidence
interval
Reference
Lower Upper
NOx 209 gGJ 200 350 US EPA (1998) chapter 11
CO 87 gGJ 615 15 US EPA (1998) chapter 11
NMVOC 10 gGJ 06 24 US EPA (1998) chapter 11
SOx 820 gGJ 330 5000 See Note
TSP 114 gGJ 3 300 US EPA (1998) chapter 11
PM10 77 gGJ 2 200 US EPA (1998) chapter 11
PM25 34 gGJ 09 90 US EPA (1998) chapter 11
BC 22 of PM25 027 808 See Note
Pb 73 mgGJ 516 12 US EPA (1998) chapter 11
Cd 09 mgGJ 0627 146 US EPA (1998) chapter 11
Hg 14 mgGJ 102 238 US EPA (1998) chapter 11
As 71 mgGJ 504 118 US EPA (1998) chapter 11
Cr 45 mgGJ 32 746 US EPA (1998) chapter 11
Cu 78 mgGJ 0233 155 Expert judgement derived from
EMEPEEA (2006)
Ni 49 mgGJ 344 803 US EPA (1998) chapter 11
Se 23 mgGJ 16 373 US EPA (1998) chapter 11
Zn 19 mgGJ 775 155 Expert judgement derived from
EMEPEEA (2006)
PCB 33 ng WHO-
TEGGJ
11 99 Grochowalski amp Konieczyński
2008
PCDDF 10 ng I-TEQGJ 5 15 UNEP (2005) Coal fired power
boilers
Benzo(a)pyrene 07 microgGJ 0245 221 US EPA (1998) chapter 11
Benzo(b)fluoranthene 37 microgGJ 37 370 Wenborn et al 1999
Benzo(k)fluoranthene 29 microgGJ 29 290 Wenborn et al 1999
Indeno(123-cd)pyrene 11 microgGJ 0591 236 US EPA (1998) chapter 11
HCB 67 microgGJ 22 201 Grochowalski amp Konieczyński
2008
Notes
For conversion of the US EPA data the heating value as provided in the reference has been used (26 MMBTUton)
This has been converted to NCV using a factor of 095 Furthermore units have been converted using 10550559
JBTU and 45359237 glb The EFs for benzo(b)fluoranthene and benzo(k)fluoranthene are converted using the
average NCV for other bituminous coal of 241 GJton from Energy Statistics Manual (OECDIEA 2005)
The factor for SOx assumes no SO2 abatement and is based on 1 mass sulphur content using EF calculation
from subsection 3422 of the present chapter 95 confidence intervals calculated using range from Table C-1
in Appendix C
1A1 Energy industries
EMEPEEA air pollutant emission inventory guidebook 2019 24
The BC share is derived as the average of data from Henry amp Knapp (1980) Olmez et al (1988) Watson et al
(2001) Fisher et al (1979) Griest amp Tomkins (1984) Engelbrecht et al (2002) Chow et al (2004) and Speciate (US
EPA 2011)
The TSP PM10 and PM25 emission factors represent filterable PM emissions and are based on an ash content of
82 Note that condensable PM emission factors are also provided in US EPA (1998) Chapter 11
Table 3-10 Tier 2 emission factors for source category 1A1a wet and dry bottom boilers
using brown coallignite
Tier 2 emission factors
Code Name
NFR Source Category 1A1a Public electricity and heat production
Fuel Brown CoalLignite
SNAP (if applicable) 010101
010102
Public power - Combustion plants gt= 300 MW (boilers)
Public power - Combustion plants gt= 50 and lt 300 MW (boilers)
TechnologiesPractices Wet and Dry Bottom Boilers
Region or regional
conditions
NA
Abatement technologies NA
Not applicable
Not estimated BC NH3
Pollutant Value Unit 95 confidence
interval
Reference
Lower Upper
NOx 247 gGJ 143 571 US EPA (1998) chapter 17
CO 87 gGJ 672 605 US EPA (1998) chapter 17
NMVOC 14 gGJ 084 336 US EPA (1998) chapter 17
SOx 1680 gGJ 330 5000 See Note
TSP 117 gGJ 12 117 US EPA (1998) chapter 17
PM10 79 gGJ 1 79 US EPA (1998) chapter 17
PM25 32 gGJ 1 32 US EPA (1998) chapter 17
Pb 15 mgGJ 106 247 US EPA (1998) chapter 17
Cd 18 mgGJ 129 3 US EPA (1998) chapter 17
Hg 29 mgGJ 209 488 US EPA (1998) chapter 17
As 143 mgGJ 103 241 US EPA (1998) chapter 17
Cr 91 mgGJ 655 153 US EPA (1998) chapter 17
Cu 10 mgGJ 02 5 EMEPEEA (2006)
Ni 97 mgGJ 706 165 US EPA (1998) chapter 17
Se 45 mgGJ 328 765 US EPA (1998) chapter 17
Zn 88 mgGJ 0504 168 EMEPEEA (2006)
PCBs 33 ng WHO-
TEGGJ
11 99 Grochowalski amp Konieczyński
2008
PCDDF 10 ng I-
TEQGJ
5 15 UNEP (2005) Coal fired power
boilers
Benzo(a)pyrene 13 microgGJ 026 65 US EPA (1998) chapter 17
Benzo(b)fluoranthene 37 microgGJ 37 370 Wenborn et al 1999
Benzo(k)fluoranthene 29 microgGJ 29 290 Wenborn et al 1999
Indeno(123-cd)pyrene 21 microgGJ 042 105 US EPA (1998) chapter 17
HCB 67 microgGJ 22 201 Grochowalski amp Konieczyński
2008
Notes
For conversion of the US EPA data the heating value as provided in the reference has been used (6500 BTUlb)
This has been converted to NCV using a factor of 095 Furthermore units have been converted using 10550559
JBTU 2000 lbton and 45359237 glb The EFs for Cu and Zn are converted using the average NCV 119 GJMg
from IPCC Guidelines (IPCC 2006)
1A1 Energy industries
EMEPEEA air pollutant emission inventory guidebook 2019 25
The factor for SOx assumes no SO2 abatement and is based on 1 mass sulphur content using EF calculation
from subsection 3422 of the present chapter 95 confidence intervals calculated using range from Table C-1
in Appendix C
The emission factors for PCBs benzo(b)fluoranthene benzo(k)fluoranthene and HCB are based on data for hard
coal combustion in dry bottom boilers
The TSP PM10 and PM25 emission factors represent filterable PM emissions and are based on an ash content of
5 Note that condensable PM emission factors are also provided in US EPA (1998) Chapter 17
Table 3-11 Tier 2 emission factors for source category 1A1a dry bottom boilers using
residual oil
Tier 2 emission factors
Code Name
NFR Source Category 1A1a Public electricity and heat production
Fuel Residual Oil
SNAP (if applicable) 010101
010102
Public power - Combustion plants gt= 300 MW (boilers)
Public power - Combustion plants gt= 50 and lt 300 MW
(boilers)
TechnologiesPractices Dry Bottom Boilers
Region or regional
conditions
NA
Abatement technologies NA
Not applicable
Not estimated NH3 PCBs Benzo(a)pyrene HCB
Pollutant Value Unit 95 confidence
interval
Reference
Lower Upper
NOx 142 gGJ 70 300 US EPA (2010) chapter 13
CO 151 gGJ 906 211 US EPA (2010) chapter 13
NMVOC 23 gGJ 14 32 US EPA (2010) chapter 13
SOx 495 gGJ 146 1700 See Note
TSP 354 gGJ 2 200 US EPA (2010) chapter 13
PM10 252 gGJ 15 150 US EPA (2010) chapter 13
PM25 193 gGJ 09 90 US EPA (2010) chapter 13
BC 56 of PM25 022 869 See Note
Pb 456 mgGJ 228 911 US EPA (2010) chapter 13
Cd 12 mgGJ 06 24 US EPA (2010) chapter 13
Hg 0341 mgGJ 017 0682 US EPA (2010) chapter 13
As 398 mgGJ 199 797 US EPA (2010) chapter 13
Cr 255 mgGJ 127 51 US EPA (2010) chapter 13
Cu 531 mgGJ 266 106 US EPA (2010) chapter 13
Ni 255 mgGJ 127 510 US EPA (2010) chapter 13
Se 206 mgGJ 103 412 US EPA (2010) chapter 13
Zn 878 mgGJ 439 176 US EPA (2010) chapter 13
PCDDF 25 ng I-
TEQGJ
125 375 UNEP (2005) Heavy fuel
fired power boilers
Benzon(b)fluoranthene 45 microgGJ 15 135 US EPA (2010) chapter 13
Benzon(k)fluoranthene 45 microgGJ 15 135 US EPA (2010) chapter 13
Indeno(123-cd)pyrene 692 microgGJ 346 138 US EPA (2010) chapter 13
Note
For conversion of the US EPA data the heating value as provided in the reference has been used (150 MMBTU103
gal) This has been converted to NCV using a factor of 095 Furthermore units have been converted using
10550559 JBTU and 45359237 glb
1A1 Energy industries
EMEPEEA air pollutant emission inventory guidebook 2019 26
The factor for SOx assumes no SO2 abatement and is based on 1 mass sulphur content using EF calculation
from subsection 3422 of the present chapter 95 confidence intervals calculated using range from Table C-1
in Appendix C
The BC emission factor is derived as the average of the data found in Olmez et al (1988) England et al (2007)
and the Speciate database (US EPA 2011)
The TSP PM10 and PM25 emission factors represent filterable PM emissions and are based on a sulphur content
of 1 Note that condensable PM emission factors are also provided in US EPA (1998) Chapter 13
Table 3-12 Tier 2 emission factors for source category 1A1a dry bottom boilers using
natural gas
Tier 2 emission factors
Code Name
NFR Source Category 1A1a Public electricity and heat production
Fuel Natural Gas
SNAP (if applicable) 010101
010102
Public power - Combustion plants gt= 300 MW (boilers)
Public power - Combustion plants gt= 50 and lt 300 MW
(boilers)
TechnologiesPractices Dry Bottom Boilers
Region or regional
conditions
NA
Abatement
technologies
NA
Not applicable
Not estimated NH3 PCBs HCB
Pollutant Value Unit 95 confidence
interval
Reference
Lower Upper
NOx 89 gGJ 15 185 US EPA (1998) chapter 14
CO 39 gGJ 20 60 US EPA (1998) chapter 14
NMVOC 26 gGJ 065 104 US EPA (1998) chapter 14
SOx 0281 gGJ 0169 0393 US EPA (1998) chapter 14
TSP 089 gGJ 0445 134 US EPA (1998) chapter 14
PM10 089 gGJ 0445 134 US EPA (1998) chapter 14
PM25 089 gGJ 0445 134 US EPA (1998) chapter 14
BC 25 of PM25 1 63 See Note
Pb 00015 mgGJ 00005 00045 Nielsen et al 2012
Cd 000025 mgGJ 000008 000075 Nielsen et al 2012
Hg 01 mgGJ 001 1 Nielsen et al 2010
As 012 mgGJ 004 036 Nielsen et al 2012
Cr 000076 mgGJ 000025 000228 Nielsen et al 2012
Cu 0000076 mgGJ 0000025 0000228 Nielsen et al 2012
Ni 000051 mgGJ 000017 000153 Nielsen et al 2012
Se 00112 mgGJ 000375 00337 US EPA (1998) chapter 14
Zn 00015 mgGJ 00005 00045 Nielsen et al 2012
PCDDF 05 ng I-
TEQGJ
025 075 UNEP (2005)
Benzo(a)pyrene 056 microgGJ 019 056 US EPA (1998) chapter 14
(Less than value based
on method detection
limits)
Benzo(b)fluoranthene 084 microgGJ 028 084 US EPA (1998) chapter 14
(Less than value based
on method detection
limits)
Benzo(k)fluoranthene 084 microgGJ 028 084 US EPA (1998) chapter 14
(Less than value based
1A1 Energy industries
EMEPEEA air pollutant emission inventory guidebook 2019 27
on method detection
limits)
Indeno(123-cd)pyrene 084 microgGJ 028 084 US EPA (1998) chapter 14
(Less than value based
on method detection
limits)
Notes
For conversion of the US EPA data the heating value as provided in the reference has been used (102 BTUscf)
This has been converted to NCV using a factor of 090 Furthermore units have been converted using 10550559
JBTU and 45359237 glb
The factor for SOx is based on approximately 001 gm3 mass sulphur content
Emission factor for PCDDF is stated to be applicable light fuel oil and natural gas use in power station boilers
but is based mainly on data from oil combustion UNEP also reports limited data for gas combustion of between
002 and 003 ng TEQGJ for natural gas-fired boilers
The BC emission factor is the average of the data available in England et al (2004) Wien et al (2004) and the
Speciate database (US EPA 2011)
The TSP PM10 and PM25 emission factors represent filterable PM emissions Note that condensable PM emission
factors are also provided in US EPA (1998) Chapter 14
Table 3-13 Tier 2 emission factors for source category 1A1a dry bottom boilers using wood
waste
Tier 2 emission factors
Code Name
NFR Source Category 1A1a Public electricity and heat production
Fuel Wood and wood waste (clean wood waste)
SNAP (if applicable) 010101
010102
Public power - Combustion plants gt= 300 MW (boilers)
Public power - Combustion plants gt= 50 and lt 300 MW
(boilers)
TechnologiesPractices Dry Bottom Boilers
Region or regional
conditions
NA
Abatement technologies Primary NOx abatement ndash no PM abatement
Not applicable
Not estimated NH3
Pollutant Value Unit 95 confidence
interval
Reference
Lower Upper
NOx 81 gGJ 40 160 Nielsen et al 2010
CO 90 gGJ 45 180 Nielsen et al 2010
NMVOC 731 gGJ 244 219 US EPA (2003) chapter 16
SOx 108 gGJ 645 151 US EPA (2003) chapter 16
TSP 172 gGJ 86 344 US EPA (2003) chapter 16
PM10 155 gGJ 77 310 US EPA (2003) chapter 16
PM25 133 gGJ 66 266 US EPA (2003) chapter 16
BC 33 of PM25 16 66 See Note
Pb 206 mgGJ 124 289 US EPA (2003) chapter 16
Cd 176 mgGJ 106 247 US EPA (2003) chapter 16
Hg 151 mgGJ 0903 211 US EPA (2003) chapter 16
As 946 mgGJ 568 132 US EPA (2003) chapter 16
Cr 903 mgGJ 542 126 US EPA (2003) chapter 16
Cu 211 mgGJ 126 295 US EPA (2003) chapter 16
Ni 142 mgGJ 851 199 US EPA (2003) chapter 16
Se 12 mgGJ 0722 169 US EPA (2003) chapter 16
Zn 181 mgGJ 108 253 US EPA (2003) chapter 16
1A1 Energy industries
EMEPEEA air pollutant emission inventory guidebook 2019 28
PCB 35 microgGJ 035 35 US EPA (2003) chapter 16
PCDDF 50 ng I-
TEQGJ
25 75 UNEP (2005) (for clean
wood)
Benzo(a)pyrene 112 mgGJ 0671 157 US EPA (2003) chapter 16
Benzo(b)fluoranthene 0043 mgGJ 00215 00645 US EPA (2003) chapter 16
Benzo(k)fluoranthene 00155 mgGJ 000774 00232 US EPA (2003) chapter 16
Indeno(123-cd)pyrene 00374 mgGJ 00187 00561 US EPA (2003) chapter 16
HCB 5 microgGJ 05 50 Bailey 2001
Note For conversion of the US EPA data units have been converted using 10550559 JBTU and 45359237 glb
The BC emission factor is an average of the data in Dayton amp Bursey (2001) and the Speciate database (US EPA
2011)
The TSP PM10 and PM25 emission factors represent filterable PM emissions Note that a condensable PM
emission factor is also provided in US EPA (1998) Chapter 16
Table 3-14 Tier 2 emission factors for source category 1A1a wet bottom boilers using
coking coal steam coal and sub-bituminous coal
Tier 2 emission factors
Code Name
NFR Source Category 1A1a Public electricity and heat production
Fuel Coking Coal Steam Coal amp Sub-Bituminous Coal
SNAP (if applicable) 010101
010102
Public power - Combustion plants gt= 300 MW (boilers)
Public power - Combustion plants gt= 50 and lt 300 MW (boilers)
TechnologiesPractices Wet Bottom Boilers
Region or regional
conditions
NA
Abatement technologies Abatement assumed except for SO2
Not applicable
Not estimated NH3
Pollutant Value Unit 95 confidence
interval
Reference
Lower Upper
NOx 244 gGJ 120 488 US EPA (1998) chapter 11
CO 87 gGJ 615 150 US EPA (1998) chapter 11
NMVOC 07 gGJ 04 16 US EPA (1998) chapter 11
SOx 820 gGJ 330 5000 See Note
TSP 80 gGJ 75 30 US EPA (1998) chapter 11
PM10 60 gGJ 6 24 US EPA (1998) chapter 11
PM25 31 gGJ 3 12 US EPA (1998) chapter 11
BC 22 of PM25 027 808 See Note
Pb 73 mgGJ 516 12 US EPA (1998) chapter 11
Cd 09 mgGJ 0627 146 US EPA (1998) chapter 11
Hg 14 mgGJ 102 238 US EPA (1998) chapter 11
As 71 mgGJ 504 118 US EPA (1998) chapter 11
Cr 45 mgGJ 32 746 US EPA (1998) chapter 11
Cu 90 mgGJ 0233 155 Expert judgement derived from
EMEPEEA (2006)
Ni 49 mgGJ 344 803 US EPA (1998) chapter 11
Se 23 mgGJ 16 373 US EPA (1998) chapter 11
Zn 90 mgGJ 0388 155 Expert judgement derived from
EMEPEEA (2006)
PCB 33 ng WHO-
TEQGJ
11 99 Grochowalski amp Konieczyński
2008
PCDDF 10 ng I-TEQGJ 5 15 UNEP (2005) Coal fired power
boilers
Benzo(a)pyrene 07 microgGJ 0245 221 US EPA (1998) chapter 11
1A1 Energy industries
EMEPEEA air pollutant emission inventory guidebook 2019 29
Benzo(b)fluoranthene 37 microgGJ 37 370 Wenborn et al 1999
Benzo(b)fluoranthene 29 microgGJ 29 290 Wenborn et al 1999
Indeno(123-cd)pyrene 11 microgGJ 0591 236 US EPA (1998) chapter 11
HCB 67 microgGJ 22 201 Grochowalski amp Konieczyński
2008
Note For conversion of the US EPA data the heating value as provided in the reference has been used (26
MMBTUton) This has been converted to NCV using a factor of 095 Furthermore units have been converted
using 10550559 JBTU and 45359237 glb The EFs for benzo(b)fluoranthene and benzo(k)fluoranthene are
converted using the average NCV for other bituminous coal of 241 GJton from Energy Statistics Manual
(OECDIEA 2005)
The factor for SOx assumes no SO2 abatement and is based on 1 mass sulphur content using EF calculation
from subsection 3422 of the present chapter 95 confidence intervals calculated using range from Table C-1
in Appendix C
The BC share is derived as the average of data from Henry amp Knapp (1980) Olmez et al (1988) Watson et al
(2001) Fisher et al (1979) Griest amp Tomkins (1984) Engelbrecht et al (2002) Chow et al (2004) and Speciate (US
EPA 2011)
The TSP PM10 and PM25 emission factors provided in US EPA (1998) Chapter 11 represent filterable PM emissions
and are determined from fuel ash content Note that condensable PM emission factors are also provided in US
EPA (1998) Chapter 11
Table 3-15 Tier 2 emission factors for source category 1A1a fluid bed boilers using hard
coal
Tier 2 emission factors
Code Name
NFR Source Category 1A1a Public electricity and heat production
Fuel Hard Coal
SNAP (if applicable) 010101
010102
Public power - Combustion plants gt= 300 MW (boilers)
Public power - Combustion plants gt= 50 and lt 300 MW (boilers)
TechnologiesPractices Fluid Bed Boilers
Region or regional
conditions
NA
Abatement technologies Abatement assumed except for SO2
Not applicable
Not estimated NH3
Pollutant Value Unit 95 confidence
interval
Reference
Lower Upper
NOx 825 gGJ 10 112 European Commission (2006)
CO 313 gGJ 150 600 US EPA (1998) chapter 11
NMVOC 09 gGJ 06 24 US EPA (1998) chapter 11
SOx 820 gGJ 330 5000 See Note
TSP 84 gGJ 75 30 US EPA (1998) chapter 11
PM10 77 gGJ 6 24 US EPA (1998) chapter 11
PM25 52 gGJ 3 12 US EPA (1998) chapter 11
BC 22 of PM25 027 808 See Note
Pb 73 mgGJ 488 114 US EPA (1998) chapter 11
Cd 09 mgGJ 059 138 US EPA (1998) chapter 11
Hg 14 mgGJ 097 225 US EPA (1998) chapter 11
As 71 mgGJ 477 111 US EPA (1998) chapter 11
Cr 45 mgGJ 302 705 US EPA (1998) chapter 11
Cu 90 mgGJ 023 155 Expert judgement derived from
EMEPEEA (2006)
Ni 49 mgGJ 326 76 US EPA (1998) chapter 11
Se 23 mgGJ 151 353 US EPA (1998) chapter 11
1A1 Energy industries
EMEPEEA air pollutant emission inventory guidebook 2019 30
Zn 90 mgGJ 039 155 Expert judgement derived from
EMEPEEA (2006)
PCBs 33 ng WHO-
TEQGJ
11 99 Grochowalski amp Konieczyński
2008
PCDDF 10 ng I-TEQGJ 5 15 UNEP (2005) Coal fired power
boilers
Benzo(a)pyrene 07 microgGJ 0245 221 US EPA (1998) chapter 11
Benzo(b)fluoranthene 37 microgGJ 37 370 Wenborn et al 1999
Benzo(b)fluoranthene 29 microgGJ 29 290 Wenborn et al 1999
Indeno(123-cd)pyrene 11 microgGJ 0591 236 US EPA (1998) chapter 11
HCB 67 microgGJ 22 201 Grochowalski amp Konieczyński
2008
Note For conversion of the US EPA data the heating value as provided in the reference has been used (26
MMBTUton) This has been converted to NCV using a factor of 095 Furthermore units have been converted
using 10550559 JBTU and 45359237 glb The EFs for benzo(b)fluoranthene and benzo(k)fluoranthene are
converted using the average NCV for other bituminous coal of 241 GJton from Energy Statistics Manual
(OECDIEA 2005)
The factor for SOx assumes no SO2 abatement and is based on 1 mass sulphur content using EF calculation
from subsection 3422 of the present chapter 95 confidence intervals calculated using range from Table C-1
in Appendix C
The BC share is derived as the average of data from Henry amp Knapp (1980) Olmez et al (1988) Watson et al
(2001) Fisher et al (1979) Griest amp Tomkins (1984) Engelbrecht et al (2002) Chow et al (2004) and Speciate (US
EPA 2011)
The basis of the TSP PM10 and PM25 emission factors could not be determined in the reference
Table 3-16 Tier 2 emission factors for source category 1A1a fluid bed boilers using brown
coal
Tier 2 emission factors
Code Name
NFR Source Category 1A1a Public electricity and heat production
Fuel Brown Coal
SNAP (if applicable) 010101
010102
Public power - Combustion plants gt= 300 MW (boilers)
Public power - Combustion plants gt= 50 and lt 300 MW
(boilers)
TechnologiesPractices Fluid Bed Boilers
Region or regional
conditions
NA
Abatement technologies NA
Not applicable
Not estimated BC NH3
Pollutant Value Unit 95 confidence
interval
Reference
Lower Upper
NOx 60 gGJ 35 852 European Commission
(2006)
CO 13 gGJ 01 26 European Commission
(2006)
NMVOC 1 gGJ 02 5 US EPA (1998) chapter 17
SOx 1680 gGJ 330 5000 See Note
TSP 102 gGJ 34 306 US EPA (1998) chapter 17
PM10 69 gGJ 23 207 US EPA (1998) chapter 17
PM25 28 gGJ 09 84 US EPA (1998) chapter 17
Pb 15 mgGJ 106 247 US EPA (1998) chapter 17
Cd 18 mgGJ 129 3 US EPA (1998) chapter 17
Hg 29 mgGJ 209 488 US EPA (1998) chapter 17
1A1 Energy industries
EMEPEEA air pollutant emission inventory guidebook 2019 31
As 143 mgGJ 103 241 US EPA (1998) chapter 17
Cr 91 mgGJ 655 153 US EPA (1998) chapter 17
Cu 10 mgGJ 008 078 Expert judgement derived
from EMEPEEA (2006)
Ni 97 mgGJ 706 165 US EPA (1998) chapter 17
Se 45 mgGJ 328 765 US EPA (1998) chapter 17
Zn 88 mgGJ 05 168 Expert judgement derived
from EMEPEEA (2006)
PCBs 33 ng WHO-
TEQGJ
11 99 Grochowalski amp
Konieczyński 2008
PCDDF 10 ng I-
TEQGJ
5 15 UNEP (2005) Coal fired
power boilers
Benzo(a)pyrene 13 microgGJ 026 65 US EPA (1998) chapter 17
Benzo(b)fluoranthene 37 microgGJ 37 370 Wenborn et al 1999
Benzo(b)fluoranthene 29 microgGJ 29 290 Wenborn et al 1999
Indeno(123-cd)pyrene 21 microgGJ 04 105 US EPA (1998) chapter 17
HCB 67 microgGJ 22 201 Grochowalski amp
Konieczyński 2008
Note
For conversion of the US EPA data the heating value as provided in the reference has been used (6500 BTUlb)
This has been converted to NCV using a factor of 095 Furthermore units have been converted using 10550559
JBTU 2000 lbton and 45359237 glb The EFs for Cu and Zn are converted using the average NCV 119 GJMg
from IPCC Guidelines (IPCC 2006)
The factor for SOx assumes no SO2 abatement and is based on 1 mass sulphur content using EF calculation
from subsection 3422 of the present chapter 95 confidence intervals calculated using range from Table C-1
in Appendix C
The emission factors for PCBs benzo(b)fluoranthene benzo(k)fluoranthene and HCB are based on data for hard
coal combusted in FBB
The basis of the TSP PM10 and PM25 emission factors could not be determined in the reference
Table 3-17 Tier 2 emission factors for source category 1A1a gas turbines using gaseous
fuels
Tier 2 emission factors
Code Name
NFR Source Category 1A1a Public electricity and heat production
Fuel Gaseous Fuels
SNAP (if applicable) 010104 Public power - Gas turbines
TechnologiesPractices Gas Turbines
Region or regional
conditions
NA
Abatement
technologies
NA
Not applicable
Not estimated NH3 PCB PCDDF HCB
Pollutant Value Unit 95 confidence
interval
Reference
Lower Upper
NOx 48 gGJ 28 68 Nielsen et al 2010
CO 48 gGJ 1 70 Nielsen et al 2010
NMVOC 16 gGJ 05 76 Nielsen et al 2010
SOx 0281 gGJ 0169 0393 See note
TSP 02 gGJ 005 08 BUWAL 2001
PM10 02 gGJ 005 08 BUWAL 2001
PM25 02 gGJ 005 08 Assumed equal to PM25
1A1 Energy industries
EMEPEEA air pollutant emission inventory guidebook 2019 32
BC 25 of
PM25
1 63 See Note
Pb 00015 mgGJ 00005 00045 Nielsen et al 2012
Cd 000025 mgGJ 000008 000075 Nielsen et al 2012
Hg 01 mgGJ 001 1 Nielsen et al 2010
As 012 mgGJ 004 036 Nielsen et al 2012
Cr 000076 mgGJ 000025 000228 Nielsen et al 2012
Cu 0000076 mgGJ 0000025 0000228 Nielsen et al 2012
Ni 000051 mgGJ 000017 000153 Nielsen et al 2012
Se 00112 mgGJ 000375 00337 US EPA (1998) chapter 14
Zn 00015 mgGJ 00005 00045 Nielsen et al 2012
Benzo(a)pyrene 056 microgGJ 019 056 US EPA (1998) chapter 14
(Less than value based
on method detection
limits)
Benzo(b)fluoranthene 158 microgGJ 05 47 API 1998
Benzo(k)fluoranthene 111 microgGJ 04 33 API 1998
Indeno(123-cd)pyrene 836 microgGJ 28 251 API 1998
Notes
It must be noted that the Hg content (and other heavy metals) of natural gas varies between gas fields However
the differences after natural gas processing is thought to be of minor importance The US EPA (1998) provides an
emission factor of 01 mgGJ It is encouraged that countries obtain country specific data for the natural gas based
on the origin The factor for SOx is based on approximately 001 gm3 mass sulphur content An SO2 emission
factor can also be calculated using the EF calculation from subsection 3422 of the present chapter
The BC emission factor is the average of the data available in England et al (2004) Wien et al (2004) and the
Speciate database (US EPA 2011)
The basis of the TSP PM10 and PM25 emission factors could not be determined in the reference
Table 3-18 Tier 2 emission factors for source category 1A1a gas turbines using gas oil
Tier 2 emission factors
Code Name
NFR Source Category 1A1a Public electricity and heat production
Fuel Gas Oil
SNAP (if applicable) 010104 Public power ndash gas turbines
TechnologiesPractices Gas Turbines
Region or regional
conditions
NA
Abatement technologies NA
Not applicable
Not estimated NH3 As Cu Ni Se Zn PCB PCDDF Benzo(a)pyrene
Benzo(b)fluoranthene Benzo(k)fluoranthene Indeno(123-cd)pyrene
HCB
Pollutant Value Unit 95 confidence
interval
Reference
Lower Upper
NOx 398 gGJ 239 557 US EPA (2000) chapter 31
CO 149 gGJ 089 209 US EPA (2000) chapter 31
NMVOC 019 gGJ 011 026 US EPA (2000) chapter 31
SOx 465 gGJ 465 465 See Note
TSP 195 gGJ 065 585 US EPA (2000) chapter 31
PM10 195 gGJ 065 585 US EPA (2000) chapter 31
PM25 195 gGJ 065 585 US EPA (2000) chapter 31
BC 335 of PM25 289 38 Hildemann et al 1981 amp
Bond et al 2006
Pb 00069 mgGJ 00007 0069 Pulles et al (2012)
1A1 Energy industries
EMEPEEA air pollutant emission inventory guidebook 2019 33
Cd 00012 mgGJ 00001 0012 Pulles et al (2012)
Hg 0053 mgGJ 0005 053 Pulles et al (2012)
As 00023 mgGJ 00002 0023 Pulles et al (2012)
Cr 028 mgGJ 023 030 Pulles et al (2012)
Cu 017 mgGJ 014 020 Pulles et al (2012)
Ni 00023 mgGJ 00002 0023 Pulles et al (2012)
Se 00023 mgGJ 00002 0023 Pulles et al (2012)
Zn 044 mgGJ 037 051 Pulles et al (2012)
Note
For conversion of the US EPA data the values have been converted to NCV using a factor of 095 Furthermore
units have been converted using 10550559 JBTU and 45359237 glb
The factor for SOx is based on 01 mass sulphur content
Due to lack of data the BC emission factor refers to gas oil fired boilersThe TSP PM10 and PM25 emission factors
represent filterable PM emissions Note that a condensable PM emission factor is also provided in US EPA (2000)
Chapter 31
1A1 Energy industries
EMEPEEA air pollutant emission inventory guidebook 2019 34
Table 3-19 Tier 2 emission factors for source category 1A1a reciprocating engines using
gas oil
Tier 2 emission factors
Code Name
NFR Source Category 1A1a Public electricity and heat production
Fuel Gas Oil
SNAP (if applicable) 010105 Public power - Stationary engines
TechnologiesPractices Large stationary CI reciprocating engines
Region or regional
conditions
NA
Abatement technologies NA
Not applicable
Not estimated NH3
Pollutant Value Unit 95 confidence
interval
Reference
Lower Upper
NOx 942 gGJ 500 1380 Nielsen et al 2010
CO 130 gGJ 30 230 Nielsen et al 2010
NMVOC 371 gGJ 185 556 US EPA (1996) chapter 34
SOx 465 gGJ 465 465 See Note
TSP 281 gGJ 141 562 US EPA (1996) chapter 34
PM10 224 gGJ 112 448 US EPA (1996) chapter 34
PM25 217 gGJ 108 434 US EPA (1996) chapter 34
BC 78 of PM25 63 93 Hernandez et al 2004
Pb 407 mgGJ 041 407 US EPA (2010) chapter 13
Cd 136 mgGJ 014 136 US EPA (2010) chapter 13
Hg 136 mgGJ 014 136 US EPA (2010) chapter 13
As 181 mgGJ 018 181 US EPA (2010) chapter 13
Cr 136 mgGJ 014 136 US EPA (2010) chapter 13
Cu 272 mgGJ 027 271 US EPA (2010) chapter 13
Ni 136 mgGJ 014 136 US EPA (2010) chapter 13
Se 679 mgGJ 068 679 US EPA (2010) chapter 13
Zn 181 mgGJ 018 181 US EPA (2010) chapter 13
PCDDF 099 ng I-
TEQGJ
01 10 Nielsen et al 2010
HCB 022 microgGJ 0022 22 Nielsen et al 2010
PCBs 013 ng I-
TEQGJ
0013 13 Nielsen et al 2010
Benzo(a)pyrene 0116 mgGJ 00582 0116 US EPA (1996) chapter 34
(Less than value based on
method detection limits)
Benzo(b)fluoranthene 0502 mgGJ 0251 0754 US EPA (1996) chapter 34
Benzo(k)fluoranthene 00987 mgGJ 00493 00987 US EPA (1996) chapter 34
(Less than value based on
method detection limits)
Indeno(123-cd)pyrene 0187 mgGJ 00937 0187 US EPA (1996) chapter 34
(Less than value based on
method detection limits)
Notes
For conversion of the US EPA data the values have been converted to NCV using a factor of 095 Furthermore
units have been converted using 10550559 JBTU and 45359237 glb
The factor for SOx assumes no SO2 abatement and is based on 01 mass sulphur content using EF calculation
from subsection 3422 of the present chapterThe TSP PM10 and PM25 emission factors represent filterable PM
emissions Note that a condensable PM emission factor is also provided in US EPA (1996) Chapter 34
1A1 Energy industries
EMEPEEA air pollutant emission inventory guidebook 2019 35
Table 3-20 Tier 2 emission factors for source category 1A1a reciprocating engines using
natural gas
Tier 2 emission factors
Code Name
NFR Source Category 1A1a Public electricity and heat production
Fuel Natural gas
SNAP (if applicable) 010105 Public power - Stationary engines
TechnologiesPractices Stationary reciprocating Engines - gas-fired
Region or regional
conditions
NA
Abatement technologies NA
Not applicable
Not estimated NH3 PCBs HCB
Pollutant Value Unit 95 confidence
interval
Reference
Lower Upper
NOx 135 gGJ 65 200 Nielsen et al 2010
CO 56 gGJ 20 135 Nielsen et al 2010
NMVOC 89 gGJ 45 135 Nielsen et al 2010
SO2 05 gGJ 01 1 BUWAL 2001
TSP 2 gGJ 1 3 BUWAL 2001
PM10 2 gGJ 1 3 BUWAL 2001
PM25 2 gGJ 1 3 BUWAL 2001
BC 25 of PM25 1 63 See Note
Pb 004 mgGJ 0008 02 Nielsen et al 2010
Cd 0003 mgGJ 00006 0015 Nielsen et al 2010
Hg 01 mgGJ 002 05 Nielsen et al 2010
As 005 mgGJ 001 025 Nielsen et al 2010
Cr 005 mgGJ 001 025 Nielsen et al 2010
Cu 001 mgGJ 0002 005 Nielsen et al 2010
Ni 005 mgGJ 001 025 Nielsen et al 2010
Se 02 mgGJ 004 1 Nielsen et al 2010
Zn 291 mgGJ 06 146 Nielsen et al 2010
PCDDF 057 ng I-TEQGJ 028 12 Nielsen et al 2010
Benzo(a)pyrene 120 microgGJ 024 6 Nielsen et al 2010
Benzo(b)fluoranthene 900 microgGJ 18 45 Nielsen et al 2010
Benzo(k)fluoranthene 170 microgGJ 034 85 Nielsen et al 2010
Indeno(123-cd)pyrene 180 microgGJ 036 9 Nielsen et al 2010
Notes
SO2 emission factor can also be calculated using EF calculation from subsection 3422 of the present chapter
The BC emission factor is the average of the data available in England et al (2004) Wien et al (2004) and the
Speciate database (US EPA 2011)
The basis of the TSP PM10 and PM25 emission factors could not be determined in the reference
1A1 Energy industries
EMEPEEA air pollutant emission inventory guidebook 2019 36
3433 Abatement
A number of technologies exist that are aimed at reducing the emissions of specific pollutants The
resulting emission can be calculated by applying an abated emission factor as given in the formula
unabatedtechnologyabatementabatedtechnology EFEF )1( (5)
However this approach requires knowledge of emissions for the unabated or lsquobaselinersquo technology
and abatement efficiency which may be difficult to obtain
Abatement performance is rarely expressed in terms of efficiency but in terms of the achievable or
guaranteed emission concentration (for example to achieve compliance with an emission limit
value) Assessment of abatement performance is almost always determined by measurement of
emitted concentrations To allow users to assess if the Tier 2 emission factors for technologies can
be reasonably applied to their country subsection 63 Verification of the present chapter provides
guidance on conversion of emission concentrations (measured concentrations or emission limit
values) into emission factors for selected fuels
3434 Activity data
Information on the production of power which is suitable for estimating emissions using the
simpler estimation methodology (Tier 1 and 2) is available from national statistics agencies or the
International Energy Agency (IEA)
Further guidance is provided in the 2006 IPCC Guidelines for National Greenhouse Gas Inventories
volume 2 on Stationary Combustion wwwipcc-
nggipigesorjppublic2006glpdf2_Volume2V2_2_Ch2_Stationary_Combustionpdf
For a Tier 2 approach these data need to be stratified according to technologies applied Typical
sources for this data might be industrial or regulatory organisations within the country or from
specific questionnaires to the individual combustion installations
344 Tier 3 use of facility-specific data
3441 Algorithm
Where facility-level emission data of sufficient quality (see Chapter 3 Data collection in part A) are
available it is good practice to use these data There are two possibilities
the facility reports cover all relevant combustion processes in the country
facility-level emission reports are not available for all relevant combustion processes in the
country
If facility-level data are available covering all activities in the country the implied emission factors
(reported emissions divided by the national fuel use) should be compared with the default emission
factor values or technology-specific emission factors If the implied emission factors are outside the
95 confidence intervals for the values given it is good practice to explain the reasons for this in
the inventory report
Depending on the specific national circumstances and the coverage of the facility-level reports as
compared to the total combustion activity the emission factor (EF) in this equation should be chosen
from the following possibilities in decreasing order of preference
1A1 Energy industries
EMEPEEA air pollutant emission inventory guidebook 2019 37
technology-specific emission factors based on knowledge of the types of technologies
implemented at the facilities where facility-level emission reports are not available
the implied emission factor derived from the available emission reports
Facilities
Facility
Facilities
pollutantFacility
Production
E
EF
(7)
the default Tier 1 emission factor This option should only be chosen if the facility-level emission
reports cover more than 90 of the total national production
Sources of emission factor guidance for facilities include the USEPA (USEPA AP-42) BREF and
industry sector guidance (for example Eurelectric (The Union of the Electricity Industry) 2008)
Emission concentration data and ELVs can also be used by inventory compilers to develop emission
factors (Appendix E) The older versions of the Guidebook also provided a range of emission factors
which may be of use and these are provided at Appendix F
3442 Tier 3 use of facility data
Many combustion installations are major facilities and emission data for individual plants might be
available through a pollutant release and transfer registry (PRTR) or another national emission
reporting scheme The electricity sector is developing guidance on estimating emissions (Eurelectric
2008) When the quality of such data is assured by a well developed QAQC system and the emission
reports have been verified by an independent auditing scheme it is good practice to use such data
If extrapolation is needed to cover all activity in the country either the implied emission factors for
the facilities that did report or the emission factors as provided above could be used (see
subsection 3432)
3443 Activity data
Since PRTR generally do not report activity data such data in relation to the reported facility-level
emissions are sometimes difficult to find A possible source of facility-level activity might be the
registries of emission trading systems
In many countries national statistics offices collect production data on facility level but these are in
many cases confidential However in several countries national statistics offices are part of the
national emission inventory systems and the extrapolation if needed could be performed at the
statistics office ensuring that confidentiality of production data is maintained
1A1 Energy industries
EMEPEEA air pollutant emission inventory guidebook 2019 38
4 1A1b Petroleum refining
41 Techniques
Details of technologies used in this activity can be found within the Best Available Techniques
Reference Note (BREF) for refining installations (EIPPCB 2015)
411 Process energy
Refineries require electrical and thermal energy in substantial quantities Electrical and thermal
energy is typically generated by combined heat and power (CHP) or cogeneration facilities at the
refinery Thermal energy can be provided directly (process furnaces on the production unit) or via
steam produced within the production unit or from a utilities facility The technologies for production
of energy from combustion can be identical to those for 1A1a activities but in many instances the
difference will be that the fuels utilised will be refinery gaseous and liquid fuels Where non-refinery
fuels are used in combustion processes the information provided in the 1A1a activity can be
applied
412 Production activities
Many production activities incorporate process furnaces to heat feedstock these may use refinery
fuels and recover refinery by-products and these will have associated combustion emissions
Incineration and flaring of refinery by-products are other combustion activities (see Chapter 1B2c)
In addition process sources include bitumen blowing blowdown systems hydrogen plant fluid
coking units fluidised catalytic cracking (FCC) units and catalytic reforming units (see Chapter
1B2aiv)
42 Emissions
Note that the inventory methodologies for Greenhouse gas emissions (carbon dioxide methame
and nitrous oxide) are not included ndash refer to IPCC guidance [IPCC 2006]
42111 Sulphur oxides
Most emissions arise from process furnaces boilers sulphur recovery units FCC regenerators
flares incinerators and decoking units In the absence of flue gas desulphurisation (FGD) technology
the emissions of sulphur oxides (SOx) are directly related to the sulphur content of the fuel The
majority of SOx is sulphur dioxide (SO2) although small proportions of sulphur trioxide (SO3) can
arise
42112 Nitrogen oxides
Emissions of nitrogen oxides (nitric oxide and nitrogen dioxide mdash NOx) arise primarily from
combustion and the FCC unit Combustion control can provide a high degree of NOx emission control
(low NOx burner technology) and this may be supplemented by use of selective catalytic reduction
(SCR) or selective non catalytic reduction techniques (SNCR)
42113 Non-methane volatile organic compounds (NMVOC)
Emissions of non-methane volatile organic compounds (NMVOC) can result from combustion
activities (including flaring) and process discharges such as vents and blowdown systems However
many emission sources on refineries tend to be fugitive releases (See chapter 1B2aiv)
1A1 Energy industries
EMEPEEA air pollutant emission inventory guidebook 2019 39
42114 Carbon monoxide (CO)
Apart from combustion flaring and incineration activities the FCC and catalytic reforming units can
produce CO but include CO boilers (thermal oxidisers) to control emissions
42115 Ammonia (NH3)
Emissions can result from incomplete reaction of NH3 additive in NOx abatement systems mdash
selective catalytic and non-catalytic reduction (SCR and SNCR) Regenerators for FCC units may emit
ammonia but these emissions are eliminated by use of CO boilers In addition refrigeration systems
which use ammonia may have an associated emission
42116 Particulate matter
Particulate matter (PM) emissions from refinery operations are associated with combustion
activities and selected production units including coking units and fluid catalytic cracking units
Note that PM emission factors in the Guidebook represent primary emissions from the activities and
not formation of secondary aerosol from chemical reaction in the atmosphere after release
A number of factors influence the measurement and determination of primary PM emissions from
activities and the quantity of PM determined in an emission measurement depends to a large extent
on the measurement conditions This is particularly true of activities involving high temperature and
semi-volatile emission components ndash in such instances the PM emission may be partitioned between
a solidaerosol phase and material which is gaseous at the sampling point but which can condense
in the atmosphere The proportion of filterable and condensable material will vary depending on the
temperature of the flue gases and in sampling equipment
A range of filterable PM measurement methods are applied around the world typically with filter
temperatures of 70-160degC (the temperature is set by the test method) Condensable fractions can
be determined directly by recovering condensed material from chilled impinger systems
downstream of a filter ndash note that this is condensation without dilution and can require additional
processing to remove sampling artefacts Another approach for total PM includes dilution where
sampled flue or exhaust gases are mixed with ambient air (either using a dilution tunnel or dilution
sampling systems) and the filterable and condensable components are collected on a filter at lower
temperatures (but depending on the method this can be 15-52degC) The use of dilution methods for
routine measurements on refinery stacks however is limited due to practical constraints with
weight andor size of the equipment
The Guidebook identifies whether the PM emission factors (for TSP PM10 and PM25) represent total
PM filterable PM or whether the basis of the emission factor cannot be determined (see individual
emission factor tables)
42117 Metals
According to the BREF important heavy metals in crude oils are As Hg Ni and V Concawe (Concawe
2015) also present methodologies for Cd Cr Cu Pb and Zn with sources from combustion
incineration of gaseous streams FCC regenerators and fluid coking Nickel and vanadium tend to be
enriched in residues from distillation
1A1 Energy industries
EMEPEEA air pollutant emission inventory guidebook 2019 40
43 Controls
Details of relevant abatement technologies are described in the BREF notes for refineries and large
combustion plant httpeippcbjrceceuropaeureference Relevant abatement technologies for
refinery combustion units are described in 1A1a In general end of pipe treatment of FCC units
tends to be similar to the controls for combustion plant
44 Methods
441 Choice of method
Figure 4-1 presents the procedure to select the methods for estimating process emissions from
petroleum refining The basic idea is
if detailed information is available use it
if the source category is a key source a Tier 2 or better method must be applied and detailed
input data must be collected The decision tree directs the user in such cases to the Tier 2
method since it is expected that it is more easy to obtain the necessary input data for this
approach than to collect facility-level data needed for a Tier 3 estimate
the alternative of applying a Tier 3 method using detailed process modelling is not explicitly
included in this decision tree However detailed modelling will always be done at facility level
and results of such modelling could be seen as lsquofacility datarsquo in the decision tree
1A1 Energy industries
EMEPEEA air pollutant emission inventory guidebook 2019 41
Figure 4-1 Decision tree for combustion in petroleum refining
442 Tier 1 default approach
4421 Algorithm
The Tier 1 approach for process emissions from combustion uses the general equation
pollutantptionfuelconsumpollutant EFARE (1)
Epollutant annual emission of pollutant
EFpollutant emission factor of pollutant
ARfuel consumption activity rate by fuel consumption
This equation is applied at the national level using annual national total fuel use (disaggregated by
fuel type) Information on fuel consumption suitable for estimating emissions using the simpler
estimation methodology is widely available from UN statistical yearbooks or national statistics
Start
Are all single
sources in the source
category Measured
reported
Use Tier 3
Facility data
only
Is a detailed
estimation model
available
Use Tier 2
technology specific
activity data
and EFs
Key source
Get
technology stratified
activity data
and EFs
Apply Tier 1
default EFs
Yes
Yes
Yes
Yes
No
No
Is specific fuel
use data available
for the source
Use measurements Tier
3 approach and
combine with country
specific EFs from Tier 2
Can modelled fuel
consumption be reconciled
with national fuel statistics
from independent
sources
Use model Tier 3
approach
No
No
No
Yes
1A1 Energy industries
EMEPEEA air pollutant emission inventory guidebook 2019 42
The Tier 1 emission factors generally assume an average or typical technology and abatement
implementation However emission factors for this chapter reflect unabated emissions
In cases where specific abatement techniques are to be taken into account a Tier 1 method is not
applicable and a Tier 2 or Tier 3 approach must be used
4422 Default emission factors
The default emission factors for combustion activities at Tier 1 are based on fuel types including fuel
types common with the 1A1a activity As most combustion is in process furnaces without contact
with the material being heated Tier 1 default factors for refinery combustion can often be drawn
from the 1A1a Tier 1 default factors classifications (see Table 4-1)
Table 4-1 Tier 1 fuel classifications
Tier 1 fuel type Associated fuel types Location
Natural gas Natural gas See 1Ala Tier 1
Heavy fuel oil Residual fuel oil refinery feedstock
petroleum coke
See 1A1a Tier 1
Other liquid fuels (a) Gas oil kerosene naphtha natural gas
liquids liquefied petroleum gas
orimulsion bitumen shale oil
(b) refinery gas
(a) See 1A1a Tier 1
(b) Table 4-2
The Tier 1 default emission factors for refinery gas as given in
1A1 Energy industries
EMEPEEA air pollutant emission inventory guidebook 2019 43
Table 4-2 have been derived from emission factors published by USEPA (USEPA 1998) and elsewhere
including factors incorporated by the industry sector (Concawe 2015) In the absence of detail on
relative use of combustion or abatement technology which will be different for each country the
proposed factors represent a mean of unabated emissions for the range of combustion technologies
in use with the 95 figures a measure of the range of unabated emissions in the sector
An emission factor for sulphur oxides is provided in the Tier 1 table but this is based on a range of
published factors some of which represent very different sulphur levels in the fuels Where countries
have knowledge of fuel sulphur content then it is recommended that a sulphur oxides emission
factor is calculated from fuel sulphur content
1A1 Energy industries
EMEPEEA air pollutant emission inventory guidebook 2019 44
Table 4-2 Tier 1 emission factors for source category 1A1b refinery gas
Tier 1 default emission factors
Code Name
NFR Source Category 1A1b Petroleum refining
Fuel Refinery Gas
Not applicable
Not estimated NH3 PCDDF HCB
Pollutant Value Unit 95 confidence
interval
Reference
Lower Upper
NOx 63 gGJ 315 844 US EPA (1998) chapter 14
CO 121 gGJ 73 17 Concawe (2015)
NMVOC 258 gGJ 129 515 US EPA (1998) chapter 14
SOx 0281 gGJ 0169 0393 US EPA (1998) chapter 14
TSP 089 gGJ 0297 267 US EPA (1998) chapter 14
PM10 089 gGJ 0297 267 US EPA (1998) chapter 14
PM25 089 gGJ 0297 267 US EPA (1998) chapter 14
BC 184 of PM25 52 363 US EPA 2011
Pb 161 mgGJ 12 21 Concawe Report 916
Cd 219 mgGJ 06 38 Concawe Report 916
Hg 0372 mgGJ 02 05 Concawe Report 916
As 0352 mgGJ 03 04 Concawe Report 916
Cr 669 mgGJ 03 131 Concawe Report 916
Cu 329 mgGJ 24 42 Concawe Report 916
Ni 737 mgGJ 16 131 Concawe Report 916
Se 156 mgGJ 11 20 Concawe Report 916
Zn 170 mgGJ 120 220 Concawe Report 916
Benzo(a)pyrene 0669 microgGJ 0223 201 API (1998 2002)
Benzo(b)fluoranthene 114 microgGJ 0379 341 API (1998 2002)
Benzo(k)fluoranthene 0631 microgGJ 021 189 API (1998 2002)
Indeno(123-cd)pyrene 0631 microgGJ 021 189 API (1998 2002)
Note
The factor for SOx is based on approximately 001 gm3 mass sulphur content SO2 emission factor can also be
calculated using EF calculation from subsection 3422 of the present chapter
These PM factors represent filterable PM emissions only (excluding any condensable fraction)
If a Tier 1 approach is adopted for the process emissions (Chapter 1B2aiv) combustion emissions
are already covered and should not be reported again in Chapter 1A1b since this would lead to
double counting
4423 Tier 1 activity data
Information on the use of energy suitable for estimating emissions using the Tier 1 simpler
estimation methodology is available from national statistics agencies or the International Energy
Agency (IEA)
Further guidance is provided in the 2006 IPCC Guidelines for National Greenhouse Gas Inventories
volume 2 on Stationary Combustion
wwwipcc-nggipigesorjppublic2006glpdf2_Volume2V2_2_Ch2_Stationary_Combustionpdf
The activity rate and the emission factor have to be determined on the same level of aggregation
depending on the availability of data The activity statistic should be determined within the
considered country or region by using adequate statistics The activity should refer to the energy
input of the emission sources considered (net or inferior fuel consumption in [GJ])
1A1 Energy industries
EMEPEEA air pollutant emission inventory guidebook 2019 45
443 Tier 2 technology-specific approach
4431 Algorithm
The Tier 2 approach is similar to the Tier 1 approach To apply the Tier 2 approach both the activity
data and the emission factors need to be applied according to a countryrsquos installed combustion and
abatement technologies These techniques may include
types of refinery
capacities of refineries
implementation of abatement technologies in the country
There are two approaches possible
disaggregate the fuel use in the country to model the different combustion and abatement types
into the inventory by
o defining the activity data using each of the identified process types (together called
lsquotechnologiesrsquo in the formulae below) separately and
o applying technology-specific emission factors for each process type
estechnologi
pollutanttechnologytechnologyproductionpollutant EFARE (2)
develop country-specific emission factors from the understanding of the relative contributions of
the different technologies within the national combustion plant portfolio (and relative fuel use)
and apply this country-specific emission factor for the national fuel use
pollutantcountryproductionpollutant
estechnologi
pollutanttechnologytechnologypollutantcountry
EFARE
EFnPenetratioEF
(3)
Both approaches are mathematically very similar or even identical Using one or the other approach
depends mainly on the availability of data If the activity data are indeed available the first approach
seems to be more appropriate If however no direct activity data are available penetration of
different technologies within the industry could be estimated from data on capacities or other
surrogate data that reflect relative sizes of facilities using the different technologies
4432 Technology-specific emission factors
Applying a Tier 2 approach for the process emissions from refineries technology-specific emission
factors are needed Examples are provided in this section The BREF document for refineries is
available at httpeippcbjrceceuropaeureference and provides guidance on achievable emission
levels Emission factors derived from the achievable emission levels values (AELs) as defined in the
BREF document are provided for comparison in subsection 631
This section provides a series of technology-specific pollutant emission factors for combustion units
eg boilers and process heaters and furnaces these factors represent a wider range of fuels and
combustion technologies than for Tier 1 They do not represent specific combustion technologies
but do offer more disaggregation than Tier 1 Many of the factors have been included in the industry
1A1 Energy industries
EMEPEEA air pollutant emission inventory guidebook 2019 46
guidance for estimating facility releases for E-PRTR (Concawe 2015) and represent unabated
emission factors
Emission factors for sulphur oxides are provided in the Tier 2 tables Where countries have
knowledge of fuel sulphur content and of abatement technologies then it is recommended that a
sulphur oxides emission factor is calculated from fuel sulphur content taking into account
abatement efficiency
A methodology to calculate NOx emissions has been provided in Concawe 2015 as the sectorrsquos
recommended method for refineries to use for emission reporting However NOx formation is very
complex and depends on a number of parameters (for example hydrogen content humidity burner
intensity) which may not be available for a Tier 2 methodology
Extension of Tier 2 to reflect emission abatement is possible through use of factors derived from
emission data For emission factors specific to gas turbines please see 1A1a subsection 3432
Tier 2 emission factor tables of the present chapter
If LPG is used the emission factors presented for natural gas should be used when estimating
emissions
A summary of the Tier 2 factors is provided in Table 4-3
Table 4-3 Tier 2 default factors
Technology Associated fuel types Location of Tier 2 factors
Process furnaces Residual oil Table 4-4
Gas oil Table 4-5
Refinery gas See Tier 1 (Table 4-2)
Natural gas Table 4-7
Gas turbines Various See Section 1A1a
Gas engines Natural gas Table 4-7
Compression ignition engines Gas oil Table 4-8
1A1 Energy industries
EMEPEEA air pollutant emission inventory guidebook 2019 47
Table 4-4 Tier 2 emission factors for source category 1A1b process furnaces using
residual oil
Tier 2 emission factors
Code Name
NFR Source Category 1A1b Petroleum refining
Fuel Residual Oil (Refinery Fuel Oil)
SNAP (if applicable) 0103 Petroleum refining plants
TechnologiesPractices Process Furnaces Heaters and Boilers
Region or regional
conditions
NA
Abatement
technologies
NA
Not applicable
Not estimated NH3 Benzo(a)pyrene Benzo(k)fluoranthene Indeno(123-cd)pyrene PCBs HCB
Pollutant Value Unit 95 confidence
interval
Reference
Lower Upper
NOx 142 gGJ 71 284 US EPA (1998) chapter 13
CO 6 gGJ 36 84 Concawe (2015)
NMVOC 23 gGJ 0676 409 US EPA (1998) chapter 13
SOx 485 gGJ 146 1700 See Note
TSP 20 gGJ 12 28 Visschedijk et al (2004)
PM10 15 gGJ 9 21 Visschedijk et al (2004)
PM25 9 gGJ 54 126 Visschedijk et al (2004)
BC 56 of PM25 022 869 See Note
Pb 46 mgGJ 09 23 US EPA (1998) chapter 13
Cd 12 mgGJ 024 6 US EPA (1998) chapter 13
Hg 03 mgGJ 003 06 US EPA (1998) chapter 13
As 398 mgGJ 0796 199 US EPA (1998) chapter 13
Cr 148 mgGJ 296 74 API (1998 2002)
Cu 119 mgGJ 238 595 API (1998 2002)
Ni 773 mgGJ 647 900 Concawe Report 916
Se 21 mgGJ 040 105 US EPA (1998) chapter 13
Zn 493 mgGJ 986 247 API (1998 2002)
PCDDF 25 ng I-
TEQGJ
125 375 UNEP (2005) Heavy fuel fired power
boilers
Benzo(b)fluoranthene 37 microgGJ 074 185 API (1998 2002)
Note
The factor for SOx assumes no SO2 abatement and is based on 1 mass sulphur content using EF calculation
from subsection 3422 of the present chapter 95 confidence intervals calculated using range from Table C-1
in Appendix C
The BC emission factor is derived as the average of the data found in Olmez et al (1988) England et al (2007)
and the Speciate database (US EPA 2011)
For benzo(a)pyrene benzo(k)fluoranthene and indeno(123-cd)pyrene all measurements reported by API (1998)
were below the detection limit Using this the EFs would be 060 020 and 13 microgGJ respectively
These PM factors represent filterable PM emissions
1A1 Energy industries
EMEPEEA air pollutant emission inventory guidebook 2019 48
Table 4-5 Tier 2 emission factors for source category 1A1b process furnaces using gas oil
Tier 2 emission factors
Code Name
NFR Source Category 1A1b Petroleum refining
Fuel Gas Oil
SNAP (if applicable) 0103 Petroleum refining plants
TechnologiesPractices Process Furnaces Heaters and Boilers
Region or regional
conditions
NA
Abatement
technologies
NA
Not applicable
Not estimated NH3 PCDDF Benzo(a)pyrene Benzo(b)fluoranthene Benzo(k)fluoranthene
Indeno(123-cd)pyrene PCBs HCB
Pollutant Value Unit 95 confidence
interval
Reference
Lower Upper
NOx 65 gGJ 325 975 US EPA (1998) chapter 13
CO 162 gGJ 54 50 US EPA (1998) chapter 13
NMVOC 065 gGJ 022 195 US EPA (1998) chapter 13
Sox 461 gGJ 369 460 See Note
TSP 647 gGJ 129 323 US EPA (1998) chapter 13
PM10 323 gGJ 0647 162 US EPA (1998) chapter 13
PM25 0808 gGJ 0162 404 US EPA (1998) chapter 13
BC 335 of
PM25
289 38 Hildemann et al 1981 amp Bond et al
2006
Pb 407 mgGJ 204 814 US EPA (1998) chapter 13
Cd 136 mgGJ 068 272 US EPA (1998) chapter 13
Hg 136 mgGJ 068 272 US EPA (1998) chapter 13
As 181 mgGJ 0905 362 US EPA (1998) chapter 13
Cr 136 mgGJ 068 272 US EPA (1998) chapter 13
Cu 272 mgGJ 136 544 US EPA (1998) chapter 13
Ni 136 mgGJ 068 272 US EPA (1998) chapter 13
Se 679 mgGJ 068 679 US EPA (1998) chapter 13
Zn 181 mgGJ 0905 362 US EPA (1998) chapter 13
Note
Based on 01 mass sulphur content
These PM factors represent filterable PM emissions only (excluding any condensable fraction)
1A1 Energy industries
EMEPEEA air pollutant emission inventory guidebook 2019 49
Table 4-6 Tier 2 emission factors for source category 1A1b process furnaces using
natural gas
Tier 2 emission factors
Code Name
NFR Source Category 1A1b Petroleum refining
Fuel Natural Gas
SNAP (if applicable) 0103 Petroleum refining plants
TechnologiesPractices Process Furnaces Heaters and Boilers
Region or regional
conditions
NA
Abatement
technologies
NA
Not applicable
Not estimated NH3 PCDDF PCBs HCB
Pollutant Value Unit 95 confidence
interval
Reference
Lower Upper
NOx 63 gGJ 315 844 US EPA (1998) chapter 14
CO 393 gGJ 236 551 US EPA (1998) chapter 14
NMVOC 258 gGJ 129 516 US EPA (1998) chapter 14
SOx 0281 gGJ 0169 0393 US EPA (1998) chapter 14
TSP 089 gGJ 0297 267 US EPA (1998) chapter 14
PM10 089 gGJ 0297 267 US EPA (1998) chapter 14
PM25 089 gGJ 0297 267 US EPA (1998) chapter 14
BC 86 of
PM25
43 172 Wien et al 2004
Pb 00015 mgGJ 00005 00045 Nielsen et al 2012
Cd 000025 mgGJ 000008 000075 Nielsen et al 2012
Hg 01 mgGJ 001 1 Nielsen et al 2010
As 012 mgGJ 004 036 Nielsen et al 2012
Cr 000076 mgGJ 000025 000228 Nielsen et al 2012
Cu 0000076 mgGJ 0000025 0000228 Nielsen et al 2012
Ni 000051 mgGJ 000017 000153 Nielsen et al 2012
Se 00112 mgGJ 000375 00337 US EPA (1998) chapter 14
Zn 00015 mgGJ 00005 00045 Nielsen et al 2012
Benzo(a)pyrene 056 microgGJ 019 056 US EPA (1998) chapter 14
(Less than value based
on method detection
limits)
Benzo(b)fluoranthene 084 microgGJ 028 084 US EPA (1998) chapter 14
(Less than value based
on method detection
limits)
Benzo(k)fluoranthene 084 microgGJ 028 084 US EPA (1998) chapter 14
(Less than value based
on method detection
limits)
Indeno(123-cd)pyrene 084 microgGJ 028 084 US EPA (1998) chapter 14
(Less than value based
on method detection
limits)
Note
The factor for SOx is based on approximately 001 gm3 mass sulphur content SO2 emission factor can also be
calculated using EF calculation from subsection 3422 of the present chapter
It must be noted that the Hg content (and other heavy metals) of natural gas varies between gas fields However
the differences after natural gas processing is thought to be of minor importance The US EPA (1998) provides an
1A1 Energy industries
EMEPEEA air pollutant emission inventory guidebook 2019 50
emission factor of 01 mgGJ It is encouraged that countries obtain country specific data for the natural gas based
on the origin
These PM factors represent filterable PM emissions only (excluding any condensable fraction)
Table 4-7 Tier 2 emission factors for source category 1A1b stationary engines using
natural gas
Tier 2 emission factors
Code Name
NFR Source Category 1A1b Petroleum refining
Fuel Natural Gas
SNAP (if applicable) 010305 Petroleum refining - Stationary engines
TechnologiesPractices 4-stroke lean burn gas engines
Region or regional
conditions
NA
Abatement technologies NA
Not applicable
Not estimated NH3 PCDDF PCBs HCB
Pollutant Value Unit 95 confidence
interval
Reference
Lower Upper
NOx 405 gGJ 200 810 US EPA (2000) chapter 32
CO 266 gGJ 130 530 US EPA (2000) chapter 32
NMVOC 56 gGJ 30 110 US EPA (2000) chapter 32
SOx 0281 gGJ 0169 0393 US EPA (2000) chapter 32
TSP 0037 gGJ 0003 037 US EPA (2000) chapter 32
PM10 0037 gGJ 0003 037 US EPA (2000) chapter 32
PM25 0037 gGJ 0003 037 US EPA (2000) chapter 32
BC 25 of PM25 1 63 See Note
Pb 004 mgGJ 0013 012 Nielsen et al 2010
Cd 0003 mgGJ 0001 0009 Nielsen et al 2010
Hg 01 mgGJ 003 03 Nielsen et al 2010
As 005 mgGJ 0017 015 Nielsen et al 2010
Cr 005 mgGJ 0017 015 Nielsen et al 2010
Cu 001 mgGJ 0003 003 Nielsen et al 2010
Ni 005 mgGJ 0017 015 Nielsen et al 2010
Se 02 mgGJ 007 06 Nielsen et al 2010
Zn 291 mgGJ 097 873 Nielsen et al 2010
Benzo(a)pyrene 162 microgGJ 54 486 API (1998)
Benzo(b)fluoranthene 149 microgGJ 50 447 API (1998)
Benzo(k)fluoranthene 241 microgGJ 80 723 API (1998)
Indeno(123-cd)pyrene 545 microgGJ 175 158 API (1998)
Notes
It must be noted that the Hg content (and other heavy metals) of natural gas varies between gas fields The US
EPA (1998) provides an emission factor of 01 mgGJ It is encouraged that countries obtain country specific data
for the natural gas based on the origin Also the amount of lubricants oxidised during use can significantly
influence the emission factors of heavy metals
The factor for SOx is based on approximately 001 gm3 mass sulphur content SO2 emission factor can also be
calculated using EF calculation from subsection 3422 of the present chapter
The BC emission factor is the average of the data available in England et al (2004) Wien et al (2004) and the
Speciate database (US EPA 2011)
These PM factors represent filterable PM emissions only (excluding any condensable fraction)
1A1 Energy industries
EMEPEEA air pollutant emission inventory guidebook 2019 51
Table 4-8 Tier 2 emission factors for source category 1A1b diesel engines using gas oil
Tier 2 emission factors
Code Name
NFR Source Category 1A1b Petroleum refining
Fuel Gas Oil
SNAP (if applicable) 010305 Petroleum refining - Stationary engines
TechnologiesPractices Reciprocating Engines (compression injection)
Region or regional
conditions
NA
Abatement technologies NA
Not applicable
Not estimated NH3 PCDDF PCBs HCB
Pollutant Value Unit 95 confidence
interval
Reference
Lower Upper
NOx 942 gGJ 500 1380 Nielsen et al 2010
CO 130 gGJ 30 230 Nielsen et al 2010
NMVOC 371 gGJ 185 556 US EPA (1996) chapter 34
SOx 461 gGJ 461 461 See Note
TSP 281 gGJ 141 562 US EPA (1996) chapter 34
PM10 224 gGJ 112 448 US EPA (1996) chapter 34
PM25 217 gGJ 108 434 US EPA (1996) chapter 34
BC 78 of PM25 63 93 Hernandez et al 2004
Pb 407 mgGJ 041 407 US EPA (1998) chapter 13
Cd 136 mgGJ 014 136 US EPA (1998) chapter 13
Hg 136 mgGJ 014 136 US EPA (1998) chapter 13
As 181 mgGJ 018 181 US EPA (1998) chapter 13
Cr 136 mgGJ 014 136 US EPA (1998) chapter 13
Cu 272 mgGJ 027 271 US EPA (1998) chapter 13
Ni 136 mgGJ 014 136 US EPA (1998) chapter 13
Se 679 mgGJ 068 679 US EPA (1998) chapter 13
Zn 181 mgGJ 018 181 US EPA (1998) chapter 13
PCDDF 099 ng I-
TEQGJ
01 10 Nielsen et al 2010
HCB 022 microgGJ 0022 22 Nielsen et al 2010
PCBs 013 ng I-
TEQGJ
0013 13 Nielsen et al 2010
Benzo(a)pyrene 011 mgGJ 004 033 API 1998
Benzo(b)fluoranthene 049 mgGJ 016 147 API 1998
Benzo(k)fluoranthene 0096 mgGJ 0032 0288 API 1998
Indeno(123-cd)pyrene 018 mgGJ 006 054 API 1998
Notes
The factor for SOx assumes no SO2 abatement and is based on 01 mass sulphur content using EF calculation
from subsection 3422 of the present chapter
Emission factors for metals are based on factors for oil combustion in boilers
These PM factors represent filterable PM emissions only (excluding any condensable fraction)
4433 Activity data
Information on the refinery production suitable for estimating emissions using the simpler
estimation methodology (Tier 1 and 2) may be available from national statistics agencies or the
International Energy Agency (IEA)
1A1 Energy industries
EMEPEEA air pollutant emission inventory guidebook 2019 52
Further guidance is provided in the 2006 IPCC Guidelines for National Greenhouse Gas Inventories
volume 2 on Stationary Combustion
wwwipcc-nggipigesorjppublic2006glpdf2_Volume2V2_2_Ch2_Stationary_Combustionpdf
For a Tier 2 approach these data need to be stratified according to technologies applied Typical
sources for this data might be industrial or regulatory organisations within the country or from
specific questionnaires to the individual refineries
444 Tier 3 use of facility-specific data
4441 Algorithm
Where facility-level emission data of sufficient quality (see Chapter 3 Data collection in part A) are
available it is good practice to use these data There are two possibilities
the facility reports cover all refinery processes in the country
facility-level emission reports are not available for all the refinery processes
If facility-level data are available covering all activities in the country the implied emission factors
(reported emissions divided by the national fuel use) should be compared with the default emission
factor values or technology-specific emission factors If the implied emission factors are outside the
95 confidence intervals for the values given it is good practice to explain the reasons for this in
the inventory report
Depending on the specific national circumstances and the coverage of the facility-level reports as
compared to the total combustion activity the emission factor (EF) in this equation should be chosen
from the following possibilities in decreasing order of preference
technology-specific emission factors based on knowledge of the types of technologies
implemented at the facilities where facility-level emission reports are not available
the implied emission factor derived from the available emission reports
Facilities
Facility
Facilities
pollutantFacility
Production
E
EF
(7)
the default Tier 1 emission factor This option should only be chosen if the facility-level emission
reports cover more than 90 of the total national production
4442 Tier 3 emission modelling and use of facility data
Refinery installations are major facilities and emission data for individual plants could be available
through a pollutant release and transfer registry (PRTR) or another national emission reporting
scheme but possibly not for all pollutants When the quality of such data is assured by a well
developed QAQC system it is good practice to use such data Guidance on estimating refinery
emissions has been published by the industry sector [Concawe 2015] If extrapolation is needed to
cover all activity in the country either the implied emission factors for the facilities that did report
or the emission factors as provided above could be used (see subsection 3432 of the present
chapter)
1A1 Energy industries
EMEPEEA air pollutant emission inventory guidebook 2019 53
4443 Activity data
Since PRTR generally do not report activity data such data in relation to the reported facility-level
emissions are sometimes difficult to find A possible source of facility-level activity might be the
registries of emission trading systems
In many countries national statistics offices collect production data on facility level but these are in
many cases confidential However in several countries national statistics offices are part of the
national emission inventory systems and the extrapolation if needed could be performed at the
statistics office ensuring that confidentiality of production data is maintained
1A1 Energy industries
EMEPEEA air pollutant emission inventory guidebook 2019 54
5 1A1c Manufacture of solid fuels
and other energy industries
51 Techniques
Coke manufacture is mainly associated with iron and steel manufacture and details of technologies
used in this activity can be found within the Best Available Techniques Reference Note (BREF) for
Iron and Steel production [EIPPCB 2013] and within the USEPA guidance
Coke manufacture is a batch process with production occurring in a coke oven which is a battery of
ovens Coal is heated in a non-oxidising atmosphere (pyrolysis) The volatile components are driven
off to leave coke which is then pushed at high temperature from the oven into a rail car and taken
to a quench tower to stop oxidation in air Heating is provided by combustion of a portion of the
evolved gases following treatment to remove ammonia hydrogen sulphide tars and condensable
organic material Coke manufacture with by-product recovery includes process units to recover
condensed organic material and other by-products By-products are burnt in coke ovens which do
not have by-product recovery
52 Emissions
Note that the inventory methodologies for Greenhouse gas emissions (carbon dioxide methame
and nitrous oxide) are not included ndash refer to IPCC guidance [IPCC 2006]
52111 Sulphur oxides
Emissions arise from combustion of coke oven gas (COG) Gas is treated to removed H2S but residual
H2S is oxidised to form SO2
52112 Nitrogen oxides
Emissions of nitrogen oxides (nitric oxide and nitrogen dioxide mdash NOx) arise primarily from
combustion of COG
52113 Non-methane volatile organic compounds (NMVOC)
Emissions of non-methane volatile organic compounds (NMVOC) can result from combustion
activities and process discharges such as vents and blowdown systems However many emission
sources tend to be fugitive releases
52114 Carbon monoxide (CO)
Emissions arise from combustion activities and fugitive release of COG
52115 Particulate matter
Particulate matter (PM) emissions arise from combustion activities on the coke oven and materials
handling
53 Controls
Details- of relevant abatement technologies are described in the BREF note for iron and steel
production (httpeippcbjrceceuropaeureference) Control of SO2 emission is by removal of H2S
and other sulphurous material from the fuel gas
1A1 Energy industries
EMEPEEA air pollutant emission inventory guidebook 2019 55
54 Methods
541 Choice of method
Figure 5-1 presents the procedure to select the methods for estimating process emissions from
combustion in energy and transformation industries The basic idea is
if detailed information is available use it
if the source category is a key source a Tier 2 or better method must be applied and detailed
input data must be collected The decision tree directs the user in such cases to the Tier 2
method since it is expected that it is more easy to obtain the necessary input data for this
approach than to collect facility-level data needed for a Tier 3 estimate
the alternative of applying a Tier 3 method using detailed process modelling is not explicitly
included in this decision tree However detailed modelling will always be done at facility level
and results of such modelling could be seen as lsquoFacility datarsquo in the decision tree
Figure 5-1 Decision tree for combustion in manufacture of solid fuels
Start
Are all single
sources in the source
category Measured
reported
Use Tier 3
Facility data
only
Is a detailed
estimation model
available
Use Tier 2
technology specific
activity data
and EFs
Key source
Get
technology stratified
activity data
and EFs
Apply Tier 1
default EFs
Yes
Yes
Yes
Yes
No
No
Is specific fuel
use data available
for the source
Use measurements Tier
3 approach and
combine with country
specific EFs from Tier 2
Can modelled fuel
consumption be reconciled
with national fuel statistics
from independent
sources
Use model Tier 3
approach
No
No
No
Yes
1A1 Energy industries
EMEPEEA air pollutant emission inventory guidebook 2019 56
542 Tier 1 default approach
5421 Algorithm
The Tier 1 approach for process emissions from combustion uses the general equation
pollutantptionfuelconsumpollutant EFARE (1)
where
Epollutant = annual emission of pollutant
EFpollutant = emission factor of pollutant
ARfuel consumption = activity rate by coal consumption coke or iron production
This equation is applied at the national level using annual national coal use (disaggregated by
industrial sector) Information on fuel consumption suitable for estimating emissions using the
simpler estimation methodology is widely available from UN statistical yearbooks or national
statistics
The Tier 1 emission factors assume an average or typical technology and abatement
implementation
In cases where specific abatement techniques are to be taken into account a Tier 1 method is not
applicable and a Tier 2 or Tier 3 approach must be used
5422 Default emission factors
The Tier 1 default emission factors for process and combustion emissions are given in
1A1 Energy industries
EMEPEEA air pollutant emission inventory guidebook 2019 57
Table 5-1 and have been derived from emission factors provided in USEPA guidance The factors are
based on coal use expressed in terms of net energy content The factors include combustion and
process emissions from coke batteries including combustion stacks and preheater Emissions from
soaking decarbonisation charging door and lid leaks off-take leaks quenching and pushing are
included in Chapter 1B1b Fugitive emissions from solid fuels solid fuel transformation In the
absence of detail on relative use of coke oven types or abatement technology which will be different
for each country the proposed factors represent a mean for the range of technologies in use with
the 95 figures a measure of the range of emissions in the sector
1A1 Energy industries
EMEPEEA air pollutant emission inventory guidebook 2019 58
Table 5-1 Tier 1 emission factors for source category 1A1c
Tier 1 default emission factors
Code Name
NFR Source Category 1A1c Manufacture of solid fuels and other energy industries
Fuel Coal
Not applicable PCBs HCB
Not estimated NH3BC
Pollutant Value Unit 95 confidence
interval
Reference
Lower Upper
NOx 21 gGJ 115 42 See note
CO 6 gGJ 3 12 See note
NMVOC 08 gGJ 008 81 See note
SOx 91 gGJ 60 120 See note
TSP 82 gGJ 40 160 See note
PM10 79 gGJ 40 160 See note
PM25 55 gGJ 28 110 See note
Pb 28 mgGJ 592 145 See note
Cd 16 mgGJ 032 9 See note
Hg 30 mgGJ 6 150 See note
As 11 mgGJ 22 55 See note
Cr 57 mgGJ 118 295 See note
Cu 25 mgGJ 5 125 See note
Ni 52 mgGJ 11 26 See note
Se 29 mgGJ 06 15 See note
Zn 46 mgGJ 94 235 See note
PCDDF 26 ng I-
TEQGJ
52 130 See note
Benzo(a)pyrene 029 mgGJ 0066 165 See note
Benzo(b)fluoranthene 0003 mgGJ 00006 0015 See note
Benzo(k)fluoranthene 0001 mgGJ 00002 0005 See note
Indeno(123-cd)pyrene 0001 mgGJ 00002 0005 See note
Note
The tier 1 emission factors are calculated as an average of the tier 2 emission factors The tier 2 emission factors
have been converted using a NCV of 282 GJMg
The basis of the TSP PM10 and PM25 emission factors could not be determined in the reference
5423 Tier 1 Activity Data
Information on the use of energy suitable for estimating emissions using the Tier 1 simpler
estimation methodology is available from national statistics agencies or the International Energy
Agency (IEA)
Further guidance is provided in the 2006 IPCC Guidelines for National Greenhouse Gas Inventories
volume 2 on Stationary Combustion
wwwipcc-nggipigesorjppublic2006glpdf2_Volume2V2_2_Ch2_Stationary_Combustionpdf
The activity rate and the emission factor have to be determined on the same level of aggregation
depending on the availability of data The activity statistic should be determined within the
considered country or region by using adequate statistics The activity should refer to the energy
input of the emission sources considered (net or inferior fuel consumption in [GJ])
1A1 Energy industries
EMEPEEA air pollutant emission inventory guidebook 2019 59
543 Tier 2 approach
For a Tier 2 approach the emission factors are presented in terms of coal use with two technologies
Note that emission factors can be converted to gMg coke produced by applying a conversion of
1 285 kg coalMg coke (from the Iron and Steel BREF range of 1220ndash1 350 kg coalMg coke)
The factors represent combustion and process emissions from coke batteries including combustion
stacks and preheater Emissions from soaking decarbonisation charging door and lid leaks off-
take leaks quenching and pushing are included in Chapter 1B1b Fugitive emissions from solid
fuels solid fuel transformation
Table 5-2 Tier 2 default emission factors for source category 1A1c coke manufacture with
by-product recovery
Tier 2 emission factors
Code Name
NFR Source Category 1A1c Manufacture of solid fuels and other energy industries
Fuel Coal
SNAP (if applicable) 0104 Solid fuel transformation plants
TechnologiesPractices Coke oven (byproduct recovery)
Region or regional
conditions
NA
Abatement technologies NA
Not applicable PCB Hg
Not estimated NH3 Hg
Pollutant Value Unit 95 confidence
interval
Reference
Lower Upper
NOx 820 gMg Coal 530 1200 US EPA (2008) chapter 122
CO 340 gMg Coal 170 680 US EPA (2008) chapter 122
NMVOC 47 gMg Coal 24 94 US EPA (2008) chapter 122
SOx 420 gMg Coal 210 840 US EPA (2008) chapter 122
TSP 1914 gMg Coal 955 3830 US EPA (2008) chapter 122
PM10 1864 gMg Coal 932 3728 US EPA (2008) chapter 122
PM25 1176 gMg Coal 588 2352 US EPA (2008) chapter 122
BC 48 of PM25 5 95 Bond et al (2004)
Pb 22 mgMg Coal 11 44 US EPA (2008) chapter 122
Cd 01 mgMg Coal 005 02 US EPA (2008) chapter 122
As 16 mgMg Coal 08 32 US EPA (2008) chapter 122
Cr 36 mgMg Coal 18 72 US EPA (2008) chapter 122
Cu 17 mgMg Coal 085 34 US EPA (2008) chapter 122
Ni 09 mgMg Coal 045 18 US EPA (2008) chapter 122
Se 18 mgMg Coal 09 36 US EPA (2008) chapter 122
Zn 76 mgMg Coal 38 152 US EPA (2008) chapter 122
PCDDF 738 ng I-TEQMg
Coal
234 2335 UNEP (2005)
Benzo(a)pyrene 82 mgMg Coal 164 41 US EPA (2008) chapter 122
Benzo(b)fluoranthene 01 mgMg Coal 002 05 US EPA (2008) chapter 122
Benzo(k)fluoranthene 003 mgMg Coal 0006 015 US EPA (2008) chapter 122
Indeno(123-cd)pyrene 002 mgMg Coal 0004 01 US EPA (2008) chapter 122
NoteThe basis of the TSP PM10 and PM25 emission factors could not be determined in the reference (emission
factors for filterable and condensable PM are provided for a number of process activities but it is unclear which
have been incorporated in the Tier 2 emission factors)
1A1 Energy industries
EMEPEEA air pollutant emission inventory guidebook 2019 60
Table 5-3 Tier 2 default emission factors for source category 1A1c coke manufacture
without by-product recovery
Tier 2 emission factors
Code Name
NFR Source Category 1A1c Manufacture of solid fuels and other energy industries
Fuel Coal
SNAP (if applicable) 0104 Solid fuel transformation plants
TechnologiesPractices Coke oven (without byproduct recovery)
Region or regional
conditions
NA
Abatement technologies NA
Not applicable PCBs HCB
Not estimated NMVOC NH3 Benzo(b)fluoranthene Benzo(k)fluoranthene Indeno(123-
cd)pyrene
Pollutant Value Unit 95 confidence
interval
Reference
Lower Upper
NOx 360 gMg Coal 250 590 US EPA (2008) chapter 122
CO 25 gMg Coal 125 50 US EPA (2008) chapter 122
SOx 4700 gMg Coal 2350 9200 US EPA (2008) chapter 122
TSP 2700 gMg Coal 1350 5400 US EPA (2008) chapter 122
PM10 2618 gMg Coal 1309 5236 US EPA (2008) chapter 122
PM25 1913 gMg Coal 957 3826 US EPA (2008) chapter 122
BC 48 of PM25 5 95 Bond et al (2004)
Pb 1600 mgMg Coal 800 3200 US EPA (2008) chapter 122
Cd 90 mgMg Coal 45 180 US EPA (2008) chapter 122
Hg 1700 mgMg Coal 850 3400 US EPA (2008) chapter 122
As 630 mgMg Coal 315 1260 US EPA (2008) chapter 122
Cr 320 mgMg Coal 160 640 US EPA (2008) chapter 122
Cu 1400 mgMg Coal 700 2800 US EPA (2008) chapter 122
Ni 290 mgMg Coal 145 580 US EPA (2008) chapter 122
Se 160 mgMg Coal 80 320 US EPA (2008) chapter 122
Zn 2600 mgMg Coal 1300 5200 US EPA (2008) chapter 122
PCDDF 738 ng I-TEQMg
Coal
234 2335 UNEP (2005)
Benzo(a)pyrene 05 mgMg Coal 01 25 US EPA (2008) chapter 122
Note
The basis of the TSP PM10 and PM25 emission factors could not be determined in the reference (emission factors
for filterable and condensable PM are provided for a number of process activities but it is unclear which have
been incorporated in the Tier 2 emission factors)
544 Tier 3 use of facility-specific data
5441 Algorithm
Where facility-level emission data of sufficient quality (see Chapter 3 Data collection in part A) are
available it is good practice to use these data There are two possibilities
the facility reports cover all relevant combustion processes in the country
facility-level emission reports are not available for all relevant combustion processes in the
country
If facility-level data are available covering all activities in the country the implied emission factors
(reported emissions divided by the national fuel use) should be compared with the default emission
1A1 Energy industries
EMEPEEA air pollutant emission inventory guidebook 2019 61
factor values or technology-specific emission factors If the implied emission factors are outside the
95 confidence intervals for the values given it is good practice to explain the reasons for this in
the inventory report
Depending on the specific national circumstances and the coverage of the facility-level reports as
compared to the total combustion activity the emission factor (EF) in this equation should be chosen
from the following possibilities in decreasing order of preference
technology-specific emission factors based on knowledge of the types of technologies
implemented at the facilities where facility-level emission reports are not available
the implied emission factor derived from the available emission reports
Facilities
Facility
Facilities
pollutantFacility
Production
E
EF
(7)
the default Tier 1 emission factor This option should only be chosen if the facility-level emission
reports cover more than 90 of the total national production
5442 Tier 3 Use of facility data
Many coke ovens are (or are part of) major facilities and emission data for individual plants might
be available through a pollutant release and transfer registry (PRTR) or another national emission
reporting scheme When the quality of such data is assured by a well developed QAQC system and
the emission reports have been verified by an independent auditing scheme it is good practice to
use such data If extrapolation is needed to cover all activity in the country either the implied
emission factors for the facilities that did report or the emission factors as provided above could be
used (see subsection 3432 of the present chapter)
5443 Activity data
Since PRTR generally do not report activity data such data in relation to the reported facility-level
emissions are sometimes difficult to find A possible source of facility-level activity might be the
registries of emission trading systems
In many countries national statistics offices collect production data on facility level but these are in
many cases confidential However in several countries national statistics offices are part of the
national emission inventory systems and the extrapolation if needed could be performed at the
statistics office ensuring that confidentiality of production data is maintained
1A1 Energy industries
EMEPEEA air pollutant emission inventory guidebook 2019 62
6 Data quality
61 Completeness
No specific issues but the separation of combustion emissions from other emissions associated with
the activities may potentially lead to exclusion of emissions
62 Avoiding double counting with other sectors
In cases where it is possible to split the emissions it is good practice to do so However care must
be taken that the emissions are not double counted (for example between combustion and process
emissions)
63 Verification
631 Best Available Technique (BAT) emission factors
Table 6-1 BAT-based emission factors for source category 1A1a
Pollutant
Fuel
type
[1]
New or
existing
plant [2]
Boiler size
or
technology
Reference
O2
content
AEL concentration range
mgm-3 at STP (0ordmC 1013
kPa) dry at reference O2
content
Emission factor
gGJ-1
(net thermal
input)
MWth vv dry Low High Low High
TSP coal new 50-100 6 5 20 18 72
coal new 100-300 6 5 20 18 72
coal new gt 300 6 5 20 18 72
coal existing 50-100 6 5 30 18 109
coal existing 100-300 6 5 30 18 109
coal existing gt 300 6 5 30 18 109
wood new 50-100 6 5 20 19 77
wood new 100-300 6 5 20 19 77
wood new gt 300 6 5 20 19 77
wood existing 50-100 6 5 20 19 77
wood existing 100-300 6 5 20 19 77
wood existing gt 300 6 5 20 19 77
oil new 50-100 3 5 20 14 57
oil new 100-300 3 5 20 14 57
oil new gt 300 3 5 10 14 28
oil existing 50-100 3 5 30 14 85
oil existing 100-300 3 5 25 14 71
oil existing gt 300 3 5 20 14 57
gas new GT 15 5 43
gas existing GT 15 5 43
NOx coal new 50-100 6 90 300 326 1087
coal new 100-300 6 90 200 326 725
coal new gt 300 6 50 150 181 543
coal existing 50-100 6 90 300 326 1087
coal existing 100-300 6 90 200 326 725
coal existing gt 300 6 50 200 181 725
wood new 50-100 6 150 250 579 964
wood new 100-300 6 150 200 579 771
wood new gt 300 6 50 150 193 579
1A1 Energy industries
EMEPEEA air pollutant emission inventory guidebook 2019 63
Pollutant
Fuel
type
[1]
New or
existing
plant [2]
Boiler size
or
technology
Reference
O2
content
AEL concentration range
mgm-3 at STP (0ordmC 1013
kPa) dry at reference O2
content
Emission factor
gGJ-1
(net thermal
input)
MWth vv dry Low High Low High
wood existing 50-100 6 150 300 579 1157
wood existing 100-300 6 150 250 579 964
wood existing gt 300 6 50 200 193 771
oil new 50-100 3 150 300 424 849
oil new 100-300 3 50 150 141 424
oil new gt 300 3 50 100 141 283
oil existing 50-100 3 150 450 424 1273
oil existing 100-300 3 50 200 141 566
oil existing gt 300 3 50 150 141 424
gas new gt 50 3 50 100 142 283
gas existing gt 50 3 50 100 142 283
gas new GT 15 20 50 172 430
gas existing GT 15 20 90 172 773
gas new Gas engine 15 20 75 172 644
gas existing Gas engine 15 20 100 172 859
SO2 coal new 50-100 6 150 400 543 1449
coal new 100-300 6 100 200 362 725
coal new gt 300 6 20 200 72 725
coal existing 50-100 6 150 400 543 1449
coal existing 100-300 6 100 250 362 906
coal existing gt 300 6 20 200 72 725
wood new 50-100 6 200 300 771 1157
wood new 100-300 6 150 300 579 1157
wood new gt 300 6 50 200 193 771
wood existing 50-100 6 200 300 771 1157
wood existing 100-300 6 150 300 579 1157
wood existing gt 300 6 50 200 193 771
oil new 50-100 3 100 350 283 990
oil new 100-300 3 100 200 283 566
oil new gt 300 3 50 150 141 424
oil existing 50-100 3 100 350 283 990
oil existing 100-300 3 100 250 283 707
oil existing gt 300 3 50 200 141 566
gas new GT 15 10 86
gas existing GT 15 10 86
Notes
BAT-AELs are based on measurement of filterable PM
Fuel is main classification only limits may be for lsquosolid fuelsrsquo rather than coal or wood Limits for gaseous fuels
are for natural gas and may not be applicable to derived fuels
New and existing plants are as defined in IED (2010)
The refinery BREF provides somewhat wide-ranging views on BAT for refinery emissions Table 6-2
provides a summary of the information presented Note that in the absence of detail about fuel gas
composition the emission factors were derived from the emission concentrations assuming natural
gas BAT emissions for energy processes are not presented
1A1 Energy industries
EMEPEEA air pollutant emission inventory guidebook 2019 64
Table 6-2 BAT-based emission factors for refinery processes
Process
unit
Pollutant Average
period
Reference
O2
content
AEL concentration
range mgm-3 at STP
(0ordmC 1013 kPa) dry at
reference O2 content
Emission factor
gGJ-1
(net thermal
input)
vv dry Low High Low High
Whole
Refinery
SO2
daily 3 60 850 17 241
monthly 3 100 1200 28 340
yearly 3 1000 1400 283 396
NOx
daily 3 70 200 20 57
monthly 3 100 450 28 127
yearly 3 200 500 57 142
Cat cracker
CO boiler CO - 3 50 100 14 28
NOx - 3 100 500 28 142
No CO
boiler CO
- 3 50 100 14 28
(O2 control) NOx - 3 300 600 85 170
SCRSNCR NOx - 3 40 150 11 43
TSP - 3 10 50 3 14
FGDlow S SO2 - 3 10 350 3 99
The BAT document for coke ovens indicates that use of desulphurised coke oven gas and low-NOx
techniques represent BAT in new or modern plant Post-desulphurisation H2S levels of 500ndash
1 000 mgm-3 of fuel are indicated However further information is needed to calculate an emission
factor an estimated SO2 factor range of 60ndash120 gGJ-1 has been calculated assuming a calorific value
of 162 MJm-3[DUKES 2007]
Estimated BAT emission factors (assuming natural gas as the fuel) for NOx are 140ndash220 gGJ-1
632 Fuel sulphur content
For processes without SO2 abatement the sulphur content of the fuel provides a means to calculate
the SO2 emission factor
EFSO2 = [S] x 20000
CV
where
EFSO2 is the SO2 emission factor gGJ-1
[S] is the percent sulphur (ww)
CV is the netinferior calorific value GJtonne-1
2 is the ratio of the RMM of SO2 to sulphur
This equation can be extended to include a factor for retention of SO2 in ash
Liquid fuels in the EC are subject to sulphur limits (EC SCOLF 19992005) as summarised in Table
6-3 The SO2 emission factors in Table 6-3 have been calculated assuming 100 conversion of fuel
sulphur and applying UK net calorific values for fuel oils (DUKES 2007)
1A1 Energy industries
EMEPEEA air pollutant emission inventory guidebook 2019 65
Table 6-3 Sulphur emission factors from oil sulphur limits
Fuel oil Implementation
date
Maximum
sulphur content
SO2 emission
factor gGJ-1
Comment
Heavy fuel oil 112003 1 485 Assumes net CV of
412 GJtonne-1
Gas oil Pre 112008 02 92 Assumes net CV of
Post 112008 01 46 434 GJtonne-1
633 Other emission factors
The Industrial Emissions Directive Gothenburg protocol USEPA emission factor handbook and
sector-specific emission factor guidance (Eurelectric and Concawe) provide additional means of
assessing the validity of the default emission factors and factors from other sources to a national
inventory
Examples of emission factors derived from ELVs in the LCPD and Gothenburg protocol are provided
in Appendix D The USEPA emission factors can be found at wwwepagovttnchiefap42
634 Derivation of emission factors from emission concentrations for combustion processes
A methodology to develop emission factors from emission concentrations (for example
measurement reports and emission limit values) is provided in Appendix E
64 Developing a consistent time series and recalculation
The emissions of non-CO2 emissions from fuel combustion change with time as facilities are
upgraded or replaced by less-polluting energy technology The mix of technology used with each
fuel will change with time and this has implications for the choice of emission factor This is probably
most relevant to the aggregated factors used in Tier 1 and Tier 2 Over time the Tier 1 emissions
estimates become less relevant
For Tier 3 using facility level data it might occur that a different selection of facility level data is
included in different years This can lead to time series inconsistencies Moreover PRTR data are
generally available for specific years only Splicing such recent reported data under the European
Pollutant Release and Transfer Registry (EPRTR) European Pollutant Emission Register (EPER) with
historical data could be used to get consistent time series Splicing could be used for both the activity
data and the country-specific emission factors
Unexpected discontinuities in time series can occur when specific facilities come into operation or
are closed in specific years If this happens it is good practice to clearly document such explanations
in the inventory archives
65 Uncertainty assessment
651 Emission factor uncertainties
The uncertainty is partly the result of how emission factors are developed and applied The
expanded statistical uncertainty is made up of between plants variance within plant (operating)
variance and uncertainties associated with the measurement methodology used and the
aggregation of data
1A1 Energy industries
EMEPEEA air pollutant emission inventory guidebook 2019 66
Process measurements from which emission factors are developed at individual facility level are
subject to both systematic and random errors in the determination of mass concentration mass
emission size distribution and analytical errors etc
In addition bias may exist in emission factors arising from assumptions made about the abatement
used on lsquotypicalrsquo industrial installations For example emission factors lsquoagersquo the factors widely used
in the Guidebook and hence by many countries as default emission factors in their national
inventories become out of date Recent measurement work suggests that they may overestimate
emissions from the industrial processes subject to more modern industrial emissions regulation
They may however still be fully representative for older plant small plant or for poorer fuels
652 Activity data uncertainties
The uncertainty in national fuel and production statistics can be difficult to establish however
reporting procedures have generally been in place for many years Recent developments in emission
trading provide a lsquobottom-uprsquo and verified alternative to national statistics in some sectors
The uncertainty for disaggregated sector-specific activity data can be high as such data may be
collected infrequently or rely on assumptions which may vary substantially with time
The inventory compiler needs to understand how sector-specific activity data have been derived
66 Inventory quality assurancequality control QAQC
Emissions from fuel combustion are largely associated with electricity production It is good practice
to check whether the electricity production data are consistent with the reported fuel use
67 Mapping
The facilities within 1A1 should be considered as point sources if plant-specific data are available
Otherwise national emissions should be disaggregated on the basis of plant capacity employment
or population statistics
68 Reporting and documentation
No specific issues
1A1 Energy industries
EMEPEEA air pollutant emission inventory guidebook 2019 67
7 Glossary
Term Definition
Boiler any technical apparatus in which fuels are oxidised in order to
generate steam
Process heater or furnace any technical apparatus in which fuels are oxidised in order to
generate heat for a process activity
Coking coal (Nomenclature for Air
Pollution of Fuels (NAPFUE) 101)
subcategory of hard coal with a quality that allows the
production of a coke suitable for supporting a blast furnace
charge (Meijer 1995)
Co-generation plant Simultaneous production of electricity and steam (or process
heating)
Combined cycle gas turbine (CCGT) gas turbine combined with a steam turbine The boiler can also
be fuelled separately
Hard coal refers to coal of a gross caloric value greater than 23 865 kJkg
on an ash-free but moist basis and with a mean random
reflectance (2) of vitrinite of at least 06 Hard coal comprises
the subcategories coking coal and steam coal (3) [Meijer 1995]
Integrated coal gasification
combined cycle gas turbine (IGCC)
gas turbine fuelled by gas which is a product of a coal
gasification process
Lignite (NAPFUE 105) non-agglomerating coals with a gross caloric value less than
17 435 kJkg and containing more than 31 volatile matter on
a dry mineral matter free basis
Power plant installation or facility for electricity generation
Stationary engines spark-ignition or compression-ignition engines (2- and 4-
stroke)
Steam coal (NAPFUE 102) subcategory of hard coal used for steam raising and space
heating purposes Steam coal includes all anthracite and
bituminous coals not included under coking coal (Meijer 1995)
Sub-bituminous coal
(NAPFUE 103)
non-agglomerating coals with a gross caloric value between
17 435 and 23 865 kJkg containing more than 31 volatile
matter on a dry mineral free matter basis (Meijer 1995)
(2) Mean random reflectance characteristic value which stands for a defined coal composition (modular
component is eg vitrinite)
(3) The following coal classification codes cover those coals which would fall into these subcategories (Meijer
1995)
International classification codes
(UN Geneva 1995)
323 333 334 423 433 435 523 533 534 535 623 633
634 635 723 733 823
USA classification Class II group 2 lsquomedium volatile bituminousrsquo
British classification Class 202 203 204 301 302 400 500 600
Polish classification Class 33 34 351 352 36 37
Australian classification Class 4A 4B 5
1A1 Energy industries
EMEPEEA air pollutant emission inventory guidebook 2019 68
8 References
API Air toxics emission factors for combustion sources using petroleum based fuels Volume 1
Development of emission factors using APIWSPA approach No 348 Washington DC American
Petroleum Institute 181998
API Comparison of API and EPA toxic air pollutant emission factors for combustion sources No 4720
Washington DC American Petroleum Institute 192002
Bailey RE 2001 Global hexachlorobenzene emissions Chemosphere Volume 43 Issue 2 April
2001 Pages 167ndash182
Bond TC Streets DG Yarber KF Nelson SM Woo J-H amp Klimont Z 2004 A Technology-based
10 Global Inventory of Black and Organic Carbon Emissions from Combustion Journal of Geophysical
Research 11 109 D14203 doi1010292003JD003697
Bond TC Wehner B Plewka A Wiedensohler A Heintzenberg J amp Charlson RJ 2006 Climate-
relevant properties of primary particulate emissions from oil and natural gas combustion
Atmospheric Environment 40 (2006) 3574ndash3587
BUWAL 2001 Massnahmen zur Reduktion der PM10-Emissionen Umwelt-Materialen Nr 136 Luft
Bundesamt fuumlr Umwelt Wald und Landschaft (BUWAL) Bern (in German)
Chow JC Watson JG Kuhns HD Etyemezian V Lowenthal DH Crow DJ Kohl SD
Engelbrecht JP amp Green MC 2004 Source profiles for industrial mobile and area sources in the
Big Bend Regional Aerosol Visibility and Observational (BRAVO) Study Chemosphere 54 (2) 185-
208
CITEPA CORINAIR Inventory-Default Emission Factors Handbook (second edition) CEC-DG XI (ed)
1992
Concawe 2015 Air pollutant emission estimation methods for E-PRTR reporting by refineries 2015
edition CONCAWE Report 0315 2015 available at
httpswwwconcaweeuuploadsModulesPublicationsrpt_15-3pdf
Concawe 2016 Emission factors for metals from combustion of refinery fuel gas and residual fuel
oil CONCAWE Report No 0916 2016 available at httpswwwconcaweeupublicationemission-
factors-for-metals-from-combustion-of-refinery-fuel-gas-and-residual-fuel-oil
CORINAIR 1990 CORINAIR 90 Emission Inventory (Proposals) mdash working paper for the 19ndash20
September 1991 meeting mdash Annex 4 Definition of Large Point Sources
Dayton DP amp Bursey JT 2001 Source sampling fine particulate matter Wood-fired industrial
boiler Report No EPA-600R-01-106 US Environmental Protection Agency Research Triangle Park
NC
Diehl T Heil A Chin M Pan X Streets D Schultz M and Kinne S 2012 Anthropogenic
biomass burning and volcanic emissions of black carbon organic carbon and SO2 from 1980 to
2010 for hindcast model experiments Atmos Chem Phys Discuss 12 24895-24954
DUKES 2007 Digest of UK Energy Statistics 2007 published by BERR and available here
httpstatsberrgovukenergystatsdukesa_1-a_3xls
1A1 Energy industries
EMEPEEA air pollutant emission inventory guidebook 2019 69
EC SCOLF 19992005 Sulphur Content of Liquid Fuels Directive and 2005 Marine oil amendment
EC-IED 2010 Directive 201075EU on industrial emissions (integrated pollution prevention and
control)
EC-LCPD 2001 Directive 200180EC of the European Parliament and of the Council of
23 October 2001 on the limitation of emissions of certain pollutants into the air from large
combustion plants
EIPPCB 2013 BAT Reference Document for Iron and Steel Production EC-IED 201075EU European
IPPC Bureau available at httpeippcbjrceceuropaeureference
EIPPCB 2015 Best Available Techniques (BAT) Reference Document for the Refining of Mineral Oil
and Gas European Commission Joint Research Centre Institute for Prospective Technological
Studies European IPPC Bureau 2015 available at httpeippcbjrceceuropaeureference
EIPPCB 2006 IPPC BAT Reference Document for Large Combustion Plant European IPPC Bureau
2006 available at httpeippcbjrceceuropaeureference
Engelbrecht JP Swanepoel L Chow JC Watson JG amp Egami RT 2002 The comparison of
source contributions from residential coal and low-smoke fuels using CMB modeling in South Africa
Environmental Science and Policy 5 (2) 157ndash167
England GC Wien S McGrath T amp Hernandez D 2004 Development of Fine Particulate Emission
Factors and Speciation Profiles for Oil and Gas Fired Combustion Systems Topical Report Test
Results for a Combined Cycle Power Plant with Oxidation Catalyst and SCR at Site Echo Prepared for
the US Department of Energy National Energy Technology Laboratory Pittsburgh PA the Gas
Research Institute Des Plains IL and the American Petroleum Institute Washington DC 2004
Eurelectric 2008 European Wide Sector Specific Calculation Method for Reporting to the European
Pollutant Release and Transfer Register VGB EURELECTRIC RecommendationsVGB European
Working Group lsquoE-PRTRrsquo January 2008 Ref 2008ndash030-0105 (Confidential report)
Fisher GL Chrisp CE amp Hayes TL 1979 Carbonaceous particles in coal fly ash In Proceedings
Carbonaceous Particles in the Atmosphere March 20ndash22 1978 Lawrence Berkeley Laboratory
University of California
Griest WH amp Tomkins BA 1984 Carbonaceous particles in coal combustion stack ash and their
interaction with polycyclic aromatic hydrocarbons Science of the Total Environment 36 209ndash214
Grochowalski A amp Konieczyński J 2008 PCDDsPCDFs dl-PCBs and HCB in the flue gas from coal
fired CFB boilers Chemosphere 73 (2008) 97ndash103
EMEPEEA (2006) EMEPCORINAIR Emission Inventory Guidebook version 4 (2006 edition)
published by the European Environmental Agency Technical report No 112006 available via
httpreportseeaeuropaeuEMEPCORINAIR4enpage002html
Henry WM amp Knapp KT 1980 Compound forms of fossil fuel fly ash emissions Environmental
Science and Technology 14 (4) 450ndash456
Hernandez D Nguyen Q amp England GC 2004 Development of Fine Particulate Emission Factors
and Speciation Profiles for Oil and Gas Fired Combustion Systems Topical Report Test Results for a
Diesel-Fired Compression Ignition Reciprocating Engine with a Diesel Particulate Filter at Site Foxtrot
Prepared for the US Department of Energy National Energy Technology Laboratory Pittsburgh PA
1A1 Energy industries
EMEPEEA air pollutant emission inventory guidebook 2019 70
the Gas Research Institute Des Plains IL and the American Petroleum Institute Washington DC
2004
Hildemann LM Markowski GR amp Cass GR 1991 Chemical Composition of Emissions from Urban
Sources of Fine Organic Aerosol Environmental Science amp Technology 25(4) 744-759
IPCC 2006 UN IPCC Guidelines for national greenhouse gas inventories available at
wwwipcc-nggipigesorjppublic2006glpdf2_Volume2V2_2_Ch2_Stationary_Combustionpdf
Kupiainen K and Klimont Z 2007 Primary emissions of fine carbonaceous particles in Europe
Atmospheric Environment 41 (10) 2156ndash2170
Meijer Jeroen Personal communication IEA (International Energy Agency) Fax of 2441995
Nielsen M Nielsen O-K amp Thomsen M 2010 Emissions from decentralised CHP plants 2007 -
Energinetdk Environmental project no 071882 Project report 5 ndash Emission factors and emission
inventory for decentralised CHP production National Environmental Research Institute Aarhus
University 113 pp ndash NERI Technical report No 786 httpwwwdmudkPubFR786pdf
Nielsen M Nielsen O-K amp Hoffmann L 2012 Improved inventory for heavy metal emissions from
stationary combustion plants ndash 1990-2009 (in prep)
Olmez I Sheffield AE Gordon GE Houck JE Pritchett LC Cooper JA Dzubay TG amp Bennett
RL 1988 Compositions of Particles from Selected Sources in Philadelphia for Receptor Modeling
Applications JAPCA 381392-1402 (1988)
Pulles T van der Gon HD Appelman W amp Verheul M (2012) Emission factors for heavy metals
from diesel and petrol used in European vehicles Atmospheric Environment 61 (2012) 641-651
Rentz et al 1993 Rentz O Holtmann T Oertel D Roumlll C et al Konzeption zur Minderung der VOC-
Emissionen in Baden-Wuumlrttemberg Umweltministerium Baden-Wuumlrttemberg (ed) Heft 21
Karlsruhe (Germany) 1993
Rubenstein G 2003 Gas turbine PM emissions mdash Update Sierra Research June 2003 Paper to
ASMEIGTI Turbo-Expo Atlanta 2003
Stobbelaar G Reduction of Atmospheric Emissions under the terms of the North Sea Action
Programme Report Lucht 102 Ministry of Housing Physical Planning and Environment The
Netherlands 1992
Theloke J Kummer U Nitter S Geftler T and Friedrich R Uumlberarbeitung der Schwermetallkapitel im
CORINAIR Guidebook zur Verbesserung der Emissionsinventare und der Berichterstattung im
Rahmen der Genfer Luftreinhaltekonvention Report for Umweltbundesamt April 2008
TNO Technical Paper to the OSPARCOM-HELCOM-UNECE Emission Inventory (1995) TNO-report
TNO-MEP-R95247
Umweltbundesamt Germany 1980 Umwelt- und Gesundheitskritierien fuumlr Quecksilber UBA-
Berichte 580 Berlin 1980
UNEP 2005 Standardised toolkit for identification and quantification of dioxin and furan releases
Edition 21 UNEP Chemicals Geneva December 2005
USEPA AP-42 (and USEPA various dates) US-EPA (ed) Compilation of Air Pollutant Emission Factors
Stationary Point and Area Sources Fifth Edition available at wwwepagovttnchiefap42
1A1 Energy industries
EMEPEEA air pollutant emission inventory guidebook 2019 71
US-EPA (ed) Criteria Pollutant Emission Factors for the NAPAP Emission Inventory EPA6007-
87015 1987
US EPA 2011 SPECIATE database version 43 US Environmental Protection Agencyrsquos (EPA)
Available at httpcfpubepagovsispeciate
van der Most PFJ Veldt C Emission Factors Manual PARCOM-ATMOS Emission factors for air
pollutants 1992 Final version TNO and Ministry of Housing Physical Planning and the Environment
Air and Energy Directorate Ministry of Transport and Water Management The Netherlands
Reference No 92ndash235 1992
Visschedijk AJH J Pacyna T Pulles P Zandveld and H Denier van der Gon 2004 Cooordinated
European Particulate Matter Emission Inventory Program (CEPMEIP) P Dilara et Al (eds)
Proceedings of the PM emission inventories scientific workshop Lago Maggiore Italy 18 October
2004 EUR 21302 EN JRC pp 163ndash174
Wenborn MJ Coleman PJ Passant NR Lymberidi E Sully J amp Weir RA 1999 Speciated PAH
inventory for the UK AEAT-3512REMC20459131ISSUE 1
Wien S England G amp Chang M 2004a Development of Fine Particulate Emission Factors and
Speciation Profiles for Oil and Gas Fired Combustion Systems Topical Report Test Results for a Dual
Fuel-Fired Commercial Boiler at Site Delta Prepared for the US Department of Energy National
Energy Technology Laboratory Pittsburgh PA the Gas Research Institute Des Plains IL and the
American Petroleum Institute Washington DC 2004
Wien S England G amp Chang M 2004b Development of Fine Particulate Emission Factors and
Speciation Profiles for Oil and Gas Fired Combustion Systems Topical Report Test Results for a
Combined Cycle Power Plant with Supplementary Firing Oxidation Catalyst and SCR at Site Bravo
Prepared for the US Department of Energy National Energy Technology Laboratory Pittsburgh PA
the Gas Research Institute Des Plains IL and the American Petroleum Institute Washington DC
2004
Wien S England G Chang M 2004c Development of Fine Particulate Emission Factors and
Speciation Profiles for Oil and Gas Fired Combustion Systems Topical Report Test Results for a Gas-
Fired Process Heater with Selective Catalytic Reduction (Site Charlie) Prepared for the US
Department of Energy National Energy Technology Laboratory Pittsburgh PA the Gas Research
Institute Des Plains IL and the American Petroleum Institute Washington DC 2004
9 Point of enquiry
Enquiries concerning this chapter should be directed to the relevant leader(s) of the Task Force on
Emission Inventories and Projectionrsquos expert panel on combustion and industry (TFEIP) Please refer
to the TFEIP website (wwwtfeip-secretariatorg) for the contact details of the current expert panel
leaders
1A1 Energy industries
EMEPEEA air pollutant emission inventory guidebook 2019 72
Annex A Summary of combustion
plant and NFR codes
Table A1 Combustion plant and sector codes
Combustion plants as point and area sources
NFR
CODE
SNAP97
Codes
NOSE
CODE
Thermal
capacity
[MWth ]
Public
power and
cogeneratio
n plants
District
heating
Industrial
combustion
and specific
sector
Commercia
l and
institutiona
l
combustio
n
Residential
combustion
Agricultur
e forestry
and
fishing
Gas
turbin
es
Stationary
engines
1A1a 01 01 01 10101 x
1A1a 01 02 01 10101 x
1A1b 01 03 01 10101 x
1A1c 01 04 01 10101 ge 300 x
1A1c 01 05 01 10101 x
1A4a 02 01 01 10101 X
1A2a-f 03 01 01 10101 x
1A1a 01 01 02 10102 x
1A1a 01 02 02 10102 x
1A1b 01 03 02 10102 x
1A1c 01 04 02 10102 ge 50 x
1A1c 01 05 02 10102 and x
1A4a 02 01 02 10102 lt 300 X
1A4bi 02 02 01 10102 x
1A4ci 02 03 01 10102 x
1A2a-f 03 01 02 10102 x
1A1a 01 01 03 10103 x
1A1a 01 02 03 10103 x
1A1b 01 03 03 10103 x
1A1c 01 04 03 10103 x
1A1c 01 05 03 10103 lt 50 x
1A4a 02 01 03 10103 X
1A4bi 02 02 02 10103 x
1A4ci 02 03 02 10103 x
1A2a-f 03 01 03 10103 x
1A1a 01 01 04 10104 x
1A1a 01 02 04 10104 x
1A1b 01 03 04 10104 x
1A1c 01 04 04 10104 not x
1A1c 01 05 04 10104 relevant x
1A4a 02 01 04 10104 x
1A4bi 02 02 03 10104 x
1A4ci 02 03 03 10104 x
1A2a-f 03 01 04 10104 x
1A1a 01 01 05 10105 x
1A1a 01 02 05 10105 x
1A1b 01 03 05 10105 x
1A1 Energy industries
EMEPEEA air pollutant emission inventory guidebook 2019 73
Combustion plants as point and area sources
NFR
CODE
SNAP97
Codes
NOSE
CODE
Thermal
capacity
[MWth ]
Public
power and
cogeneratio
n plants
District
heating
Industrial
combustion
and specific
sector
Commercia
l and
institutiona
l
combustio
n
Residential
combustion
Agricultur
e forestry
and
fishing
Gas
turbin
es
Stationary
engines
1A1c 01 04 05 10105 not x
1A1c 01 05 05 10105 relevant x
1A4a 02 01 05 10105 x
1A4bi 02 02 04 10105 x
1A4ci 02 03 04 10105 x
1A2a-f 03 01 05 10105 x
Note
x = indicates relevant combination
1A1 Energy industries
EMEPEEA air pollutant emission inventory guidebook 2019 74
Annex B Further details on emissions and controls
Additional information taken from the 2006 Guidebook (Chapter B111) which may be relevant when
assessing pollutants and controls Note that the Large Combustion Plant BREF provides a more
recent review of emissions and abatement technologies
Emissions
The emissions are released through the stack Fugitive emissions (from seals etc) can be neglected
for combustion plants
The emissions of sulphur oxides (SOx) are directly related to the sulphur content of the fuel which
for coal normally varies between 03 and 12 wt- (maf) (up to an extreme value of 45 wt-) and
for fuel oil (including heavy fuel oil) from 03 up to 30 wt-
Sulphur appears in coal as pyritic sulphur (FeS2) organic sulphur sulphur salts and elemental
sulphur A major part of the sulphur in coal comes from pyritic and organic sulphur both types are
responsible for SOx formation
For nitric oxide (NO together with NO2 normally expressed as nitrogen oxides NOx) three different
formation mechanisms are relevant
formation of lsquofuel-NOrsquo from the conversion of chemically-bound nitrogen in the fuel (NOfuel)
formation of lsquothermal-NOrsquo from the fixation of atmospheric nitrogen coming from the
combustion air (NOthermal)
formation of lsquoprompt-NOrsquo
In the temperature range considered (up to 1 700 degC) the formation of lsquoprompt-NOrsquo can be neglected
The majority of NOx emissions from coal combustion (80 to more than 90 ) is formed from fuel
nitrogen Depending on combustion temperatures the portion of thermal- NOx formed is lower than
20 The content of nitrogen in solid fuels varies
for hard coal between 02 and 35 wt- (maf)
for lignite between 04 and 25 wt- (maf)
for coke between 06 and 155 wt- (maf)
for peat between 07 and 34 wt- (maf)
for wood between 01 and 03 wt- (maf) and
for waste between 03 and 14 wt- (maf)
The content of nitrogen in liquid fuels varies for heavy fuel oil between 01 and 08 wt- and for
fuel oil between 0005 and 007 wt- Natural gas contains no organically-bound nitrogen The
content of molecular nitrogen in natural gas has no influence on the formation of fuel-NO only
thermal-NO is formed
Emissions of non-methane volatile organic compounds (NMVOC) eg olefins ketones aldehydes
result from incomplete combustion Furthermore unreacted fuel compounds such as methane (CH4)
can be emitted The relevance of NMVOCCH4 emissions from boilers which are often reported
together as VOC is very low for large-sized combustion plants
1A1 Energy industries
EMEPEEA air pollutant emission inventory guidebook 2019 75
VOC emissions tend to decrease as the plant size increases Carbon monoxide (CO) appears always
as an intermediate product of the combustion process and in particular under sub-stoichiometric
combustion conditions
The formation mechanisms of CO thermal-NO and VOC are similarly influenced by combustion
conditions
Emissions of ammonia (NH3) are not caused by a combustion process the emissions result from
incomplete reaction of NH3 additive in the denitrification process (slip of ammonia in SCR and SNCR
units)
Most of the heavy metals considered (As Cd Cr Cu Hg Ni Pb Se Zn and V) are normally released
as compounds (eg oxides chlorides) in association with particulates Only Hg and Se are at least
partly present in the vapour phase Less volatile elements tend to condense onto the surface of
smaller particles in the flue gas stream Therefore enrichment in the finest particle fractions is
observed The content of heavy metals in coal is normally several orders of magnitude higher than
in oil (except occasionally for Ni and V in heavy fuel oil) and in natural gas For natural gas only
emissions of mercury are relevant
During the combustion of coal particles undergo complex changes which lead to vaporisation of
volatile elements The rate of volatilisation of heavy metal compounds depends on fuel
characteristics (eg concentrations in coal fraction of inorganic components such as calcium) and
on technology characteristics (eg type of boiler operation mode)
From DBB all heavy metals of concern are emitted as particulate matter except Hg and Se
Emissions from lignite-fired DBB are potentially lower than from hard coal as the trace element
content in lignite and the combustion temperatures are lower In WBB the recirculation of fly ash is
a common operation mode which creates an important increase in heavy metal concentrations in
the raw gas Heavy metal emissions from FBC units are expected to be lower due to the lower
operating temperatures and a smaller fraction of fine particles The addition of limestone in FBC
facilities might reduce the emission of some heavy metals corresponding to an increased retention
of heavy metals in the bottom ash This effect can be partially compensated by the increase in the
fraction of fine particulates in the flue gas leading to increased emissions from particulates highly
enriched by heavy metals High concentrations of As poison denitrification catalysts Therefore
selected catalytic reduction plants (SCR) in a high-dust configuration may require special measures
(eg reduction of fly ash recirculation)
Controls
Relevant abatement technologies for SO2 NOx and heavy metals are outlined below Abatement
techniques for gas turbines and stationary engines are treated separately Average reduction
efficiencies and availabilities of abatement technologies for SOx and NOx are summarised in
Tables B1ndashB3
Sulphur oxides flue gas desulphurisation (FGD) processes
FGD processes are designed to remove SO2 from the flue gas of combustion installations Most
processes like the wet scrubbing process (WS) the spray dryer absorption (SDA) the dry sorbent
injection (DSI) and the Walther process (WAP) are based on the reaction of the SO2 with an alkaline
agent added as solid or as suspensionsolution of the agent in water to form the respective salts In
secondary reactions SO3 fluorides and chlorides are also removed In the case of the DESONOX
1A1 Energy industries
EMEPEEA air pollutant emission inventory guidebook 2019 76
process the SO2 is catalytically oxidised to SO3 and reacts with water to form sulphuric acid The
activated carbon process and the Wellman-Lord process remove the SO2 to produce a SO2 rich gas
which may be further processed to sulphur or sulphuric acid
The Large Combustion Plant BREF indicates that use of low sulphur fuel or co-firing with gas or other
low sulphur fuels are primary measures for SO2 control Wet limestone scrubbing process (with
gypsum production) is the main FGD process applied to coal and oil-fired boilers but is rarely applied
in plant smaller than 100 MWth Seawater scrubbing and SDA are listed as alternative possible FGD
techniques for new and retrofit boilers DSI is also listed as possible for coal Other techniques are
considered possible but rarely applied to new plant and would be plant-dependent for existing
boilers
Nitrogen oxides primary measures
Low NOx burner (LNB)
A characteristic of LNB is the staged air to fuel ratio at the burner Three different technical
modifications are in use
air-staged LNB an under-stoichiometric zone is created by a fuel-air mixture and primary air
An internal recirculation zone occurs due to the swirl of primary air A burn-out zone is created
due to secondary air fed by air nozzles arranged around the primary air nozzles
air-staged LNB with flue gas recirculation (FGR) the basic function is similar to air-staged LNB
The distances between the primary and secondary nozzles are greater therefore a flue gas
layer is formed As a result the residence time in the reducing atmosphere increases and the
oxygen concentration decreases
air-fuel-staged LNB an additional reduction zone around the primary zone is achieved by the
extremely over-stoichiometric addition of secondary fuel around the secondary flame
LNB is operational with all fuels and all types of burners The NOx reduction efficiency for coal-fired
boilers varies between 10 and 30
Staged air supply (SAS)
Staged air means the creation of two divided combustion zones mdash a primary zone with a lack of
oxygen and a burn-out zone with excess air SAS covers the low excess air (LEA) burners out of
service (BOOS) and biased burner firing (BBF) techniques
low excess air (LEA) means reduction of the oxygen content in the primary combustion zone of
the burners When firing hard coal experience has shown that the general limitations are fouling
and corrosion caused by the reducing atmosphere and incomplete burn-out When firing gas
the reduction efficiency is limited by the CO formed LEA is more suitable for lignite and often
used for retrofitting combustion plants For oil-fired boilers a reduction efficiency of 20 has
been achieved
burners out of service (BOOS) means that the lower burner row(s) in the boiler operate under a
lack of oxygen (fuel rich) the upper burners are not in use This technology is in particular
suitable for older installations but the thermal capacity of the boiler decreases by about 15ndash
20
biased burner firing (BBF) means that the lower burner rows in the boiler operate under a lack
of oxygen (fuel rich) and the upper burners with an excess of oxygen The boiler efficiency is less
compared to BOOS and the NOx reduction is also lower The NOx reduction efficiency for coal-
fired boilers varies between 10 and 40
1A1 Energy industries
EMEPEEA air pollutant emission inventory guidebook 2019 77
Overfire air (OFA)
All burner rows in the boiler operate with a lack of oxygen The combustion air is partly (5ndash20 )
injected through separate ports located above the top burner row in the boiler OFA is operational
with most fuels and most types of boilers For gas-fired boilers a reduction efficiency of 10ndash30 and
for oil-fired boilers 10ndash40 has been achieved The NOx reduction efficiency for coal-fired boilers
varies between 10 and 40
Flue gas recirculation (FGR)
The recirculation of flue gas into the combustion air is an efficient NOx abatement method for firing
modes with high combustion temperatures such as wet bottom boilers and especially for gas- and
oil-fired boilers The recirculated flue gas can be added to the secondary or primary air In the first
case the flame core is not affected and the only effect is a reduction of the flame temperature which
is favourable for thermal-NOx abatement The influence on dry bottom boilers is thus very limited
considering the fact that about 80 of the NOx formed originates from fuel-bound nitrogen FGR
can be used as an additional measure A more efficient method is the introduction of flue gas into
the primary air of an unstaged burner High reduction efficiencies of FGR in the primary flow (15ndash
20 ) have been achieved in gas- and oil-fired boilers The NOx reduction efficiency for coal-fired
boilers varies between 5 and 25
Split primary flow (SPF or Reburn)
Split primary flow means fuel staging in the furnace This technique involves injecting fuel into the
furnace above the main combustion zone thereby producing a second sub-stoichiometric
combustion zone In the primary zone of the boiler the main fuel is burnt under fuel-lean conditions
This zone is followed by a secondary zone with a reducing atmosphere into which the secondary
fuel is injected Finally secondary air is injected into the burn-out zone of the boiler This reburning
technique can in principle be used for all types of fossil fuel-fired boilers and in combination with
low NOx combustion techniques for the primary fuels When nitrogen is present in the reburning
fuel a part of it will be converted into NOx in the burn-out zone Therefore use of natural gas
provides the largest potential reduction Trials on large boilers indicate NOx reduction potentials of
50ndash70
The Large Combustion Plant BREF lists similar measures for coal- and oil-fired boilers including
low excess air
air staging (OFA and similar measures)
LNB
reburning
Reburn is not relevant for natural gas-fired boilers
Simultaneous processes for removal of nitrogen oxides and sulphur oxides
Activated carbon process (AC)
The AC process is a dry process for simultaneous SO2 and NOx removal based on the adsorption of
the pollutants in a moving bed filter of activated carbon The sulphur oxides undergo catalytic
oxidation with the moisture in the flue gas to form sulphuric acid NO2 is completely reduced to N2
NO reacts catalytically with the ammonia injected and forms N2 and H2O The AC process has been
installed at four power plants in Germany (in two cases downstream of a SDA process) The sulphur
1A1 Energy industries
EMEPEEA air pollutant emission inventory guidebook 2019 78
content in the fuel used should not exceed 23 wt- The SO2 reduction efficiency is gt 95 the NOx
reduction efficiency is gt 70
The DESONOX processSNOX process (DESONOX)
The purification of the flue gas by the DESONOX process is based on the simultaneous catalytic
reduction of nitrogen oxides (NOx) to nitrogen (N2) and water (H2O) and on the catalytic oxidation of
sulphur dioxide (SO2) to sulphur trioxide (SO3) The by-product is sulphuric acid The process has
been installed at one power plant in Germany where hard coal is used with a sulphur content of
about 1 wt- The concentration of catalyst toxics (mainly arsenic but also chromium selenium
etc) has to be taken into account The SO2 reduction efficiency is up to 95 the NOx reduction
efficiency is also up to 95 The SNOX process works on the same basic principle as the DESONOX
process with the main difference that reduction and oxidation take place in two separate reaction
towers The SNOX process has been applied at one Danish power plant No reduction efficiency has
been reported yet The SNOX process is also known as a combination of the Topsoslashe WSA-2 process
and the SCR process
Heavy metals secondary measures
Heavy metal emissions are mainly reduced by dust control equipment Particulate control systems
which are used in coal-fired power plants are cyclones wet scrubbers electrostatic precipitators
(ESP) and fabric filters In most power plants 99 of the particulates are removed from the flue
gases by using ESP or fabric filters The latter are more efficient in controlling fine particulate matter
wet scrubbers and cyclones are less efficient The reduction efficiency of ESP for most elements in
the solid state is gt 99 Only for some higher volatile elements such as Cd Pb Zn and Se is the
reduction efficiency less but it remains above 90 The reduction efficiency of an ESP for Hg
depends on the operating temperature of the ESP A cold-side ESP operating at about 140 degC is
estimated to have an average Hg reduction efficiency of about 35
The influence of FGD- and DeNOx-units on heavy metal emissions has been investigated mainly in
the frame of mass balance studies WS-FGD-units remove a further fraction of particulate matter in
flue gas in addition to dust control Particle-bound elements are removed by FGD-units with an
efficiency of about 90 In FGD-units in particular WS-units the gaseous compounds can
additionally condense on particulate matter which are mainly removed in the prescrubber With
regard to gaseous elements various studies have shown reduction efficiencies of 30ndash50 for Hg
and 60ndash75 for Se Lime contributes over 90 of the input of As Cd Pb and Zn to the FGD
The abatement of Hg emissions is influenced indirectly by DeNOx-units A high dust SCRunit
improves Hg removal in a subsequent FGD-unit using a lime scrubbing system The SCR-unit
increases the share of ionic mercury (HgCl2) to up to 95 which can be washed out in the
prescrubber of the FGD-unit A study in the Netherlands found no influence of LNB on heavy metal
emissions
Gas turbines
For gas turbines mainly NOx emissions are of most relevance Primary measures for NOx reduction
are the following
dry controls (eg over-stoichiometric combustion in a dry low NOx burner and
wet controls (injection of water andor steam) in order to regulate the combustion temperature
Stationary engines
1A1 Energy industries
EMEPEEA air pollutant emission inventory guidebook 2019 79
For spark-ignition engines the main pollutants emitted are NOx CO and unburned hydrocarbons
(VOC) For diesel engines sulphur dioxide (SO2) emissions have also to be considered Emissions of
soot also contribute to emissions of heavy metals and persistent organic pollutants but little
information is available
Primary measures are installed to optimise combustion conditions (air ratio reduced load water
injection exhaust-gas recirculation optimised combustion chamber etc) Reduction efficiencies can
be given eg for exhaust gas recirculation from 65 to 12 and for internal exhaust gas recirculation
from 4 to 37 External exhaust gas recirculation (turbo-charged models) can have reductions of
NOx varying from 25 to 34 Secondary measures (NSCR SCR) are installed if the emission
thresholds cannot be met by adjustments to the engine itself
Table B1 FGD abatement measure efficiencies and availabilities
No Type of
secondary
measure
Reduction
efficiency
ηsec [ ]
Availability
β [ ]
1 WS 090 099
2 SDA 090 099
3 DSI 045 098
4 LIFAC 070 098
5 WL 097 099
6 WAP 088 099
7 AC 095 099
8 DESONOX 095 099
Notes
WS ndash limelimestone wet scrubbing
SDA ndash spray-dryer absorption
DSI ndash dry sorbent injection
LIFAC DSI system with additional water injection
WL ndash Wellman Lord process (regenerable FGD process)
WAP ndash Walther process
AC ndash activated carbon process (simultaneous FGD and DeNOx process)
DESONOX ndash combined FGD and DeNOx process
1A1 Energy industries
EMEPEEA air pollutant emission inventory guidebook 2019 80
Table B2 NOx primary abatement measure efficiencies
Type of primary measure1)
Reduction efficiency DBB η [ ] Reduction efficiency WBB η [ ]
Hard coal Lignite Hard coal
range value3) range value3) range value3)
no measure4) 0 0 0 0 0 0
LNB 010 - 030 020 010 - 030 020 010 - 030 020
SAS 010 - 040 030 010 - 040 030 010 - 040 030
OFA 010 - 040 030 010 - 035 025 010 - 035 025
FGR 005 - 015 010 005 - 020 015 010 - 025 020
LNBSAS 020 - 060 045 020 - 060 040 020 - 060 045
LNBOFA 020 - 060 045 020 - 055 040 020 - 060 045
LNBFGR 015 - 040 030 015 - 045 030 020 - 050 035
SASOFA 020 - 065 050 020 - 060 040 020 - 060 040
SASFGR 015 - 050 040 015 - 050 040 020 - 055 045
OFAFGR 015 - 050 040 015 - 050 035 020 - 050 040
LNBSASOFA 030 - 075 060 030 - 075 060 030 - 075 060
LNBSASFGR 025 - 065 050 025 - 070 050 030 - 070 055
LNBOFAFGR 025 - 065 050 025 - 065 050 030 - 065 050
old installationoptimised 015 015 015
old installationretrofitted2) 050 050 050
new installation2) 040 040 040
Note
1) Selection from the DECOF database developed by and available at the Institute for Industrial Production
(IPP)
2) Recommended values when no information concerning the type of primary measure is available
3) Default values used in the computer programme
4) No primary measures are installed This case is mainly relevant for old installations
1A1 Energy industries
EMEPEEA air pollutant emission inventory guidebook 2019 81
Table B3 NOx secondary abatement measure efficiencies and availabilities
No
Type of
secondary
measure
Reduction
efficiency
η [ ]
Availabilty
β [ ]
1 SNCR 050 099
2 SCR 080 099
3 AC 070 099
4 DESONOX 095 099
1A1 Energy industries
EMEPEEA air pollutant emission inventory guidebook 2019 82
Annex C Sulphur content in fuels
Fuel sulphur contents from the previous Guidebook (Chapter B111)
Table C-1 Sulphur content in fuels
Type of fuel
Sulphur content of fuel
NAPFUE
code value1) range unit
Solid
Coal
hc coking 101 04 ndash 62 wt- (maf)
hc steam 102 04 ndash 62 wt- (maf)
hc sub-bituminous 103 04 ndash 62 wt- (maf)
bc broan coalligninte 105 04 ndash 62 wt- (maf)
bc briquettes 106 025 ndash 04510) wt- (maf)
Coke
hc coke oven 107 lt 13) wt- (maf)
bc coke oven 108 05 ndash 1 3) 4) wt- (maf)
petroleum 110
Biomass
wood 111 lt 0033) wt- (maf) charcoal 112 lt 0033) wt- (maf)
peat 113
Waste
municipal 114 industrial 115 wood 116
agricultural 117
Liquid
Oil
residual 203 03 5) ndash 35 6) wt- gas 204 038) 008 ndash 10 wt- diesesl 205 038) wt-
kerosene
motor
206
lt 0059)
wt-
gasoline 208
naphtha 210
black liquour 215
Gas
Gas2) natural 301 000757) gm-3
Gas
liquified petroleum gas 303 - coke oven 304 8 gm-3 blast furnace 305 4510-3 7) gm-3 coke oven and blast furnace 306 waste 307 refinery 308 le 8 7) gm-3 biogas 309
from gas works 311
Notes
1) Recommended value
2) Only trace amounts
3) Marutzky 1989
4) Boelitz 1993
5) Mr Hietamaumlki (Finland) personal communication
6) Referring to NL-handbook 198899 the range is 20 ndash 35
7) NL-handbook 1988
8) 87219 CEE 1987
9) as ~ 0
10) Davids 1986
1A1 Energy industries
EMEPEEA air pollutant emission inventory guidebook 2019 83
Annex D Emission factors derived from emission limit values
Table D1 TSP
Source
[1]
Fuel
type
[2]
New or
existing
plant [3]
Boiler size
or
technology
MWth
Reference
O2
content
vv dry
AEL or ELV concentration
mgm-3 at STP (0ordmC 1013
kPa) dry at reference O2
content
Emission factor[4]
gGJ-1
(net thermal
input)
Low High Low High
BREF coal new 50-100 6 5 20 18 72
BREF coal new 100-300 6 5 20 18 72
BREF coal new gt 300 6 5 20 18 72
LCPD coal new 50-500 6 100 362
LCPD coal new gt 500 6 50 181
LCPD coal new 50-100 6 50 181
LCPD coal new gt 100 6 30 109
BREF coal existing 50-100 6 5 30 18 109
BREF coal existing 100-300 6 5 30 18 109
BREF coal existing gt 300 6 5 30 18 109
LCPD coal existing 50-500 6 100 362
LCPD coal existing gt 500 6 50 181
BREF wood new 50-100 6 5 20 19 77
BREF wood new 100-300 6 5 20 19 77
BREF wood new gt 300 6 5 20 19 77
BREF wood existing 50-100 6 5 20 19 77
BREF wood existing 100-300 6 5 20 19 77
BREF wood existing gt 300 6 5 20 19 77
BREF oil new 50-100 3 5 20 14 57
BREF oil new 100-300 3 5 20 14 57
BREF oil new gt 300 3 5 10 14 28
LCPD oil new gt 50 3 50 141
LCPD oil new 50-100 6 50 170
LCPD oil new gt 100 6 30 102
BREF oil existing 50-100 3 5 30 14 85
BREF oil existing 100-300 3 5 25 14 71
BREF oil existing gt 300 3 5 20 14 57
LCPD oil existing gt 50 3 50 141
LCPD gas new gt 50 3 5 14
LCPD gas new gt 50 3 5 14
LCPD gas existing gt 50 3 5 14
Notes
1) BREF denotes the large combustion plant BAT reference document LCPD denotes Directive
200180EC
2) Fuel is main classification only limits may be for lsquosolid fuelsrsquo rather than coal or wood Limits for gaseous
fuels are for natural gas and may not be applicable to derived or other gaseous fuels
3) Note that new and existing plant have specific meanings under LCPD
4) Emission factors calculated from emission concentrations using USEPA methodology (See Appendix E
for details)
1A1 Energy industries
EMEPEEA air pollutant emission inventory guidebook 2019 84
Table D2 Nitrogen oxides
Source [1]
Fuel type [2]
New or existing plant [3]
Boiler size or technology
MWth
Reference O2 content vv dry
AEL or ELV concentration mg NO2m-3 at STP (0ordmC 1013 kPa) dry at reference O2 content
Emission factor [4] gGJ-1 (net thermal input)
Low High Low High
BREF coal new 50-100 6 90 300 326 1087
BREF coal new 100-300 6 90 200 326 725
BREF coal new gt 300 6 50 150 181 543
LCPD coal new 50-500 6 600 2174
LCPD coal new gt 500 6 500 1811
LCPD coal New 2016 gt 500 6 200 725
Goburg coal new 50-100 6 400 1449
Goburg coal new 100-300 6 300 1087
Goburg coal new gt 300 6 200 725
BREF coal existing 50-100 6 90 300 326 1087
BREF coal existing 100-300 6 90 200 326 725
BREF coal existing gt 300 6 50 200 181 725
LCPD coal existing 50-500 6 600 2174
LCPD coal existing gt 500 6 500 1811
LCPD coal Ex 2016 gt 500 6 200 725
Goburg coal existing gt 50 6 650 2355
BREF wood new 50-100 6 150 250 579 964
BREF wood new 100-300 6 150 200 579 771
BREF wood new gt 300 6 50 150 193 579
LCPD wood new 50-100 6 400 1543
LCPD wood new 100-500 6 300 1157
LCPD wood new gt 500 6 200 771
Goburg wood new 50-100 6 400 1543
Goburg wood new 100-300 6 300 1157
Goburg wood new gt 300 6 200 771
BREF wood existing 50-100 6 150 300 579 1157
BREF wood existing 100-300 6 150 250 579 964
BREF wood existing gt 300 6 50 200 193 771
Goburg wood existing gt 50 6 650 2507
BREF oil new 50-100 3 150 300 424 849
BREF oil new 100-300 3 50 150 141 424
BREF oil new gt 300 3 50 100 141 283
LCPD oil new 50-100 3 400 1132
LCPD oil new 100-300 3 200 566
LCPD oil new gt 300 3 200 566
Goburg oil new 50-100 3 400 1132
Goburg oil new 100-300 3 300 849
Goburg oil new gt 300 3 200 566
BREF oil existing 50-100 3 150 450 424 1273
BREF oil existing 100-300 3 50 200 141 566
BREF oil existing gt 300 3 50 150 141 424
LCPD oil existing 50-500 3 450 1273
LCPD oil existing gt 500 3 400 1132
Goburg oil existing gt 50 3 450 1273
BREF gas new gt 50 3 50 100 142 283
LCPD gas new 50-300 3 150 425
LCPD gas new gt 300 3 100 283
Goburg gas new 50-300 3 150 425
Goburg gas new gt 300 3 100 283
BREF gas existing gt 50 3 50 100 142 283
LCPD gas existing 50-500 3 300 850
LCPD gas existing gt 500 3 200 566
Goburg gas existing gt 50 3 350 991
Notes
1) BREF denotes the large combustion plant BAT reference document LCPD denotes Directive
200180EC Goburg denotes the Gothenburg protocol of 1999
2) Fuel is main classification only limits may be for lsquosolid fuelsrsquo rather than coal or wood Limits for gaseous
fuels are for natural gas and may not be applicable to derived or other gaseous fuels
3) Note that new and existing plant have specific meanings under LCPD
4) Emission factors calculated from emission concentrations using USEPA methodology (See Appendix E
for details)
1A1 Energy industries
EMEPEEA air pollutant emission inventory guidebook 2019 85
Table D3 Sulphur oxidesdioxide
Source [1]
Fuel type [2]
New or existing plant [3]
Boiler size or technology
MWth
Reference O2 content vv dry
AEL or ELV concentration mgm-3 at STP (0ordmC 1013 kPa) dry at reference
O2 content
Emission factor [4] gGJ-1 (net thermal input)
Low High Low High
BREF coal new 50-100 6 150 400 543 1449
BREF coal new 100-300 6 100 200 362 725
BREF coal new gt 300 6 20 200 72 725
LCPD coal new 50-100 6 2000 7245
LCPD coal new 100-500 6 400 2000 1449 7245
LCPD coal new gt 500 6 400 1449
Goburg coal new 50-100 6 850 3079
Goburg coal new 100-300 6 200 850 725 3079
Goburg coal new gt 300 6 200 725
BREF coal existing 50-100 6 150 400 543 1449
BREF coal existing 100-300 6 100 250 362 906
BREF coal existing gt 300 6 20 200 72 725
LCPD coal existing 50-100 6 2000 7245 00
LCPD coal existing 100-500 6 400 2000 1449 7245
LCPD coal existing gt 500 6 400 1449
Goburg coal existing 50-100 6 2000 7245
Goburg coal existing 100-500 6 400 2000 1449 7245
Goburg coal existing gt 500 6 400 1449 00
BREF wood new 50-100 6 200 300 771 1157
BREF wood new 100-300 6 150 300 579 1157
BREF wood new gt 300 6 50 200 193 771
LCPD wood new 50-100 6 200 771
LCPD wood new 100-500 6 200 771
LCPD wood new gt 500 6 200 771
Goburg wood new 50-100 6 850 3278
Goburg wood new 100-300 6 200 850 771 3278
Goburg wood new gt 300 6 200 771
BREF wood existing 50-100 6 200 300 771 1157
BREF wood existing 100-300 6 150 300 579 1157
BREF wood existing gt 300 6 50 200 193 771
Goburg wood existing 50-100 6 2000 7714
Goburg wood existing 100-500 6 400 2000 1543 7714
Goburg wood existing gt 500 6 400 1543
BREF oil new 50-100 3 100 350 283 990
BREF oil new 100-300 3 100 200 283 566
BREF oil new gt 300 3 50 150 141 424
LCPD oil new 50-100 3 850 2405
LCPD oil new 100-300 3 200 400 566 1132
LCPD oil new gt 300 3 200 566
Goburg oil new 50-100 3 850 2405
Goburg oil new 100-300 3 200 850 566 2405
Goburg oil new gt 300 3 200 566
BREF oil existing 50-100 3 100 350 283 990
BREF oil existing 100-300 3 100 250 283 707
BREF oil existing gt 300 3 50 200 141 566
LCPD oil existing 50-300 3 1700 4810
LCPD oil existing 300-500 3 400 1700 1132 4810
LCPD oil existing gt 500 3 400 1132
Goburg oil existing 50-300 3 1700 4810
Goburg oil existing 300-500 3 400 1700 1132 4810
Goburg oil existing gt 500 3 400 1132
Goburg gas new gt 50 3 35 99
LCPD gas new gt 50 3 35 99
LCPD gas existing gt 50 3 35 99
Goburg gas existing gt 50 3 35 99
Notes
1) BREF denotes the large combustion plant BAT reference document LCPD denotes Directive
200180EC Goburg denotes the Gothenburg protocol of 1999
2) Fuel is main classification only limits may be for lsquosolid fuelsrsquo rather than coal or wood Limits for gaseous
fuels are for natural gas and may not be applicable to derived or other gaseous fuels
3) Note that new and existing plant have specific meanings under LCPD
4) Emission factors calculated from emission concentrations using USEPA methodology (See Appendix E
for details)
1A1 Energy industries
EMEPEEA air pollutant emission inventory guidebook 2019 86
Table D4 Gas turbines and stationary engines
Source
[1]
Fuel
type
[2]
New or
existing
plant [3]
Technology Reference
O2 content
vv dry
Pollutant AEL or ELV concentration
mgm-3 at STP (0ordmC 1013 kPa)
dry at reference O2 content
Emission factor [4]
gGJ-1
(net thermal input)
Low High Low High
BREF gas new GT 15 TSP 5 43
BREF gas existing GT 15 TSP 5 43
BREF gas new GT 15 SO2 10 86
BREF gas existing GT 15 SO2 10 86
BREF gas new GT 15 NOx 20 50 172 430
LCPD gas new GT 15 NOx 50 75 430 644
LCPD oil new GT 15 NOx 120 1030
Goburg gas new GT 15 NOx 50 75 430 644
Goburg oil new GT 15 NOx 120 1030
BREF gas existing GT 15 NOx 20 90 172 773
Goburg gas existing GT 15 NOx 150 1289
Goburg oil existing GT 15 NOx 200 1717
BREF gas new Gas engine 15 NOx 20 75 172 644
Goburg gas new Gas engine 5 NOx 250 500 797 1594
BREF gas existing Gas engine 15 NOx 20 100 172 859
Goburg gas new CI Engine 5 NOx 500 1594
Goburg oil new CI Engine 5 NOx 500 600 1593 1911
Notes
1) BREF denotes the large combustion plant BAT reference document LCPD denotes Directive
200180EC Goburg denotes the Gothenburg protocol of 1999
2) Fuel is main classification only limits may be for lsquosolid fuelsrsquo rather than coal or wood Limits for gaseous
fuels are for natural gas and may not be applicable to derived or other gaseous fuels
3) Note that new and existing plant have specific meanings under LCPD
4) Emission factors calculated from emission concentrations using USEPA methodology (See Appendix E
for details)
1A1 Energy industries
EMEPEEA air pollutant emission inventory guidebook 2019 87
Annex E Calculation of emission factors from concentrations
E1 Emission factors for combustion activities
Standardisation of emission concentrations from combustion activities
Annual emissions emission rates and emission limit values are generally expressed in terms of
pollutant mass (for example tonnesyear-1 kghr-1 mgm-3) Note that a mass concentration is
meaningless unless the volume conditions are defined mdash typically for a combustion process the
conditions will be a dry volume at STP (0 degC 1013 kPa) and normalised to a reference oxygen
concentration Consumption of fuel requires a minimum theoretical (stoichiometric) quantity of air
In practise more air than the stoichiometric quantity is required to achieve combustion The oxygen
content in exhaust gases from a combustion appliance is indicative of the amount of excess air and
air ingress in the combustion system Normalisation to a reference oxygen content allows
comparison between technologies as it removes a diluting (or concentrating) effect of different levels
of excess airair ingress on the pollutant concentration
Common oxygen concentrations for emission normalisation are
oil- or gas-fired boilers mdash 3 O2
solid-fuel boilers mdash 6 7 O2
wood-fired boilers mdash 6 10 11 or 13 O2
incineration mdash 11 O2
gas turbines mdash 15 O2
stationary engines mdash 5 15 O2
dryers mdash 17 O2
Other normalisation oxygen concentrations are used including 0 O2 which is commonly used in
testing of residential gas appliances Concentrations can also be normalised using carbon dioxide
(although this is much less common)
Usually emission concentration data will be provided as mass concentrations at a specified oxygen
content However where emission data are provided in other forms the following equations may
help the user manipulate the date into a more useful form
Some pollutants are measured and reported on a wet basis and may require standardisation to the
dry condition
[X]d = [X]w 100
(100-[H2O])
where
[X]w is the measured concentration for a wet flue gas (ppm mgm-3 vv)
[X]d is the measured concentration for a dry flue gas (same units as the dry concentration)
[H2O] is the flue gas moisture content as vv on a wet basis
1A1 Energy industries
EMEPEEA air pollutant emission inventory guidebook 2019 88
Many pollutants are measured as volume (molar) concentrations Conversion to a mass
concentration assumes ideal gas behaviour and is detailed below
[X]m = [X]d MW
224
where
[X]d is the measured concentration in ppm (parts per million) by volume for a dry flue gas
[X]m is the measured concentration in mgm-3 by volume for a dry flue gas
MW is the relative molecular mass of the pollutant (for example 64 for SO2)
224 is the volume occupied by 1 kgmole of an ideal gas at 0 degC 1013 kPa (m3)
Note that NOx emission concentrations and emission factors are defined in terms of NO2 Hence the
relative molecular mass used for NOx is 46 VOC emission concentrations are often defined in terms
of carbon Hence the relative molecular mass used for VOC is 12 but this will often be modified
further for the calibration gas applied (for example MW for concentrations measured as propane
C3H8 lsquoequivalentsrsquo would be 3 x 12 = 36)
Normalisation to a reference O2 concentration is given by
[X]ref = [X]m (209-[ O2]ref)
(209-[O2]m)
where
[X]ref is the standardised concentration of the pollutant at the reference O2 content
[x]m is the measured concentration in mgm-3 for a dry flue gas
[O2]m is the measured O2 concentration in on a dry basis
[O2]ref is the reference O2 concentration in on a dry basis (for example 3 6 or 15 )
This calculation is appropriate where pollutant and O2 concentrations are measured on a dry basis
Calculation of emission factors
An emission factor relates the release of a pollutant to a process activity For combustion processes
emission factors are commonly described as the mass of pollutant released per unit of fuel burned
An emission factor can be calculated in several ways the approach adopted uses the standardised
pollutant emission concentrations and the specific theoretical (stoichiometric) volume of flue gas for
the relevant fuel This approach avoids measurement of exhaust gas flow and fuel flows which can
have a high uncertainty and may not be practical at many combustion plant
The approach requires knowledge of the fuel used the pollutant concentration and the oxygen
concentration
Fuel analysis where available allows calculation of the specific flue gas volume from the elemental
analysis However the US Environmental Protection Agency Method 19 provides flue gas volume for
common fuels For other fuels (for example derived gases landfill gas unrefined natural gas or
waste-derived fuels) fuel analysis is advised to minimise uncertainty
1A1 Energy industries
EMEPEEA air pollutant emission inventory guidebook 2019 89
Fuel analysis route the fuel analysis and combustion calculations are used to determine the
stoichiometric air requirement and dry flue gas volume per volume or mass of fuel Note that it is
important to understand the analysis reporting conditions particularly for solid fuels The
calculations assume ideal gas behaviour A dry flue gas volume is calculated for the reference O2
concentration used to normalise the pollutant emission concentration A pollutant emission factor
(EF) can hence be calculated by multiplying the standardised pollutant concentration by the dry flue
gas volume at the same reference oxygen content
Generally the flue gas volumes generated from combustion of fuel can be calculated in accordance
with the following equations
CXHY + (X+(Y4)O2 = X CO2 + (Y2) H2O
Note that some of the oxygen may be sourced from the fuel For combustion in air each cubic metre
of oxygen is associated with (791209) cubic metres of nitrogen
The dry flue gas volume at stoichiometric conditions (DFGVSC) per unit mass of fuel (or volume for
gaseous fuels) can be calculated and hence the dry flue gas volume at the normalised condition
(DFGVref) for the required reference oxygen content
DFGVref = DFGVSC (209(209-[O2ref]))
A pollutant emission factor (EF) can hence be calculated by multiplying the standardised pollutant
concentration by the dry flue gas volume at the same reference oxygen content For example at 15
oxygen
EF = [X]15 DFGV15
Emission factors are reported in several ways and these are generally recalculated using physical or
other properties of the fuel
For example a thermal emission factor (as used in the Guidebook) can be derived by dividing the
emission factor calculated above by the calorific value of the fuel For the Guidebook this is the net
(inferior) CV
EFthermal = EF
CV
where
EFthermal is the thermal emission factor expressed in units to suit the user (for example g GJ-1)
CV is the net calorific value of the fuel in appropriate units to suit the units of the emission factor
USEPA Method 19 The USEPA provides stoichiometric dry flue gas volume for fuel oil The USEPA
data can be found in USEPA Method 19 (US Code of Federal Regulations Title 40 Part 60
Appendix A) The USEPA lsquoF-factorrsquo data are presented as the volume of dry flue gas at 20 degC
associated with the gross thermal input of the fuel These USEPA conditions are not consistent with
the Guidebook (net calorific basis) or emission concentration reporting practise in Europe (dry gas
at STP mdash 0ordmC 1013 kPa) and consequently some manipulation of the data is required Calculations
assume an ideal gas
The USEPA method can be obtained here wwwepagovttnemcmethodsmethod19html and the
F-factors are provided below
1A1 Energy industries
EMEPEEA air pollutant emission inventory guidebook 2019 90
Fuel type Fd1) Fw1) Fc1)
dscmJ dscf106 Btu wscmJ wscf106 Btu scmJ scf106 Btu
Coal
Anthracite2 27110-7 10100 28310-7 10540 053010-7 1970
Bituminus2 26310-7 9780 28610-7 10640 048410-7 1800
Lignite 26510-7 9860 32110-7 11950 051310-7 1910
Oil3) 24710-7 9190 27710-7 10320 038310-7 1420
Gas
Natural 23410-7 8710 28510-7 10610 028710-7 1040
Propane 23410-7 8710 27410-7 10200 032110-7 1190
Butane 23410-7 8710 27910-7 10390 033710-7 1250
Wood 24810-7 8710 - - 049210-7 1830
Wood bark 25810-7 9240 - - 051610-7 1920
Municipal 25710-7 9600 - - 048810-7 1820
Solid waste - 9570
Notes
1) determined at standard conditions 20degC (68degF) and 760mmHg (2992 inHg)
2) as classified according to ASTM D 388
3) Crude residual or distillate
The Fd factors are used mdash these represent the dry stoichiometric flue gas volume per unit of energy
input The Fw and Fc factors represent the wet flue gas volume and CO2 volumes respectively
The USEPA dry flue gas volume at stoichiometric conditions are first recalculated to provide the flue
gas volume (DFGVref) for the required oxygen content at STP and for the net energy input
Fdrsquo = Fd (273293) ((CVgross)CVnet))
Where
Fdrsquo is the stoichiometric dry flue gas volume at STP per unit of net energy input ndash m3J-1
Fd is the USEPA factor (20 degC and gross energy input)
273293 Volume correction mdash ratio of temperatures in Kelvin
Note that it is the ratio between the fuelsrsquo gross and net calorific values that is needed Indicative
ratios are provided below based on UK data (DUKES 2007)
Fuel CVgross CVnet Unit Ratio grossnet
Power stn coal 262 249 GJtonne-1 105
Industrial coal 266 253 GJtonne-1 105
Wood 119 10 GJtonne-1 108
HFO 433 412 GJtonne-1 105
Gas oil 456 434 GJtonne-1 105
Natural gas 398 358 MJm-3 111
The dry flue gas volume at the normalised oxygen content can then be calculated
Fdref = Fdrsquo (209(209-[O2ref]))
1A1 Energy industries
EMEPEEA air pollutant emission inventory guidebook 2019 91
A pollutant emission factor (EFthermal) can then be calculated by multiplying the standardised
pollutant concentration by the dry flue gas volume at the same reference oxygen content For
example at 15 oxygen
EFthermal = [X]15 Fd15
Emission factors are reported in several ways and these are generally recalculated using physical or
other properties of the fuel
For example a mass emission factor can be derived by multiplying the thermal emission factor
calculated above by the net calorific value of the fuel
EF = EFthermal CV
where
EFthermal is the thermal emission factor expressed in units to suit the user (for example g GJ-1)
CV is the net calorific value of the fuel in appropriate units to suit the units of the emission factor
Example figures for correlation of emission concentrations to emission factors from USEPA
Method 19 F factors are provided in Figures C1 and C2 below
Figure E1 Emission factors mdash selected fuels and standardised concentrations up to
1 000 mgm-3
Emission Factors and Concentrations
0
100
200
300
400
500
600
700
800
900
1000
0 100 200 300 400 500 600 700 800 900 1000
Emission concentration mgm3 dry STP (0C 1013 kPa) at Reference O2
Em
iss
ion
fa
cto
r g
GJ
ne
t
Coal (6 O2)
Wood (6 O2)
Oil gas (3 O2)
Oil gas (15 O2)
1A1 Energy industries
EMEPEEA air pollutant emission inventory guidebook 2019 92
Figure E2 Emission factors mdash selected fuels and standardised concentrations up to
200 mgm-3
0
20
40
60
80
100
120
140
160
180
200
0 20 40 60 80 100 120 140 160 180 200
Emissions concnetrations mgm3 dry at STP (0C 1013kPa) at Reference O2
Em
iss
ion
fa
cto
rs g
GJ
(n
et)
Coal (6 O2)
Wood (6 O2)
Oil gas (3 O2)
Oil gas (15 O2)
1A1 Energy industries
EMEPEEA air pollutant emission inventory guidebook 2019 93
Annex F Emission factors from older versions of the Guidebook
Chapter B111
Table 24 NOx emission factors [gGJ] for combustion plants
Thermal boiler capacity [MW] Thermal boiler capacity [MW]
gt= 30032) gt= 50 and lt 30032)
Type of fuel NAPFUE Type of boiler43) Type of boiler Type of boiler
code DBBboiler27) WBB FBC DBBboiler27) WBB
CFBC
s coal hc coking 101 see table 25 see table 25 701) see table 25 see table 25
s coal hc steam 102 see table 25 see table 25 701) see table 25 see table 25
s coal hc sub-bitumious 103 see table 25 see table 25 701) see table 25 see table 25
s coal bc brown coallignite 105 see table 25 701) see table 25
s coal bc briquettes 106
s coke hc coke oven 107
s coke bc coke oven 108
s coke petroleum 110 3001)
s biomass wood 111 2001)15)
s biomass charcoal 112
s biomass peat 113 3001)28) 3001)
s waste municipal 114
s waste industrial 115
s waste wood 116
s waste agricultural 117
l oil residual 203 2101)29) 2601)28) 155 - 29619)20) 1501)29) 1701)29) 1901)30) 2101)30)
l oil gas 204 64 - 6821) 1001)
l oil diesel 205
l kerosene 206
l gasoline motor 208
l naphtha 210
l black liquor 215
g gas natural 301 1701) 48 - 33322) 23) 1251)25) 1501)26) 48 - 33322)23)24)
g gas liquified petroleum gas 303 88 - 33323)24) 88 - 33323)24)
g gas coke oven 304 1501) 88 - 33323) 24) 1101)25) 1301)26) 88 - 33323)24)
g gas blast furnace 305 951) 88 - 33323) 24) 651)25) 801)26) 88 - 33323)24)
g gas coke oven and blast furnace gas 306 88 - 33323)24) 88 - 33323)24)
g gas waste 307 88 - 33323)24) 88 - 33323)24)
g gas refinery 308 88 - 33323)24) 1401) 88 - 33323)24)
g gas biogas 309 88 - 33323)24) 88 - 33323)24)
g gas from gas works 311
1A1 Energy industries
EMEPEEA air pollutant emission inventory guidebook 2019 94
Table 24 continued
Thermal boiler capacity [MW] no speci-
gt 50 and lt 300 32)
lt 5032) fication
Type of boiler Type of boiler Gas turbine Stationary engine CORINAIR 9044)
FBC GF DBBboiler27) WBB FBC GF
PFBCCFBC PFBC CFBCAFBC SC CC CI SI
1501) 701) 1501) 1801)31) 2301)29) 701) 1501) 54544)
1501) 701) 1501) 1801)31) 2301)29) 701) 1501) 365 - 76144)
1501) 701) 1501) 1801)31) 2301)29) 701) 1501) 205 - 168344)
1501) 701) 1501) 1801)31) 2301)29) 701) 1501) 180 - 38044)
333 - 17544)
3001) 3001) 3001)
2001) 33 - 11515)2001) 33 - 11515) 2001)15) 50 - 20044)
1601) 1001) 2301) 2801) 1601) 1001) 150 - 24044)
90 - 46316)17) 90 - 46316)17) 22044)
139 - 14018) 139 - 14018)
80 - 20044)
886) 16044)
1401)29) 1801)30) 25045) 1090-120045) 24 - 37044)
801) 1001) 120 1)35) 3501)33) 3801)34) 7801)36) 100 - 120045) 50 - 26944)
100 - 70045) 30046) 6001)37)42) 12001)38)10001)40)42) 18001)39)42)
18044)
20 - 44044)
1001) 48 - 33322)23)24) 150 - 36045) 6001)37)42) 12001)38)42)10001)40)42) 18001)39)42) 22 - 35044)
1884)41) 1874)41)
88 - 33323)24) 35 - 10044)
901)23)24) 70 - 57144)
88 - 33323)24) 67 - 33044)
88 - 33323)24)
88 - 33323)24) 35 - 32744)
1401)23)24) 150-15145) 35 - 14044)
88 - 33323)24) 6044)
1A1 Energy industries
EMEPEEA air pollutant emission inventory guidebook 2019 95
Table 25 NOx emission factors [gGJ] for coal combustion according to the model (see Annexes 4 and 5)
Thermal boiler capacity [MW]
gt= 50 sup1)
Type of fuel coal mining country NAPFUE Hu [MJkg] Type of boiler
code (maf) DBB WBB
PM0sup2) PM1 PM2 PM3 PM4 PM0 PM1 PM2 PM3 PM4
s coal hc Australia (101) 34 568 454 312 312 227 703 562 387 422 281
Canada (101) 33 500 405 278 278 202 627 501 345 376 251
China (101) 32 413 331 227 227 165 512 409 281 307 205
Columbia (101) 32 535 428 394 394 214 662 529 364 397 265
Czech Republic (101) 34 483 387 266 266 193 598 479 329 359 239
France 101 35 374 299 205 205 149 463 370 254 278 185
Germany RAG 102 35 384 307 211 211 154 476 381 262 285 190
Germany others 101 30 495 396 272 272 198 613 490 337 368 245
CIS (101) 32 308 247 169 169 123 382 305 210 229 153
Hungary 101 34 401 320 220 220 160 496 397 273 298 198
India 103 30 551 441 303 303 220 682 545 375 409 273
South Africa (101) 32 569 456 313 313 228 705 504 388 423 282
USA (101) 34 563 450 310 310 225 697 558 383 418 279
Venezuela (101) 34 588 471 324 324 235 728 583 401 437 291
s coal bc Czech Republic 105 28 506 405 278 304 202
Germany
- Rheinisch Coal 105 27 325 260 179 195 130
- Middle Germany 105 25 504 403 277 302 202
- East Germany 105 26 539 431 296 323 215
Hungary-1 105 36 379 303 208 227 151
Hungary-2 103 28 379 304 209 228 152
Poland 105 25 531 425 292 319 213
Portugal 105 25 461 369 254 277 185
Turkey-2 103 27 725 580 399 435 2901) The emission factors [gGJ] are given at full load operating modus2) PM0 PM4 = most used combinations of primary
measures = reduction efficiencies [ ] PM0 - no primary measures
PM1 - one primary measure LNB
PM2 - two primary measures LNBSAS
PM3 - two primary measures LNBOFA
PM4 - three primary measures LNBSASOFA
1A1 Energy industries
EMEPEEA air pollutant emission inventory guidebook 2019 96
Table 26 NMVOC emission factors [gGJ] for combustion plants
Thermal boiler capacity [MW] no speci-
Type of fuel NAPFUE gt= 50 lt 50 fication
code boiler GF boiler Gas turbine Stationary engine CORINAIR906)
s coal hc coking 101 35)
302) 502) 6001) 36)
s coal hc steam 102 35)
302) 502) 6001) 1 - 156)
s coal hc sub-bituminous 103 35)
302) 502) 6001) 15 - 156)
s coal bc brown coallignite 105 302)3) 502) 15 - 156)
s coal bc briquettes 106 1501)
s coke hc coke oven 107 121) 5 - 156)
s coke bc coke oven 108
s coke petroleum 110 156)
s biomass wood 111 802) 1005) 1501) 4004) 10 - 486)
s biomass charcoal 112
s biomass peat 113 302)3) 302) 3 - 486)
s waste municipal 114 106)
s waste industrial 115
s waste wood 116 40 - 486)
s waste agricultural 117 506)
l oil residual 203 102)3) 37) 507) 15 - 4766)
l oil gas 204 52) 151) 52) 15 - 27) 15 - 1007) 1002) 15 - 936)
l oil diesel 205
l kerosene 206 36)
l gasoline motor 208
l naphtha 210 36)
l black liquor 215 36)
g gas natural 301 52) 52) 25 - 47) 2002) 2 - 46)
g gas liquified petroleum gas 303 2 - 266)
g gas coke oven 304 25 - 1676)
g gas blast furnace 305 1 - 256)
g gas coke oven and blast furnace gas 306
g gas waste 307 256)
g gas refinery 308 252) 257) 21 - 106)
g gas biogas 309 256)
g gas from gas works 3111) LIS 1977 92 2) CORINAIR 1992 80 3) DBB only 4) small consumers cf 24 5) power plants cf 246) CORINAIR90 data of combustion plants as point sources with a thermal capacity of gt 300 50 - 300 lt 50 MW 7) CORINAIR90 data point sources
1A1 Energy industries
EMEPEEA air pollutant emission inventory guidebook 2019 97
Table 28 CO emission factors [gGJ] for combustion plants
Type of combustion no speci-
Utility combustion Commercial comb Industrial combustion fication
Type of fuel NAPFUE DBBWBB GF boiler GF DBBWBB GF GT stat E CORINAIR909)
code boilers1) stoker boiler1) stoker
spreader travell spreader travelling
s coal hc coking 101 143) 1213) 1953) 972) 134) 812) 1154) 9722) 159)
s coal hc steam 102 143) 1213) 1953) 972) 134) 1154) 972) 10 - 17529)
s coal hc sub-bituminous 103 143) 1213) 1953) 972) 134) 812) 1154) 9722) 12 - 24699)
s coal bc brown coallignite 105 143) 1213) 1953) 162) 134) 1332) 1154) 1602) 96 - 6449)
s coal bc briquettes 106
s coke hc coke oven 107 102 - 1219)
s coke bc coke oven 108
s coke petroleum 110 159)
s biomass wood 111 14733) 1993) 15043) 30 - 3009)
s biomass charcoal 112
s biomass peat 113 30 - 1609)
s waste municipal 114 983)6) 193) 193)7) 963)7) 42 kgMg3)8) 309)
s waste industrial 115
s waste wood 116 12 - 3009)
s waste agricultural 117 58 kgMg3)8) 209)
l oil residual 203 153) 173) 153) 10 - 1510) 10010) 3 - 3269)
l oil gas 204 153) 163) 123) 10 - 2010) 12 - 113010) 10 - 4649)
20611)
l oil diesel 205
l kerosene 206 129)
l gasoline motor 208
l naphtha 210 159)
l black liquor 215 111 - 3149)
g gas natural 301 193) 963) 173) 135) 10 - 2010) 323) 005 - 609)
g gas liquified petroleum gas 303 10 - 139)
g gas coke oven 304 003 - 1309)
g gas blast furnace 305 03 - 6449)
g gas coke oven and blast furnace gas 306
g gas waste 307 01 - 2559)
g gas refinery 308 1010) 2 - 159)
g gas biogas 309 139)
g gas from gas works 311
1A1 Energy industries
EMEPEEA air pollutant emission inventory guidebook 2019 98
1) DBBWBB for coal combustion boiler for other fuel combustion2) EPA 1987 85 CORINAIR 1992 803) Radian 1990 102 IPCC 1994 88 without primary measure4) OECD 1989 100 CORINAIR 1992 805) CORINAIR 1992 80 part 86) grate firing without specification7) small combustion 19 gGJ mass burning 96 gGJ8) open burning9) CORINAIR90 data of combustion plants as point sources with a thermal capacity of gt 300 50 - 300 lt 50 MW10) CORINAIR90 data point sources11) AP42 115
1A1 Energy industries
EMEPEEA air pollutant emission inventory guidebook 2019 99
Chapter B111(S1)PMv1
Table 82a Emission factors for combustion processes burning hard coal
Fuel NAPFUE NFR Codes Activity description Activity detail Emission factor Notes
Hard coal TSP PM10 PM25
Bituminous
coal 101 Various Electricity CHP heat
FF lt 20 mgNm-3 6 6 5 CEPMEIP lsquoBATrsquo
ESP (or FF) lt 50 mgNm-3 15 12 6 Scaled from CEPMEIP ESP factor TSP scaled to a
nominal 100 mgNm-3 limit
ESP lt 100 mgNm-3 30 25 12 From CEPMEIP sub-bit coal lsquohigh efficiency ESPrsquo
TSP scaled to a nominal 100 mgNm-3 limit
ESP Oldconventional
lt 500 mgNm-3 140 70 17
CEPMEIP
Unit with multicyclone 100 60 35 CEPMEIP
Unit uncontrolled or cyclone 500 250 100 CEPMEIP (NB such a high emission
concentration would apply to few if any plant)
Sub-
bituminous
coal
103 Various Electricity CHP heat
plant
FF lt 20 mgNm-3 6 6 5 CEPMEIP lsquoBATrsquo
ESP (or FF)
lt 50 mgNm-3 15 12 6
Scaled from CEPMEIP ESP factor (TSP scaled to a
nominal 100 mgNm-3 limit)
ESP
lt 100 mgNm-3 30 25 12
From CEPMEIP sub-bit coal lsquohigh efficiency ESPrsquo
TSP scaled to a nominal 100 mgNm-3 limit
ESP Oldconventional
lt 500 mgNm-3 140 70 17
CEPMEIP
Unit with multicyclone 100 60 35 CEPMEIP
Unit uncontrolled or cyclone 500 250 100
CEPMEIP (the lower of the two TSP factors the
800 g GJ-1 for small uncontrolled plant is such a
high emission concentration that would apply to
few if any plant)
Coke 107 1A1b Oil refineries Uncontrolled 500 250 100
Coke is unlikely to be burned as primary fuel
when co-fired use the factor for the principal fuel
1A1 Energy industries
EMEPEEA air pollutant emission inventory guidebook 2019 100
Table 82b Emission factors for combustion processes burning brown coal
Fuel
NAPFUE NFR Code Activity description Activity detail Emission factor Notes
TSP PM10 PM25
Brown coal 105 Various Electricity plant CHP
plant heat plant Modern FF lt 20 mgNm-3 9 8 6 CEPMEIP lsquoBATrsquo
High efficiency ESP (or FF) 40 30 14 CEPMEIP
Conventional large unit with
multicyclone
100 60 35 CEPMEIP
Peat 113 Various Electricity plant CHP
plant heat plant
Modern abatement (FF)
lt 30 mgNm3
9 8 6 CEPMEIP
Efficient abatement
lt 50 mgNm3
20 15 10 TSP scaled from emission limit
of 50 mgNm-3
Efficient abatement
lt 100 mgNm3
40 30 20 TSP scaled from emission limit
of 100 mgNm-3
Conventional technology 120 40 20 CEPMEIP
Conventional smaller
multicyclone
300 40 20 CEPMEIP
1A1 Energy industries
EMEPEEA air pollutant emission inventory guidebook 2019 101
Table 82c Emission factors for combustion processes burning other solid fuels
Fuel NAPFUE NFR Code Activity description Activity detail Emission factor Notes
TSP PM10 PM25
Municipal
solid waste 114 Various
Electricity plant CHP
plant heating plant
Effective emission control (BAT) 15 13 10
CEPMEIP (NB care should be taken using
this factor as waste burning is often
controlled under nationalinternational
regulation to a more stringent specification)
Conventional emission control 100 70 55
CEPMEIP (uncontrolled optimised
combustion) (NB care should be taken
using this factor as waste burning is often
controlled under nationalinternational
regulation to a more stringent specification)
Industrial
waste 115 Various
Electricity CHP
heating plant
Effective emission control (BAT) 15 13 10
CEPMEIP (NB care should be taken using
this factor as waste burning is often
controlled under nationalinternational
regulation to a more stringent specification)
Conventional emission control 100 70 55
CEPMEIP (uncontrolled optimised
combustion) (NB care should be taken
using this factor as waste burning is often
controlled under nationalinternational
regulation to a more stringent specification)
Older small uncontrolled 600 350 210
CEPMEIP (uncontrolled optimised
combustion) (NB care should be taken
using this factor as waste burning is often
controlled under nationalinternational
regulation to a more stringent specification)
1A1 Energy industries
EMEPEEA air pollutant emission inventory guidebook 2019 102
Table 82d Emission factors for combustion processes burning natural gas
Fuel NAPFUE NFR Code Activity description Activity detail Emission factor Notes
TSP PM10 PM25
Natural gas 301 Various Electricity CHP and
heating plant
Burner with optimised
combustion 01 01 01
CEPMEIP
Conventional installation 02 02 02 CEPMEIP
Conventional installation 09 09 09 USEPA filterable
1A1 Energy industries
EMEPEEA air pollutant emission inventory guidebook 2019 103
Table 82e Emission factors for combustion of derived gases
Fuel NAPFUE NFR Code Activity description Activity detail Emission factor Notes
TSP PM10 PM25
Gas works
gas 311 Various
Electricity CHP and
heating plant
Clean fuel efficient
combustion 01 01 01 CEPMEIP
Clean fuel conventional
installation 02 02 02 CEPMEIP (conventional installation)
Conventional installation 5 5 5 CEPMEIP (high PM due to fuel quality)
Other
gaseous fuel 314 Various
Electricity CHP and
heating plant
Clean fuel efficient
combustion 01 01 01 CEPMEIP
Conventional installation 5 5 5 CEPMEIP
Coke oven
gas 304 Various
Electricity CHP
heating plant coke
ovens
Clean fuel efficient
combustion 01 01 01 CEPMEIP
Clean fuel conventional
installation 02 02 02 CEPMEIP (conventional installation)
Conventional installation 5 5 5 CEPMEIP
Blast furnace
gas 305 Various
Electricity CHP and
heating plant coke
ovens
Clean fuel efficient
combustion 01 01 01 CEPMEIP
Clean fuel conventional
installation 02 02 02 CEPMEIP (conventional installation)
Conventional installation 5 5 5 CEPMEIP
1A1 Energy industries
EMEPEEA air pollutant emission inventory guidebook 2019 104
Table 82f Emission factors for combustion of heavy fuel oil
Fuel NAPFUE NFR Code Activity description Activity detail Emission factor Notes
TSP PM10 PM25
Residual fuel oil 203 Various Electricity CHP and
heating plant
Low S fuel with optimised
burner and abatement 3 3 25 CEPMEIP (about 10 mgNm-3 or BAT)
Low S fuel efficient
combustion 14 12 10 CEPMEIP (about 50 mgNm-3)
Low-medium S fuel
conventional installation 20 15 9 CEPMEIP (about 70 mgNm-3)
Low-medium S fuel
conventional installation 60 50 40
CEPMEIP (higher of two entries used About
200 mgN Nm-3)
High S fuel 210 190 130
CEPMEIP (lower of two entries for high S
used (higher entry 240 g GJ-1 for TSP) Very
high emission concentration (about
750 mgNm-3)
Petroleum coke 110 1A1b Oil refineries Conventional multicyclone 100 60 35 CEPMEIP Bit coal factors more
appropriate
1A1 Energy industries
EMEPEEA air pollutant emission inventory guidebook 2019 105
Table 82g Emission factors for combustion of other liquid fuels
Fuel NAPFUE NFR Code Activity description Activity detail Emission factor Notes
TSP PM10 PM25
Gasdiesel oil 205 Various Electricity CHP
heating plant
Optimised burner 2 2 2 CEPMEIP
Conventional burner 5 5 5 CEPMEIP
Naphtha 210 1A1b Oil refineries All units 5 5 5 CEPMEIP
Liquefied
petroleum gas 303 Various
Electricity CHP
heating plant
Optimised burner 01 01 01 CEPMEIP
Conventional burner 5 5 5 CEPMEIP
Refinery gas 308 Various Electricity CHP
heating plant
Optimised burner 01 01 01 CEPMEIP
Conventional burner 5 5 5 CEPMEIP
Other oil 224 Various Electricity CHP
heating plant
Low S fuel optimised burner 3 3 25 CEPMEIP
Low S fuel efficient
combustion 14 12 10
CEPMEIP for residual oil (About 50 mgNm-
3 LCPD limit for existing plant)
Low-medium S fuel
conventional installation 20 15 9 CEPMEIP (about 70 mgNm-3)
Low-medium S fuel
conventional installation 60 50 40
CEPMEIP (highest of similar entries with TSP
of 35 40 50 and 60 used About 200 mgN
Nm-3)
High S fuel 210 190 130
CEPMEIP lower of two entries for high S
used (This is a very high emission
concentration about 750 mgN Nm-3)
1A1 Energy industries
EMEPEEA air pollutant emission inventory guidebook 2019 106
Table 82h Emission factors for combustion of biomass
Fuel NAPFUE NFR Code Activity description Activity detail Emission factor Notes
TSP PM10 PM25
Wood 111 Various Electricity CHP
heating plant
Modern unit with FF
lt 20 mgNm3 TSP 7 7 6
TSP scaled from BAT benchmark fractions
applied based on bit Coal
Older unit lt 100 mgNm3 TSP 35 25 12 TSP scaled from emission concentration
fractions based on bit Coal
Uncontrolled conventional
installation 100 70 55 CEPMEIP (uncontrolled multicyclone)
Conventional minimal control 160 150 150 CEPMEIP for conventional installation
Charcoal 112 1A2c Chemicals
Conventional large unit with
multicyclone 100 60 35
CEPMEIP the use of charcoal is likely to be
very rare
400 100 35 CEPMEIP the use of charcoal is likely to be
very rare
Black liquour 215 1A2f Textile and leather
(pulp and paper) Conventional installation 160 150 150
CEPMEIP (NB such a high emission
concentration would apply to few if any
plant)
Biogas 309 Various Electricity CHP
heating plant
Modern optimised large
installation 3 3 25 (CEPMEIP clean fuel)
Conventional burner 5 5 5 CEPMEIP
Modern optimised 20 15 10 CEPMEIP (gasification plant)
1A1 Energy industries
EMEPEEA air pollutant emission inventory guidebook 2019 107
Chapter B111(S2)PMv2
Default emission factors for use with simpler methodology (Tier 1)
Fuel Technology Emission factor g GJ-1 Notes (4)
TSP PM10 PM25
Hard coal (assumes
20 ash)
Brown coal
Other solid fuels
Pulverised coal ESP 30 20 9 Based on AP-42 mdash assumes 20 ash content and PM emissions from solid mineral
fuels generally similar to coal Pulverised coal fluid bed other FF 74 74 37
Cyclone furnace ESP 61 42 23
Stoker with multicyclone 330 230 27
Pulverised coal ESP + wet limestone FGD 6 6 5 From CEPMEIP data (US EPA default factors for wet scrubbers are very high)
Natural gas 09 09 09 AP-42 filterable PM factor
Derived gases 5 5 5 CEPMEIP data worst case for derived gases
Heavy fuel oil
(1 S)
No control 25 18 13 Assumes 1 sulphur as specified in the EU sulphur content of liquid fuels Directive
FGD 15 15 15
Heavy fuel oil
(3 S)
No control 64 45 33 Assumes 3 sulphur (maximum permitted in EU countries)
FGD 38 38 37
Other liquid fuels LPG 20 20 20
Biomass FF 51 38 33 AP-42 wood waste
ESP 28 21 18
(4) Source R Stewart (2006) US EPA AP 42 (1996) CEPMEIP (2006)
1A1 Energy industries
EMEPEEA air pollutant emission inventory guidebook 2019 108
Table 82a Emission factors for combustion processes burning hard coal
Fuel NAPFUE NFR Codes Activity description Activity detail (5) Emission factor
gGJ-1 Notes (6)
Hard coal TSP PM10 PM25
Bituminous
coal 101 Various
Electricity plant CHP
plant
FGD ESP or FF lt 20 mgNm-3 (BAT) 6 6 5 CEPMEIP
ESP (or FF) lt 50 mgNm-3 (LCPD) 15 12 6 Scaled from CEPMEIP ESP factor
ESP lt 100 mgNm-3 (LCPD) 30 25 12
From CEPMEIP sub-bit coal lsquohigh
efficiency ESPrsquo TSP scaled to the EU LCP
Directive existing plant sub 100 MWth limit
ESP Oldconventional
lt 500 mg Nm-3 140 70 17 CEPMEIP
Large unit with multicyclone 100 60 35 CEPMEIP
Large unit uncontrolled or cyclone 500 250 100
CEPMEIP (NB such a high emission
concentration would apply to few if any
plant)
Sub-
bituminous
coal
103 Various Electricity plant CHP
plant heat plant
FGD ESP or FF lt 20 mgNm-3 (BAT) 6 6 5 CEPMEIP
ESP (or FF) lt 50 mgNm-3 (LCPD) 15 12 6 Scaled from CEPMEIP ESP factor
ESP lt 100 mgNm-3 (LCPD) 30 25 12
From CEPMEIP sub-bit coal lsquohigh
efficiency ESPrsquo TSP scaled to LCPD
existing plant sub 100 MWth limit
ESP oldconventional
lt 500 mgNm-3 140 70 17 CEPMEIP
Conventional large unit with
multicyclone 100 60 35 CEPMEIP
Conventional unit uncontrolled or
cyclone 500 250 100
CEPMEIP (NB such a high emission
concentration would apply to few if any
plant)
Coke 107
Coke is unlikely to be burned as primary
fuel when co-fired use the factor for the
principal fuel
(5) KEY FGD flue gas desulphurisation ESP electrostatic precipitator FF fabric filter BAT Best Available Techniques LCPD large combustion plant data
(6) Sources R Stewart (2006) US EPA AP-42 (1996) CEPMEIP (2006)
1A1 Energy industries
EMEPEEA air pollutant emission inventory guidebook 2019 109
Table 82b Emission factors for combustion processes burning brown coal
Fuel
NAPFUE NFR Code Activity description Activity detail Emission factor
ReferenceComments
TSP PM10 PM25
Brown coal 105 Various Electricity plant CHP
plant heat plant
FGD ESP or FF lt 20 mgNm-3 (BAT) 9 8 6 CEPMEIP
High efficiency ESP (or FF) 40 30 14
CEPMEIP (NB such a high emission
concentration would apply to few if any
plant)
Conventional large unit with
multicyclone 100 60 35
CEPMEIP (NB such a high emission
concentration would apply to few if any
plant)
Older ESP 160 80 20
CEPMEIP (NB such a high emission
concentration would apply to few if any
plant)
Older installation uncontrolled or
cyclone 500 250 100
CEPMEIP (NB such a high emission
concentration would apply to few if any
plant)
Peat 113 Various Electricity plant CHP
plant heat plant
BATnew LCPD modern end-of-
pipe abatement FGD ESP or FF
lt 30 mgNm3
9 8 6 CEPMEIP
Efficient abatement LCP larger
facility lt 50 mgNm3 20 15 10
TSP scaled from LCP emission limit of
50 mgNm-3
Efficient abatement LCP
lt 100 MWth lt 100 mgNm3 40 30 20
TSP scaled from LCP emission limit of
50 mgNm-3
Conventional technology 120 40 20 CEPMEIP
Conventional smaller
multicyclone 300 40 20 CEPMEIP
1A1 Energy industries
EMEPEEA air pollutant emission inventory guidebook 2019 110
Table 82c Emission factors for combustion processes burning other solid fuels
Fuel
NAPFUE NFR Code Activity description Activity detail Emission factor Reference
TSP PM10 PM25
Municipal
solid waste
114 Various Electricity plant CHP
plant heating plant
Effective emission control (BAT) 15 13 10
CEPMEIP (NB care should be taken using this
factor as waste burning is often controlled
under nationalinternational regulation to a
more stringent specification)
(Solid) Conventional emission control 100 70 55
CEPMEIP (uncontrolled optimised combustion)
(NB care should be taken using this factor as
waste burning is often controlled under
nationalinternational regulation to a more
stringent specification)
Industrial
Waste 115 Various
Electricity CHP
heating plant
Effective emission control (BAT) 15 13 10
CEPMEIP (NB care should be taken using this
factor as waste burning is often controlled
under nationalinternational regulation to a
more stringent specification)
Conventional emission control 100 70 55
CEPMEIP (uncontrolled optimised combustion)
(NB care should be taken using this factor as
waste burning is often controlled under
nationalinternational regulation to a more
stringent specification)
Table 82d Emission factors for combustion processes burning natural gas
Fuel (IPCC
Cat)
NAPFUE NFR Code Activity description Activity detail Emission factor Reference
TSP PM10 PM25
Natural gas 301 Various Electricity CHP and heating
plant
Burner with optimised combustion 01 01 01 CEPMEIP
Conventional installation 02 02 02 CEPMEIP
Conventional installation 09 09 09 USEPA AP-42 filterable PM (all PM stated to
be PM1 )
1A1 Energy industries
EMEPEEA air pollutant emission inventory guidebook 2019 111
Table 82e Emission factors for combustion of derived gases
Fuel
(IPCC Cat) NAPFUE NFR Code Activity description Activity detail Emission factor
Reference
TSP PM10 PM25
Gas works
gas 311 Various
Electricity CHP and
heating plant
Clean fuel efficient combustion 01 01 01 CEPMEIP
Clean fuel conventional
installation 02 02 02
CEPMEIP (conventional
installation)
Conventional installation 5 5 5 CEPMEIP (NB high PM due
to fuel quality)
Other
gaseous fuel 314 Various
Electricity CHP and
heating plant
Clean fuel efficient combustion 01 01 01 CEPMEIP
Conventional installation 5 5 5
CEPMEIP
Coke oven
gas 304 Various
Electricity CHP
heating plant coke
ovens
Clean fuel efficient combustion 01 01 01 CEPMEIP
Clean fuel conventional
installation 02 02 02
CEPMEIP (conventional
installation)
Conventional installation 5 5 5 CEPMEIP
Blast furnace
gas 305 Various
Electricity CHP and
heating plant coke
ovens
Clean fuel efficient combustion 01 01 01 CEPMEIP
Clean fuel conventional
installation 02 02 02
CEPMEIP (conventional
installation)
Conventional installation 5 5 5 CEPMEIP
1A1 Energy industries
EMEPEEA air pollutant emission inventory guidebook 2019 112
Table 82f Emission factors for combustion of heavy fuel oil
Fuel
(IPCC Cat) NAPFUE NFR Code Activity description Activity detail Emission factor
Reference
TSP PM10 PM25
Residual fuel
oil 203 Various
Electricity CHP and
heating plant
Low S fuel with optimised
burner or abatement 3 3 25
CEPMEIP (equivalent to about 10 mgNm3 or
BAT)
Low S fuel efficient
combustion 14 12 10
CEPMEIP about 50 mgNm3 (EU LCPD limit
for existing plant)
Low-medium S fuel
conventional installation 20 15 9
CEPMEIP (equivalent to about 70mgNm3
Low-medium S fuel
conventional installation 60 50 40
CEPMEIP the higher of two entries used
about 200 mgNm3
High S fuel 210 190 130
CEPMEIP the lower of two entries for high S
used (NB such a high emission
concentration 750 mgNm3 would apply to
few if any plant)
Petroleum
coke 110 1A1b Oil refineries Conventional multicyclone 100 60 35
CEPMEIP NB the factor is very high
compared to the EU LCP Directive ELVs and
BAT for large furnaces Bit coal factors more
appropriate
1A1 Energy industries
EMEPEEA air pollutant emission inventory guidebook 2019 113
Table 82g Emission factors for combustion of other liquid fuels
Fuel
(IPCC Cat) NAPFUE NFR Code Activity description Activity detail Emission factor
Reference
TSP PM10 PM25
Gasdiesel oil 205 Various Electricity CHP
heating plant
Optimised burner 2 2 2 CEPMEIP
Conventional burner 5 5 5 CEPMEIP
Naphtha 210 1A1b Oil refineries All units 5 5 5 CEPMEIP
Liquefied
petroleum gas 303 Various
Electricity CHP
heating plant
Optimised burner 01 01 01 CEPMEIP
Conventional burner 5 5 5 CEPMEIP
Refinery gas 308 Various Electricity CHP
heating plant
Optimised burner 01 01 01 CEPMEIP
Conventional burner 5 5 5 CEPMEIP
Other oil 224 Various Electricity CHP
heating plant
Low S fuel optimised burner 3 3 25 CEPMEIP
Low S fuel efficient combustion 14 12 10 CEPMEIP for residual oil About 50 mgNm3
(LCPD limit for existing plant)
Low-medium S fuel conventional
installation 20 15 9
CEPMEIP (equivalent to about 70 mgNm3
Low-medium S fuel conventional
installation 60 50 40
CEPMEIP (highest of similar entries with
TSP of 35 40 50 and 60 used About
200 mgNm-3)
High S fuel 210 190 130
CEPMEIP lower of two entries for high S
used (NB this is a very high emission
concentration ~750 mgNm3)
1A1 Energy industries
EMEPEEA air pollutant emission inventory guidebook 2019 114
Table 82h Emission factors for combustion of biomass
Fuel
(IPCC Cat) NAPFUE NFR Code Activity description Activity detail Emission factor
Reference
TSP PM10 PM25
Wood 111 Various Electricity CHP
heating plant
Modern BAT unit
lt 20 mgNm3 TSP 7 7 6
TSP scaled from BAT benchmark fractions
applied based on bit coal
Older unit lt 100 mgNm3 TSP 35 25 12 TSP scaled from emission concentration
fractions based on bit coal
Uncontrolled conventional 100 70 55 CEPMEIP (equivalent to an uncontrolled
multicyclone)
Charcoal 112 1A2c Chemicals Conventional large unit with
multicyclone 100 60 35
CEPMEIP (NB the use of charcoal in LCP is
likely to be rare
Black liquour 215 1A2f Textile and leather
(pulp and paper ) Conventional installation 160 150 150
CEPMEIP (NB such a high emission
concentration would apply to few if any
plant)
Biogas 309 Various Electricity CHP
Heating plant
Modern optimised large
installation 3 3 25
CEPMEIP (cleaned fuel)
Conventional burner 5 5 5 CEPMEIP
Modern optimised 20 15 10 CEPMEIP (gasification plant) seems high
for gaseous fuel
Conventional installation 160 150 150
CEPMEIP (NB such a high emission
concentration would apply to few if any
plant)
1A1 Energy industries
EMEPEEA air pollutant emission inventory guidebook 2016 115
Chapter B111(S3)PMv3
Default emission factors for use with simpler methodology (Tier 1)
Fuel Technology Emission factor gGJ-1 Notes
TSP PM10 PM25
Hard coal - - - Not applicable
Brown coal - - - Not applicable
Other solid fuels - - - Not applicable
Natural gas Gas turbines 09 09 09 US EPA
Spark ignition 18 18 18 US EPA 2-stroke lean burn 4-stroke lean burn is 004 gGJ-1
Derived gases Gas turbine 11 11 11 Based on US EPA landfill gas
Heavy fuel oil Diesel 28 23 22 US EPA factor for diesel engines
Other liquid fuels Gas turbine 20 20 20 US EPA factor for PM applied to other fractions
Diesel 28 23 22 US EPA
Biomass Gas turbine 11 11 11 Landfill gas
Gas turbine 57 57 57 Anaerobic digester gas
Table 92a Emission factors for gas turbines combustion processes
Fuel
NAPFUE NFR Codes Activity description Activity detail Emission factor gGJ-1 Notes
TSP PM10 PM25
Natural gas 09 09 09 Sierra (234 tests) assumed all
PM25
Gas oil 3 3 3 Sierra (15 tests) assumed all
PM25
1A1 Energy industries
EMEPEEA air pollutant emission inventory guidebook 2016 116
Table 92b Emission factors for compression ignition combustion processes
Fuel
(IPCC Cat) NAPFUE NFR Code Activity description Activity detail
Emission factor
gGJ-1
ReferenceComments
TSP PM10 PM25
Natural gas Dual fuel engine gas with HFO 11 11 11 LCP BREF assumed all PM25
Heavy fuel oil
Diesel engine 50 41 39 LCP BREF lsquoBATrsquo US EPA profile applied
Diesel engine lt 64 53 50 LCP BREF US EPA profile applied applicable to
older equipment
Gas oil
Diesel engine lt 002 S lt 26 21 20 LCP BREF US EPA profile
Diesel engine lt 17 14 14 Smaller unit with diesel particulate filter US EPA
profile

1A1 Energy industries
EMEPEEA air pollutant emission inventory guidebook 2019 2
Contents
1 Overview 3
2 Description of sources 4
21 1A1a Public electricity and heat production 4
22 1A1b Petroleum refining 5
23 1A1c Manufacture of solid fuel and other energy industries 6
3 1A1a Public electricity and heat production 7
31 Techniques 7
32 Emissions 8
33 Controls 11
34 Methods 12
4 1A1b Petroleum refining 38
41 Techniques 38
42 Emissions 38
43 Controls 40
44 Methods 40
5 1A1c Manufacture of solid fuels and other energy industries 53
51 Techniques 53
52 Emissions 53
53 Controls 53
54 Methods 54
6 Data quality 60
61 Completeness 60
62 Avoiding double counting with other sectors 60
63 Verification 60
64 Developing a consistent time series and recalculation 63
65 Uncertainty assessment 63
66 Inventory quality assurancequality control QAQC 64
67 Mapping 64
68 Reporting and documentation 64
7 Glossary 65
8 References 66
9 Point of enquiry 69
Annex A Summary of combustion plant and NFR codes 70
Annex B Further details on emissions and controls 72
Annex C Sulphur content in fuels 80
Annex D Emission factors derived from emission limit values 81
Annex E Calculation of emission factors from concentrations 85
Annex F Emission factors from older versions of the Guidebook 91
1A1 Energy industries
EMEPEEA air pollutant emission inventory guidebook 2019 3
1 Overview
This chapter describes the methods and data needed to estimate emissions from NFR Sector 1A1
Energy industries The activity covers combustion and conversion of fuels to produce energy for
example electricity or heat from point sources
1A1a mdash Public electricity and heat production
1A1b mdash Petroleum refining
1A1c mdash Manufacture of solid fuels
The information provided in this chapter is also appropriate for assessing stationary combustion
emissions within other NFR categories (for example industrial combustion mdash 1A2) Smaller scale
combustion (generally lt 50 MWth) is considered in Chapter 1A4
Emissions arising from storage and transport of fuels combustion residues abatement feedstock
and abatement residues are not included these are in the fugitive emission NFR code 1B Guidance
for estimating emissions from waste combustion processes is not included here (see the separate
chapters concerning waste combustion mdash 6Ca 6Cb 6Cc and 6Ce) However if there is heat
recovery or power generation in the incineration process the emission should be reported under
the appropriate 1A1 activity
The range of activities relevant to Chapter 1A is summarised in Section 2 below information on
sectors which include combustion activities is provided in Appendix A
The most important pollutants emitted to the atmosphere from the activities are summarised in
Table 1-1
Table 1-1 Pollutants with potential for 1A1 combustion activities to be a key category
Source releases Substance
Activity PM
(To
tal su
spe
nd
ed
pa
rticula
tes
(TS
P))
PM
10
PM
25
Oxid
es o
f sulp
hu
r
Oxid
es o
f nitro
ge
n
Oxid
es o
f carb
on
Hyd
rog
en
chlo
ride
fluo
ride
Vo
latile
org
an
ic com
po
un
ds
Me
tals (e
xclu
din
g m
ercu
ry a
nd
cad
miu
m) a
nd
the
ir com
po
un
ds
Me
rcury
Ca
dm
ium
PA
H
Dio
xin
s PC
B H
CB
Am
mo
nia
Hyd
rog
en
sulp
hid
e
Bla
ck C
arb
on
Boilers and
furnaces
X X X X X X X X X X X X X
Gas turbine X X X X X X X X
CI engine X X X X X X X X X X X
Refinery
activities
X X X X X X X X X X X X X
Coke ovens X X X X X X X X X X X X X X
1A1 Energy industries
EMEPEEA air pollutant emission inventory guidebook 2019 4
2 Description of sources
21 1A1a Public electricity and heat production
This activity covers emissions from combustion plant as point sources In general this activity
addresses emission from larger combustion appliance (gt 50 MWth) Within the European Union
different criteria are applied for the reporting of emissions from combustion plants according to the
Industrial Emissions Directive - IED - 201075EC) [EC-IED 2010]
The emissions considered in this activity are released by a controlled combustion process (boiler
emissions furnace emissions emissions from gas turbines or stationary engines) and are mainly
characterised by the types of fuels used Furthermore a characterisation of the combustion sources
may be developed according to the size and type of plants as well as from primary or secondary
reduction measures For example solid liquid or gaseous fuels are used and there are a range of
emission abatement measures (for example PM SO2 and NOx control)
Emissions from autoproducers (public or private undertakings that generate electricityheat wholly
or partly for their own use as an activity that supports their primary activity) should be assigned to
the sector where they were generated and not under 1A1a
With the complexity of plant activities and inter-relationships there may not always be a clear
separation between autoproducers and main activity producers The most important issue is that all
facilities be accounted under the most appropriate category and in a complete and consistent
manner For more information on autoproducers please refer to IPCC 2006 Guidelines [IPCC 2006]
wwwipcc-nggipigesorjppublic2006glindexhtm
A number of process schemes can be applied for the activities depending on the specific application
typical process schemes are provided in Figure 2-1 Figure 2-2 and Figure 2-3
Figure 2-1 Process scheme for heat plant adapted from IPCC Figure 22 in the energy
industries chapter
Fugitive
Emissions
Chapter 1B1
NMVOC PM10
CombustionFuel Heat
1A1 Energy industries
EMEPEEA air pollutant emission inventory guidebook 2019 5
Figure 2-2 Process scheme for power plant adapted from IPCC Figure 22 in the energy
industries chapter
Figure 2-3 Process scheme for combined power and heat plant adapted from IPCC
Figure 22 in the energy industries chapter
22 1A1b Petroleum refining
This activity covers emissions released from production and combustion processes within a refinery
Combustion processes include the heating of crude and petroleum products without contact
between flame and products Combustion activities are generally similar to the activities described
in 1A1a but include fuels such as refinery gas Production processes such as thermal cracking and
catalyst regenerator units as well as venting flaring and fugitive emissions are covered in Chapters
relating to 1B2
Fugitive
Emissions
Chapter 1B1
NMVOC PM10
CombustionFuel Generator Electricity
Fugitive
Emissions
Chapter 1B1
NMVOC PM10
CombustionFuel GeneratorElectricity
Heat
1A1 Energy industries
EMEPEEA air pollutant emission inventory guidebook 2019 6
Figure 2-4 Process scheme for petroleum refinery adapted from IPCC Figure 23 in the
energy industries chapter
23 1A1c Manufacture of solid fuel and other energy industries
Note that extraction of coal and initial treatment is covered in Chapter 1B Under 1A1c the activity
covers coke production and emissions associated with combustion in the coke oven Fugitive
emissions from (for example) extinction (quenching) and door leakage is covered in Chapter 1B
Most coke production is associated with iron and steel production
Figure 2-5 Process scheme for coke ovens adapted from IPCC Figure 23 in the energy
industries chapter
Fugitive and
Process
Emissions
Chapter 1B2
ProcessCrude Oil Product
Fugitive and
Extinction
Emissions
Chapter 1B1 PAH
NMVOC PM H2S
NH3
ProcessCoal Product
Fugitive and
Extinction
Emissions
Chapter 1B1 PAH
NMVOC PM H2S
NH3
ProcessCoal Product
1A1 Energy industries
EMEPEEA air pollutant emission inventory guidebook 2019 7
3 1A1a Public electricity and heat
production
31 Techniques
Details of technologies used in this activity for combustion of solid liquid and gaseous fuels can be
found within the Best Available Techniques Reference Note (BREF) for energy installations [European
Integrated Pollution Prevention and Control Bureau (EIPPCB) 2015 ] and the US Environmental
Protection Agency (USEPA) emission factor handbook (USEPA AP-42) In general the size of an
installation under this NFR category will exceed 50 MWth guidance on estimating emissions from
smaller appliances can be found within Chapter 1A4
Some general details on technologies are provided here but despite the comparatively small number
of installations there is a wide range of fuel types combustion technologies and abatement
technologies in use
311 Combustion of coal and other solid mineral fuels
Coal is largely burnt as a pulverised fuel with corner (tangential) wall or downfired furnaces The dry
bottom boiler (DBB) has typical combustion temperatures of 900 up to 1 200 degC leading to dry ash
discharge from the combustion chamber due to combustion temperatures from This type of boiler
is mainly used for the combustion of hard coal and brown coallignite and is applied all over Europe
The wet bottom boiler (WBB) has typical combustion temperatures exceeding 1 400 degC which leads
to a liquid slag discharge from the combustion chamber This type of boiler is used for hard coal with
a low content of volatiles and is mainly applied in Germany
In fluidised bed combustion (FBC) the combustion of fuel takes place by injection of combustion air
through the bottom of the boiler into a turbulent bed The typical relatively low emissions are
achieved by air staging limestone addition and low combustion temperatures of about 750ndash950 degC
FBC is in particular adapted to coals rich in ash Only few large combustion plants are equipped with
the FBC technique in the category of thermal capacities 300 MW mostly circulating fluidised bed
combustion (CFBC) is installed Other types of furnace include grate firing (GF) technologies but
these tend to be comparatively small units
312 Combustion of biomass
The combustion of biomass (straw wood landfill gas etc) is increasingly relevant for countries to
meet the drive for renewable or sustainable energy sources Co-firing is undertaken with other fuels
in many types of combustion plant but plants burning only biomass tend to use FBC (mostly CFBC)
and grate-firing (GF) technologies
313 Combustion of peat
The combustion of peat is relevant for several countries and is generally undertaken using milled
peat in FBC in modern facilities but other technologies do exist
1A1 Energy industries
EMEPEEA air pollutant emission inventory guidebook 2019 8
314 Combustion of gas and oil
31411 Boilers and furnaces
The technologies in use range from comparatively small package firetube boilers (capacities up to
about 20 MWth) to large water tube boilers of up to about 2 000 MWth capacity
31412 Gas turbines
Gas turbines are installed with a thermal capacity ranging from several hundred kW up to about
1 000 MWth Gaseous fuels are mainly used such as natural gas or in some instances process gases
or gasification products Liquid fuels are used such as light distillates (eg naphtha kerosene or gas
oil) but in general use of liquid fuels is limited to specific applications or as a standby fuel
Gas turbines are aero-derivative designs (ie based on multiple shaft engines derived from aircraft
engine types) or industrial heavy-duty gas turbines (based on single shaft designs) Gas turbines for
electricity generation can be open (simple) cycle units but are often installed as a part of a combined
cycle gas turbine (CCGT) In a CCGT installation a heat recovery steam generator (HRSG) is used to
recover waste heat from the combustion gases providing steam to power a steam turbine which
drives an alternator providing more electricity The net rated efficiency of a modern CCGT is in excess
of 50
Gas turbines are often found in co-generation plant the gas turbine directly coupled to an electricity
generator and the energy from hot exhaust gases recovered in a suitable HRSG (boiler) or used
directly (for example drying) Supplementary burners are commonly used to provide additional heat
input to the exhaust gases
Integrated coal gasification combined cycle gas turbine (IGCC) plants use fuel gas derived from coal
Note that for IGCC plants the only emission relevant unit considered here is the gas turbine
31413 Stationary engines
Stationary engines are spark-ignition engines and compression-ignition engines (2- and 4-stroke)
with electrical outputs ranging from less than 100 kW to over 20 MW Both types represent relevant
emission sources Such units are common as island generators (away from a supply grid) small
combined heat and power CHP units or for cogeneration and standby or emergency uses
32 Emissions
The contributions of point source emissions released by combustion plants to the total emissions
reported by countries to the Convention on Long-Range Transboundary Air Pollution (CLRTAP) can
be found in the emission databases hosted by the EMEP Centre on Emission Inventories and
projections (1)
The main pollutants are described below with further details provided (from the previous Guidebook
chapter) in Appendix B
Note that the inventory methodologies for Greenhouse gas emissions (carbon dioxide methame
and nitrous oxide) are not included ndash refer to IPCC guidance [IPCC 2006]
(1) Available here httpwwwceipat
1A1 Energy industries
EMEPEEA air pollutant emission inventory guidebook 2019 9
32111 Sulphur oxides
In the absence of flue gas desulphurisation (FGD) technology the emissions of sulphur oxides (SOx)
are directly related to the sulphur content of the fuel The sulphur content of refined natural gas is
negligible The majority of SOx is sulphur dioxide (SO2) although small proportions of sulphur trioxide
(SO3) can arise
32112 Nitrogen oxides
Emissions of nitrogen oxides (nitric oxide and nitrogen dioxide mdash NOx) arise from nitrogen in the
fuel (mainly relevant to solid and liquid fuels) and from reaction of atmospheric nitrogen
Combustion control can provide a high degree of NOx emission control (low NOx burner technology)
and this may be supplemented by use of selective catalytic reduction (SCR) or selective non-catalytic
reduction techniques (SNCR)
32113 Non-methane volatile organic compounds (NMVOC)
Emissions of non-methane volatile organic compounds (NMVOC) eg olefins ketones aldehydes
result from incomplete combustion Furthermore unreacted fuel compounds such as ethane (C2H6)
can be emitted The relevance of NMVOC and CH4 emissions from boilers which are often reported
together as VOC is very low for large-sized combustion plants VOC emissions tend to decrease as
the plant size increases (Rentz et al 1993)
32114 Carbon monoxide (CO)
Carbon monoxide (CO) appears always as an intermediate product of the combustion process and
in particular under sub-stoichiometric combustion conditions However the relevance of CO
released from combustion plants is not very high compared to CO2 The formation mechanisms of
CO and VOC are similarly influenced by combustion conditions Substantial emissions of CO can
occur if combustion conditions are poor
32115 Ammonia (NH3)
Emissions of ammonia (NH3) are not generally associated with a combustion process emissions can
result from incomplete reaction of NH3 additive in NOx abatement systems mdash selective catalytic and
non-catalytic reduction (SCR and SNCR)
32116 Particulate matter
Particulate matter (PM) emissions from large combustion installations (gt 50 MW) burning solid fuels
are often lower than emissions from smaller plants (per unit of energy input) the physical and
chemical characteristics of the PM also differ This is because different combustion and abatement
techniques are applied
Combustion of fuels can generate solid residues which may be deposited within combustion
chambers (furnace bottom ash) within the furnace boiler surfaces or ducting (fly ash) or on heat
exchanger surfaces (soot and fly ash) Coal and other fuels with significant ash content have the
highest potential to emit PM Suspended ash material in exhaust gases may be retained by
particulate abatement or other emission abatement equipment (abatement residues) Material
which remains in the flue gases beyond the abatement equipment and passes to the atmosphere is
primary PM Secondary PM is formed by chemical and physical processes after discharge to
atmosphere and is NOT considered here
1A1 Energy industries
EMEPEEA air pollutant emission inventory guidebook 2019 10
A number of factors influence the measurement and determination of primary PM emissions from
activities and the quantity of PM determined in an emission measurement depends to a large extent
on the measurement conditions This is particularly true of activities involving high temperature and
semi-volatile emission components ndash in such instances the PM emission may be partitioned between
a solidaerosol phase and material which is gaseous at the sampling point but which can condense
in the atmosphere The proportion of filterable and condensable material will vary depending on the
temperature of the flue gases and in sampling equipment
A range of filterable PM measurement methods are applied around the world typically with filter
temperatures of 70-160degC (the temperature is set by the test method) Condensable fractions can
be determined directly by recovering condensed material from chilled impinger systems
downstream of a filter ndash note that this is condensation without dilution and can require additional
processing to remove sampling artefacts Another approach for total PM includes dilution where
sampled flue or exhaust gases are mixed with ambient air (either using a dilution tunnel or dilution
sampling systems) and the filterable and condensable components are collected on a filter at lower
temperatures (but depending on the method this can be 15-52degC) The use of dilution methods
however may be limited due to practical constraints with weight andor size of the equipment
The PM emission factors (for TSP PM10 and PM25) can represent the total primary PM emission or
the filterable PM fraction The basis of the emission factor is described (see individual emission
factor tables)
32117 Black carbon (BC)
Combustion of fossil fuel and biomass is the main source of black carbon (BC) emission (Diehl et al
2012) Black carbon is the term for a wide range of carbon containing compounds but is determined
by assessment of the optical properties of collected particulate matter It covers large polycyclic
species charred plants to highly graphitized soot Other commonly used classifications include
elemental carbon (EC) and organic carbon (OC) which refer to carbon species that have been
classified chemically EC and OC are always co-emitted but in different proportions dependent upon
the fuel properties and the combustion conditions
Using these classifications BC and EC (as the more light absorbing refractory species) are often
treated as equal In reality there may be small differences in the PM fraction of BC and EC resulting
from the different classification techniques used Black Carbon was selected as the term identified
within the Gothenburg Protocol with the requirement that Parties develop emission inventories and
projections for BC and it is proposed that a similar requirement be included under the new NECD
As such in this guidebook emission factors are presented as BC
Literature values of emission factors for BC are often derived by thermal chemical techniques
representative of EC It is therefore important for inventory compilers to understand that the tier 1
BC emission factors presented in this guidance are assumed to be equal to the emission factors for
EC and therefore some uncertainty is introduced Where possible appendices of full carbon
speciation are provided for key sources Country-specific (higher tier) methods will be preferable
where this is feasible
The same emission control techniques that limit the emission of PM will also reduce the emission of
BC However measurement data that address the abatement efficiencies for BC are limited This
means that in general it is assumed that the BC emission can be reduced proportionally to the
filterable PM emission and in particular PM25 emission Consequently for inventory development
the BC emission factors are expressed as percentage of the PM25 emission It must be noted that
1A1 Energy industries
EMEPEEA air pollutant emission inventory guidebook 2019 11
measurement of BC emissions is not a standardised technique and that particle number or surface
area may be relevant metrics However the approach adopted in the present chapter is to develop
a mass inventory based on the PM25 inventory
32118 Metals
Most of the heavy metals considered (As Cd Cr Cu Hg Ni Pb Se Zn and V) are normally released
as compounds (eg oxides chlorides) in association with particulates Only Hg and Se are at least
partly present in the vapour phase The content of heavy metals in coal is normally several orders of
magnitude higher than in oil (except occasionally for Ni and V in heavy fuel oil) and in natural gas
For natural gas emissions of mercury and arsenic are relevant During the combustion of coal
particles undergo complex changes which lead to vaporisation of volatile elements The rate of
volatilisation of heavy metal compounds depends on fuel characteristics (eg concentrations in coal
fraction of inorganic components such as calcium) and on technology characteristics (eg type of
boiler operation mode)
33 Controls
Details of relevant abatement technologies for combustion plant are described in the BREF note for
large combustion plant ( httpeippcbjrceceuropaeureference) some further detail on NOx and
SO2 emission controls are also provided in Appendix B Relevant abatement technologies for
selected pollutants are outlined below
331 Sulphur oxides
There are in-furnace technologies which incorporate injection of an absorbent material (typically
lime) into the furnace Use of such systems is quite common in FBC where the lime can be added to
the bed and high recirculation is possible
Post combustion flue gas desulphurisation (FGD) processes are more common and are designed to
remove SO2 from the flue gas of combustion installations Most processes like the wet scrubbing
process (WS) the spray dryer absorption (SDA) the dry sorbent injection (DSI) and the Walther
process (WAP) are based on the reaction of the SO2 with an alkaline agent added as solid or as
suspensionsolution of the agent in water to form the respective salts In secondary reactions SO3
fluorides and chlorides are also removed In the case of some processes the SO2 is recovered as
sulphur or sulphuric acid Use of FGD processes can also reduce particulate and metal emissions
The most common technologies are described below
33111 Limelimestone wet scrubbing (WS)
The pollutants are removed from the flue gas by chemical reactions with alkaline slurry (suspension
of calcium compounds in water) The main product is gypsum The WS process represents the main
technology used by FGD-equipped electrical capacity installed in European Organisation for
Economic Co-operation and Development (OECD) countries Facilities are in operation at combustion
units using hard coal lignite and oil with sulphur contents from about 08 to more than 30 wt The
SO2 reduction efficiency is gt 90
1A1 Energy industries
EMEPEEA air pollutant emission inventory guidebook 2019 12
33112 Spray dryer (semi-dry) absorption (SDA)
The SDA process removes the pollutant components from flue gas of fossil-fired combustion units
by injection of Ca(OH)2 slurry The process forms a dry by-product requiring downstream collection
of PM The SO2 reduction efficiency is gt 90
33113 Dry sorbent injection (DSI)
The DSI process is based on a gassolid reaction of the flue gas and a dry sorbent (typically lime but
sodium hydrogen carbonate NaHCO3 is used in some smaller applications)
332 Nitrogen oxides
33211 Primary measures
Primary measures minimise formation of NOx in the furnace or combustion chamber and include
low-NOx burners (LNB) staged air supply flue gas recirculation overfire air reburn watersteam
injection and related technology These measures can be retrofitted to existing boilers to achieve
varying degrees of NOx reduction Modern gas turbines can achieve very low NOx emissions by
application of dry low NOx (DLN) burner technology without secondary measures
33212 Secondary measures mdash DeNOx processes
The principal abatement measures are selective non-catalytic reduction (SNCR) and selective
catalytic reduction (SCR) The reduction of nitrogen oxides in the flue gas is based on the selective
reaction of NOx The SNCR process involves injection of ammonia or urea near the furnace Emission
reduction with SNCR can be limited (up to 50 ) and is lower than with SCR An SCR system is based
on selective reactions with injected additives in the presence of a catalyst The additives used are
mostly ammonia (gaseous and in solution) but also urea The NOx reduction efficiency can be
between 70 and 90
333 Particulate matter
The main technology in use is electrostatic precipitation (EP) however fabric filters (FF) are also used
Removal of particulate also reduces emissions of most heavy metals as these are mainly in the
particulate phase Both modern EP and FF can represent Best Available Techniques (BAT) but note
that EP performance can vary widely between older and modern equipment FGD can also be an
effective PM abatement device DSI and SDA systems often incorporate FF for sorbent and PM
removal Wet scrubbing systems can also achieve BAT achievable emission levels for PM
Multicyclone devices can be found on smaller older combustion units or as an initial treatment
stage
34 Methods
341 Choice of method
Figure 3-1 presents the procedure to select the methods for estimating process emissions from
combustion in energy and transformation industries The basic concept is
if detailed information is available use it
if the source category is a key source a Tier 2 or better method must be applied and detailed
input data must be collected The decision tree directs the user in such cases to the Tier 2
method since it is expected that it is easier to obtain the necessary input data for this approach
1A1 Energy industries
EMEPEEA air pollutant emission inventory guidebook 2019 13
than to collect facility-level data needed for a Tier 3 estimate However the inventory compiler
should be aware that because the number of sources may be comparatively small in many
instances the data required for a Tier 3 approach may be only a little more difficult to obtain
than at Tier 2
detailed process modelling is not explicitly included in this decision tree However detailed
modelling will usually be done at facility level and results of such modelling could be seen as
lsquofacility datarsquo (Tier 3) in the decision tree
Figure 3-1 Decision tree for combustion in energy transformation industries
Start
Are all single
sources in the source
category Measured
reported
Use Tier 3
Facility data
only
Is a detailed
estimation model
available
Use Tier 2
technology specific
activity data
and EFs
Key source
Get
technology stratified
activity data
and EFs
Apply Tier 1
default EFs
Yes
Yes
Yes
Yes
No
No
Is specific fuel
use data available
for the source
Use measurements Tier
3 approach and
combine with country
specific EFs from Tier 2
Can modelled fuel
consumption be reconciled
with national fuel statistics
from independent
sources
Use model Tier 3
approach
No
No
No
Yes
1A1 Energy industries
EMEPEEA air pollutant emission inventory guidebook 2019 14
342 Tier 1 default approach
3421 Algorithm
The Tier 1 approach for process emissions from combustion uses the general equation
pollutantptionfuelconsumpollutant EFARE (1)
Epollutant annual emission of pollutant
EFpollutant emission factor of pollutant
ARfuel consumption activity rate by fuel consumption
This equation is applied at the national level using annual national total fuel use (disaggregated by
fuel type) Information on fuel consumption suitable for estimating emissions using the simpler
estimation methodology is widely available from UN statistical yearbooks or national statistics
The Tier 1 emission factors assume an average or typical technology and abatement
implementation
In cases where specific combustion technology and abatement techniques are to be taken into
account a Tier 1 method is not applicable and a Tier 2 or Tier 3 approach must be used Some
further detail on NOx and SO2 emission controls and abatement efficiency are provided in
Appendix B
3422 Default Tier 1 emission factors (EF)
The Tier 1 default emission factors derived from available data and information have been
developed for key fuel groups (Table 3-1) and are given in Table 3-2 to Table 3-7
Table 3-1 Tier 1 fuel classifications
Tier 1 Fuel type Associated fuel types
Hard coal Coking coal other bituminous coal sub-bituminous coal coke manufactured
lsquopatentrsquo fuel
Brown coal Lignite oil shale manufactured lsquopatentrsquo fuel peat
Gaseous fuels Natural gas natural gas liquids liquefied petroleum gas refinery gas (EFs for
refinery gas are available in section 42) gas works gas coke oven gas blast
furnace gas
Heavy fuel oil Residual fuel oil refinery feedstock petroleum coke orimulsion bitumen
Light oil Gas oil kerosene naphtha shale oil
Biomass Wood charcoal vegetable (agricultural) waste
Note The associated fuel types indicated in Table 3-2 are based on the emission characteristics and are not to
be used for categorising fuels into the main fuel groups (solid liquid gaseous biomass) used for reporting
The emission factors provided in Table 3-2 to Table 3-7 have been derived from available materials
taking into account the results of an assessment of emission factors included in previous versions
of the Guidebook and elsewhere including the newer information from the BREF document on Best
Available Techniques in Large Combustion Plants (European Commission 2006) The emission
factors are grouped by major fuel types In the absence of detail on types and relative use of types
1A1 Energy industries
EMEPEEA air pollutant emission inventory guidebook 2019 15
of combustion or abatement technology which will be different for each country the proposed
factors represent a mean for the range of technologies in use with the 95 figures a measure of the
range of emissions in the sector The factors will represent a very wide range of combustion
technologies and emissions they do not represent BAT or unabated emissions
Note that NOx emission factors are expressed as NO2 and that PCDDF emission factors are
presented as I-TEQ (NATO) toxic equivalents
Emission factors for sulphur oxides are provided in the Tier 1 tables but these assume no SO2
abatement and a defined fuel sulphur content Where countries have no FGD and have knowledge
of fuel sulphur content then it is recommended that a sulphur oxides emission factor is calculated
from fuel sulphur content assuming 100 conversion to SO2 and no retention in ash
EF SO2 = [S] x 20000 CVNet
where
EF SO2 is the SO2 emission factor (gGJ)
[S] is sulphur content of the fuel ( ww)
CVNet is fuel CV (GJtonne net basis)
For emission factors for the combustion of waste please refer to Chapters 6Ca 6Cb and 6Cc
depending on the type of waste that is being combusted
The BC emission factors presented in this Guidance are derived on the basis of EC and it is therefore
assumed that BC=EC
Table 3-2 Tier 1 emission factors for source category 1A1a using hard coal
Tier 1 default emission factors
Code Name
NFR Source Category 1A1a Public electricity and heat production
Fuel Hard Coal
Not applicable
Not estimated NH3
Pollutant Value Unit 95 confidence
interval
Reference
Lower Upper
NOx 209 gGJ 200 350 US EPA (1998) chapter 11
CO 87 gGJ 615 15 US EPA (1998) chapter 11
NMVOC 10 gGJ 06 24 US EPA (1998) chapter 11
SOx 820 gGJ 330 5000 See Note
TSP 114 gGJ 3 300 US EPA (1998) chapter 11
PM10 77 gGJ 2 200 US EPA (1998) chapter 11
PM25 34 gGJ 09 90 US EPA (1998) chapter 11
BC 22 of PM25 027 808 See Note
Pb 73 mgGJ 516 12 US EPA (1998) chapter 11
Cd 09 mgGJ 0627 146 US EPA (1998) chapter 11
Hg 14 mgGJ 102 238 US EPA (1998) chapter 11
As 71 mgGJ 504 118 US EPA (1998) chapter 11
Cr 45 mgGJ 32 746 US EPA (1998) chapter 11
Cu 78 mgGJ 0233 155 Expert judgement derived
from EMEPEEA (2006)
Ni 49 mgGJ 344 803 US EPA (1998) chapter 11
Se 23 mgGJ 16 373 US EPA (1998) chapter 11
1A1 Energy industries
EMEPEEA air pollutant emission inventory guidebook 2019 16
Zn 19 mgGJ 775 155 Expert judgement derived
from EMEPEEA (2006)
PCB 33 ng WHO-
TEGGJ
11 99 Grochowalski amp
Konieczyński 2008
PCDDF 10 ng I-
TEQGJ
5 15 UNEP (2005) Coal fired
power boilers
Benzo(a)pyrene 07 microgGJ 0245 221 US EPA (1998) chapter 11
Benzo(b)fluoranthene 37 microgGJ 37 370 Wenborn et al 1999
Benzo(k)fluoranthene 29 microgGJ 29 290 Wenborn et al 1999
Indeno(123-cd)pyrene 11 microgGJ 0591 236 US EPA (1998) chapter 11
HCB 67 microgGJ 22 201 Grochowalski amp
Konieczyński 2008
Notes
The default tier 1 emission factors are based on the tier 2 emission factors for dry bottom boilers For conversion
of the US EPA data the heating value as provided in the reference has been used (26 MMBTUton) This has been
converted to NCV using a factor of 095 Furthermore units have been converted using 10550559 JBTU and
45359237 glb
The EFs for benzo(b)fluoranthene and benzo(k)fluoranthene are converted using the average NCV for other
bituminous coal of 241 GJton from Energy Statistics Manual (OECDIEA 2005)
The factor for SOx assumes no SO2 abatement and is based on 1 mass sulphur content using EF calculation
from subsection 3422 of the present chapter 95 confidence intervals calculated using range from Table C-1
in Appendix C
The BC share is derived as the average of data from Henry amp Knapp (1980) Olmez et al (1988) Watson et al
(2001) Fisher et al (1979) Griest amp Tomkins (1984) Engelbrecht et al (2002) Chow et al (2004) and Speciate (US
EPA 2011)
The TSP PM10 and PM25 emission factors represent filterable PM emissions and are based on an ash content of
82 Note that condensable PM emission factors are also provided in US EPA (1998) Chapter 11
Table 3-3 Tier 1 emission factors for source category 1A1a using brown coal
Tier 1 default emission factors
Code Name
NFR Source Category 1A1a Public electricity and heat production
Fuel Brown Coal
Not applicable
Not estimated NH3 PCB HCB
Pollutant Value Unit 95 confidence
interval
Reference
Lower Upper
NOx 247 gGJ 143 571 US EPA (1998) chapter 17
CO 87 gGJ 672 605 US EPA (1998) chapter 17
NMVOC 14 gGJ 084 336 US EPA (1998) chapter 17
SOx 1680 gGJ 330 5000 See Note
TSP 117 gGJ 12 117 US EPA (1998) chapter 17
PM10 79 gGJ 1 79 US EPA (1998) chapter 17
PM25 32 gGJ 1 32 US EPA (1998) chapter 17
BC 1 of PM25 01 4 Kupiainen and Klimont 2007
Pb 15 mgGJ 106 247 US EPA (1998) chapter 17
Cd 18 mgGJ 129 3 US EPA (1998) chapter 17
Hg 29 mgGJ 209 488 US EPA (1998) chapter 17
As 143 mgGJ 103 241 US EPA (1998) chapter 17
Cr 91 mgGJ 655 153 US EPA (1998) chapter 17
Cu 10 mgGJ 02 5 EMEPEEA (2006)
Ni 97 mgGJ 706 165 US EPA (1998) chapter 17
Se 45 mgGJ 328 765 US EPA (1998) chapter 17
Zn 88 mgGJ 0504 168 EMEPEEA (2006)
1A1 Energy industries
EMEPEEA air pollutant emission inventory guidebook 2019 17
PCBs 33 ng WHO-
TEGGJ
11 99 Grochowalski amp Konieczyński 2008
PCDDF 10 ng I-
TEQGJ
5 15 UNEP (2005) Coal fired power boilers
Benzo(a)pyrene 13 microgGJ 026 65 US EPA (1998) chapter 17
Benzo(b)fluoranthene 37 microgGJ 37 370 Wenborn et al 1999
Benzo(k)fluoranthene 29 microgGJ 29 290 Wenborn et al 1999
Indeno(123-cd)pyrene 21 microgGJ 042 105 US EPA (1998) chapter 17
HCB 67 microgGJ 22 201 Grochowalski amp Konieczyński 2008
Notes
The tier 1 default emission factors are based on the tier 2 emission factors for drywet bottom boilers
For conversion of the US EPA data the heating value as provided in the reference has been used (6500 BTUlb)
This has been converted to NCV using a factor of 095 Furthermore units have been converted using 10550559
JBTU 2000 lbton and 45359237 glb The EFs for Cu and Zn are converted using the average NCV 119 GJMg
from IPCC Guidelines (IPCC 2006)
The factor for SOx assumes no SO2 abatement and is based on 1 mass sulphur content using EF calculation
from subsection 3422 of the present chapter 95 confidence intervals calculated using range from Table C-1
in Appendix C
The TSP PM10 and PM25 emission factors represent filterable PM emissions and are based on an ash content of
5 Note that condensable PM emission factors are also provided in US EPA (1998) Chapter 17
Table 3-4 Tier 1 emission factors for source category 1A1a using gaseous fuels
Tier 1 default emission factors
Code Name
NFR Source Category 1A1a Public electricity and heat production
Fuel Gaseous fuels
Not applicable
Not estimated NH3 PCBs HCB
Pollutant Value Unit 95 confidence
interval
Reference
Lower Upper
NOx 89 gGJ 15 185 US EPA (1998) chapter 14
CO 39 gGJ 20 60 US EPA (1998) chapter 14
NMVOC 26 gGJ 065 104 US EPA (1998) chapter 14
SOx 0281 gGJ 0169 0393 US EPA (1998) chapter 14
TSP 089 gGJ 0445 134 US EPA (1998) chapter 14
PM10 089 gGJ 0445 134 US EPA (1998) chapter 14
PM25 089 gGJ 0445 134 US EPA (1998) chapter 14
BC 25 of PM25 1 63 See Note
Pb 00015 mgGJ 00005 00045 Nielsen et al 2012
Cd 000025 mgGJ 000008 000075 Nielsen et al 2012
Hg 01 mgGJ 001 1 Nielsen et al 2010
As 012 mgGJ 004 036 Nielsen et al 2012
Cr 000076 mgGJ 000025 000228 Nielsen et al 2012
Cu 0000076 mgGJ 0000025 0000228 Nielsen et al 2012
Ni 000051 mgGJ 000017 000153 Nielsen et al 2012
Se 00112 mgGJ 000375 00337 US EPA (1998) chapter 14
Zn 00015 mgGJ 00005 00045 Nielsen et al 2012
PCDDF 05 ng I-
TEQGJ
025 075 UNEP (2005)
Benzo(a)pyrene 056 microgGJ 019 056 US EPA (1998) chapter 14 (Less
than value based on method
detection limits)
1A1 Energy industries
EMEPEEA air pollutant emission inventory guidebook 2019 18
Benzo(b)fluoranthene 084 microgGJ 028 084 US EPA (1998) chapter 14 (Less
than value based on method
detection limits)
Benzo(k)fluoranthene 084 microgGJ 028 084 US EPA (1998) chapter 14 (Less
than value based on method
detection limits)
Indeno(123-cd)pyrene 084 microgGJ 028 084 US EPA (1998) chapter 14 (Less
than value based on method
detection limits)
Notes
For conversion of the US EPA data the heating value as provided in the reference has been used (102 BTUscf)
This has been converted to NCV using a factor of 090 Furthermore units have been converted using 10550559
JBTU and 45359237 glb
The factor for SOx is based on approximately 001 gm3 mass sulphur content Emission factor for PCDDF is stated
to be applicable light fuel oil and natural gas use in power station boilers but is based mainly on data from oil
combustion UNEP also reports limited data for gas combustion of between 002 and 003 ng TEQGJ for natural
gas-fired boilers
The BC emission factor is the average of the data available in England et al (2004) Wien et al (2004) and the
Speciate database (US EPA 2011)
The TSP PM10 and PM25 emission factors represent filterable PM emissions Note that condensable PM emission
factors are also provided in US EPA (1998) Chapter 14
Table 3-5 Tier 1 emission factors for source category 1A1a using heavy fuel oil
Tier 1 default emission factors
Code Name
NFR Source Category 1A1a Public electricity and heat production
Fuel Heavy Fuel Oil
Not applicable
Not estimated NH3 PCBs Benzo(a)pyrene HCB
Pollutant Value Unit 95 confidence
interval
Reference
Lower Upper
NOx 142 gGJ 70 300 US EPA (2010) chapter 13
CO 151 gGJ 906 211 US EPA (2010) chapter 13
NMVOC 23 gGJ 14 32 US EPA (2010) chapter 13
SOx 495 gGJ 146 1700 See Note
TSP 354 gGJ 2 200 US EPA (2010) chapter 13
PM10 252 gGJ 15 150 US EPA (2010) chapter 13
PM25 193 gGJ 09 90 US EPA (2010) chapter 13
BC 56 of PM25 022 869 See Note
Pb 456 mgGJ 228 911 US EPA (2010) chapter 13
Cd 12 mgGJ 06 24 US EPA (2010) chapter 13
Hg 0341 mgGJ 017 0682 US EPA (2010) chapter 13
As 398 mgGJ 199 797 US EPA (2010) chapter 13
Cr 255 mgGJ 127 51 US EPA (2010) chapter 13
Cu 531 mgGJ 266 106 US EPA (2010) chapter 13
Ni 255 mgGJ 127 510 US EPA (2010) chapter 13
Se 206 mgGJ 103 412 US EPA (2010) chapter 13
Zn 878 mgGJ 439 176 US EPA (2010) chapter 13
PCDDF 25 ng I-
TEQGJ
125 375 UNEP (2005) Heavy fuel
fired power boilers
Benzo(b)fluoranthene 45 microgGJ 15 135 US EPA (2010) chapter 13
Benzo(k)fluoranthene 45 microgGJ 15 135 US EPA (2010) chapter 13
Indeno(123-cd)pyrene 692 microgGJ 346 138 US EPA (2010) chapter 13
Note
1A1 Energy industries
EMEPEEA air pollutant emission inventory guidebook 2019 19
For conversion of the US EPA data the heating value as provided in the reference has been used (150 MMBTU103
gal) This has been converted to NCV using a factor of 095 Furthermore units have been converted using
10550559 JBTU and 45359237 glb
The factor for SOx assumes no SO2 abatement and is based on 1 mass sulphur content using EF calculation
from subsection 3422 of the present chapter 95 confidence intervals calculated using range from Table C-1
in Appendix C
The BC emission factor is derived as the average of the data found in Olmez et al (1988) England et al (2007)
and the Speciate database (US EPA 2011)
The TSP PM10 and PM25 emission factors represent filterable PM emissions and are based on a sulphur content
of 1 Note that condensable PM emission factors are also provided in US EPA (1998) Chapter 13
Table 3-6 Tier 1 emission factors for source category 1A1a using gas oil
Tier 1 default emission factors
Code Name
NFR Source Category 1A1a Public electricity and heat production
Fuel Gas oil
Not applicable
Not estimated NH3 PCB Benzo(a)pyrene Benzo(b)fluoranthene
Benzo(k)fluoranthene HCB
Pollutant Value Unit 95 confidence
interval
Reference
Lower Upper
NOx 65 gGJ 22 195 US EPA (1998) chapter 13
CO 162 gGJ 4 65 US EPA (1998) chapter 13
NMVOC 08 gGJ 048 128 US EPA (1998) chapter 13
SOx 465 gGJ 465 465 See Note
TSP 65 gGJ 2 20 US EPA (1998) chapter 13
PM10 32 gGJ 1 10 US EPA (1998) chapter 13
PM25 08 gGJ 03 25 US EPA (1998) chapter 13
BC 335 of PM25 289 38 Hildemann et al 1981 amp
Bond et al 2006
Pb 407 mgGJ 041 40 US EPA (1998) chapter 13
Cd 136 mgGJ 014 15 US EPA (1998) chapter 13
Hg 136 mgGJ 014 15 US EPA (1998) chapter 13
As 181 mgGJ 018 20 US EPA (1998) chapter 13
Cr 136 mgGJ 014 15 US EPA (1998) chapter 13
Cu 272 mgGJ 027 30 US EPA (1998) chapter 13
Ni 136 mgGJ 014 15 US EPA (1998) chapter 13
Se 679 mgGJ 068 70 US EPA (1998) chapter 13
Zn 181 mgGJ 018 20 US EPA (1998) chapter 13
PCDDF 05 ng I-
TEQGJ
025 1 UNEP 2005
Indeno(123-cd)pyrene 692 microgGJ 346 138 US EPA (1998) chapter 13
Note
For conversion of the US EPA data the heating value as provided in the reference has been used (140 MMBTU103
gal) This has been converted to NCV using a factor of 095 Furthermore units have been converted using
10550559 JBTU and 45359237 glb
The factor for SOx assumes no SO2 abatement and is based on 01 mass sulphur content
The TSP PM10 and PM25 emission factors represent filterable PM emissions Note that condensable PM emission
factors are also provided in US EPA (1998) Chapter 13
1A1 Energy industries
EMEPEEA air pollutant emission inventory guidebook 2019 20
Table 3-7 Tier 1 emission factors for source category 1A1a using biomass
Tier 1 default emission factors
Code Name
NFR Source Category 1A1a Public electricity and heat production
Fuel Biomass
Not applicable
Not estimated NH3
Pollutant Value Unit 95 confidence
interval
Reference
Lower Upper
NOx 81 gGJ 40 160 Nielsen et al 2010
CO 90 gGJ 45 180 Nielsen et al 2010
NMVOC 731 gGJ 244 219 US EPA (2003) chapter 16
SOx 108 gGJ 645 151 US EPA (2003) chapter 16
TSP 172 gGJ 86 344 US EPA (2003) chapter 16
PM10 155 gGJ 77 310 US EPA (2003) chapter 16
PM25 133 gGJ 66 266 US EPA (2003) chapter 16
BC 33 of PM25 16 66 See Note
Pb 206 mgGJ 124 289 US EPA (2003) chapter 16
Cd 176 mgGJ 106 247 US EPA (2003) chapter 16
Hg 151 mgGJ 0903 211 US EPA (2003) chapter 16
As 946 mgGJ 568 132 US EPA (2003) chapter 16
Cr 903 mgGJ 542 126 US EPA (2003) chapter 16
Cu 211 mgGJ 126 295 US EPA (2003) chapter 16
Ni 142 mgGJ 851 199 US EPA (2003) chapter 16
Se 12 mgGJ 0722 169 US EPA (2003) chapter 16
Zn 181 mgGJ 108 253 US EPA (2003) chapter 16
PCB 35 microgGJ 035 35 US EPA (2003) chapter 16
PCDDF 50 ng I-
TEQGJ
25 75 UNEP (2005) (for clean
wood)
Benzo(a)pyrene 112 mgGJ 0671 157 US EPA (2003) chapter 16
Benzo(b)fluoranthene 0043 mgGJ 00215 00645 US EPA (2003) chapter 16
Benzo(k)fluoranthene 00155 mgGJ 000774 00232 US EPA (2003) chapter 16
Indeno(123-cd)pyrene 00374 mgGJ 00187 00561 US EPA (2003) chapter 16
HCB 5 microgGJ 05 50 Bailey 2001
Note For conversion of the US EPA data units have been converted using 10550559 JBTU and 45359237 glb
The BC emission factor is an average of the data in Dayton amp Bursey (2001) and the Speciate database (US EPA
2011)
The TSP PM10 and PM25 emission factors represent filterable PM emissions Note that a condensable PM
emission factor is also provided in US EPA (1998) Chapter 16
3423 Tier 1 activity data
Information on the use of energy and production of power suitable for estimating emissions using
the Tier 1 simpler estimation methodology is available from national statistics agencies or the
International Energy Agency (IEA)
Further guidance is provided in the 2006 IPCC Guidelines for National Greenhouse Gas Inventories
volume 2 on Stationary Combustion
wwwipcc-nggipigesorjppublic2006glpdf2_Volume2V2_2_Ch2_Stationary_Combustionpdf
The activity rate and the emission factor have to be determined on the same level of aggregation
depending on the availability of data The activity statistic should be determined within the
considered country or region by using adequate statistics The activity should refer to the energy
input of the emission sources considered (net or inferior fuel consumption in [GJ])
1A1 Energy industries
EMEPEEA air pollutant emission inventory guidebook 2019 21
343 Tier 2 technology-specific approach
3431 Algorithm
The Tier 2 approach is similar to the Tier 1 approach To apply the Tier 2 approach both the activity
data and the emission factors need to be applied according to a countryrsquos fuel usage and installed
combustion technologies These techniques may include
relative mix of fuels
types of combustion plant
There are two approaches possible
disaggregate the fuel use in the country to model the different combustion and abatement types
into the inventory by
a) defining the activity data using each of the identified process types (together called
lsquotechnologiesrsquo in the formulae below) separately and
b) applying technology-specific emission factors for each process type
estechnologi
pollutanttechnologytechnologyproductionpollutant EFARE (2)
develop country-specific emission factors from the understanding of the relative contributions of
the different technologies within the national combustion plant portfolio (and relative fuel use)
and apply this country-specific emission factor for the national fuel use
pollutantcountryproductionpollutant
estechnologi
pollutanttechnologytechnologypollutantcountry
EFARE
EFnPenetratioEF
(3)
Both approaches are mathematically very similar or even identical Using one or the other
approach depends mainly on the availability of data If the activity data are indeed available the
first approach seems to be more appropriate If however no direct activity data are available
penetration of different technologies within the industry could be estimated from data on
capacities or other surrogate data that reflect relative sizes of facilities using the different
technologies
3432 Technology-specific emission factors
Applying a Tier 2 approach for the process emissions from public power and heat production
technology-specific emission factors are needed The main technology distinction is by combustion
unit type (boiler technologies gas turbine stationary engine) and fuel type Note that factors for
smaller combustion units (lt 50 MWth) are provided in Chapter 1A4 where available size-based
factors for boilers are also provided for Example factors are provided in this section however it
should be noted that these cannot address every fuel combustion and abatement combination that
can exist The number of sources in this activity is usually comparatively small and the inventory
compiler may wish to consider gathering data to allow a Tier 3 approach as a more robust
methodology Knowledge of emission concentrations and emission limit values (ELVs) can allow a
first estimation of emission factors without detailed knowledge of plant combustion and abatement
technology
1A1 Energy industries
EMEPEEA air pollutant emission inventory guidebook 2019 22
Emission factors derived from the achievable emission levels values (AELs) as defined in the BREF
document are provided in subsection 631 for comparison In addition ELVs for selected emission
instruments are provided as emission factors in Appendix D
Table 3-8 Technology-specific Tier 2 factors
Combustion technology Relevant fuels
Dry bottom boiler Coking coal steam coal sub-bituminous coal brown coal lignite
wood peat coke oven coke residual oil natural gas
Wet bottom boiler Coking coal steam coal sub-bituminous coal brown coal lignite
Fluid bed boiler Hard coal brown coal
Gas turbine Natural gas gas oil refinery gas blast furnace gas
Stationary engine Natural gas gas oil
This section provides a series of technology-specific pollutant emission factors for combustion these
factors represent a wider range of fuels and combustion technologies than for Tier 1 They do not
represent specific combustion and abatement technologies (which would be needed in a Tier 3
approach) but do offer more disaggregation than Tier 1 Extension of Tier 2 to reflect emission
abatement is possible through use of factors derived from emission data
The BC emission factors presented in this Guidance are derived on the basis of EC and it is therefore
assumed that BC=EC
1A1 Energy industries
EMEPEEA air pollutant emission inventory guidebook 2019 23
Table 3-9 Tier 2 emission factors for source category 1A1a dry bottom boilers using
coking coal steam coal and sub-bituminous coal
Tier 2 emission factors
Code Name
NFR Source Category 1A1a Public electricity and heat production
Fuel Coking Coal Steam Coal amp Sub-Bituminous Coal
SNAP (if applicable) 010101
010102
Public power - Combustion plants gt= 300 MW (boilers)
Public power - Combustion plants gt= 50 and lt 300 MW (boilers)
TechnologiesPractices Dry Bottom Boilers
Region or regional
conditions
NA
Abatement technologies Abatement assumed except for SO2 EF
Not applicable
Not estimated NH3
Pollutant Value Unit 95 confidence
interval
Reference
Lower Upper
NOx 209 gGJ 200 350 US EPA (1998) chapter 11
CO 87 gGJ 615 15 US EPA (1998) chapter 11
NMVOC 10 gGJ 06 24 US EPA (1998) chapter 11
SOx 820 gGJ 330 5000 See Note
TSP 114 gGJ 3 300 US EPA (1998) chapter 11
PM10 77 gGJ 2 200 US EPA (1998) chapter 11
PM25 34 gGJ 09 90 US EPA (1998) chapter 11
BC 22 of PM25 027 808 See Note
Pb 73 mgGJ 516 12 US EPA (1998) chapter 11
Cd 09 mgGJ 0627 146 US EPA (1998) chapter 11
Hg 14 mgGJ 102 238 US EPA (1998) chapter 11
As 71 mgGJ 504 118 US EPA (1998) chapter 11
Cr 45 mgGJ 32 746 US EPA (1998) chapter 11
Cu 78 mgGJ 0233 155 Expert judgement derived from
EMEPEEA (2006)
Ni 49 mgGJ 344 803 US EPA (1998) chapter 11
Se 23 mgGJ 16 373 US EPA (1998) chapter 11
Zn 19 mgGJ 775 155 Expert judgement derived from
EMEPEEA (2006)
PCB 33 ng WHO-
TEGGJ
11 99 Grochowalski amp Konieczyński
2008
PCDDF 10 ng I-TEQGJ 5 15 UNEP (2005) Coal fired power
boilers
Benzo(a)pyrene 07 microgGJ 0245 221 US EPA (1998) chapter 11
Benzo(b)fluoranthene 37 microgGJ 37 370 Wenborn et al 1999
Benzo(k)fluoranthene 29 microgGJ 29 290 Wenborn et al 1999
Indeno(123-cd)pyrene 11 microgGJ 0591 236 US EPA (1998) chapter 11
HCB 67 microgGJ 22 201 Grochowalski amp Konieczyński
2008
Notes
For conversion of the US EPA data the heating value as provided in the reference has been used (26 MMBTUton)
This has been converted to NCV using a factor of 095 Furthermore units have been converted using 10550559
JBTU and 45359237 glb The EFs for benzo(b)fluoranthene and benzo(k)fluoranthene are converted using the
average NCV for other bituminous coal of 241 GJton from Energy Statistics Manual (OECDIEA 2005)
The factor for SOx assumes no SO2 abatement and is based on 1 mass sulphur content using EF calculation
from subsection 3422 of the present chapter 95 confidence intervals calculated using range from Table C-1
in Appendix C
1A1 Energy industries
EMEPEEA air pollutant emission inventory guidebook 2019 24
The BC share is derived as the average of data from Henry amp Knapp (1980) Olmez et al (1988) Watson et al
(2001) Fisher et al (1979) Griest amp Tomkins (1984) Engelbrecht et al (2002) Chow et al (2004) and Speciate (US
EPA 2011)
The TSP PM10 and PM25 emission factors represent filterable PM emissions and are based on an ash content of
82 Note that condensable PM emission factors are also provided in US EPA (1998) Chapter 11
Table 3-10 Tier 2 emission factors for source category 1A1a wet and dry bottom boilers
using brown coallignite
Tier 2 emission factors
Code Name
NFR Source Category 1A1a Public electricity and heat production
Fuel Brown CoalLignite
SNAP (if applicable) 010101
010102
Public power - Combustion plants gt= 300 MW (boilers)
Public power - Combustion plants gt= 50 and lt 300 MW (boilers)
TechnologiesPractices Wet and Dry Bottom Boilers
Region or regional
conditions
NA
Abatement technologies NA
Not applicable
Not estimated BC NH3
Pollutant Value Unit 95 confidence
interval
Reference
Lower Upper
NOx 247 gGJ 143 571 US EPA (1998) chapter 17
CO 87 gGJ 672 605 US EPA (1998) chapter 17
NMVOC 14 gGJ 084 336 US EPA (1998) chapter 17
SOx 1680 gGJ 330 5000 See Note
TSP 117 gGJ 12 117 US EPA (1998) chapter 17
PM10 79 gGJ 1 79 US EPA (1998) chapter 17
PM25 32 gGJ 1 32 US EPA (1998) chapter 17
Pb 15 mgGJ 106 247 US EPA (1998) chapter 17
Cd 18 mgGJ 129 3 US EPA (1998) chapter 17
Hg 29 mgGJ 209 488 US EPA (1998) chapter 17
As 143 mgGJ 103 241 US EPA (1998) chapter 17
Cr 91 mgGJ 655 153 US EPA (1998) chapter 17
Cu 10 mgGJ 02 5 EMEPEEA (2006)
Ni 97 mgGJ 706 165 US EPA (1998) chapter 17
Se 45 mgGJ 328 765 US EPA (1998) chapter 17
Zn 88 mgGJ 0504 168 EMEPEEA (2006)
PCBs 33 ng WHO-
TEGGJ
11 99 Grochowalski amp Konieczyński
2008
PCDDF 10 ng I-
TEQGJ
5 15 UNEP (2005) Coal fired power
boilers
Benzo(a)pyrene 13 microgGJ 026 65 US EPA (1998) chapter 17
Benzo(b)fluoranthene 37 microgGJ 37 370 Wenborn et al 1999
Benzo(k)fluoranthene 29 microgGJ 29 290 Wenborn et al 1999
Indeno(123-cd)pyrene 21 microgGJ 042 105 US EPA (1998) chapter 17
HCB 67 microgGJ 22 201 Grochowalski amp Konieczyński
2008
Notes
For conversion of the US EPA data the heating value as provided in the reference has been used (6500 BTUlb)
This has been converted to NCV using a factor of 095 Furthermore units have been converted using 10550559
JBTU 2000 lbton and 45359237 glb The EFs for Cu and Zn are converted using the average NCV 119 GJMg
from IPCC Guidelines (IPCC 2006)
1A1 Energy industries
EMEPEEA air pollutant emission inventory guidebook 2019 25
The factor for SOx assumes no SO2 abatement and is based on 1 mass sulphur content using EF calculation
from subsection 3422 of the present chapter 95 confidence intervals calculated using range from Table C-1
in Appendix C
The emission factors for PCBs benzo(b)fluoranthene benzo(k)fluoranthene and HCB are based on data for hard
coal combustion in dry bottom boilers
The TSP PM10 and PM25 emission factors represent filterable PM emissions and are based on an ash content of
5 Note that condensable PM emission factors are also provided in US EPA (1998) Chapter 17
Table 3-11 Tier 2 emission factors for source category 1A1a dry bottom boilers using
residual oil
Tier 2 emission factors
Code Name
NFR Source Category 1A1a Public electricity and heat production
Fuel Residual Oil
SNAP (if applicable) 010101
010102
Public power - Combustion plants gt= 300 MW (boilers)
Public power - Combustion plants gt= 50 and lt 300 MW
(boilers)
TechnologiesPractices Dry Bottom Boilers
Region or regional
conditions
NA
Abatement technologies NA
Not applicable
Not estimated NH3 PCBs Benzo(a)pyrene HCB
Pollutant Value Unit 95 confidence
interval
Reference
Lower Upper
NOx 142 gGJ 70 300 US EPA (2010) chapter 13
CO 151 gGJ 906 211 US EPA (2010) chapter 13
NMVOC 23 gGJ 14 32 US EPA (2010) chapter 13
SOx 495 gGJ 146 1700 See Note
TSP 354 gGJ 2 200 US EPA (2010) chapter 13
PM10 252 gGJ 15 150 US EPA (2010) chapter 13
PM25 193 gGJ 09 90 US EPA (2010) chapter 13
BC 56 of PM25 022 869 See Note
Pb 456 mgGJ 228 911 US EPA (2010) chapter 13
Cd 12 mgGJ 06 24 US EPA (2010) chapter 13
Hg 0341 mgGJ 017 0682 US EPA (2010) chapter 13
As 398 mgGJ 199 797 US EPA (2010) chapter 13
Cr 255 mgGJ 127 51 US EPA (2010) chapter 13
Cu 531 mgGJ 266 106 US EPA (2010) chapter 13
Ni 255 mgGJ 127 510 US EPA (2010) chapter 13
Se 206 mgGJ 103 412 US EPA (2010) chapter 13
Zn 878 mgGJ 439 176 US EPA (2010) chapter 13
PCDDF 25 ng I-
TEQGJ
125 375 UNEP (2005) Heavy fuel
fired power boilers
Benzon(b)fluoranthene 45 microgGJ 15 135 US EPA (2010) chapter 13
Benzon(k)fluoranthene 45 microgGJ 15 135 US EPA (2010) chapter 13
Indeno(123-cd)pyrene 692 microgGJ 346 138 US EPA (2010) chapter 13
Note
For conversion of the US EPA data the heating value as provided in the reference has been used (150 MMBTU103
gal) This has been converted to NCV using a factor of 095 Furthermore units have been converted using
10550559 JBTU and 45359237 glb
1A1 Energy industries
EMEPEEA air pollutant emission inventory guidebook 2019 26
The factor for SOx assumes no SO2 abatement and is based on 1 mass sulphur content using EF calculation
from subsection 3422 of the present chapter 95 confidence intervals calculated using range from Table C-1
in Appendix C
The BC emission factor is derived as the average of the data found in Olmez et al (1988) England et al (2007)
and the Speciate database (US EPA 2011)
The TSP PM10 and PM25 emission factors represent filterable PM emissions and are based on a sulphur content
of 1 Note that condensable PM emission factors are also provided in US EPA (1998) Chapter 13
Table 3-12 Tier 2 emission factors for source category 1A1a dry bottom boilers using
natural gas
Tier 2 emission factors
Code Name
NFR Source Category 1A1a Public electricity and heat production
Fuel Natural Gas
SNAP (if applicable) 010101
010102
Public power - Combustion plants gt= 300 MW (boilers)
Public power - Combustion plants gt= 50 and lt 300 MW
(boilers)
TechnologiesPractices Dry Bottom Boilers
Region or regional
conditions
NA
Abatement
technologies
NA
Not applicable
Not estimated NH3 PCBs HCB
Pollutant Value Unit 95 confidence
interval
Reference
Lower Upper
NOx 89 gGJ 15 185 US EPA (1998) chapter 14
CO 39 gGJ 20 60 US EPA (1998) chapter 14
NMVOC 26 gGJ 065 104 US EPA (1998) chapter 14
SOx 0281 gGJ 0169 0393 US EPA (1998) chapter 14
TSP 089 gGJ 0445 134 US EPA (1998) chapter 14
PM10 089 gGJ 0445 134 US EPA (1998) chapter 14
PM25 089 gGJ 0445 134 US EPA (1998) chapter 14
BC 25 of PM25 1 63 See Note
Pb 00015 mgGJ 00005 00045 Nielsen et al 2012
Cd 000025 mgGJ 000008 000075 Nielsen et al 2012
Hg 01 mgGJ 001 1 Nielsen et al 2010
As 012 mgGJ 004 036 Nielsen et al 2012
Cr 000076 mgGJ 000025 000228 Nielsen et al 2012
Cu 0000076 mgGJ 0000025 0000228 Nielsen et al 2012
Ni 000051 mgGJ 000017 000153 Nielsen et al 2012
Se 00112 mgGJ 000375 00337 US EPA (1998) chapter 14
Zn 00015 mgGJ 00005 00045 Nielsen et al 2012
PCDDF 05 ng I-
TEQGJ
025 075 UNEP (2005)
Benzo(a)pyrene 056 microgGJ 019 056 US EPA (1998) chapter 14
(Less than value based
on method detection
limits)
Benzo(b)fluoranthene 084 microgGJ 028 084 US EPA (1998) chapter 14
(Less than value based
on method detection
limits)
Benzo(k)fluoranthene 084 microgGJ 028 084 US EPA (1998) chapter 14
(Less than value based
1A1 Energy industries
EMEPEEA air pollutant emission inventory guidebook 2019 27
on method detection
limits)
Indeno(123-cd)pyrene 084 microgGJ 028 084 US EPA (1998) chapter 14
(Less than value based
on method detection
limits)
Notes
For conversion of the US EPA data the heating value as provided in the reference has been used (102 BTUscf)
This has been converted to NCV using a factor of 090 Furthermore units have been converted using 10550559
JBTU and 45359237 glb
The factor for SOx is based on approximately 001 gm3 mass sulphur content
Emission factor for PCDDF is stated to be applicable light fuel oil and natural gas use in power station boilers
but is based mainly on data from oil combustion UNEP also reports limited data for gas combustion of between
002 and 003 ng TEQGJ for natural gas-fired boilers
The BC emission factor is the average of the data available in England et al (2004) Wien et al (2004) and the
Speciate database (US EPA 2011)
The TSP PM10 and PM25 emission factors represent filterable PM emissions Note that condensable PM emission
factors are also provided in US EPA (1998) Chapter 14
Table 3-13 Tier 2 emission factors for source category 1A1a dry bottom boilers using wood
waste
Tier 2 emission factors
Code Name
NFR Source Category 1A1a Public electricity and heat production
Fuel Wood and wood waste (clean wood waste)
SNAP (if applicable) 010101
010102
Public power - Combustion plants gt= 300 MW (boilers)
Public power - Combustion plants gt= 50 and lt 300 MW
(boilers)
TechnologiesPractices Dry Bottom Boilers
Region or regional
conditions
NA
Abatement technologies Primary NOx abatement ndash no PM abatement
Not applicable
Not estimated NH3
Pollutant Value Unit 95 confidence
interval
Reference
Lower Upper
NOx 81 gGJ 40 160 Nielsen et al 2010
CO 90 gGJ 45 180 Nielsen et al 2010
NMVOC 731 gGJ 244 219 US EPA (2003) chapter 16
SOx 108 gGJ 645 151 US EPA (2003) chapter 16
TSP 172 gGJ 86 344 US EPA (2003) chapter 16
PM10 155 gGJ 77 310 US EPA (2003) chapter 16
PM25 133 gGJ 66 266 US EPA (2003) chapter 16
BC 33 of PM25 16 66 See Note
Pb 206 mgGJ 124 289 US EPA (2003) chapter 16
Cd 176 mgGJ 106 247 US EPA (2003) chapter 16
Hg 151 mgGJ 0903 211 US EPA (2003) chapter 16
As 946 mgGJ 568 132 US EPA (2003) chapter 16
Cr 903 mgGJ 542 126 US EPA (2003) chapter 16
Cu 211 mgGJ 126 295 US EPA (2003) chapter 16
Ni 142 mgGJ 851 199 US EPA (2003) chapter 16
Se 12 mgGJ 0722 169 US EPA (2003) chapter 16
Zn 181 mgGJ 108 253 US EPA (2003) chapter 16
1A1 Energy industries
EMEPEEA air pollutant emission inventory guidebook 2019 28
PCB 35 microgGJ 035 35 US EPA (2003) chapter 16
PCDDF 50 ng I-
TEQGJ
25 75 UNEP (2005) (for clean
wood)
Benzo(a)pyrene 112 mgGJ 0671 157 US EPA (2003) chapter 16
Benzo(b)fluoranthene 0043 mgGJ 00215 00645 US EPA (2003) chapter 16
Benzo(k)fluoranthene 00155 mgGJ 000774 00232 US EPA (2003) chapter 16
Indeno(123-cd)pyrene 00374 mgGJ 00187 00561 US EPA (2003) chapter 16
HCB 5 microgGJ 05 50 Bailey 2001
Note For conversion of the US EPA data units have been converted using 10550559 JBTU and 45359237 glb
The BC emission factor is an average of the data in Dayton amp Bursey (2001) and the Speciate database (US EPA
2011)
The TSP PM10 and PM25 emission factors represent filterable PM emissions Note that a condensable PM
emission factor is also provided in US EPA (1998) Chapter 16
Table 3-14 Tier 2 emission factors for source category 1A1a wet bottom boilers using
coking coal steam coal and sub-bituminous coal
Tier 2 emission factors
Code Name
NFR Source Category 1A1a Public electricity and heat production
Fuel Coking Coal Steam Coal amp Sub-Bituminous Coal
SNAP (if applicable) 010101
010102
Public power - Combustion plants gt= 300 MW (boilers)
Public power - Combustion plants gt= 50 and lt 300 MW (boilers)
TechnologiesPractices Wet Bottom Boilers
Region or regional
conditions
NA
Abatement technologies Abatement assumed except for SO2
Not applicable
Not estimated NH3
Pollutant Value Unit 95 confidence
interval
Reference
Lower Upper
NOx 244 gGJ 120 488 US EPA (1998) chapter 11
CO 87 gGJ 615 150 US EPA (1998) chapter 11
NMVOC 07 gGJ 04 16 US EPA (1998) chapter 11
SOx 820 gGJ 330 5000 See Note
TSP 80 gGJ 75 30 US EPA (1998) chapter 11
PM10 60 gGJ 6 24 US EPA (1998) chapter 11
PM25 31 gGJ 3 12 US EPA (1998) chapter 11
BC 22 of PM25 027 808 See Note
Pb 73 mgGJ 516 12 US EPA (1998) chapter 11
Cd 09 mgGJ 0627 146 US EPA (1998) chapter 11
Hg 14 mgGJ 102 238 US EPA (1998) chapter 11
As 71 mgGJ 504 118 US EPA (1998) chapter 11
Cr 45 mgGJ 32 746 US EPA (1998) chapter 11
Cu 90 mgGJ 0233 155 Expert judgement derived from
EMEPEEA (2006)
Ni 49 mgGJ 344 803 US EPA (1998) chapter 11
Se 23 mgGJ 16 373 US EPA (1998) chapter 11
Zn 90 mgGJ 0388 155 Expert judgement derived from
EMEPEEA (2006)
PCB 33 ng WHO-
TEQGJ
11 99 Grochowalski amp Konieczyński
2008
PCDDF 10 ng I-TEQGJ 5 15 UNEP (2005) Coal fired power
boilers
Benzo(a)pyrene 07 microgGJ 0245 221 US EPA (1998) chapter 11
1A1 Energy industries
EMEPEEA air pollutant emission inventory guidebook 2019 29
Benzo(b)fluoranthene 37 microgGJ 37 370 Wenborn et al 1999
Benzo(b)fluoranthene 29 microgGJ 29 290 Wenborn et al 1999
Indeno(123-cd)pyrene 11 microgGJ 0591 236 US EPA (1998) chapter 11
HCB 67 microgGJ 22 201 Grochowalski amp Konieczyński
2008
Note For conversion of the US EPA data the heating value as provided in the reference has been used (26
MMBTUton) This has been converted to NCV using a factor of 095 Furthermore units have been converted
using 10550559 JBTU and 45359237 glb The EFs for benzo(b)fluoranthene and benzo(k)fluoranthene are
converted using the average NCV for other bituminous coal of 241 GJton from Energy Statistics Manual
(OECDIEA 2005)
The factor for SOx assumes no SO2 abatement and is based on 1 mass sulphur content using EF calculation
from subsection 3422 of the present chapter 95 confidence intervals calculated using range from Table C-1
in Appendix C
The BC share is derived as the average of data from Henry amp Knapp (1980) Olmez et al (1988) Watson et al
(2001) Fisher et al (1979) Griest amp Tomkins (1984) Engelbrecht et al (2002) Chow et al (2004) and Speciate (US
EPA 2011)
The TSP PM10 and PM25 emission factors provided in US EPA (1998) Chapter 11 represent filterable PM emissions
and are determined from fuel ash content Note that condensable PM emission factors are also provided in US
EPA (1998) Chapter 11
Table 3-15 Tier 2 emission factors for source category 1A1a fluid bed boilers using hard
coal
Tier 2 emission factors
Code Name
NFR Source Category 1A1a Public electricity and heat production
Fuel Hard Coal
SNAP (if applicable) 010101
010102
Public power - Combustion plants gt= 300 MW (boilers)
Public power - Combustion plants gt= 50 and lt 300 MW (boilers)
TechnologiesPractices Fluid Bed Boilers
Region or regional
conditions
NA
Abatement technologies Abatement assumed except for SO2
Not applicable
Not estimated NH3
Pollutant Value Unit 95 confidence
interval
Reference
Lower Upper
NOx 825 gGJ 10 112 European Commission (2006)
CO 313 gGJ 150 600 US EPA (1998) chapter 11
NMVOC 09 gGJ 06 24 US EPA (1998) chapter 11
SOx 820 gGJ 330 5000 See Note
TSP 84 gGJ 75 30 US EPA (1998) chapter 11
PM10 77 gGJ 6 24 US EPA (1998) chapter 11
PM25 52 gGJ 3 12 US EPA (1998) chapter 11
BC 22 of PM25 027 808 See Note
Pb 73 mgGJ 488 114 US EPA (1998) chapter 11
Cd 09 mgGJ 059 138 US EPA (1998) chapter 11
Hg 14 mgGJ 097 225 US EPA (1998) chapter 11
As 71 mgGJ 477 111 US EPA (1998) chapter 11
Cr 45 mgGJ 302 705 US EPA (1998) chapter 11
Cu 90 mgGJ 023 155 Expert judgement derived from
EMEPEEA (2006)
Ni 49 mgGJ 326 76 US EPA (1998) chapter 11
Se 23 mgGJ 151 353 US EPA (1998) chapter 11
1A1 Energy industries
EMEPEEA air pollutant emission inventory guidebook 2019 30
Zn 90 mgGJ 039 155 Expert judgement derived from
EMEPEEA (2006)
PCBs 33 ng WHO-
TEQGJ
11 99 Grochowalski amp Konieczyński
2008
PCDDF 10 ng I-TEQGJ 5 15 UNEP (2005) Coal fired power
boilers
Benzo(a)pyrene 07 microgGJ 0245 221 US EPA (1998) chapter 11
Benzo(b)fluoranthene 37 microgGJ 37 370 Wenborn et al 1999
Benzo(b)fluoranthene 29 microgGJ 29 290 Wenborn et al 1999
Indeno(123-cd)pyrene 11 microgGJ 0591 236 US EPA (1998) chapter 11
HCB 67 microgGJ 22 201 Grochowalski amp Konieczyński
2008
Note For conversion of the US EPA data the heating value as provided in the reference has been used (26
MMBTUton) This has been converted to NCV using a factor of 095 Furthermore units have been converted
using 10550559 JBTU and 45359237 glb The EFs for benzo(b)fluoranthene and benzo(k)fluoranthene are
converted using the average NCV for other bituminous coal of 241 GJton from Energy Statistics Manual
(OECDIEA 2005)
The factor for SOx assumes no SO2 abatement and is based on 1 mass sulphur content using EF calculation
from subsection 3422 of the present chapter 95 confidence intervals calculated using range from Table C-1
in Appendix C
The BC share is derived as the average of data from Henry amp Knapp (1980) Olmez et al (1988) Watson et al
(2001) Fisher et al (1979) Griest amp Tomkins (1984) Engelbrecht et al (2002) Chow et al (2004) and Speciate (US
EPA 2011)
The basis of the TSP PM10 and PM25 emission factors could not be determined in the reference
Table 3-16 Tier 2 emission factors for source category 1A1a fluid bed boilers using brown
coal
Tier 2 emission factors
Code Name
NFR Source Category 1A1a Public electricity and heat production
Fuel Brown Coal
SNAP (if applicable) 010101
010102
Public power - Combustion plants gt= 300 MW (boilers)
Public power - Combustion plants gt= 50 and lt 300 MW
(boilers)
TechnologiesPractices Fluid Bed Boilers
Region or regional
conditions
NA
Abatement technologies NA
Not applicable
Not estimated BC NH3
Pollutant Value Unit 95 confidence
interval
Reference
Lower Upper
NOx 60 gGJ 35 852 European Commission
(2006)
CO 13 gGJ 01 26 European Commission
(2006)
NMVOC 1 gGJ 02 5 US EPA (1998) chapter 17
SOx 1680 gGJ 330 5000 See Note
TSP 102 gGJ 34 306 US EPA (1998) chapter 17
PM10 69 gGJ 23 207 US EPA (1998) chapter 17
PM25 28 gGJ 09 84 US EPA (1998) chapter 17
Pb 15 mgGJ 106 247 US EPA (1998) chapter 17
Cd 18 mgGJ 129 3 US EPA (1998) chapter 17
Hg 29 mgGJ 209 488 US EPA (1998) chapter 17
1A1 Energy industries
EMEPEEA air pollutant emission inventory guidebook 2019 31
As 143 mgGJ 103 241 US EPA (1998) chapter 17
Cr 91 mgGJ 655 153 US EPA (1998) chapter 17
Cu 10 mgGJ 008 078 Expert judgement derived
from EMEPEEA (2006)
Ni 97 mgGJ 706 165 US EPA (1998) chapter 17
Se 45 mgGJ 328 765 US EPA (1998) chapter 17
Zn 88 mgGJ 05 168 Expert judgement derived
from EMEPEEA (2006)
PCBs 33 ng WHO-
TEQGJ
11 99 Grochowalski amp
Konieczyński 2008
PCDDF 10 ng I-
TEQGJ
5 15 UNEP (2005) Coal fired
power boilers
Benzo(a)pyrene 13 microgGJ 026 65 US EPA (1998) chapter 17
Benzo(b)fluoranthene 37 microgGJ 37 370 Wenborn et al 1999
Benzo(b)fluoranthene 29 microgGJ 29 290 Wenborn et al 1999
Indeno(123-cd)pyrene 21 microgGJ 04 105 US EPA (1998) chapter 17
HCB 67 microgGJ 22 201 Grochowalski amp
Konieczyński 2008
Note
For conversion of the US EPA data the heating value as provided in the reference has been used (6500 BTUlb)
This has been converted to NCV using a factor of 095 Furthermore units have been converted using 10550559
JBTU 2000 lbton and 45359237 glb The EFs for Cu and Zn are converted using the average NCV 119 GJMg
from IPCC Guidelines (IPCC 2006)
The factor for SOx assumes no SO2 abatement and is based on 1 mass sulphur content using EF calculation
from subsection 3422 of the present chapter 95 confidence intervals calculated using range from Table C-1
in Appendix C
The emission factors for PCBs benzo(b)fluoranthene benzo(k)fluoranthene and HCB are based on data for hard
coal combusted in FBB
The basis of the TSP PM10 and PM25 emission factors could not be determined in the reference
Table 3-17 Tier 2 emission factors for source category 1A1a gas turbines using gaseous
fuels
Tier 2 emission factors
Code Name
NFR Source Category 1A1a Public electricity and heat production
Fuel Gaseous Fuels
SNAP (if applicable) 010104 Public power - Gas turbines
TechnologiesPractices Gas Turbines
Region or regional
conditions
NA
Abatement
technologies
NA
Not applicable
Not estimated NH3 PCB PCDDF HCB
Pollutant Value Unit 95 confidence
interval
Reference
Lower Upper
NOx 48 gGJ 28 68 Nielsen et al 2010
CO 48 gGJ 1 70 Nielsen et al 2010
NMVOC 16 gGJ 05 76 Nielsen et al 2010
SOx 0281 gGJ 0169 0393 See note
TSP 02 gGJ 005 08 BUWAL 2001
PM10 02 gGJ 005 08 BUWAL 2001
PM25 02 gGJ 005 08 Assumed equal to PM25
1A1 Energy industries
EMEPEEA air pollutant emission inventory guidebook 2019 32
BC 25 of
PM25
1 63 See Note
Pb 00015 mgGJ 00005 00045 Nielsen et al 2012
Cd 000025 mgGJ 000008 000075 Nielsen et al 2012
Hg 01 mgGJ 001 1 Nielsen et al 2010
As 012 mgGJ 004 036 Nielsen et al 2012
Cr 000076 mgGJ 000025 000228 Nielsen et al 2012
Cu 0000076 mgGJ 0000025 0000228 Nielsen et al 2012
Ni 000051 mgGJ 000017 000153 Nielsen et al 2012
Se 00112 mgGJ 000375 00337 US EPA (1998) chapter 14
Zn 00015 mgGJ 00005 00045 Nielsen et al 2012
Benzo(a)pyrene 056 microgGJ 019 056 US EPA (1998) chapter 14
(Less than value based
on method detection
limits)
Benzo(b)fluoranthene 158 microgGJ 05 47 API 1998
Benzo(k)fluoranthene 111 microgGJ 04 33 API 1998
Indeno(123-cd)pyrene 836 microgGJ 28 251 API 1998
Notes
It must be noted that the Hg content (and other heavy metals) of natural gas varies between gas fields However
the differences after natural gas processing is thought to be of minor importance The US EPA (1998) provides an
emission factor of 01 mgGJ It is encouraged that countries obtain country specific data for the natural gas based
on the origin The factor for SOx is based on approximately 001 gm3 mass sulphur content An SO2 emission
factor can also be calculated using the EF calculation from subsection 3422 of the present chapter
The BC emission factor is the average of the data available in England et al (2004) Wien et al (2004) and the
Speciate database (US EPA 2011)
The basis of the TSP PM10 and PM25 emission factors could not be determined in the reference
Table 3-18 Tier 2 emission factors for source category 1A1a gas turbines using gas oil
Tier 2 emission factors
Code Name
NFR Source Category 1A1a Public electricity and heat production
Fuel Gas Oil
SNAP (if applicable) 010104 Public power ndash gas turbines
TechnologiesPractices Gas Turbines
Region or regional
conditions
NA
Abatement technologies NA
Not applicable
Not estimated NH3 As Cu Ni Se Zn PCB PCDDF Benzo(a)pyrene
Benzo(b)fluoranthene Benzo(k)fluoranthene Indeno(123-cd)pyrene
HCB
Pollutant Value Unit 95 confidence
interval
Reference
Lower Upper
NOx 398 gGJ 239 557 US EPA (2000) chapter 31
CO 149 gGJ 089 209 US EPA (2000) chapter 31
NMVOC 019 gGJ 011 026 US EPA (2000) chapter 31
SOx 465 gGJ 465 465 See Note
TSP 195 gGJ 065 585 US EPA (2000) chapter 31
PM10 195 gGJ 065 585 US EPA (2000) chapter 31
PM25 195 gGJ 065 585 US EPA (2000) chapter 31
BC 335 of PM25 289 38 Hildemann et al 1981 amp
Bond et al 2006
Pb 00069 mgGJ 00007 0069 Pulles et al (2012)
1A1 Energy industries
EMEPEEA air pollutant emission inventory guidebook 2019 33
Cd 00012 mgGJ 00001 0012 Pulles et al (2012)
Hg 0053 mgGJ 0005 053 Pulles et al (2012)
As 00023 mgGJ 00002 0023 Pulles et al (2012)
Cr 028 mgGJ 023 030 Pulles et al (2012)
Cu 017 mgGJ 014 020 Pulles et al (2012)
Ni 00023 mgGJ 00002 0023 Pulles et al (2012)
Se 00023 mgGJ 00002 0023 Pulles et al (2012)
Zn 044 mgGJ 037 051 Pulles et al (2012)
Note
For conversion of the US EPA data the values have been converted to NCV using a factor of 095 Furthermore
units have been converted using 10550559 JBTU and 45359237 glb
The factor for SOx is based on 01 mass sulphur content
Due to lack of data the BC emission factor refers to gas oil fired boilersThe TSP PM10 and PM25 emission factors
represent filterable PM emissions Note that a condensable PM emission factor is also provided in US EPA (2000)
Chapter 31
1A1 Energy industries
EMEPEEA air pollutant emission inventory guidebook 2019 34
Table 3-19 Tier 2 emission factors for source category 1A1a reciprocating engines using
gas oil
Tier 2 emission factors
Code Name
NFR Source Category 1A1a Public electricity and heat production
Fuel Gas Oil
SNAP (if applicable) 010105 Public power - Stationary engines
TechnologiesPractices Large stationary CI reciprocating engines
Region or regional
conditions
NA
Abatement technologies NA
Not applicable
Not estimated NH3
Pollutant Value Unit 95 confidence
interval
Reference
Lower Upper
NOx 942 gGJ 500 1380 Nielsen et al 2010
CO 130 gGJ 30 230 Nielsen et al 2010
NMVOC 371 gGJ 185 556 US EPA (1996) chapter 34
SOx 465 gGJ 465 465 See Note
TSP 281 gGJ 141 562 US EPA (1996) chapter 34
PM10 224 gGJ 112 448 US EPA (1996) chapter 34
PM25 217 gGJ 108 434 US EPA (1996) chapter 34
BC 78 of PM25 63 93 Hernandez et al 2004
Pb 407 mgGJ 041 407 US EPA (2010) chapter 13
Cd 136 mgGJ 014 136 US EPA (2010) chapter 13
Hg 136 mgGJ 014 136 US EPA (2010) chapter 13
As 181 mgGJ 018 181 US EPA (2010) chapter 13
Cr 136 mgGJ 014 136 US EPA (2010) chapter 13
Cu 272 mgGJ 027 271 US EPA (2010) chapter 13
Ni 136 mgGJ 014 136 US EPA (2010) chapter 13
Se 679 mgGJ 068 679 US EPA (2010) chapter 13
Zn 181 mgGJ 018 181 US EPA (2010) chapter 13
PCDDF 099 ng I-
TEQGJ
01 10 Nielsen et al 2010
HCB 022 microgGJ 0022 22 Nielsen et al 2010
PCBs 013 ng I-
TEQGJ
0013 13 Nielsen et al 2010
Benzo(a)pyrene 0116 mgGJ 00582 0116 US EPA (1996) chapter 34
(Less than value based on
method detection limits)
Benzo(b)fluoranthene 0502 mgGJ 0251 0754 US EPA (1996) chapter 34
Benzo(k)fluoranthene 00987 mgGJ 00493 00987 US EPA (1996) chapter 34
(Less than value based on
method detection limits)
Indeno(123-cd)pyrene 0187 mgGJ 00937 0187 US EPA (1996) chapter 34
(Less than value based on
method detection limits)
Notes
For conversion of the US EPA data the values have been converted to NCV using a factor of 095 Furthermore
units have been converted using 10550559 JBTU and 45359237 glb
The factor for SOx assumes no SO2 abatement and is based on 01 mass sulphur content using EF calculation
from subsection 3422 of the present chapterThe TSP PM10 and PM25 emission factors represent filterable PM
emissions Note that a condensable PM emission factor is also provided in US EPA (1996) Chapter 34
1A1 Energy industries
EMEPEEA air pollutant emission inventory guidebook 2019 35
Table 3-20 Tier 2 emission factors for source category 1A1a reciprocating engines using
natural gas
Tier 2 emission factors
Code Name
NFR Source Category 1A1a Public electricity and heat production
Fuel Natural gas
SNAP (if applicable) 010105 Public power - Stationary engines
TechnologiesPractices Stationary reciprocating Engines - gas-fired
Region or regional
conditions
NA
Abatement technologies NA
Not applicable
Not estimated NH3 PCBs HCB
Pollutant Value Unit 95 confidence
interval
Reference
Lower Upper
NOx 135 gGJ 65 200 Nielsen et al 2010
CO 56 gGJ 20 135 Nielsen et al 2010
NMVOC 89 gGJ 45 135 Nielsen et al 2010
SO2 05 gGJ 01 1 BUWAL 2001
TSP 2 gGJ 1 3 BUWAL 2001
PM10 2 gGJ 1 3 BUWAL 2001
PM25 2 gGJ 1 3 BUWAL 2001
BC 25 of PM25 1 63 See Note
Pb 004 mgGJ 0008 02 Nielsen et al 2010
Cd 0003 mgGJ 00006 0015 Nielsen et al 2010
Hg 01 mgGJ 002 05 Nielsen et al 2010
As 005 mgGJ 001 025 Nielsen et al 2010
Cr 005 mgGJ 001 025 Nielsen et al 2010
Cu 001 mgGJ 0002 005 Nielsen et al 2010
Ni 005 mgGJ 001 025 Nielsen et al 2010
Se 02 mgGJ 004 1 Nielsen et al 2010
Zn 291 mgGJ 06 146 Nielsen et al 2010
PCDDF 057 ng I-TEQGJ 028 12 Nielsen et al 2010
Benzo(a)pyrene 120 microgGJ 024 6 Nielsen et al 2010
Benzo(b)fluoranthene 900 microgGJ 18 45 Nielsen et al 2010
Benzo(k)fluoranthene 170 microgGJ 034 85 Nielsen et al 2010
Indeno(123-cd)pyrene 180 microgGJ 036 9 Nielsen et al 2010
Notes
SO2 emission factor can also be calculated using EF calculation from subsection 3422 of the present chapter
The BC emission factor is the average of the data available in England et al (2004) Wien et al (2004) and the
Speciate database (US EPA 2011)
The basis of the TSP PM10 and PM25 emission factors could not be determined in the reference
1A1 Energy industries
EMEPEEA air pollutant emission inventory guidebook 2019 36
3433 Abatement
A number of technologies exist that are aimed at reducing the emissions of specific pollutants The
resulting emission can be calculated by applying an abated emission factor as given in the formula
unabatedtechnologyabatementabatedtechnology EFEF )1( (5)
However this approach requires knowledge of emissions for the unabated or lsquobaselinersquo technology
and abatement efficiency which may be difficult to obtain
Abatement performance is rarely expressed in terms of efficiency but in terms of the achievable or
guaranteed emission concentration (for example to achieve compliance with an emission limit
value) Assessment of abatement performance is almost always determined by measurement of
emitted concentrations To allow users to assess if the Tier 2 emission factors for technologies can
be reasonably applied to their country subsection 63 Verification of the present chapter provides
guidance on conversion of emission concentrations (measured concentrations or emission limit
values) into emission factors for selected fuels
3434 Activity data
Information on the production of power which is suitable for estimating emissions using the
simpler estimation methodology (Tier 1 and 2) is available from national statistics agencies or the
International Energy Agency (IEA)
Further guidance is provided in the 2006 IPCC Guidelines for National Greenhouse Gas Inventories
volume 2 on Stationary Combustion wwwipcc-
nggipigesorjppublic2006glpdf2_Volume2V2_2_Ch2_Stationary_Combustionpdf
For a Tier 2 approach these data need to be stratified according to technologies applied Typical
sources for this data might be industrial or regulatory organisations within the country or from
specific questionnaires to the individual combustion installations
344 Tier 3 use of facility-specific data
3441 Algorithm
Where facility-level emission data of sufficient quality (see Chapter 3 Data collection in part A) are
available it is good practice to use these data There are two possibilities
the facility reports cover all relevant combustion processes in the country
facility-level emission reports are not available for all relevant combustion processes in the
country
If facility-level data are available covering all activities in the country the implied emission factors
(reported emissions divided by the national fuel use) should be compared with the default emission
factor values or technology-specific emission factors If the implied emission factors are outside the
95 confidence intervals for the values given it is good practice to explain the reasons for this in
the inventory report
Depending on the specific national circumstances and the coverage of the facility-level reports as
compared to the total combustion activity the emission factor (EF) in this equation should be chosen
from the following possibilities in decreasing order of preference
1A1 Energy industries
EMEPEEA air pollutant emission inventory guidebook 2019 37
technology-specific emission factors based on knowledge of the types of technologies
implemented at the facilities where facility-level emission reports are not available
the implied emission factor derived from the available emission reports
Facilities
Facility
Facilities
pollutantFacility
Production
E
EF
(7)
the default Tier 1 emission factor This option should only be chosen if the facility-level emission
reports cover more than 90 of the total national production
Sources of emission factor guidance for facilities include the USEPA (USEPA AP-42) BREF and
industry sector guidance (for example Eurelectric (The Union of the Electricity Industry) 2008)
Emission concentration data and ELVs can also be used by inventory compilers to develop emission
factors (Appendix E) The older versions of the Guidebook also provided a range of emission factors
which may be of use and these are provided at Appendix F
3442 Tier 3 use of facility data
Many combustion installations are major facilities and emission data for individual plants might be
available through a pollutant release and transfer registry (PRTR) or another national emission
reporting scheme The electricity sector is developing guidance on estimating emissions (Eurelectric
2008) When the quality of such data is assured by a well developed QAQC system and the emission
reports have been verified by an independent auditing scheme it is good practice to use such data
If extrapolation is needed to cover all activity in the country either the implied emission factors for
the facilities that did report or the emission factors as provided above could be used (see
subsection 3432)
3443 Activity data
Since PRTR generally do not report activity data such data in relation to the reported facility-level
emissions are sometimes difficult to find A possible source of facility-level activity might be the
registries of emission trading systems
In many countries national statistics offices collect production data on facility level but these are in
many cases confidential However in several countries national statistics offices are part of the
national emission inventory systems and the extrapolation if needed could be performed at the
statistics office ensuring that confidentiality of production data is maintained
1A1 Energy industries
EMEPEEA air pollutant emission inventory guidebook 2019 38
4 1A1b Petroleum refining
41 Techniques
Details of technologies used in this activity can be found within the Best Available Techniques
Reference Note (BREF) for refining installations (EIPPCB 2015)
411 Process energy
Refineries require electrical and thermal energy in substantial quantities Electrical and thermal
energy is typically generated by combined heat and power (CHP) or cogeneration facilities at the
refinery Thermal energy can be provided directly (process furnaces on the production unit) or via
steam produced within the production unit or from a utilities facility The technologies for production
of energy from combustion can be identical to those for 1A1a activities but in many instances the
difference will be that the fuels utilised will be refinery gaseous and liquid fuels Where non-refinery
fuels are used in combustion processes the information provided in the 1A1a activity can be
applied
412 Production activities
Many production activities incorporate process furnaces to heat feedstock these may use refinery
fuels and recover refinery by-products and these will have associated combustion emissions
Incineration and flaring of refinery by-products are other combustion activities (see Chapter 1B2c)
In addition process sources include bitumen blowing blowdown systems hydrogen plant fluid
coking units fluidised catalytic cracking (FCC) units and catalytic reforming units (see Chapter
1B2aiv)
42 Emissions
Note that the inventory methodologies for Greenhouse gas emissions (carbon dioxide methame
and nitrous oxide) are not included ndash refer to IPCC guidance [IPCC 2006]
42111 Sulphur oxides
Most emissions arise from process furnaces boilers sulphur recovery units FCC regenerators
flares incinerators and decoking units In the absence of flue gas desulphurisation (FGD) technology
the emissions of sulphur oxides (SOx) are directly related to the sulphur content of the fuel The
majority of SOx is sulphur dioxide (SO2) although small proportions of sulphur trioxide (SO3) can
arise
42112 Nitrogen oxides
Emissions of nitrogen oxides (nitric oxide and nitrogen dioxide mdash NOx) arise primarily from
combustion and the FCC unit Combustion control can provide a high degree of NOx emission control
(low NOx burner technology) and this may be supplemented by use of selective catalytic reduction
(SCR) or selective non catalytic reduction techniques (SNCR)
42113 Non-methane volatile organic compounds (NMVOC)
Emissions of non-methane volatile organic compounds (NMVOC) can result from combustion
activities (including flaring) and process discharges such as vents and blowdown systems However
many emission sources on refineries tend to be fugitive releases (See chapter 1B2aiv)
1A1 Energy industries
EMEPEEA air pollutant emission inventory guidebook 2019 39
42114 Carbon monoxide (CO)
Apart from combustion flaring and incineration activities the FCC and catalytic reforming units can
produce CO but include CO boilers (thermal oxidisers) to control emissions
42115 Ammonia (NH3)
Emissions can result from incomplete reaction of NH3 additive in NOx abatement systems mdash
selective catalytic and non-catalytic reduction (SCR and SNCR) Regenerators for FCC units may emit
ammonia but these emissions are eliminated by use of CO boilers In addition refrigeration systems
which use ammonia may have an associated emission
42116 Particulate matter
Particulate matter (PM) emissions from refinery operations are associated with combustion
activities and selected production units including coking units and fluid catalytic cracking units
Note that PM emission factors in the Guidebook represent primary emissions from the activities and
not formation of secondary aerosol from chemical reaction in the atmosphere after release
A number of factors influence the measurement and determination of primary PM emissions from
activities and the quantity of PM determined in an emission measurement depends to a large extent
on the measurement conditions This is particularly true of activities involving high temperature and
semi-volatile emission components ndash in such instances the PM emission may be partitioned between
a solidaerosol phase and material which is gaseous at the sampling point but which can condense
in the atmosphere The proportion of filterable and condensable material will vary depending on the
temperature of the flue gases and in sampling equipment
A range of filterable PM measurement methods are applied around the world typically with filter
temperatures of 70-160degC (the temperature is set by the test method) Condensable fractions can
be determined directly by recovering condensed material from chilled impinger systems
downstream of a filter ndash note that this is condensation without dilution and can require additional
processing to remove sampling artefacts Another approach for total PM includes dilution where
sampled flue or exhaust gases are mixed with ambient air (either using a dilution tunnel or dilution
sampling systems) and the filterable and condensable components are collected on a filter at lower
temperatures (but depending on the method this can be 15-52degC) The use of dilution methods for
routine measurements on refinery stacks however is limited due to practical constraints with
weight andor size of the equipment
The Guidebook identifies whether the PM emission factors (for TSP PM10 and PM25) represent total
PM filterable PM or whether the basis of the emission factor cannot be determined (see individual
emission factor tables)
42117 Metals
According to the BREF important heavy metals in crude oils are As Hg Ni and V Concawe (Concawe
2015) also present methodologies for Cd Cr Cu Pb and Zn with sources from combustion
incineration of gaseous streams FCC regenerators and fluid coking Nickel and vanadium tend to be
enriched in residues from distillation
1A1 Energy industries
EMEPEEA air pollutant emission inventory guidebook 2019 40
43 Controls
Details of relevant abatement technologies are described in the BREF notes for refineries and large
combustion plant httpeippcbjrceceuropaeureference Relevant abatement technologies for
refinery combustion units are described in 1A1a In general end of pipe treatment of FCC units
tends to be similar to the controls for combustion plant
44 Methods
441 Choice of method
Figure 4-1 presents the procedure to select the methods for estimating process emissions from
petroleum refining The basic idea is
if detailed information is available use it
if the source category is a key source a Tier 2 or better method must be applied and detailed
input data must be collected The decision tree directs the user in such cases to the Tier 2
method since it is expected that it is more easy to obtain the necessary input data for this
approach than to collect facility-level data needed for a Tier 3 estimate
the alternative of applying a Tier 3 method using detailed process modelling is not explicitly
included in this decision tree However detailed modelling will always be done at facility level
and results of such modelling could be seen as lsquofacility datarsquo in the decision tree
1A1 Energy industries
EMEPEEA air pollutant emission inventory guidebook 2019 41
Figure 4-1 Decision tree for combustion in petroleum refining
442 Tier 1 default approach
4421 Algorithm
The Tier 1 approach for process emissions from combustion uses the general equation
pollutantptionfuelconsumpollutant EFARE (1)
Epollutant annual emission of pollutant
EFpollutant emission factor of pollutant
ARfuel consumption activity rate by fuel consumption
This equation is applied at the national level using annual national total fuel use (disaggregated by
fuel type) Information on fuel consumption suitable for estimating emissions using the simpler
estimation methodology is widely available from UN statistical yearbooks or national statistics
Start
Are all single
sources in the source
category Measured
reported
Use Tier 3
Facility data
only
Is a detailed
estimation model
available
Use Tier 2
technology specific
activity data
and EFs
Key source
Get
technology stratified
activity data
and EFs
Apply Tier 1
default EFs
Yes
Yes
Yes
Yes
No
No
Is specific fuel
use data available
for the source
Use measurements Tier
3 approach and
combine with country
specific EFs from Tier 2
Can modelled fuel
consumption be reconciled
with national fuel statistics
from independent
sources
Use model Tier 3
approach
No
No
No
Yes
1A1 Energy industries
EMEPEEA air pollutant emission inventory guidebook 2019 42
The Tier 1 emission factors generally assume an average or typical technology and abatement
implementation However emission factors for this chapter reflect unabated emissions
In cases where specific abatement techniques are to be taken into account a Tier 1 method is not
applicable and a Tier 2 or Tier 3 approach must be used
4422 Default emission factors
The default emission factors for combustion activities at Tier 1 are based on fuel types including fuel
types common with the 1A1a activity As most combustion is in process furnaces without contact
with the material being heated Tier 1 default factors for refinery combustion can often be drawn
from the 1A1a Tier 1 default factors classifications (see Table 4-1)
Table 4-1 Tier 1 fuel classifications
Tier 1 fuel type Associated fuel types Location
Natural gas Natural gas See 1Ala Tier 1
Heavy fuel oil Residual fuel oil refinery feedstock
petroleum coke
See 1A1a Tier 1
Other liquid fuels (a) Gas oil kerosene naphtha natural gas
liquids liquefied petroleum gas
orimulsion bitumen shale oil
(b) refinery gas
(a) See 1A1a Tier 1
(b) Table 4-2
The Tier 1 default emission factors for refinery gas as given in
1A1 Energy industries
EMEPEEA air pollutant emission inventory guidebook 2019 43
Table 4-2 have been derived from emission factors published by USEPA (USEPA 1998) and elsewhere
including factors incorporated by the industry sector (Concawe 2015) In the absence of detail on
relative use of combustion or abatement technology which will be different for each country the
proposed factors represent a mean of unabated emissions for the range of combustion technologies
in use with the 95 figures a measure of the range of unabated emissions in the sector
An emission factor for sulphur oxides is provided in the Tier 1 table but this is based on a range of
published factors some of which represent very different sulphur levels in the fuels Where countries
have knowledge of fuel sulphur content then it is recommended that a sulphur oxides emission
factor is calculated from fuel sulphur content
1A1 Energy industries
EMEPEEA air pollutant emission inventory guidebook 2019 44
Table 4-2 Tier 1 emission factors for source category 1A1b refinery gas
Tier 1 default emission factors
Code Name
NFR Source Category 1A1b Petroleum refining
Fuel Refinery Gas
Not applicable
Not estimated NH3 PCDDF HCB
Pollutant Value Unit 95 confidence
interval
Reference
Lower Upper
NOx 63 gGJ 315 844 US EPA (1998) chapter 14
CO 121 gGJ 73 17 Concawe (2015)
NMVOC 258 gGJ 129 515 US EPA (1998) chapter 14
SOx 0281 gGJ 0169 0393 US EPA (1998) chapter 14
TSP 089 gGJ 0297 267 US EPA (1998) chapter 14
PM10 089 gGJ 0297 267 US EPA (1998) chapter 14
PM25 089 gGJ 0297 267 US EPA (1998) chapter 14
BC 184 of PM25 52 363 US EPA 2011
Pb 161 mgGJ 12 21 Concawe Report 916
Cd 219 mgGJ 06 38 Concawe Report 916
Hg 0372 mgGJ 02 05 Concawe Report 916
As 0352 mgGJ 03 04 Concawe Report 916
Cr 669 mgGJ 03 131 Concawe Report 916
Cu 329 mgGJ 24 42 Concawe Report 916
Ni 737 mgGJ 16 131 Concawe Report 916
Se 156 mgGJ 11 20 Concawe Report 916
Zn 170 mgGJ 120 220 Concawe Report 916
Benzo(a)pyrene 0669 microgGJ 0223 201 API (1998 2002)
Benzo(b)fluoranthene 114 microgGJ 0379 341 API (1998 2002)
Benzo(k)fluoranthene 0631 microgGJ 021 189 API (1998 2002)
Indeno(123-cd)pyrene 0631 microgGJ 021 189 API (1998 2002)
Note
The factor for SOx is based on approximately 001 gm3 mass sulphur content SO2 emission factor can also be
calculated using EF calculation from subsection 3422 of the present chapter
These PM factors represent filterable PM emissions only (excluding any condensable fraction)
If a Tier 1 approach is adopted for the process emissions (Chapter 1B2aiv) combustion emissions
are already covered and should not be reported again in Chapter 1A1b since this would lead to
double counting
4423 Tier 1 activity data
Information on the use of energy suitable for estimating emissions using the Tier 1 simpler
estimation methodology is available from national statistics agencies or the International Energy
Agency (IEA)
Further guidance is provided in the 2006 IPCC Guidelines for National Greenhouse Gas Inventories
volume 2 on Stationary Combustion
wwwipcc-nggipigesorjppublic2006glpdf2_Volume2V2_2_Ch2_Stationary_Combustionpdf
The activity rate and the emission factor have to be determined on the same level of aggregation
depending on the availability of data The activity statistic should be determined within the
considered country or region by using adequate statistics The activity should refer to the energy
input of the emission sources considered (net or inferior fuel consumption in [GJ])
1A1 Energy industries
EMEPEEA air pollutant emission inventory guidebook 2019 45
443 Tier 2 technology-specific approach
4431 Algorithm
The Tier 2 approach is similar to the Tier 1 approach To apply the Tier 2 approach both the activity
data and the emission factors need to be applied according to a countryrsquos installed combustion and
abatement technologies These techniques may include
types of refinery
capacities of refineries
implementation of abatement technologies in the country
There are two approaches possible
disaggregate the fuel use in the country to model the different combustion and abatement types
into the inventory by
o defining the activity data using each of the identified process types (together called
lsquotechnologiesrsquo in the formulae below) separately and
o applying technology-specific emission factors for each process type
estechnologi
pollutanttechnologytechnologyproductionpollutant EFARE (2)
develop country-specific emission factors from the understanding of the relative contributions of
the different technologies within the national combustion plant portfolio (and relative fuel use)
and apply this country-specific emission factor for the national fuel use
pollutantcountryproductionpollutant
estechnologi
pollutanttechnologytechnologypollutantcountry
EFARE
EFnPenetratioEF
(3)
Both approaches are mathematically very similar or even identical Using one or the other approach
depends mainly on the availability of data If the activity data are indeed available the first approach
seems to be more appropriate If however no direct activity data are available penetration of
different technologies within the industry could be estimated from data on capacities or other
surrogate data that reflect relative sizes of facilities using the different technologies
4432 Technology-specific emission factors
Applying a Tier 2 approach for the process emissions from refineries technology-specific emission
factors are needed Examples are provided in this section The BREF document for refineries is
available at httpeippcbjrceceuropaeureference and provides guidance on achievable emission
levels Emission factors derived from the achievable emission levels values (AELs) as defined in the
BREF document are provided for comparison in subsection 631
This section provides a series of technology-specific pollutant emission factors for combustion units
eg boilers and process heaters and furnaces these factors represent a wider range of fuels and
combustion technologies than for Tier 1 They do not represent specific combustion technologies
but do offer more disaggregation than Tier 1 Many of the factors have been included in the industry
1A1 Energy industries
EMEPEEA air pollutant emission inventory guidebook 2019 46
guidance for estimating facility releases for E-PRTR (Concawe 2015) and represent unabated
emission factors
Emission factors for sulphur oxides are provided in the Tier 2 tables Where countries have
knowledge of fuel sulphur content and of abatement technologies then it is recommended that a
sulphur oxides emission factor is calculated from fuel sulphur content taking into account
abatement efficiency
A methodology to calculate NOx emissions has been provided in Concawe 2015 as the sectorrsquos
recommended method for refineries to use for emission reporting However NOx formation is very
complex and depends on a number of parameters (for example hydrogen content humidity burner
intensity) which may not be available for a Tier 2 methodology
Extension of Tier 2 to reflect emission abatement is possible through use of factors derived from
emission data For emission factors specific to gas turbines please see 1A1a subsection 3432
Tier 2 emission factor tables of the present chapter
If LPG is used the emission factors presented for natural gas should be used when estimating
emissions
A summary of the Tier 2 factors is provided in Table 4-3
Table 4-3 Tier 2 default factors
Technology Associated fuel types Location of Tier 2 factors
Process furnaces Residual oil Table 4-4
Gas oil Table 4-5
Refinery gas See Tier 1 (Table 4-2)
Natural gas Table 4-7
Gas turbines Various See Section 1A1a
Gas engines Natural gas Table 4-7
Compression ignition engines Gas oil Table 4-8
1A1 Energy industries
EMEPEEA air pollutant emission inventory guidebook 2019 47
Table 4-4 Tier 2 emission factors for source category 1A1b process furnaces using
residual oil
Tier 2 emission factors
Code Name
NFR Source Category 1A1b Petroleum refining
Fuel Residual Oil (Refinery Fuel Oil)
SNAP (if applicable) 0103 Petroleum refining plants
TechnologiesPractices Process Furnaces Heaters and Boilers
Region or regional
conditions
NA
Abatement
technologies
NA
Not applicable
Not estimated NH3 Benzo(a)pyrene Benzo(k)fluoranthene Indeno(123-cd)pyrene PCBs HCB
Pollutant Value Unit 95 confidence
interval
Reference
Lower Upper
NOx 142 gGJ 71 284 US EPA (1998) chapter 13
CO 6 gGJ 36 84 Concawe (2015)
NMVOC 23 gGJ 0676 409 US EPA (1998) chapter 13
SOx 485 gGJ 146 1700 See Note
TSP 20 gGJ 12 28 Visschedijk et al (2004)
PM10 15 gGJ 9 21 Visschedijk et al (2004)
PM25 9 gGJ 54 126 Visschedijk et al (2004)
BC 56 of PM25 022 869 See Note
Pb 46 mgGJ 09 23 US EPA (1998) chapter 13
Cd 12 mgGJ 024 6 US EPA (1998) chapter 13
Hg 03 mgGJ 003 06 US EPA (1998) chapter 13
As 398 mgGJ 0796 199 US EPA (1998) chapter 13
Cr 148 mgGJ 296 74 API (1998 2002)
Cu 119 mgGJ 238 595 API (1998 2002)
Ni 773 mgGJ 647 900 Concawe Report 916
Se 21 mgGJ 040 105 US EPA (1998) chapter 13
Zn 493 mgGJ 986 247 API (1998 2002)
PCDDF 25 ng I-
TEQGJ
125 375 UNEP (2005) Heavy fuel fired power
boilers
Benzo(b)fluoranthene 37 microgGJ 074 185 API (1998 2002)
Note
The factor for SOx assumes no SO2 abatement and is based on 1 mass sulphur content using EF calculation
from subsection 3422 of the present chapter 95 confidence intervals calculated using range from Table C-1
in Appendix C
The BC emission factor is derived as the average of the data found in Olmez et al (1988) England et al (2007)
and the Speciate database (US EPA 2011)
For benzo(a)pyrene benzo(k)fluoranthene and indeno(123-cd)pyrene all measurements reported by API (1998)
were below the detection limit Using this the EFs would be 060 020 and 13 microgGJ respectively
These PM factors represent filterable PM emissions
1A1 Energy industries
EMEPEEA air pollutant emission inventory guidebook 2019 48
Table 4-5 Tier 2 emission factors for source category 1A1b process furnaces using gas oil
Tier 2 emission factors
Code Name
NFR Source Category 1A1b Petroleum refining
Fuel Gas Oil
SNAP (if applicable) 0103 Petroleum refining plants
TechnologiesPractices Process Furnaces Heaters and Boilers
Region or regional
conditions
NA
Abatement
technologies
NA
Not applicable
Not estimated NH3 PCDDF Benzo(a)pyrene Benzo(b)fluoranthene Benzo(k)fluoranthene
Indeno(123-cd)pyrene PCBs HCB
Pollutant Value Unit 95 confidence
interval
Reference
Lower Upper
NOx 65 gGJ 325 975 US EPA (1998) chapter 13
CO 162 gGJ 54 50 US EPA (1998) chapter 13
NMVOC 065 gGJ 022 195 US EPA (1998) chapter 13
Sox 461 gGJ 369 460 See Note
TSP 647 gGJ 129 323 US EPA (1998) chapter 13
PM10 323 gGJ 0647 162 US EPA (1998) chapter 13
PM25 0808 gGJ 0162 404 US EPA (1998) chapter 13
BC 335 of
PM25
289 38 Hildemann et al 1981 amp Bond et al
2006
Pb 407 mgGJ 204 814 US EPA (1998) chapter 13
Cd 136 mgGJ 068 272 US EPA (1998) chapter 13
Hg 136 mgGJ 068 272 US EPA (1998) chapter 13
As 181 mgGJ 0905 362 US EPA (1998) chapter 13
Cr 136 mgGJ 068 272 US EPA (1998) chapter 13
Cu 272 mgGJ 136 544 US EPA (1998) chapter 13
Ni 136 mgGJ 068 272 US EPA (1998) chapter 13
Se 679 mgGJ 068 679 US EPA (1998) chapter 13
Zn 181 mgGJ 0905 362 US EPA (1998) chapter 13
Note
Based on 01 mass sulphur content
These PM factors represent filterable PM emissions only (excluding any condensable fraction)
1A1 Energy industries
EMEPEEA air pollutant emission inventory guidebook 2019 49
Table 4-6 Tier 2 emission factors for source category 1A1b process furnaces using
natural gas
Tier 2 emission factors
Code Name
NFR Source Category 1A1b Petroleum refining
Fuel Natural Gas
SNAP (if applicable) 0103 Petroleum refining plants
TechnologiesPractices Process Furnaces Heaters and Boilers
Region or regional
conditions
NA
Abatement
technologies
NA
Not applicable
Not estimated NH3 PCDDF PCBs HCB
Pollutant Value Unit 95 confidence
interval
Reference
Lower Upper
NOx 63 gGJ 315 844 US EPA (1998) chapter 14
CO 393 gGJ 236 551 US EPA (1998) chapter 14
NMVOC 258 gGJ 129 516 US EPA (1998) chapter 14
SOx 0281 gGJ 0169 0393 US EPA (1998) chapter 14
TSP 089 gGJ 0297 267 US EPA (1998) chapter 14
PM10 089 gGJ 0297 267 US EPA (1998) chapter 14
PM25 089 gGJ 0297 267 US EPA (1998) chapter 14
BC 86 of
PM25
43 172 Wien et al 2004
Pb 00015 mgGJ 00005 00045 Nielsen et al 2012
Cd 000025 mgGJ 000008 000075 Nielsen et al 2012
Hg 01 mgGJ 001 1 Nielsen et al 2010
As 012 mgGJ 004 036 Nielsen et al 2012
Cr 000076 mgGJ 000025 000228 Nielsen et al 2012
Cu 0000076 mgGJ 0000025 0000228 Nielsen et al 2012
Ni 000051 mgGJ 000017 000153 Nielsen et al 2012
Se 00112 mgGJ 000375 00337 US EPA (1998) chapter 14
Zn 00015 mgGJ 00005 00045 Nielsen et al 2012
Benzo(a)pyrene 056 microgGJ 019 056 US EPA (1998) chapter 14
(Less than value based
on method detection
limits)
Benzo(b)fluoranthene 084 microgGJ 028 084 US EPA (1998) chapter 14
(Less than value based
on method detection
limits)
Benzo(k)fluoranthene 084 microgGJ 028 084 US EPA (1998) chapter 14
(Less than value based
on method detection
limits)
Indeno(123-cd)pyrene 084 microgGJ 028 084 US EPA (1998) chapter 14
(Less than value based
on method detection
limits)
Note
The factor for SOx is based on approximately 001 gm3 mass sulphur content SO2 emission factor can also be
calculated using EF calculation from subsection 3422 of the present chapter
It must be noted that the Hg content (and other heavy metals) of natural gas varies between gas fields However
the differences after natural gas processing is thought to be of minor importance The US EPA (1998) provides an
1A1 Energy industries
EMEPEEA air pollutant emission inventory guidebook 2019 50
emission factor of 01 mgGJ It is encouraged that countries obtain country specific data for the natural gas based
on the origin
These PM factors represent filterable PM emissions only (excluding any condensable fraction)
Table 4-7 Tier 2 emission factors for source category 1A1b stationary engines using
natural gas
Tier 2 emission factors
Code Name
NFR Source Category 1A1b Petroleum refining
Fuel Natural Gas
SNAP (if applicable) 010305 Petroleum refining - Stationary engines
TechnologiesPractices 4-stroke lean burn gas engines
Region or regional
conditions
NA
Abatement technologies NA
Not applicable
Not estimated NH3 PCDDF PCBs HCB
Pollutant Value Unit 95 confidence
interval
Reference
Lower Upper
NOx 405 gGJ 200 810 US EPA (2000) chapter 32
CO 266 gGJ 130 530 US EPA (2000) chapter 32
NMVOC 56 gGJ 30 110 US EPA (2000) chapter 32
SOx 0281 gGJ 0169 0393 US EPA (2000) chapter 32
TSP 0037 gGJ 0003 037 US EPA (2000) chapter 32
PM10 0037 gGJ 0003 037 US EPA (2000) chapter 32
PM25 0037 gGJ 0003 037 US EPA (2000) chapter 32
BC 25 of PM25 1 63 See Note
Pb 004 mgGJ 0013 012 Nielsen et al 2010
Cd 0003 mgGJ 0001 0009 Nielsen et al 2010
Hg 01 mgGJ 003 03 Nielsen et al 2010
As 005 mgGJ 0017 015 Nielsen et al 2010
Cr 005 mgGJ 0017 015 Nielsen et al 2010
Cu 001 mgGJ 0003 003 Nielsen et al 2010
Ni 005 mgGJ 0017 015 Nielsen et al 2010
Se 02 mgGJ 007 06 Nielsen et al 2010
Zn 291 mgGJ 097 873 Nielsen et al 2010
Benzo(a)pyrene 162 microgGJ 54 486 API (1998)
Benzo(b)fluoranthene 149 microgGJ 50 447 API (1998)
Benzo(k)fluoranthene 241 microgGJ 80 723 API (1998)
Indeno(123-cd)pyrene 545 microgGJ 175 158 API (1998)
Notes
It must be noted that the Hg content (and other heavy metals) of natural gas varies between gas fields The US
EPA (1998) provides an emission factor of 01 mgGJ It is encouraged that countries obtain country specific data
for the natural gas based on the origin Also the amount of lubricants oxidised during use can significantly
influence the emission factors of heavy metals
The factor for SOx is based on approximately 001 gm3 mass sulphur content SO2 emission factor can also be
calculated using EF calculation from subsection 3422 of the present chapter
The BC emission factor is the average of the data available in England et al (2004) Wien et al (2004) and the
Speciate database (US EPA 2011)
These PM factors represent filterable PM emissions only (excluding any condensable fraction)
1A1 Energy industries
EMEPEEA air pollutant emission inventory guidebook 2019 51
Table 4-8 Tier 2 emission factors for source category 1A1b diesel engines using gas oil
Tier 2 emission factors
Code Name
NFR Source Category 1A1b Petroleum refining
Fuel Gas Oil
SNAP (if applicable) 010305 Petroleum refining - Stationary engines
TechnologiesPractices Reciprocating Engines (compression injection)
Region or regional
conditions
NA
Abatement technologies NA
Not applicable
Not estimated NH3 PCDDF PCBs HCB
Pollutant Value Unit 95 confidence
interval
Reference
Lower Upper
NOx 942 gGJ 500 1380 Nielsen et al 2010
CO 130 gGJ 30 230 Nielsen et al 2010
NMVOC 371 gGJ 185 556 US EPA (1996) chapter 34
SOx 461 gGJ 461 461 See Note
TSP 281 gGJ 141 562 US EPA (1996) chapter 34
PM10 224 gGJ 112 448 US EPA (1996) chapter 34
PM25 217 gGJ 108 434 US EPA (1996) chapter 34
BC 78 of PM25 63 93 Hernandez et al 2004
Pb 407 mgGJ 041 407 US EPA (1998) chapter 13
Cd 136 mgGJ 014 136 US EPA (1998) chapter 13
Hg 136 mgGJ 014 136 US EPA (1998) chapter 13
As 181 mgGJ 018 181 US EPA (1998) chapter 13
Cr 136 mgGJ 014 136 US EPA (1998) chapter 13
Cu 272 mgGJ 027 271 US EPA (1998) chapter 13
Ni 136 mgGJ 014 136 US EPA (1998) chapter 13
Se 679 mgGJ 068 679 US EPA (1998) chapter 13
Zn 181 mgGJ 018 181 US EPA (1998) chapter 13
PCDDF 099 ng I-
TEQGJ
01 10 Nielsen et al 2010
HCB 022 microgGJ 0022 22 Nielsen et al 2010
PCBs 013 ng I-
TEQGJ
0013 13 Nielsen et al 2010
Benzo(a)pyrene 011 mgGJ 004 033 API 1998
Benzo(b)fluoranthene 049 mgGJ 016 147 API 1998
Benzo(k)fluoranthene 0096 mgGJ 0032 0288 API 1998
Indeno(123-cd)pyrene 018 mgGJ 006 054 API 1998
Notes
The factor for SOx assumes no SO2 abatement and is based on 01 mass sulphur content using EF calculation
from subsection 3422 of the present chapter
Emission factors for metals are based on factors for oil combustion in boilers
These PM factors represent filterable PM emissions only (excluding any condensable fraction)
4433 Activity data
Information on the refinery production suitable for estimating emissions using the simpler
estimation methodology (Tier 1 and 2) may be available from national statistics agencies or the
International Energy Agency (IEA)
1A1 Energy industries
EMEPEEA air pollutant emission inventory guidebook 2019 52
Further guidance is provided in the 2006 IPCC Guidelines for National Greenhouse Gas Inventories
volume 2 on Stationary Combustion
wwwipcc-nggipigesorjppublic2006glpdf2_Volume2V2_2_Ch2_Stationary_Combustionpdf
For a Tier 2 approach these data need to be stratified according to technologies applied Typical
sources for this data might be industrial or regulatory organisations within the country or from
specific questionnaires to the individual refineries
444 Tier 3 use of facility-specific data
4441 Algorithm
Where facility-level emission data of sufficient quality (see Chapter 3 Data collection in part A) are
available it is good practice to use these data There are two possibilities
the facility reports cover all refinery processes in the country
facility-level emission reports are not available for all the refinery processes
If facility-level data are available covering all activities in the country the implied emission factors
(reported emissions divided by the national fuel use) should be compared with the default emission
factor values or technology-specific emission factors If the implied emission factors are outside the
95 confidence intervals for the values given it is good practice to explain the reasons for this in
the inventory report
Depending on the specific national circumstances and the coverage of the facility-level reports as
compared to the total combustion activity the emission factor (EF) in this equation should be chosen
from the following possibilities in decreasing order of preference
technology-specific emission factors based on knowledge of the types of technologies
implemented at the facilities where facility-level emission reports are not available
the implied emission factor derived from the available emission reports
Facilities
Facility
Facilities
pollutantFacility
Production
E
EF
(7)
the default Tier 1 emission factor This option should only be chosen if the facility-level emission
reports cover more than 90 of the total national production
4442 Tier 3 emission modelling and use of facility data
Refinery installations are major facilities and emission data for individual plants could be available
through a pollutant release and transfer registry (PRTR) or another national emission reporting
scheme but possibly not for all pollutants When the quality of such data is assured by a well
developed QAQC system it is good practice to use such data Guidance on estimating refinery
emissions has been published by the industry sector [Concawe 2015] If extrapolation is needed to
cover all activity in the country either the implied emission factors for the facilities that did report
or the emission factors as provided above could be used (see subsection 3432 of the present
chapter)
1A1 Energy industries
EMEPEEA air pollutant emission inventory guidebook 2019 53
4443 Activity data
Since PRTR generally do not report activity data such data in relation to the reported facility-level
emissions are sometimes difficult to find A possible source of facility-level activity might be the
registries of emission trading systems
In many countries national statistics offices collect production data on facility level but these are in
many cases confidential However in several countries national statistics offices are part of the
national emission inventory systems and the extrapolation if needed could be performed at the
statistics office ensuring that confidentiality of production data is maintained
1A1 Energy industries
EMEPEEA air pollutant emission inventory guidebook 2019 54
5 1A1c Manufacture of solid fuels
and other energy industries
51 Techniques
Coke manufacture is mainly associated with iron and steel manufacture and details of technologies
used in this activity can be found within the Best Available Techniques Reference Note (BREF) for
Iron and Steel production [EIPPCB 2013] and within the USEPA guidance
Coke manufacture is a batch process with production occurring in a coke oven which is a battery of
ovens Coal is heated in a non-oxidising atmosphere (pyrolysis) The volatile components are driven
off to leave coke which is then pushed at high temperature from the oven into a rail car and taken
to a quench tower to stop oxidation in air Heating is provided by combustion of a portion of the
evolved gases following treatment to remove ammonia hydrogen sulphide tars and condensable
organic material Coke manufacture with by-product recovery includes process units to recover
condensed organic material and other by-products By-products are burnt in coke ovens which do
not have by-product recovery
52 Emissions
Note that the inventory methodologies for Greenhouse gas emissions (carbon dioxide methame
and nitrous oxide) are not included ndash refer to IPCC guidance [IPCC 2006]
52111 Sulphur oxides
Emissions arise from combustion of coke oven gas (COG) Gas is treated to removed H2S but residual
H2S is oxidised to form SO2
52112 Nitrogen oxides
Emissions of nitrogen oxides (nitric oxide and nitrogen dioxide mdash NOx) arise primarily from
combustion of COG
52113 Non-methane volatile organic compounds (NMVOC)
Emissions of non-methane volatile organic compounds (NMVOC) can result from combustion
activities and process discharges such as vents and blowdown systems However many emission
sources tend to be fugitive releases
52114 Carbon monoxide (CO)
Emissions arise from combustion activities and fugitive release of COG
52115 Particulate matter
Particulate matter (PM) emissions arise from combustion activities on the coke oven and materials
handling
53 Controls
Details- of relevant abatement technologies are described in the BREF note for iron and steel
production (httpeippcbjrceceuropaeureference) Control of SO2 emission is by removal of H2S
and other sulphurous material from the fuel gas
1A1 Energy industries
EMEPEEA air pollutant emission inventory guidebook 2019 55
54 Methods
541 Choice of method
Figure 5-1 presents the procedure to select the methods for estimating process emissions from
combustion in energy and transformation industries The basic idea is
if detailed information is available use it
if the source category is a key source a Tier 2 or better method must be applied and detailed
input data must be collected The decision tree directs the user in such cases to the Tier 2
method since it is expected that it is more easy to obtain the necessary input data for this
approach than to collect facility-level data needed for a Tier 3 estimate
the alternative of applying a Tier 3 method using detailed process modelling is not explicitly
included in this decision tree However detailed modelling will always be done at facility level
and results of such modelling could be seen as lsquoFacility datarsquo in the decision tree
Figure 5-1 Decision tree for combustion in manufacture of solid fuels
Start
Are all single
sources in the source
category Measured
reported
Use Tier 3
Facility data
only
Is a detailed
estimation model
available
Use Tier 2
technology specific
activity data
and EFs
Key source
Get
technology stratified
activity data
and EFs
Apply Tier 1
default EFs
Yes
Yes
Yes
Yes
No
No
Is specific fuel
use data available
for the source
Use measurements Tier
3 approach and
combine with country
specific EFs from Tier 2
Can modelled fuel
consumption be reconciled
with national fuel statistics
from independent
sources
Use model Tier 3
approach
No
No
No
Yes
1A1 Energy industries
EMEPEEA air pollutant emission inventory guidebook 2019 56
542 Tier 1 default approach
5421 Algorithm
The Tier 1 approach for process emissions from combustion uses the general equation
pollutantptionfuelconsumpollutant EFARE (1)
where
Epollutant = annual emission of pollutant
EFpollutant = emission factor of pollutant
ARfuel consumption = activity rate by coal consumption coke or iron production
This equation is applied at the national level using annual national coal use (disaggregated by
industrial sector) Information on fuel consumption suitable for estimating emissions using the
simpler estimation methodology is widely available from UN statistical yearbooks or national
statistics
The Tier 1 emission factors assume an average or typical technology and abatement
implementation
In cases where specific abatement techniques are to be taken into account a Tier 1 method is not
applicable and a Tier 2 or Tier 3 approach must be used
5422 Default emission factors
The Tier 1 default emission factors for process and combustion emissions are given in
1A1 Energy industries
EMEPEEA air pollutant emission inventory guidebook 2019 57
Table 5-1 and have been derived from emission factors provided in USEPA guidance The factors are
based on coal use expressed in terms of net energy content The factors include combustion and
process emissions from coke batteries including combustion stacks and preheater Emissions from
soaking decarbonisation charging door and lid leaks off-take leaks quenching and pushing are
included in Chapter 1B1b Fugitive emissions from solid fuels solid fuel transformation In the
absence of detail on relative use of coke oven types or abatement technology which will be different
for each country the proposed factors represent a mean for the range of technologies in use with
the 95 figures a measure of the range of emissions in the sector
1A1 Energy industries
EMEPEEA air pollutant emission inventory guidebook 2019 58
Table 5-1 Tier 1 emission factors for source category 1A1c
Tier 1 default emission factors
Code Name
NFR Source Category 1A1c Manufacture of solid fuels and other energy industries
Fuel Coal
Not applicable PCBs HCB
Not estimated NH3BC
Pollutant Value Unit 95 confidence
interval
Reference
Lower Upper
NOx 21 gGJ 115 42 See note
CO 6 gGJ 3 12 See note
NMVOC 08 gGJ 008 81 See note
SOx 91 gGJ 60 120 See note
TSP 82 gGJ 40 160 See note
PM10 79 gGJ 40 160 See note
PM25 55 gGJ 28 110 See note
Pb 28 mgGJ 592 145 See note
Cd 16 mgGJ 032 9 See note
Hg 30 mgGJ 6 150 See note
As 11 mgGJ 22 55 See note
Cr 57 mgGJ 118 295 See note
Cu 25 mgGJ 5 125 See note
Ni 52 mgGJ 11 26 See note
Se 29 mgGJ 06 15 See note
Zn 46 mgGJ 94 235 See note
PCDDF 26 ng I-
TEQGJ
52 130 See note
Benzo(a)pyrene 029 mgGJ 0066 165 See note
Benzo(b)fluoranthene 0003 mgGJ 00006 0015 See note
Benzo(k)fluoranthene 0001 mgGJ 00002 0005 See note
Indeno(123-cd)pyrene 0001 mgGJ 00002 0005 See note
Note
The tier 1 emission factors are calculated as an average of the tier 2 emission factors The tier 2 emission factors
have been converted using a NCV of 282 GJMg
The basis of the TSP PM10 and PM25 emission factors could not be determined in the reference
5423 Tier 1 Activity Data
Information on the use of energy suitable for estimating emissions using the Tier 1 simpler
estimation methodology is available from national statistics agencies or the International Energy
Agency (IEA)
Further guidance is provided in the 2006 IPCC Guidelines for National Greenhouse Gas Inventories
volume 2 on Stationary Combustion
wwwipcc-nggipigesorjppublic2006glpdf2_Volume2V2_2_Ch2_Stationary_Combustionpdf
The activity rate and the emission factor have to be determined on the same level of aggregation
depending on the availability of data The activity statistic should be determined within the
considered country or region by using adequate statistics The activity should refer to the energy
input of the emission sources considered (net or inferior fuel consumption in [GJ])
1A1 Energy industries
EMEPEEA air pollutant emission inventory guidebook 2019 59
543 Tier 2 approach
For a Tier 2 approach the emission factors are presented in terms of coal use with two technologies
Note that emission factors can be converted to gMg coke produced by applying a conversion of
1 285 kg coalMg coke (from the Iron and Steel BREF range of 1220ndash1 350 kg coalMg coke)
The factors represent combustion and process emissions from coke batteries including combustion
stacks and preheater Emissions from soaking decarbonisation charging door and lid leaks off-
take leaks quenching and pushing are included in Chapter 1B1b Fugitive emissions from solid
fuels solid fuel transformation
Table 5-2 Tier 2 default emission factors for source category 1A1c coke manufacture with
by-product recovery
Tier 2 emission factors
Code Name
NFR Source Category 1A1c Manufacture of solid fuels and other energy industries
Fuel Coal
SNAP (if applicable) 0104 Solid fuel transformation plants
TechnologiesPractices Coke oven (byproduct recovery)
Region or regional
conditions
NA
Abatement technologies NA
Not applicable PCB Hg
Not estimated NH3 Hg
Pollutant Value Unit 95 confidence
interval
Reference
Lower Upper
NOx 820 gMg Coal 530 1200 US EPA (2008) chapter 122
CO 340 gMg Coal 170 680 US EPA (2008) chapter 122
NMVOC 47 gMg Coal 24 94 US EPA (2008) chapter 122
SOx 420 gMg Coal 210 840 US EPA (2008) chapter 122
TSP 1914 gMg Coal 955 3830 US EPA (2008) chapter 122
PM10 1864 gMg Coal 932 3728 US EPA (2008) chapter 122
PM25 1176 gMg Coal 588 2352 US EPA (2008) chapter 122
BC 48 of PM25 5 95 Bond et al (2004)
Pb 22 mgMg Coal 11 44 US EPA (2008) chapter 122
Cd 01 mgMg Coal 005 02 US EPA (2008) chapter 122
As 16 mgMg Coal 08 32 US EPA (2008) chapter 122
Cr 36 mgMg Coal 18 72 US EPA (2008) chapter 122
Cu 17 mgMg Coal 085 34 US EPA (2008) chapter 122
Ni 09 mgMg Coal 045 18 US EPA (2008) chapter 122
Se 18 mgMg Coal 09 36 US EPA (2008) chapter 122
Zn 76 mgMg Coal 38 152 US EPA (2008) chapter 122
PCDDF 738 ng I-TEQMg
Coal
234 2335 UNEP (2005)
Benzo(a)pyrene 82 mgMg Coal 164 41 US EPA (2008) chapter 122
Benzo(b)fluoranthene 01 mgMg Coal 002 05 US EPA (2008) chapter 122
Benzo(k)fluoranthene 003 mgMg Coal 0006 015 US EPA (2008) chapter 122
Indeno(123-cd)pyrene 002 mgMg Coal 0004 01 US EPA (2008) chapter 122
NoteThe basis of the TSP PM10 and PM25 emission factors could not be determined in the reference (emission
factors for filterable and condensable PM are provided for a number of process activities but it is unclear which
have been incorporated in the Tier 2 emission factors)
1A1 Energy industries
EMEPEEA air pollutant emission inventory guidebook 2019 60
Table 5-3 Tier 2 default emission factors for source category 1A1c coke manufacture
without by-product recovery
Tier 2 emission factors
Code Name
NFR Source Category 1A1c Manufacture of solid fuels and other energy industries
Fuel Coal
SNAP (if applicable) 0104 Solid fuel transformation plants
TechnologiesPractices Coke oven (without byproduct recovery)
Region or regional
conditions
NA
Abatement technologies NA
Not applicable PCBs HCB
Not estimated NMVOC NH3 Benzo(b)fluoranthene Benzo(k)fluoranthene Indeno(123-
cd)pyrene
Pollutant Value Unit 95 confidence
interval
Reference
Lower Upper
NOx 360 gMg Coal 250 590 US EPA (2008) chapter 122
CO 25 gMg Coal 125 50 US EPA (2008) chapter 122
SOx 4700 gMg Coal 2350 9200 US EPA (2008) chapter 122
TSP 2700 gMg Coal 1350 5400 US EPA (2008) chapter 122
PM10 2618 gMg Coal 1309 5236 US EPA (2008) chapter 122
PM25 1913 gMg Coal 957 3826 US EPA (2008) chapter 122
BC 48 of PM25 5 95 Bond et al (2004)
Pb 1600 mgMg Coal 800 3200 US EPA (2008) chapter 122
Cd 90 mgMg Coal 45 180 US EPA (2008) chapter 122
Hg 1700 mgMg Coal 850 3400 US EPA (2008) chapter 122
As 630 mgMg Coal 315 1260 US EPA (2008) chapter 122
Cr 320 mgMg Coal 160 640 US EPA (2008) chapter 122
Cu 1400 mgMg Coal 700 2800 US EPA (2008) chapter 122
Ni 290 mgMg Coal 145 580 US EPA (2008) chapter 122
Se 160 mgMg Coal 80 320 US EPA (2008) chapter 122
Zn 2600 mgMg Coal 1300 5200 US EPA (2008) chapter 122
PCDDF 738 ng I-TEQMg
Coal
234 2335 UNEP (2005)
Benzo(a)pyrene 05 mgMg Coal 01 25 US EPA (2008) chapter 122
Note
The basis of the TSP PM10 and PM25 emission factors could not be determined in the reference (emission factors
for filterable and condensable PM are provided for a number of process activities but it is unclear which have
been incorporated in the Tier 2 emission factors)
544 Tier 3 use of facility-specific data
5441 Algorithm
Where facility-level emission data of sufficient quality (see Chapter 3 Data collection in part A) are
available it is good practice to use these data There are two possibilities
the facility reports cover all relevant combustion processes in the country
facility-level emission reports are not available for all relevant combustion processes in the
country
If facility-level data are available covering all activities in the country the implied emission factors
(reported emissions divided by the national fuel use) should be compared with the default emission
1A1 Energy industries
EMEPEEA air pollutant emission inventory guidebook 2019 61
factor values or technology-specific emission factors If the implied emission factors are outside the
95 confidence intervals for the values given it is good practice to explain the reasons for this in
the inventory report
Depending on the specific national circumstances and the coverage of the facility-level reports as
compared to the total combustion activity the emission factor (EF) in this equation should be chosen
from the following possibilities in decreasing order of preference
technology-specific emission factors based on knowledge of the types of technologies
implemented at the facilities where facility-level emission reports are not available
the implied emission factor derived from the available emission reports
Facilities
Facility
Facilities
pollutantFacility
Production
E
EF
(7)
the default Tier 1 emission factor This option should only be chosen if the facility-level emission
reports cover more than 90 of the total national production
5442 Tier 3 Use of facility data
Many coke ovens are (or are part of) major facilities and emission data for individual plants might
be available through a pollutant release and transfer registry (PRTR) or another national emission
reporting scheme When the quality of such data is assured by a well developed QAQC system and
the emission reports have been verified by an independent auditing scheme it is good practice to
use such data If extrapolation is needed to cover all activity in the country either the implied
emission factors for the facilities that did report or the emission factors as provided above could be
used (see subsection 3432 of the present chapter)
5443 Activity data
Since PRTR generally do not report activity data such data in relation to the reported facility-level
emissions are sometimes difficult to find A possible source of facility-level activity might be the
registries of emission trading systems
In many countries national statistics offices collect production data on facility level but these are in
many cases confidential However in several countries national statistics offices are part of the
national emission inventory systems and the extrapolation if needed could be performed at the
statistics office ensuring that confidentiality of production data is maintained
1A1 Energy industries
EMEPEEA air pollutant emission inventory guidebook 2019 62
6 Data quality
61 Completeness
No specific issues but the separation of combustion emissions from other emissions associated with
the activities may potentially lead to exclusion of emissions
62 Avoiding double counting with other sectors
In cases where it is possible to split the emissions it is good practice to do so However care must
be taken that the emissions are not double counted (for example between combustion and process
emissions)
63 Verification
631 Best Available Technique (BAT) emission factors
Table 6-1 BAT-based emission factors for source category 1A1a
Pollutant
Fuel
type
[1]
New or
existing
plant [2]
Boiler size
or
technology
Reference
O2
content
AEL concentration range
mgm-3 at STP (0ordmC 1013
kPa) dry at reference O2
content
Emission factor
gGJ-1
(net thermal
input)
MWth vv dry Low High Low High
TSP coal new 50-100 6 5 20 18 72
coal new 100-300 6 5 20 18 72
coal new gt 300 6 5 20 18 72
coal existing 50-100 6 5 30 18 109
coal existing 100-300 6 5 30 18 109
coal existing gt 300 6 5 30 18 109
wood new 50-100 6 5 20 19 77
wood new 100-300 6 5 20 19 77
wood new gt 300 6 5 20 19 77
wood existing 50-100 6 5 20 19 77
wood existing 100-300 6 5 20 19 77
wood existing gt 300 6 5 20 19 77
oil new 50-100 3 5 20 14 57
oil new 100-300 3 5 20 14 57
oil new gt 300 3 5 10 14 28
oil existing 50-100 3 5 30 14 85
oil existing 100-300 3 5 25 14 71
oil existing gt 300 3 5 20 14 57
gas new GT 15 5 43
gas existing GT 15 5 43
NOx coal new 50-100 6 90 300 326 1087
coal new 100-300 6 90 200 326 725
coal new gt 300 6 50 150 181 543
coal existing 50-100 6 90 300 326 1087
coal existing 100-300 6 90 200 326 725
coal existing gt 300 6 50 200 181 725
wood new 50-100 6 150 250 579 964
wood new 100-300 6 150 200 579 771
wood new gt 300 6 50 150 193 579
1A1 Energy industries
EMEPEEA air pollutant emission inventory guidebook 2019 63
Pollutant
Fuel
type
[1]
New or
existing
plant [2]
Boiler size
or
technology
Reference
O2
content
AEL concentration range
mgm-3 at STP (0ordmC 1013
kPa) dry at reference O2
content
Emission factor
gGJ-1
(net thermal
input)
MWth vv dry Low High Low High
wood existing 50-100 6 150 300 579 1157
wood existing 100-300 6 150 250 579 964
wood existing gt 300 6 50 200 193 771
oil new 50-100 3 150 300 424 849
oil new 100-300 3 50 150 141 424
oil new gt 300 3 50 100 141 283
oil existing 50-100 3 150 450 424 1273
oil existing 100-300 3 50 200 141 566
oil existing gt 300 3 50 150 141 424
gas new gt 50 3 50 100 142 283
gas existing gt 50 3 50 100 142 283
gas new GT 15 20 50 172 430
gas existing GT 15 20 90 172 773
gas new Gas engine 15 20 75 172 644
gas existing Gas engine 15 20 100 172 859
SO2 coal new 50-100 6 150 400 543 1449
coal new 100-300 6 100 200 362 725
coal new gt 300 6 20 200 72 725
coal existing 50-100 6 150 400 543 1449
coal existing 100-300 6 100 250 362 906
coal existing gt 300 6 20 200 72 725
wood new 50-100 6 200 300 771 1157
wood new 100-300 6 150 300 579 1157
wood new gt 300 6 50 200 193 771
wood existing 50-100 6 200 300 771 1157
wood existing 100-300 6 150 300 579 1157
wood existing gt 300 6 50 200 193 771
oil new 50-100 3 100 350 283 990
oil new 100-300 3 100 200 283 566
oil new gt 300 3 50 150 141 424
oil existing 50-100 3 100 350 283 990
oil existing 100-300 3 100 250 283 707
oil existing gt 300 3 50 200 141 566
gas new GT 15 10 86
gas existing GT 15 10 86
Notes
BAT-AELs are based on measurement of filterable PM
Fuel is main classification only limits may be for lsquosolid fuelsrsquo rather than coal or wood Limits for gaseous fuels
are for natural gas and may not be applicable to derived fuels
New and existing plants are as defined in IED (2010)
The refinery BREF provides somewhat wide-ranging views on BAT for refinery emissions Table 6-2
provides a summary of the information presented Note that in the absence of detail about fuel gas
composition the emission factors were derived from the emission concentrations assuming natural
gas BAT emissions for energy processes are not presented
1A1 Energy industries
EMEPEEA air pollutant emission inventory guidebook 2019 64
Table 6-2 BAT-based emission factors for refinery processes
Process
unit
Pollutant Average
period
Reference
O2
content
AEL concentration
range mgm-3 at STP
(0ordmC 1013 kPa) dry at
reference O2 content
Emission factor
gGJ-1
(net thermal
input)
vv dry Low High Low High
Whole
Refinery
SO2
daily 3 60 850 17 241
monthly 3 100 1200 28 340
yearly 3 1000 1400 283 396
NOx
daily 3 70 200 20 57
monthly 3 100 450 28 127
yearly 3 200 500 57 142
Cat cracker
CO boiler CO - 3 50 100 14 28
NOx - 3 100 500 28 142
No CO
boiler CO
- 3 50 100 14 28
(O2 control) NOx - 3 300 600 85 170
SCRSNCR NOx - 3 40 150 11 43
TSP - 3 10 50 3 14
FGDlow S SO2 - 3 10 350 3 99
The BAT document for coke ovens indicates that use of desulphurised coke oven gas and low-NOx
techniques represent BAT in new or modern plant Post-desulphurisation H2S levels of 500ndash
1 000 mgm-3 of fuel are indicated However further information is needed to calculate an emission
factor an estimated SO2 factor range of 60ndash120 gGJ-1 has been calculated assuming a calorific value
of 162 MJm-3[DUKES 2007]
Estimated BAT emission factors (assuming natural gas as the fuel) for NOx are 140ndash220 gGJ-1
632 Fuel sulphur content
For processes without SO2 abatement the sulphur content of the fuel provides a means to calculate
the SO2 emission factor
EFSO2 = [S] x 20000
CV
where
EFSO2 is the SO2 emission factor gGJ-1
[S] is the percent sulphur (ww)
CV is the netinferior calorific value GJtonne-1
2 is the ratio of the RMM of SO2 to sulphur
This equation can be extended to include a factor for retention of SO2 in ash
Liquid fuels in the EC are subject to sulphur limits (EC SCOLF 19992005) as summarised in Table
6-3 The SO2 emission factors in Table 6-3 have been calculated assuming 100 conversion of fuel
sulphur and applying UK net calorific values for fuel oils (DUKES 2007)
1A1 Energy industries
EMEPEEA air pollutant emission inventory guidebook 2019 65
Table 6-3 Sulphur emission factors from oil sulphur limits
Fuel oil Implementation
date
Maximum
sulphur content
SO2 emission
factor gGJ-1
Comment
Heavy fuel oil 112003 1 485 Assumes net CV of
412 GJtonne-1
Gas oil Pre 112008 02 92 Assumes net CV of
Post 112008 01 46 434 GJtonne-1
633 Other emission factors
The Industrial Emissions Directive Gothenburg protocol USEPA emission factor handbook and
sector-specific emission factor guidance (Eurelectric and Concawe) provide additional means of
assessing the validity of the default emission factors and factors from other sources to a national
inventory
Examples of emission factors derived from ELVs in the LCPD and Gothenburg protocol are provided
in Appendix D The USEPA emission factors can be found at wwwepagovttnchiefap42
634 Derivation of emission factors from emission concentrations for combustion processes
A methodology to develop emission factors from emission concentrations (for example
measurement reports and emission limit values) is provided in Appendix E
64 Developing a consistent time series and recalculation
The emissions of non-CO2 emissions from fuel combustion change with time as facilities are
upgraded or replaced by less-polluting energy technology The mix of technology used with each
fuel will change with time and this has implications for the choice of emission factor This is probably
most relevant to the aggregated factors used in Tier 1 and Tier 2 Over time the Tier 1 emissions
estimates become less relevant
For Tier 3 using facility level data it might occur that a different selection of facility level data is
included in different years This can lead to time series inconsistencies Moreover PRTR data are
generally available for specific years only Splicing such recent reported data under the European
Pollutant Release and Transfer Registry (EPRTR) European Pollutant Emission Register (EPER) with
historical data could be used to get consistent time series Splicing could be used for both the activity
data and the country-specific emission factors
Unexpected discontinuities in time series can occur when specific facilities come into operation or
are closed in specific years If this happens it is good practice to clearly document such explanations
in the inventory archives
65 Uncertainty assessment
651 Emission factor uncertainties
The uncertainty is partly the result of how emission factors are developed and applied The
expanded statistical uncertainty is made up of between plants variance within plant (operating)
variance and uncertainties associated with the measurement methodology used and the
aggregation of data
1A1 Energy industries
EMEPEEA air pollutant emission inventory guidebook 2019 66
Process measurements from which emission factors are developed at individual facility level are
subject to both systematic and random errors in the determination of mass concentration mass
emission size distribution and analytical errors etc
In addition bias may exist in emission factors arising from assumptions made about the abatement
used on lsquotypicalrsquo industrial installations For example emission factors lsquoagersquo the factors widely used
in the Guidebook and hence by many countries as default emission factors in their national
inventories become out of date Recent measurement work suggests that they may overestimate
emissions from the industrial processes subject to more modern industrial emissions regulation
They may however still be fully representative for older plant small plant or for poorer fuels
652 Activity data uncertainties
The uncertainty in national fuel and production statistics can be difficult to establish however
reporting procedures have generally been in place for many years Recent developments in emission
trading provide a lsquobottom-uprsquo and verified alternative to national statistics in some sectors
The uncertainty for disaggregated sector-specific activity data can be high as such data may be
collected infrequently or rely on assumptions which may vary substantially with time
The inventory compiler needs to understand how sector-specific activity data have been derived
66 Inventory quality assurancequality control QAQC
Emissions from fuel combustion are largely associated with electricity production It is good practice
to check whether the electricity production data are consistent with the reported fuel use
67 Mapping
The facilities within 1A1 should be considered as point sources if plant-specific data are available
Otherwise national emissions should be disaggregated on the basis of plant capacity employment
or population statistics
68 Reporting and documentation
No specific issues
1A1 Energy industries
EMEPEEA air pollutant emission inventory guidebook 2019 67
7 Glossary
Term Definition
Boiler any technical apparatus in which fuels are oxidised in order to
generate steam
Process heater or furnace any technical apparatus in which fuels are oxidised in order to
generate heat for a process activity
Coking coal (Nomenclature for Air
Pollution of Fuels (NAPFUE) 101)
subcategory of hard coal with a quality that allows the
production of a coke suitable for supporting a blast furnace
charge (Meijer 1995)
Co-generation plant Simultaneous production of electricity and steam (or process
heating)
Combined cycle gas turbine (CCGT) gas turbine combined with a steam turbine The boiler can also
be fuelled separately
Hard coal refers to coal of a gross caloric value greater than 23 865 kJkg
on an ash-free but moist basis and with a mean random
reflectance (2) of vitrinite of at least 06 Hard coal comprises
the subcategories coking coal and steam coal (3) [Meijer 1995]
Integrated coal gasification
combined cycle gas turbine (IGCC)
gas turbine fuelled by gas which is a product of a coal
gasification process
Lignite (NAPFUE 105) non-agglomerating coals with a gross caloric value less than
17 435 kJkg and containing more than 31 volatile matter on
a dry mineral matter free basis
Power plant installation or facility for electricity generation
Stationary engines spark-ignition or compression-ignition engines (2- and 4-
stroke)
Steam coal (NAPFUE 102) subcategory of hard coal used for steam raising and space
heating purposes Steam coal includes all anthracite and
bituminous coals not included under coking coal (Meijer 1995)
Sub-bituminous coal
(NAPFUE 103)
non-agglomerating coals with a gross caloric value between
17 435 and 23 865 kJkg containing more than 31 volatile
matter on a dry mineral free matter basis (Meijer 1995)
(2) Mean random reflectance characteristic value which stands for a defined coal composition (modular
component is eg vitrinite)
(3) The following coal classification codes cover those coals which would fall into these subcategories (Meijer
1995)
International classification codes
(UN Geneva 1995)
323 333 334 423 433 435 523 533 534 535 623 633
634 635 723 733 823
USA classification Class II group 2 lsquomedium volatile bituminousrsquo
British classification Class 202 203 204 301 302 400 500 600
Polish classification Class 33 34 351 352 36 37
Australian classification Class 4A 4B 5
1A1 Energy industries
EMEPEEA air pollutant emission inventory guidebook 2019 68
8 References
API Air toxics emission factors for combustion sources using petroleum based fuels Volume 1
Development of emission factors using APIWSPA approach No 348 Washington DC American
Petroleum Institute 181998
API Comparison of API and EPA toxic air pollutant emission factors for combustion sources No 4720
Washington DC American Petroleum Institute 192002
Bailey RE 2001 Global hexachlorobenzene emissions Chemosphere Volume 43 Issue 2 April
2001 Pages 167ndash182
Bond TC Streets DG Yarber KF Nelson SM Woo J-H amp Klimont Z 2004 A Technology-based
10 Global Inventory of Black and Organic Carbon Emissions from Combustion Journal of Geophysical
Research 11 109 D14203 doi1010292003JD003697
Bond TC Wehner B Plewka A Wiedensohler A Heintzenberg J amp Charlson RJ 2006 Climate-
relevant properties of primary particulate emissions from oil and natural gas combustion
Atmospheric Environment 40 (2006) 3574ndash3587
BUWAL 2001 Massnahmen zur Reduktion der PM10-Emissionen Umwelt-Materialen Nr 136 Luft
Bundesamt fuumlr Umwelt Wald und Landschaft (BUWAL) Bern (in German)
Chow JC Watson JG Kuhns HD Etyemezian V Lowenthal DH Crow DJ Kohl SD
Engelbrecht JP amp Green MC 2004 Source profiles for industrial mobile and area sources in the
Big Bend Regional Aerosol Visibility and Observational (BRAVO) Study Chemosphere 54 (2) 185-
208
CITEPA CORINAIR Inventory-Default Emission Factors Handbook (second edition) CEC-DG XI (ed)
1992
Concawe 2015 Air pollutant emission estimation methods for E-PRTR reporting by refineries 2015
edition CONCAWE Report 0315 2015 available at
httpswwwconcaweeuuploadsModulesPublicationsrpt_15-3pdf
Concawe 2016 Emission factors for metals from combustion of refinery fuel gas and residual fuel
oil CONCAWE Report No 0916 2016 available at httpswwwconcaweeupublicationemission-
factors-for-metals-from-combustion-of-refinery-fuel-gas-and-residual-fuel-oil
CORINAIR 1990 CORINAIR 90 Emission Inventory (Proposals) mdash working paper for the 19ndash20
September 1991 meeting mdash Annex 4 Definition of Large Point Sources
Dayton DP amp Bursey JT 2001 Source sampling fine particulate matter Wood-fired industrial
boiler Report No EPA-600R-01-106 US Environmental Protection Agency Research Triangle Park
NC
Diehl T Heil A Chin M Pan X Streets D Schultz M and Kinne S 2012 Anthropogenic
biomass burning and volcanic emissions of black carbon organic carbon and SO2 from 1980 to
2010 for hindcast model experiments Atmos Chem Phys Discuss 12 24895-24954
DUKES 2007 Digest of UK Energy Statistics 2007 published by BERR and available here
httpstatsberrgovukenergystatsdukesa_1-a_3xls
1A1 Energy industries
EMEPEEA air pollutant emission inventory guidebook 2019 69
EC SCOLF 19992005 Sulphur Content of Liquid Fuels Directive and 2005 Marine oil amendment
EC-IED 2010 Directive 201075EU on industrial emissions (integrated pollution prevention and
control)
EC-LCPD 2001 Directive 200180EC of the European Parliament and of the Council of
23 October 2001 on the limitation of emissions of certain pollutants into the air from large
combustion plants
EIPPCB 2013 BAT Reference Document for Iron and Steel Production EC-IED 201075EU European
IPPC Bureau available at httpeippcbjrceceuropaeureference
EIPPCB 2015 Best Available Techniques (BAT) Reference Document for the Refining of Mineral Oil
and Gas European Commission Joint Research Centre Institute for Prospective Technological
Studies European IPPC Bureau 2015 available at httpeippcbjrceceuropaeureference
EIPPCB 2006 IPPC BAT Reference Document for Large Combustion Plant European IPPC Bureau
2006 available at httpeippcbjrceceuropaeureference
Engelbrecht JP Swanepoel L Chow JC Watson JG amp Egami RT 2002 The comparison of
source contributions from residential coal and low-smoke fuels using CMB modeling in South Africa
Environmental Science and Policy 5 (2) 157ndash167
England GC Wien S McGrath T amp Hernandez D 2004 Development of Fine Particulate Emission
Factors and Speciation Profiles for Oil and Gas Fired Combustion Systems Topical Report Test
Results for a Combined Cycle Power Plant with Oxidation Catalyst and SCR at Site Echo Prepared for
the US Department of Energy National Energy Technology Laboratory Pittsburgh PA the Gas
Research Institute Des Plains IL and the American Petroleum Institute Washington DC 2004
Eurelectric 2008 European Wide Sector Specific Calculation Method for Reporting to the European
Pollutant Release and Transfer Register VGB EURELECTRIC RecommendationsVGB European
Working Group lsquoE-PRTRrsquo January 2008 Ref 2008ndash030-0105 (Confidential report)
Fisher GL Chrisp CE amp Hayes TL 1979 Carbonaceous particles in coal fly ash In Proceedings
Carbonaceous Particles in the Atmosphere March 20ndash22 1978 Lawrence Berkeley Laboratory
University of California
Griest WH amp Tomkins BA 1984 Carbonaceous particles in coal combustion stack ash and their
interaction with polycyclic aromatic hydrocarbons Science of the Total Environment 36 209ndash214
Grochowalski A amp Konieczyński J 2008 PCDDsPCDFs dl-PCBs and HCB in the flue gas from coal
fired CFB boilers Chemosphere 73 (2008) 97ndash103
EMEPEEA (2006) EMEPCORINAIR Emission Inventory Guidebook version 4 (2006 edition)
published by the European Environmental Agency Technical report No 112006 available via
httpreportseeaeuropaeuEMEPCORINAIR4enpage002html
Henry WM amp Knapp KT 1980 Compound forms of fossil fuel fly ash emissions Environmental
Science and Technology 14 (4) 450ndash456
Hernandez D Nguyen Q amp England GC 2004 Development of Fine Particulate Emission Factors
and Speciation Profiles for Oil and Gas Fired Combustion Systems Topical Report Test Results for a
Diesel-Fired Compression Ignition Reciprocating Engine with a Diesel Particulate Filter at Site Foxtrot
Prepared for the US Department of Energy National Energy Technology Laboratory Pittsburgh PA
1A1 Energy industries
EMEPEEA air pollutant emission inventory guidebook 2019 70
the Gas Research Institute Des Plains IL and the American Petroleum Institute Washington DC
2004
Hildemann LM Markowski GR amp Cass GR 1991 Chemical Composition of Emissions from Urban
Sources of Fine Organic Aerosol Environmental Science amp Technology 25(4) 744-759
IPCC 2006 UN IPCC Guidelines for national greenhouse gas inventories available at
wwwipcc-nggipigesorjppublic2006glpdf2_Volume2V2_2_Ch2_Stationary_Combustionpdf
Kupiainen K and Klimont Z 2007 Primary emissions of fine carbonaceous particles in Europe
Atmospheric Environment 41 (10) 2156ndash2170
Meijer Jeroen Personal communication IEA (International Energy Agency) Fax of 2441995
Nielsen M Nielsen O-K amp Thomsen M 2010 Emissions from decentralised CHP plants 2007 -
Energinetdk Environmental project no 071882 Project report 5 ndash Emission factors and emission
inventory for decentralised CHP production National Environmental Research Institute Aarhus
University 113 pp ndash NERI Technical report No 786 httpwwwdmudkPubFR786pdf
Nielsen M Nielsen O-K amp Hoffmann L 2012 Improved inventory for heavy metal emissions from
stationary combustion plants ndash 1990-2009 (in prep)
Olmez I Sheffield AE Gordon GE Houck JE Pritchett LC Cooper JA Dzubay TG amp Bennett
RL 1988 Compositions of Particles from Selected Sources in Philadelphia for Receptor Modeling
Applications JAPCA 381392-1402 (1988)
Pulles T van der Gon HD Appelman W amp Verheul M (2012) Emission factors for heavy metals
from diesel and petrol used in European vehicles Atmospheric Environment 61 (2012) 641-651
Rentz et al 1993 Rentz O Holtmann T Oertel D Roumlll C et al Konzeption zur Minderung der VOC-
Emissionen in Baden-Wuumlrttemberg Umweltministerium Baden-Wuumlrttemberg (ed) Heft 21
Karlsruhe (Germany) 1993
Rubenstein G 2003 Gas turbine PM emissions mdash Update Sierra Research June 2003 Paper to
ASMEIGTI Turbo-Expo Atlanta 2003
Stobbelaar G Reduction of Atmospheric Emissions under the terms of the North Sea Action
Programme Report Lucht 102 Ministry of Housing Physical Planning and Environment The
Netherlands 1992
Theloke J Kummer U Nitter S Geftler T and Friedrich R Uumlberarbeitung der Schwermetallkapitel im
CORINAIR Guidebook zur Verbesserung der Emissionsinventare und der Berichterstattung im
Rahmen der Genfer Luftreinhaltekonvention Report for Umweltbundesamt April 2008
TNO Technical Paper to the OSPARCOM-HELCOM-UNECE Emission Inventory (1995) TNO-report
TNO-MEP-R95247
Umweltbundesamt Germany 1980 Umwelt- und Gesundheitskritierien fuumlr Quecksilber UBA-
Berichte 580 Berlin 1980
UNEP 2005 Standardised toolkit for identification and quantification of dioxin and furan releases
Edition 21 UNEP Chemicals Geneva December 2005
USEPA AP-42 (and USEPA various dates) US-EPA (ed) Compilation of Air Pollutant Emission Factors
Stationary Point and Area Sources Fifth Edition available at wwwepagovttnchiefap42
1A1 Energy industries
EMEPEEA air pollutant emission inventory guidebook 2019 71
US-EPA (ed) Criteria Pollutant Emission Factors for the NAPAP Emission Inventory EPA6007-
87015 1987
US EPA 2011 SPECIATE database version 43 US Environmental Protection Agencyrsquos (EPA)
Available at httpcfpubepagovsispeciate
van der Most PFJ Veldt C Emission Factors Manual PARCOM-ATMOS Emission factors for air
pollutants 1992 Final version TNO and Ministry of Housing Physical Planning and the Environment
Air and Energy Directorate Ministry of Transport and Water Management The Netherlands
Reference No 92ndash235 1992
Visschedijk AJH J Pacyna T Pulles P Zandveld and H Denier van der Gon 2004 Cooordinated
European Particulate Matter Emission Inventory Program (CEPMEIP) P Dilara et Al (eds)
Proceedings of the PM emission inventories scientific workshop Lago Maggiore Italy 18 October
2004 EUR 21302 EN JRC pp 163ndash174
Wenborn MJ Coleman PJ Passant NR Lymberidi E Sully J amp Weir RA 1999 Speciated PAH
inventory for the UK AEAT-3512REMC20459131ISSUE 1
Wien S England G amp Chang M 2004a Development of Fine Particulate Emission Factors and
Speciation Profiles for Oil and Gas Fired Combustion Systems Topical Report Test Results for a Dual
Fuel-Fired Commercial Boiler at Site Delta Prepared for the US Department of Energy National
Energy Technology Laboratory Pittsburgh PA the Gas Research Institute Des Plains IL and the
American Petroleum Institute Washington DC 2004
Wien S England G amp Chang M 2004b Development of Fine Particulate Emission Factors and
Speciation Profiles for Oil and Gas Fired Combustion Systems Topical Report Test Results for a
Combined Cycle Power Plant with Supplementary Firing Oxidation Catalyst and SCR at Site Bravo
Prepared for the US Department of Energy National Energy Technology Laboratory Pittsburgh PA
the Gas Research Institute Des Plains IL and the American Petroleum Institute Washington DC
2004
Wien S England G Chang M 2004c Development of Fine Particulate Emission Factors and
Speciation Profiles for Oil and Gas Fired Combustion Systems Topical Report Test Results for a Gas-
Fired Process Heater with Selective Catalytic Reduction (Site Charlie) Prepared for the US
Department of Energy National Energy Technology Laboratory Pittsburgh PA the Gas Research
Institute Des Plains IL and the American Petroleum Institute Washington DC 2004
9 Point of enquiry
Enquiries concerning this chapter should be directed to the relevant leader(s) of the Task Force on
Emission Inventories and Projectionrsquos expert panel on combustion and industry (TFEIP) Please refer
to the TFEIP website (wwwtfeip-secretariatorg) for the contact details of the current expert panel
leaders
1A1 Energy industries
EMEPEEA air pollutant emission inventory guidebook 2019 72
Annex A Summary of combustion
plant and NFR codes
Table A1 Combustion plant and sector codes
Combustion plants as point and area sources
NFR
CODE
SNAP97
Codes
NOSE
CODE
Thermal
capacity
[MWth ]
Public
power and
cogeneratio
n plants
District
heating
Industrial
combustion
and specific
sector
Commercia
l and
institutiona
l
combustio
n
Residential
combustion
Agricultur
e forestry
and
fishing
Gas
turbin
es
Stationary
engines
1A1a 01 01 01 10101 x
1A1a 01 02 01 10101 x
1A1b 01 03 01 10101 x
1A1c 01 04 01 10101 ge 300 x
1A1c 01 05 01 10101 x
1A4a 02 01 01 10101 X
1A2a-f 03 01 01 10101 x
1A1a 01 01 02 10102 x
1A1a 01 02 02 10102 x
1A1b 01 03 02 10102 x
1A1c 01 04 02 10102 ge 50 x
1A1c 01 05 02 10102 and x
1A4a 02 01 02 10102 lt 300 X
1A4bi 02 02 01 10102 x
1A4ci 02 03 01 10102 x
1A2a-f 03 01 02 10102 x
1A1a 01 01 03 10103 x
1A1a 01 02 03 10103 x
1A1b 01 03 03 10103 x
1A1c 01 04 03 10103 x
1A1c 01 05 03 10103 lt 50 x
1A4a 02 01 03 10103 X
1A4bi 02 02 02 10103 x
1A4ci 02 03 02 10103 x
1A2a-f 03 01 03 10103 x
1A1a 01 01 04 10104 x
1A1a 01 02 04 10104 x
1A1b 01 03 04 10104 x
1A1c 01 04 04 10104 not x
1A1c 01 05 04 10104 relevant x
1A4a 02 01 04 10104 x
1A4bi 02 02 03 10104 x
1A4ci 02 03 03 10104 x
1A2a-f 03 01 04 10104 x
1A1a 01 01 05 10105 x
1A1a 01 02 05 10105 x
1A1b 01 03 05 10105 x
1A1 Energy industries
EMEPEEA air pollutant emission inventory guidebook 2019 73
Combustion plants as point and area sources
NFR
CODE
SNAP97
Codes
NOSE
CODE
Thermal
capacity
[MWth ]
Public
power and
cogeneratio
n plants
District
heating
Industrial
combustion
and specific
sector
Commercia
l and
institutiona
l
combustio
n
Residential
combustion
Agricultur
e forestry
and
fishing
Gas
turbin
es
Stationary
engines
1A1c 01 04 05 10105 not x
1A1c 01 05 05 10105 relevant x
1A4a 02 01 05 10105 x
1A4bi 02 02 04 10105 x
1A4ci 02 03 04 10105 x
1A2a-f 03 01 05 10105 x
Note
x = indicates relevant combination
1A1 Energy industries
EMEPEEA air pollutant emission inventory guidebook 2019 74
Annex B Further details on emissions and controls
Additional information taken from the 2006 Guidebook (Chapter B111) which may be relevant when
assessing pollutants and controls Note that the Large Combustion Plant BREF provides a more
recent review of emissions and abatement technologies
Emissions
The emissions are released through the stack Fugitive emissions (from seals etc) can be neglected
for combustion plants
The emissions of sulphur oxides (SOx) are directly related to the sulphur content of the fuel which
for coal normally varies between 03 and 12 wt- (maf) (up to an extreme value of 45 wt-) and
for fuel oil (including heavy fuel oil) from 03 up to 30 wt-
Sulphur appears in coal as pyritic sulphur (FeS2) organic sulphur sulphur salts and elemental
sulphur A major part of the sulphur in coal comes from pyritic and organic sulphur both types are
responsible for SOx formation
For nitric oxide (NO together with NO2 normally expressed as nitrogen oxides NOx) three different
formation mechanisms are relevant
formation of lsquofuel-NOrsquo from the conversion of chemically-bound nitrogen in the fuel (NOfuel)
formation of lsquothermal-NOrsquo from the fixation of atmospheric nitrogen coming from the
combustion air (NOthermal)
formation of lsquoprompt-NOrsquo
In the temperature range considered (up to 1 700 degC) the formation of lsquoprompt-NOrsquo can be neglected
The majority of NOx emissions from coal combustion (80 to more than 90 ) is formed from fuel
nitrogen Depending on combustion temperatures the portion of thermal- NOx formed is lower than
20 The content of nitrogen in solid fuels varies
for hard coal between 02 and 35 wt- (maf)
for lignite between 04 and 25 wt- (maf)
for coke between 06 and 155 wt- (maf)
for peat between 07 and 34 wt- (maf)
for wood between 01 and 03 wt- (maf) and
for waste between 03 and 14 wt- (maf)
The content of nitrogen in liquid fuels varies for heavy fuel oil between 01 and 08 wt- and for
fuel oil between 0005 and 007 wt- Natural gas contains no organically-bound nitrogen The
content of molecular nitrogen in natural gas has no influence on the formation of fuel-NO only
thermal-NO is formed
Emissions of non-methane volatile organic compounds (NMVOC) eg olefins ketones aldehydes
result from incomplete combustion Furthermore unreacted fuel compounds such as methane (CH4)
can be emitted The relevance of NMVOCCH4 emissions from boilers which are often reported
together as VOC is very low for large-sized combustion plants
1A1 Energy industries
EMEPEEA air pollutant emission inventory guidebook 2019 75
VOC emissions tend to decrease as the plant size increases Carbon monoxide (CO) appears always
as an intermediate product of the combustion process and in particular under sub-stoichiometric
combustion conditions
The formation mechanisms of CO thermal-NO and VOC are similarly influenced by combustion
conditions
Emissions of ammonia (NH3) are not caused by a combustion process the emissions result from
incomplete reaction of NH3 additive in the denitrification process (slip of ammonia in SCR and SNCR
units)
Most of the heavy metals considered (As Cd Cr Cu Hg Ni Pb Se Zn and V) are normally released
as compounds (eg oxides chlorides) in association with particulates Only Hg and Se are at least
partly present in the vapour phase Less volatile elements tend to condense onto the surface of
smaller particles in the flue gas stream Therefore enrichment in the finest particle fractions is
observed The content of heavy metals in coal is normally several orders of magnitude higher than
in oil (except occasionally for Ni and V in heavy fuel oil) and in natural gas For natural gas only
emissions of mercury are relevant
During the combustion of coal particles undergo complex changes which lead to vaporisation of
volatile elements The rate of volatilisation of heavy metal compounds depends on fuel
characteristics (eg concentrations in coal fraction of inorganic components such as calcium) and
on technology characteristics (eg type of boiler operation mode)
From DBB all heavy metals of concern are emitted as particulate matter except Hg and Se
Emissions from lignite-fired DBB are potentially lower than from hard coal as the trace element
content in lignite and the combustion temperatures are lower In WBB the recirculation of fly ash is
a common operation mode which creates an important increase in heavy metal concentrations in
the raw gas Heavy metal emissions from FBC units are expected to be lower due to the lower
operating temperatures and a smaller fraction of fine particles The addition of limestone in FBC
facilities might reduce the emission of some heavy metals corresponding to an increased retention
of heavy metals in the bottom ash This effect can be partially compensated by the increase in the
fraction of fine particulates in the flue gas leading to increased emissions from particulates highly
enriched by heavy metals High concentrations of As poison denitrification catalysts Therefore
selected catalytic reduction plants (SCR) in a high-dust configuration may require special measures
(eg reduction of fly ash recirculation)
Controls
Relevant abatement technologies for SO2 NOx and heavy metals are outlined below Abatement
techniques for gas turbines and stationary engines are treated separately Average reduction
efficiencies and availabilities of abatement technologies for SOx and NOx are summarised in
Tables B1ndashB3
Sulphur oxides flue gas desulphurisation (FGD) processes
FGD processes are designed to remove SO2 from the flue gas of combustion installations Most
processes like the wet scrubbing process (WS) the spray dryer absorption (SDA) the dry sorbent
injection (DSI) and the Walther process (WAP) are based on the reaction of the SO2 with an alkaline
agent added as solid or as suspensionsolution of the agent in water to form the respective salts In
secondary reactions SO3 fluorides and chlorides are also removed In the case of the DESONOX
1A1 Energy industries
EMEPEEA air pollutant emission inventory guidebook 2019 76
process the SO2 is catalytically oxidised to SO3 and reacts with water to form sulphuric acid The
activated carbon process and the Wellman-Lord process remove the SO2 to produce a SO2 rich gas
which may be further processed to sulphur or sulphuric acid
The Large Combustion Plant BREF indicates that use of low sulphur fuel or co-firing with gas or other
low sulphur fuels are primary measures for SO2 control Wet limestone scrubbing process (with
gypsum production) is the main FGD process applied to coal and oil-fired boilers but is rarely applied
in plant smaller than 100 MWth Seawater scrubbing and SDA are listed as alternative possible FGD
techniques for new and retrofit boilers DSI is also listed as possible for coal Other techniques are
considered possible but rarely applied to new plant and would be plant-dependent for existing
boilers
Nitrogen oxides primary measures
Low NOx burner (LNB)
A characteristic of LNB is the staged air to fuel ratio at the burner Three different technical
modifications are in use
air-staged LNB an under-stoichiometric zone is created by a fuel-air mixture and primary air
An internal recirculation zone occurs due to the swirl of primary air A burn-out zone is created
due to secondary air fed by air nozzles arranged around the primary air nozzles
air-staged LNB with flue gas recirculation (FGR) the basic function is similar to air-staged LNB
The distances between the primary and secondary nozzles are greater therefore a flue gas
layer is formed As a result the residence time in the reducing atmosphere increases and the
oxygen concentration decreases
air-fuel-staged LNB an additional reduction zone around the primary zone is achieved by the
extremely over-stoichiometric addition of secondary fuel around the secondary flame
LNB is operational with all fuels and all types of burners The NOx reduction efficiency for coal-fired
boilers varies between 10 and 30
Staged air supply (SAS)
Staged air means the creation of two divided combustion zones mdash a primary zone with a lack of
oxygen and a burn-out zone with excess air SAS covers the low excess air (LEA) burners out of
service (BOOS) and biased burner firing (BBF) techniques
low excess air (LEA) means reduction of the oxygen content in the primary combustion zone of
the burners When firing hard coal experience has shown that the general limitations are fouling
and corrosion caused by the reducing atmosphere and incomplete burn-out When firing gas
the reduction efficiency is limited by the CO formed LEA is more suitable for lignite and often
used for retrofitting combustion plants For oil-fired boilers a reduction efficiency of 20 has
been achieved
burners out of service (BOOS) means that the lower burner row(s) in the boiler operate under a
lack of oxygen (fuel rich) the upper burners are not in use This technology is in particular
suitable for older installations but the thermal capacity of the boiler decreases by about 15ndash
20
biased burner firing (BBF) means that the lower burner rows in the boiler operate under a lack
of oxygen (fuel rich) and the upper burners with an excess of oxygen The boiler efficiency is less
compared to BOOS and the NOx reduction is also lower The NOx reduction efficiency for coal-
fired boilers varies between 10 and 40
1A1 Energy industries
EMEPEEA air pollutant emission inventory guidebook 2019 77
Overfire air (OFA)
All burner rows in the boiler operate with a lack of oxygen The combustion air is partly (5ndash20 )
injected through separate ports located above the top burner row in the boiler OFA is operational
with most fuels and most types of boilers For gas-fired boilers a reduction efficiency of 10ndash30 and
for oil-fired boilers 10ndash40 has been achieved The NOx reduction efficiency for coal-fired boilers
varies between 10 and 40
Flue gas recirculation (FGR)
The recirculation of flue gas into the combustion air is an efficient NOx abatement method for firing
modes with high combustion temperatures such as wet bottom boilers and especially for gas- and
oil-fired boilers The recirculated flue gas can be added to the secondary or primary air In the first
case the flame core is not affected and the only effect is a reduction of the flame temperature which
is favourable for thermal-NOx abatement The influence on dry bottom boilers is thus very limited
considering the fact that about 80 of the NOx formed originates from fuel-bound nitrogen FGR
can be used as an additional measure A more efficient method is the introduction of flue gas into
the primary air of an unstaged burner High reduction efficiencies of FGR in the primary flow (15ndash
20 ) have been achieved in gas- and oil-fired boilers The NOx reduction efficiency for coal-fired
boilers varies between 5 and 25
Split primary flow (SPF or Reburn)
Split primary flow means fuel staging in the furnace This technique involves injecting fuel into the
furnace above the main combustion zone thereby producing a second sub-stoichiometric
combustion zone In the primary zone of the boiler the main fuel is burnt under fuel-lean conditions
This zone is followed by a secondary zone with a reducing atmosphere into which the secondary
fuel is injected Finally secondary air is injected into the burn-out zone of the boiler This reburning
technique can in principle be used for all types of fossil fuel-fired boilers and in combination with
low NOx combustion techniques for the primary fuels When nitrogen is present in the reburning
fuel a part of it will be converted into NOx in the burn-out zone Therefore use of natural gas
provides the largest potential reduction Trials on large boilers indicate NOx reduction potentials of
50ndash70
The Large Combustion Plant BREF lists similar measures for coal- and oil-fired boilers including
low excess air
air staging (OFA and similar measures)
LNB
reburning
Reburn is not relevant for natural gas-fired boilers
Simultaneous processes for removal of nitrogen oxides and sulphur oxides
Activated carbon process (AC)
The AC process is a dry process for simultaneous SO2 and NOx removal based on the adsorption of
the pollutants in a moving bed filter of activated carbon The sulphur oxides undergo catalytic
oxidation with the moisture in the flue gas to form sulphuric acid NO2 is completely reduced to N2
NO reacts catalytically with the ammonia injected and forms N2 and H2O The AC process has been
installed at four power plants in Germany (in two cases downstream of a SDA process) The sulphur
1A1 Energy industries
EMEPEEA air pollutant emission inventory guidebook 2019 78
content in the fuel used should not exceed 23 wt- The SO2 reduction efficiency is gt 95 the NOx
reduction efficiency is gt 70
The DESONOX processSNOX process (DESONOX)
The purification of the flue gas by the DESONOX process is based on the simultaneous catalytic
reduction of nitrogen oxides (NOx) to nitrogen (N2) and water (H2O) and on the catalytic oxidation of
sulphur dioxide (SO2) to sulphur trioxide (SO3) The by-product is sulphuric acid The process has
been installed at one power plant in Germany where hard coal is used with a sulphur content of
about 1 wt- The concentration of catalyst toxics (mainly arsenic but also chromium selenium
etc) has to be taken into account The SO2 reduction efficiency is up to 95 the NOx reduction
efficiency is also up to 95 The SNOX process works on the same basic principle as the DESONOX
process with the main difference that reduction and oxidation take place in two separate reaction
towers The SNOX process has been applied at one Danish power plant No reduction efficiency has
been reported yet The SNOX process is also known as a combination of the Topsoslashe WSA-2 process
and the SCR process
Heavy metals secondary measures
Heavy metal emissions are mainly reduced by dust control equipment Particulate control systems
which are used in coal-fired power plants are cyclones wet scrubbers electrostatic precipitators
(ESP) and fabric filters In most power plants 99 of the particulates are removed from the flue
gases by using ESP or fabric filters The latter are more efficient in controlling fine particulate matter
wet scrubbers and cyclones are less efficient The reduction efficiency of ESP for most elements in
the solid state is gt 99 Only for some higher volatile elements such as Cd Pb Zn and Se is the
reduction efficiency less but it remains above 90 The reduction efficiency of an ESP for Hg
depends on the operating temperature of the ESP A cold-side ESP operating at about 140 degC is
estimated to have an average Hg reduction efficiency of about 35
The influence of FGD- and DeNOx-units on heavy metal emissions has been investigated mainly in
the frame of mass balance studies WS-FGD-units remove a further fraction of particulate matter in
flue gas in addition to dust control Particle-bound elements are removed by FGD-units with an
efficiency of about 90 In FGD-units in particular WS-units the gaseous compounds can
additionally condense on particulate matter which are mainly removed in the prescrubber With
regard to gaseous elements various studies have shown reduction efficiencies of 30ndash50 for Hg
and 60ndash75 for Se Lime contributes over 90 of the input of As Cd Pb and Zn to the FGD
The abatement of Hg emissions is influenced indirectly by DeNOx-units A high dust SCRunit
improves Hg removal in a subsequent FGD-unit using a lime scrubbing system The SCR-unit
increases the share of ionic mercury (HgCl2) to up to 95 which can be washed out in the
prescrubber of the FGD-unit A study in the Netherlands found no influence of LNB on heavy metal
emissions
Gas turbines
For gas turbines mainly NOx emissions are of most relevance Primary measures for NOx reduction
are the following
dry controls (eg over-stoichiometric combustion in a dry low NOx burner and
wet controls (injection of water andor steam) in order to regulate the combustion temperature
Stationary engines
1A1 Energy industries
EMEPEEA air pollutant emission inventory guidebook 2019 79
For spark-ignition engines the main pollutants emitted are NOx CO and unburned hydrocarbons
(VOC) For diesel engines sulphur dioxide (SO2) emissions have also to be considered Emissions of
soot also contribute to emissions of heavy metals and persistent organic pollutants but little
information is available
Primary measures are installed to optimise combustion conditions (air ratio reduced load water
injection exhaust-gas recirculation optimised combustion chamber etc) Reduction efficiencies can
be given eg for exhaust gas recirculation from 65 to 12 and for internal exhaust gas recirculation
from 4 to 37 External exhaust gas recirculation (turbo-charged models) can have reductions of
NOx varying from 25 to 34 Secondary measures (NSCR SCR) are installed if the emission
thresholds cannot be met by adjustments to the engine itself
Table B1 FGD abatement measure efficiencies and availabilities
No Type of
secondary
measure
Reduction
efficiency
ηsec [ ]
Availability
β [ ]
1 WS 090 099
2 SDA 090 099
3 DSI 045 098
4 LIFAC 070 098
5 WL 097 099
6 WAP 088 099
7 AC 095 099
8 DESONOX 095 099
Notes
WS ndash limelimestone wet scrubbing
SDA ndash spray-dryer absorption
DSI ndash dry sorbent injection
LIFAC DSI system with additional water injection
WL ndash Wellman Lord process (regenerable FGD process)
WAP ndash Walther process
AC ndash activated carbon process (simultaneous FGD and DeNOx process)
DESONOX ndash combined FGD and DeNOx process
1A1 Energy industries
EMEPEEA air pollutant emission inventory guidebook 2019 80
Table B2 NOx primary abatement measure efficiencies
Type of primary measure1)
Reduction efficiency DBB η [ ] Reduction efficiency WBB η [ ]
Hard coal Lignite Hard coal
range value3) range value3) range value3)
no measure4) 0 0 0 0 0 0
LNB 010 - 030 020 010 - 030 020 010 - 030 020
SAS 010 - 040 030 010 - 040 030 010 - 040 030
OFA 010 - 040 030 010 - 035 025 010 - 035 025
FGR 005 - 015 010 005 - 020 015 010 - 025 020
LNBSAS 020 - 060 045 020 - 060 040 020 - 060 045
LNBOFA 020 - 060 045 020 - 055 040 020 - 060 045
LNBFGR 015 - 040 030 015 - 045 030 020 - 050 035
SASOFA 020 - 065 050 020 - 060 040 020 - 060 040
SASFGR 015 - 050 040 015 - 050 040 020 - 055 045
OFAFGR 015 - 050 040 015 - 050 035 020 - 050 040
LNBSASOFA 030 - 075 060 030 - 075 060 030 - 075 060
LNBSASFGR 025 - 065 050 025 - 070 050 030 - 070 055
LNBOFAFGR 025 - 065 050 025 - 065 050 030 - 065 050
old installationoptimised 015 015 015
old installationretrofitted2) 050 050 050
new installation2) 040 040 040
Note
1) Selection from the DECOF database developed by and available at the Institute for Industrial Production
(IPP)
2) Recommended values when no information concerning the type of primary measure is available
3) Default values used in the computer programme
4) No primary measures are installed This case is mainly relevant for old installations
1A1 Energy industries
EMEPEEA air pollutant emission inventory guidebook 2019 81
Table B3 NOx secondary abatement measure efficiencies and availabilities
No
Type of
secondary
measure
Reduction
efficiency
η [ ]
Availabilty
β [ ]
1 SNCR 050 099
2 SCR 080 099
3 AC 070 099
4 DESONOX 095 099
1A1 Energy industries
EMEPEEA air pollutant emission inventory guidebook 2019 82
Annex C Sulphur content in fuels
Fuel sulphur contents from the previous Guidebook (Chapter B111)
Table C-1 Sulphur content in fuels
Type of fuel
Sulphur content of fuel
NAPFUE
code value1) range unit
Solid
Coal
hc coking 101 04 ndash 62 wt- (maf)
hc steam 102 04 ndash 62 wt- (maf)
hc sub-bituminous 103 04 ndash 62 wt- (maf)
bc broan coalligninte 105 04 ndash 62 wt- (maf)
bc briquettes 106 025 ndash 04510) wt- (maf)
Coke
hc coke oven 107 lt 13) wt- (maf)
bc coke oven 108 05 ndash 1 3) 4) wt- (maf)
petroleum 110
Biomass
wood 111 lt 0033) wt- (maf) charcoal 112 lt 0033) wt- (maf)
peat 113
Waste
municipal 114 industrial 115 wood 116
agricultural 117
Liquid
Oil
residual 203 03 5) ndash 35 6) wt- gas 204 038) 008 ndash 10 wt- diesesl 205 038) wt-
kerosene
motor
206
lt 0059)
wt-
gasoline 208
naphtha 210
black liquour 215
Gas
Gas2) natural 301 000757) gm-3
Gas
liquified petroleum gas 303 - coke oven 304 8 gm-3 blast furnace 305 4510-3 7) gm-3 coke oven and blast furnace 306 waste 307 refinery 308 le 8 7) gm-3 biogas 309
from gas works 311
Notes
1) Recommended value
2) Only trace amounts
3) Marutzky 1989
4) Boelitz 1993
5) Mr Hietamaumlki (Finland) personal communication
6) Referring to NL-handbook 198899 the range is 20 ndash 35
7) NL-handbook 1988
8) 87219 CEE 1987
9) as ~ 0
10) Davids 1986
1A1 Energy industries
EMEPEEA air pollutant emission inventory guidebook 2019 83
Annex D Emission factors derived from emission limit values
Table D1 TSP
Source
[1]
Fuel
type
[2]
New or
existing
plant [3]
Boiler size
or
technology
MWth
Reference
O2
content
vv dry
AEL or ELV concentration
mgm-3 at STP (0ordmC 1013
kPa) dry at reference O2
content
Emission factor[4]
gGJ-1
(net thermal
input)
Low High Low High
BREF coal new 50-100 6 5 20 18 72
BREF coal new 100-300 6 5 20 18 72
BREF coal new gt 300 6 5 20 18 72
LCPD coal new 50-500 6 100 362
LCPD coal new gt 500 6 50 181
LCPD coal new 50-100 6 50 181
LCPD coal new gt 100 6 30 109
BREF coal existing 50-100 6 5 30 18 109
BREF coal existing 100-300 6 5 30 18 109
BREF coal existing gt 300 6 5 30 18 109
LCPD coal existing 50-500 6 100 362
LCPD coal existing gt 500 6 50 181
BREF wood new 50-100 6 5 20 19 77
BREF wood new 100-300 6 5 20 19 77
BREF wood new gt 300 6 5 20 19 77
BREF wood existing 50-100 6 5 20 19 77
BREF wood existing 100-300 6 5 20 19 77
BREF wood existing gt 300 6 5 20 19 77
BREF oil new 50-100 3 5 20 14 57
BREF oil new 100-300 3 5 20 14 57
BREF oil new gt 300 3 5 10 14 28
LCPD oil new gt 50 3 50 141
LCPD oil new 50-100 6 50 170
LCPD oil new gt 100 6 30 102
BREF oil existing 50-100 3 5 30 14 85
BREF oil existing 100-300 3 5 25 14 71
BREF oil existing gt 300 3 5 20 14 57
LCPD oil existing gt 50 3 50 141
LCPD gas new gt 50 3 5 14
LCPD gas new gt 50 3 5 14
LCPD gas existing gt 50 3 5 14
Notes
1) BREF denotes the large combustion plant BAT reference document LCPD denotes Directive
200180EC
2) Fuel is main classification only limits may be for lsquosolid fuelsrsquo rather than coal or wood Limits for gaseous
fuels are for natural gas and may not be applicable to derived or other gaseous fuels
3) Note that new and existing plant have specific meanings under LCPD
4) Emission factors calculated from emission concentrations using USEPA methodology (See Appendix E
for details)
1A1 Energy industries
EMEPEEA air pollutant emission inventory guidebook 2019 84
Table D2 Nitrogen oxides
Source [1]
Fuel type [2]
New or existing plant [3]
Boiler size or technology
MWth
Reference O2 content vv dry
AEL or ELV concentration mg NO2m-3 at STP (0ordmC 1013 kPa) dry at reference O2 content
Emission factor [4] gGJ-1 (net thermal input)
Low High Low High
BREF coal new 50-100 6 90 300 326 1087
BREF coal new 100-300 6 90 200 326 725
BREF coal new gt 300 6 50 150 181 543
LCPD coal new 50-500 6 600 2174
LCPD coal new gt 500 6 500 1811
LCPD coal New 2016 gt 500 6 200 725
Goburg coal new 50-100 6 400 1449
Goburg coal new 100-300 6 300 1087
Goburg coal new gt 300 6 200 725
BREF coal existing 50-100 6 90 300 326 1087
BREF coal existing 100-300 6 90 200 326 725
BREF coal existing gt 300 6 50 200 181 725
LCPD coal existing 50-500 6 600 2174
LCPD coal existing gt 500 6 500 1811
LCPD coal Ex 2016 gt 500 6 200 725
Goburg coal existing gt 50 6 650 2355
BREF wood new 50-100 6 150 250 579 964
BREF wood new 100-300 6 150 200 579 771
BREF wood new gt 300 6 50 150 193 579
LCPD wood new 50-100 6 400 1543
LCPD wood new 100-500 6 300 1157
LCPD wood new gt 500 6 200 771
Goburg wood new 50-100 6 400 1543
Goburg wood new 100-300 6 300 1157
Goburg wood new gt 300 6 200 771
BREF wood existing 50-100 6 150 300 579 1157
BREF wood existing 100-300 6 150 250 579 964
BREF wood existing gt 300 6 50 200 193 771
Goburg wood existing gt 50 6 650 2507
BREF oil new 50-100 3 150 300 424 849
BREF oil new 100-300 3 50 150 141 424
BREF oil new gt 300 3 50 100 141 283
LCPD oil new 50-100 3 400 1132
LCPD oil new 100-300 3 200 566
LCPD oil new gt 300 3 200 566
Goburg oil new 50-100 3 400 1132
Goburg oil new 100-300 3 300 849
Goburg oil new gt 300 3 200 566
BREF oil existing 50-100 3 150 450 424 1273
BREF oil existing 100-300 3 50 200 141 566
BREF oil existing gt 300 3 50 150 141 424
LCPD oil existing 50-500 3 450 1273
LCPD oil existing gt 500 3 400 1132
Goburg oil existing gt 50 3 450 1273
BREF gas new gt 50 3 50 100 142 283
LCPD gas new 50-300 3 150 425
LCPD gas new gt 300 3 100 283
Goburg gas new 50-300 3 150 425
Goburg gas new gt 300 3 100 283
BREF gas existing gt 50 3 50 100 142 283
LCPD gas existing 50-500 3 300 850
LCPD gas existing gt 500 3 200 566
Goburg gas existing gt 50 3 350 991
Notes
1) BREF denotes the large combustion plant BAT reference document LCPD denotes Directive
200180EC Goburg denotes the Gothenburg protocol of 1999
2) Fuel is main classification only limits may be for lsquosolid fuelsrsquo rather than coal or wood Limits for gaseous
fuels are for natural gas and may not be applicable to derived or other gaseous fuels
3) Note that new and existing plant have specific meanings under LCPD
4) Emission factors calculated from emission concentrations using USEPA methodology (See Appendix E
for details)
1A1 Energy industries
EMEPEEA air pollutant emission inventory guidebook 2019 85
Table D3 Sulphur oxidesdioxide
Source [1]
Fuel type [2]
New or existing plant [3]
Boiler size or technology
MWth
Reference O2 content vv dry
AEL or ELV concentration mgm-3 at STP (0ordmC 1013 kPa) dry at reference
O2 content
Emission factor [4] gGJ-1 (net thermal input)
Low High Low High
BREF coal new 50-100 6 150 400 543 1449
BREF coal new 100-300 6 100 200 362 725
BREF coal new gt 300 6 20 200 72 725
LCPD coal new 50-100 6 2000 7245
LCPD coal new 100-500 6 400 2000 1449 7245
LCPD coal new gt 500 6 400 1449
Goburg coal new 50-100 6 850 3079
Goburg coal new 100-300 6 200 850 725 3079
Goburg coal new gt 300 6 200 725
BREF coal existing 50-100 6 150 400 543 1449
BREF coal existing 100-300 6 100 250 362 906
BREF coal existing gt 300 6 20 200 72 725
LCPD coal existing 50-100 6 2000 7245 00
LCPD coal existing 100-500 6 400 2000 1449 7245
LCPD coal existing gt 500 6 400 1449
Goburg coal existing 50-100 6 2000 7245
Goburg coal existing 100-500 6 400 2000 1449 7245
Goburg coal existing gt 500 6 400 1449 00
BREF wood new 50-100 6 200 300 771 1157
BREF wood new 100-300 6 150 300 579 1157
BREF wood new gt 300 6 50 200 193 771
LCPD wood new 50-100 6 200 771
LCPD wood new 100-500 6 200 771
LCPD wood new gt 500 6 200 771
Goburg wood new 50-100 6 850 3278
Goburg wood new 100-300 6 200 850 771 3278
Goburg wood new gt 300 6 200 771
BREF wood existing 50-100 6 200 300 771 1157
BREF wood existing 100-300 6 150 300 579 1157
BREF wood existing gt 300 6 50 200 193 771
Goburg wood existing 50-100 6 2000 7714
Goburg wood existing 100-500 6 400 2000 1543 7714
Goburg wood existing gt 500 6 400 1543
BREF oil new 50-100 3 100 350 283 990
BREF oil new 100-300 3 100 200 283 566
BREF oil new gt 300 3 50 150 141 424
LCPD oil new 50-100 3 850 2405
LCPD oil new 100-300 3 200 400 566 1132
LCPD oil new gt 300 3 200 566
Goburg oil new 50-100 3 850 2405
Goburg oil new 100-300 3 200 850 566 2405
Goburg oil new gt 300 3 200 566
BREF oil existing 50-100 3 100 350 283 990
BREF oil existing 100-300 3 100 250 283 707
BREF oil existing gt 300 3 50 200 141 566
LCPD oil existing 50-300 3 1700 4810
LCPD oil existing 300-500 3 400 1700 1132 4810
LCPD oil existing gt 500 3 400 1132
Goburg oil existing 50-300 3 1700 4810
Goburg oil existing 300-500 3 400 1700 1132 4810
Goburg oil existing gt 500 3 400 1132
Goburg gas new gt 50 3 35 99
LCPD gas new gt 50 3 35 99
LCPD gas existing gt 50 3 35 99
Goburg gas existing gt 50 3 35 99
Notes
1) BREF denotes the large combustion plant BAT reference document LCPD denotes Directive
200180EC Goburg denotes the Gothenburg protocol of 1999
2) Fuel is main classification only limits may be for lsquosolid fuelsrsquo rather than coal or wood Limits for gaseous
fuels are for natural gas and may not be applicable to derived or other gaseous fuels
3) Note that new and existing plant have specific meanings under LCPD
4) Emission factors calculated from emission concentrations using USEPA methodology (See Appendix E
for details)
1A1 Energy industries
EMEPEEA air pollutant emission inventory guidebook 2019 86
Table D4 Gas turbines and stationary engines
Source
[1]
Fuel
type
[2]
New or
existing
plant [3]
Technology Reference
O2 content
vv dry
Pollutant AEL or ELV concentration
mgm-3 at STP (0ordmC 1013 kPa)
dry at reference O2 content
Emission factor [4]
gGJ-1
(net thermal input)
Low High Low High
BREF gas new GT 15 TSP 5 43
BREF gas existing GT 15 TSP 5 43
BREF gas new GT 15 SO2 10 86
BREF gas existing GT 15 SO2 10 86
BREF gas new GT 15 NOx 20 50 172 430
LCPD gas new GT 15 NOx 50 75 430 644
LCPD oil new GT 15 NOx 120 1030
Goburg gas new GT 15 NOx 50 75 430 644
Goburg oil new GT 15 NOx 120 1030
BREF gas existing GT 15 NOx 20 90 172 773
Goburg gas existing GT 15 NOx 150 1289
Goburg oil existing GT 15 NOx 200 1717
BREF gas new Gas engine 15 NOx 20 75 172 644
Goburg gas new Gas engine 5 NOx 250 500 797 1594
BREF gas existing Gas engine 15 NOx 20 100 172 859
Goburg gas new CI Engine 5 NOx 500 1594
Goburg oil new CI Engine 5 NOx 500 600 1593 1911
Notes
1) BREF denotes the large combustion plant BAT reference document LCPD denotes Directive
200180EC Goburg denotes the Gothenburg protocol of 1999
2) Fuel is main classification only limits may be for lsquosolid fuelsrsquo rather than coal or wood Limits for gaseous
fuels are for natural gas and may not be applicable to derived or other gaseous fuels
3) Note that new and existing plant have specific meanings under LCPD
4) Emission factors calculated from emission concentrations using USEPA methodology (See Appendix E
for details)
1A1 Energy industries
EMEPEEA air pollutant emission inventory guidebook 2019 87
Annex E Calculation of emission factors from concentrations
E1 Emission factors for combustion activities
Standardisation of emission concentrations from combustion activities
Annual emissions emission rates and emission limit values are generally expressed in terms of
pollutant mass (for example tonnesyear-1 kghr-1 mgm-3) Note that a mass concentration is
meaningless unless the volume conditions are defined mdash typically for a combustion process the
conditions will be a dry volume at STP (0 degC 1013 kPa) and normalised to a reference oxygen
concentration Consumption of fuel requires a minimum theoretical (stoichiometric) quantity of air
In practise more air than the stoichiometric quantity is required to achieve combustion The oxygen
content in exhaust gases from a combustion appliance is indicative of the amount of excess air and
air ingress in the combustion system Normalisation to a reference oxygen content allows
comparison between technologies as it removes a diluting (or concentrating) effect of different levels
of excess airair ingress on the pollutant concentration
Common oxygen concentrations for emission normalisation are
oil- or gas-fired boilers mdash 3 O2
solid-fuel boilers mdash 6 7 O2
wood-fired boilers mdash 6 10 11 or 13 O2
incineration mdash 11 O2
gas turbines mdash 15 O2
stationary engines mdash 5 15 O2
dryers mdash 17 O2
Other normalisation oxygen concentrations are used including 0 O2 which is commonly used in
testing of residential gas appliances Concentrations can also be normalised using carbon dioxide
(although this is much less common)
Usually emission concentration data will be provided as mass concentrations at a specified oxygen
content However where emission data are provided in other forms the following equations may
help the user manipulate the date into a more useful form
Some pollutants are measured and reported on a wet basis and may require standardisation to the
dry condition
[X]d = [X]w 100
(100-[H2O])
where
[X]w is the measured concentration for a wet flue gas (ppm mgm-3 vv)
[X]d is the measured concentration for a dry flue gas (same units as the dry concentration)
[H2O] is the flue gas moisture content as vv on a wet basis
1A1 Energy industries
EMEPEEA air pollutant emission inventory guidebook 2019 88
Many pollutants are measured as volume (molar) concentrations Conversion to a mass
concentration assumes ideal gas behaviour and is detailed below
[X]m = [X]d MW
224
where
[X]d is the measured concentration in ppm (parts per million) by volume for a dry flue gas
[X]m is the measured concentration in mgm-3 by volume for a dry flue gas
MW is the relative molecular mass of the pollutant (for example 64 for SO2)
224 is the volume occupied by 1 kgmole of an ideal gas at 0 degC 1013 kPa (m3)
Note that NOx emission concentrations and emission factors are defined in terms of NO2 Hence the
relative molecular mass used for NOx is 46 VOC emission concentrations are often defined in terms
of carbon Hence the relative molecular mass used for VOC is 12 but this will often be modified
further for the calibration gas applied (for example MW for concentrations measured as propane
C3H8 lsquoequivalentsrsquo would be 3 x 12 = 36)
Normalisation to a reference O2 concentration is given by
[X]ref = [X]m (209-[ O2]ref)
(209-[O2]m)
where
[X]ref is the standardised concentration of the pollutant at the reference O2 content
[x]m is the measured concentration in mgm-3 for a dry flue gas
[O2]m is the measured O2 concentration in on a dry basis
[O2]ref is the reference O2 concentration in on a dry basis (for example 3 6 or 15 )
This calculation is appropriate where pollutant and O2 concentrations are measured on a dry basis
Calculation of emission factors
An emission factor relates the release of a pollutant to a process activity For combustion processes
emission factors are commonly described as the mass of pollutant released per unit of fuel burned
An emission factor can be calculated in several ways the approach adopted uses the standardised
pollutant emission concentrations and the specific theoretical (stoichiometric) volume of flue gas for
the relevant fuel This approach avoids measurement of exhaust gas flow and fuel flows which can
have a high uncertainty and may not be practical at many combustion plant
The approach requires knowledge of the fuel used the pollutant concentration and the oxygen
concentration
Fuel analysis where available allows calculation of the specific flue gas volume from the elemental
analysis However the US Environmental Protection Agency Method 19 provides flue gas volume for
common fuels For other fuels (for example derived gases landfill gas unrefined natural gas or
waste-derived fuels) fuel analysis is advised to minimise uncertainty
1A1 Energy industries
EMEPEEA air pollutant emission inventory guidebook 2019 89
Fuel analysis route the fuel analysis and combustion calculations are used to determine the
stoichiometric air requirement and dry flue gas volume per volume or mass of fuel Note that it is
important to understand the analysis reporting conditions particularly for solid fuels The
calculations assume ideal gas behaviour A dry flue gas volume is calculated for the reference O2
concentration used to normalise the pollutant emission concentration A pollutant emission factor
(EF) can hence be calculated by multiplying the standardised pollutant concentration by the dry flue
gas volume at the same reference oxygen content
Generally the flue gas volumes generated from combustion of fuel can be calculated in accordance
with the following equations
CXHY + (X+(Y4)O2 = X CO2 + (Y2) H2O
Note that some of the oxygen may be sourced from the fuel For combustion in air each cubic metre
of oxygen is associated with (791209) cubic metres of nitrogen
The dry flue gas volume at stoichiometric conditions (DFGVSC) per unit mass of fuel (or volume for
gaseous fuels) can be calculated and hence the dry flue gas volume at the normalised condition
(DFGVref) for the required reference oxygen content
DFGVref = DFGVSC (209(209-[O2ref]))
A pollutant emission factor (EF) can hence be calculated by multiplying the standardised pollutant
concentration by the dry flue gas volume at the same reference oxygen content For example at 15
oxygen
EF = [X]15 DFGV15
Emission factors are reported in several ways and these are generally recalculated using physical or
other properties of the fuel
For example a thermal emission factor (as used in the Guidebook) can be derived by dividing the
emission factor calculated above by the calorific value of the fuel For the Guidebook this is the net
(inferior) CV
EFthermal = EF
CV
where
EFthermal is the thermal emission factor expressed in units to suit the user (for example g GJ-1)
CV is the net calorific value of the fuel in appropriate units to suit the units of the emission factor
USEPA Method 19 The USEPA provides stoichiometric dry flue gas volume for fuel oil The USEPA
data can be found in USEPA Method 19 (US Code of Federal Regulations Title 40 Part 60
Appendix A) The USEPA lsquoF-factorrsquo data are presented as the volume of dry flue gas at 20 degC
associated with the gross thermal input of the fuel These USEPA conditions are not consistent with
the Guidebook (net calorific basis) or emission concentration reporting practise in Europe (dry gas
at STP mdash 0ordmC 1013 kPa) and consequently some manipulation of the data is required Calculations
assume an ideal gas
The USEPA method can be obtained here wwwepagovttnemcmethodsmethod19html and the
F-factors are provided below
1A1 Energy industries
EMEPEEA air pollutant emission inventory guidebook 2019 90
Fuel type Fd1) Fw1) Fc1)
dscmJ dscf106 Btu wscmJ wscf106 Btu scmJ scf106 Btu
Coal
Anthracite2 27110-7 10100 28310-7 10540 053010-7 1970
Bituminus2 26310-7 9780 28610-7 10640 048410-7 1800
Lignite 26510-7 9860 32110-7 11950 051310-7 1910
Oil3) 24710-7 9190 27710-7 10320 038310-7 1420
Gas
Natural 23410-7 8710 28510-7 10610 028710-7 1040
Propane 23410-7 8710 27410-7 10200 032110-7 1190
Butane 23410-7 8710 27910-7 10390 033710-7 1250
Wood 24810-7 8710 - - 049210-7 1830
Wood bark 25810-7 9240 - - 051610-7 1920
Municipal 25710-7 9600 - - 048810-7 1820
Solid waste - 9570
Notes
1) determined at standard conditions 20degC (68degF) and 760mmHg (2992 inHg)
2) as classified according to ASTM D 388
3) Crude residual or distillate
The Fd factors are used mdash these represent the dry stoichiometric flue gas volume per unit of energy
input The Fw and Fc factors represent the wet flue gas volume and CO2 volumes respectively
The USEPA dry flue gas volume at stoichiometric conditions are first recalculated to provide the flue
gas volume (DFGVref) for the required oxygen content at STP and for the net energy input
Fdrsquo = Fd (273293) ((CVgross)CVnet))
Where
Fdrsquo is the stoichiometric dry flue gas volume at STP per unit of net energy input ndash m3J-1
Fd is the USEPA factor (20 degC and gross energy input)
273293 Volume correction mdash ratio of temperatures in Kelvin
Note that it is the ratio between the fuelsrsquo gross and net calorific values that is needed Indicative
ratios are provided below based on UK data (DUKES 2007)
Fuel CVgross CVnet Unit Ratio grossnet
Power stn coal 262 249 GJtonne-1 105
Industrial coal 266 253 GJtonne-1 105
Wood 119 10 GJtonne-1 108
HFO 433 412 GJtonne-1 105
Gas oil 456 434 GJtonne-1 105
Natural gas 398 358 MJm-3 111
The dry flue gas volume at the normalised oxygen content can then be calculated
Fdref = Fdrsquo (209(209-[O2ref]))
1A1 Energy industries
EMEPEEA air pollutant emission inventory guidebook 2019 91
A pollutant emission factor (EFthermal) can then be calculated by multiplying the standardised
pollutant concentration by the dry flue gas volume at the same reference oxygen content For
example at 15 oxygen
EFthermal = [X]15 Fd15
Emission factors are reported in several ways and these are generally recalculated using physical or
other properties of the fuel
For example a mass emission factor can be derived by multiplying the thermal emission factor
calculated above by the net calorific value of the fuel
EF = EFthermal CV
where
EFthermal is the thermal emission factor expressed in units to suit the user (for example g GJ-1)
CV is the net calorific value of the fuel in appropriate units to suit the units of the emission factor
Example figures for correlation of emission concentrations to emission factors from USEPA
Method 19 F factors are provided in Figures C1 and C2 below
Figure E1 Emission factors mdash selected fuels and standardised concentrations up to
1 000 mgm-3
Emission Factors and Concentrations
0
100
200
300
400
500
600
700
800
900
1000
0 100 200 300 400 500 600 700 800 900 1000
Emission concentration mgm3 dry STP (0C 1013 kPa) at Reference O2
Em
iss
ion
fa
cto
r g
GJ
ne
t
Coal (6 O2)
Wood (6 O2)
Oil gas (3 O2)
Oil gas (15 O2)
1A1 Energy industries
EMEPEEA air pollutant emission inventory guidebook 2019 92
Figure E2 Emission factors mdash selected fuels and standardised concentrations up to
200 mgm-3
0
20
40
60
80
100
120
140
160
180
200
0 20 40 60 80 100 120 140 160 180 200
Emissions concnetrations mgm3 dry at STP (0C 1013kPa) at Reference O2
Em
iss
ion
fa
cto
rs g
GJ
(n
et)
Coal (6 O2)
Wood (6 O2)
Oil gas (3 O2)
Oil gas (15 O2)
1A1 Energy industries
EMEPEEA air pollutant emission inventory guidebook 2019 93
Annex F Emission factors from older versions of the Guidebook
Chapter B111
Table 24 NOx emission factors [gGJ] for combustion plants
Thermal boiler capacity [MW] Thermal boiler capacity [MW]
gt= 30032) gt= 50 and lt 30032)
Type of fuel NAPFUE Type of boiler43) Type of boiler Type of boiler
code DBBboiler27) WBB FBC DBBboiler27) WBB
CFBC
s coal hc coking 101 see table 25 see table 25 701) see table 25 see table 25
s coal hc steam 102 see table 25 see table 25 701) see table 25 see table 25
s coal hc sub-bitumious 103 see table 25 see table 25 701) see table 25 see table 25
s coal bc brown coallignite 105 see table 25 701) see table 25
s coal bc briquettes 106
s coke hc coke oven 107
s coke bc coke oven 108
s coke petroleum 110 3001)
s biomass wood 111 2001)15)
s biomass charcoal 112
s biomass peat 113 3001)28) 3001)
s waste municipal 114
s waste industrial 115
s waste wood 116
s waste agricultural 117
l oil residual 203 2101)29) 2601)28) 155 - 29619)20) 1501)29) 1701)29) 1901)30) 2101)30)
l oil gas 204 64 - 6821) 1001)
l oil diesel 205
l kerosene 206
l gasoline motor 208
l naphtha 210
l black liquor 215
g gas natural 301 1701) 48 - 33322) 23) 1251)25) 1501)26) 48 - 33322)23)24)
g gas liquified petroleum gas 303 88 - 33323)24) 88 - 33323)24)
g gas coke oven 304 1501) 88 - 33323) 24) 1101)25) 1301)26) 88 - 33323)24)
g gas blast furnace 305 951) 88 - 33323) 24) 651)25) 801)26) 88 - 33323)24)
g gas coke oven and blast furnace gas 306 88 - 33323)24) 88 - 33323)24)
g gas waste 307 88 - 33323)24) 88 - 33323)24)
g gas refinery 308 88 - 33323)24) 1401) 88 - 33323)24)
g gas biogas 309 88 - 33323)24) 88 - 33323)24)
g gas from gas works 311
1A1 Energy industries
EMEPEEA air pollutant emission inventory guidebook 2019 94
Table 24 continued
Thermal boiler capacity [MW] no speci-
gt 50 and lt 300 32)
lt 5032) fication
Type of boiler Type of boiler Gas turbine Stationary engine CORINAIR 9044)
FBC GF DBBboiler27) WBB FBC GF
PFBCCFBC PFBC CFBCAFBC SC CC CI SI
1501) 701) 1501) 1801)31) 2301)29) 701) 1501) 54544)
1501) 701) 1501) 1801)31) 2301)29) 701) 1501) 365 - 76144)
1501) 701) 1501) 1801)31) 2301)29) 701) 1501) 205 - 168344)
1501) 701) 1501) 1801)31) 2301)29) 701) 1501) 180 - 38044)
333 - 17544)
3001) 3001) 3001)
2001) 33 - 11515)2001) 33 - 11515) 2001)15) 50 - 20044)
1601) 1001) 2301) 2801) 1601) 1001) 150 - 24044)
90 - 46316)17) 90 - 46316)17) 22044)
139 - 14018) 139 - 14018)
80 - 20044)
886) 16044)
1401)29) 1801)30) 25045) 1090-120045) 24 - 37044)
801) 1001) 120 1)35) 3501)33) 3801)34) 7801)36) 100 - 120045) 50 - 26944)
100 - 70045) 30046) 6001)37)42) 12001)38)10001)40)42) 18001)39)42)
18044)
20 - 44044)
1001) 48 - 33322)23)24) 150 - 36045) 6001)37)42) 12001)38)42)10001)40)42) 18001)39)42) 22 - 35044)
1884)41) 1874)41)
88 - 33323)24) 35 - 10044)
901)23)24) 70 - 57144)
88 - 33323)24) 67 - 33044)
88 - 33323)24)
88 - 33323)24) 35 - 32744)
1401)23)24) 150-15145) 35 - 14044)
88 - 33323)24) 6044)
1A1 Energy industries
EMEPEEA air pollutant emission inventory guidebook 2019 95
Table 25 NOx emission factors [gGJ] for coal combustion according to the model (see Annexes 4 and 5)
Thermal boiler capacity [MW]
gt= 50 sup1)
Type of fuel coal mining country NAPFUE Hu [MJkg] Type of boiler
code (maf) DBB WBB
PM0sup2) PM1 PM2 PM3 PM4 PM0 PM1 PM2 PM3 PM4
s coal hc Australia (101) 34 568 454 312 312 227 703 562 387 422 281
Canada (101) 33 500 405 278 278 202 627 501 345 376 251
China (101) 32 413 331 227 227 165 512 409 281 307 205
Columbia (101) 32 535 428 394 394 214 662 529 364 397 265
Czech Republic (101) 34 483 387 266 266 193 598 479 329 359 239
France 101 35 374 299 205 205 149 463 370 254 278 185
Germany RAG 102 35 384 307 211 211 154 476 381 262 285 190
Germany others 101 30 495 396 272 272 198 613 490 337 368 245
CIS (101) 32 308 247 169 169 123 382 305 210 229 153
Hungary 101 34 401 320 220 220 160 496 397 273 298 198
India 103 30 551 441 303 303 220 682 545 375 409 273
South Africa (101) 32 569 456 313 313 228 705 504 388 423 282
USA (101) 34 563 450 310 310 225 697 558 383 418 279
Venezuela (101) 34 588 471 324 324 235 728 583 401 437 291
s coal bc Czech Republic 105 28 506 405 278 304 202
Germany
- Rheinisch Coal 105 27 325 260 179 195 130
- Middle Germany 105 25 504 403 277 302 202
- East Germany 105 26 539 431 296 323 215
Hungary-1 105 36 379 303 208 227 151
Hungary-2 103 28 379 304 209 228 152
Poland 105 25 531 425 292 319 213
Portugal 105 25 461 369 254 277 185
Turkey-2 103 27 725 580 399 435 2901) The emission factors [gGJ] are given at full load operating modus2) PM0 PM4 = most used combinations of primary
measures = reduction efficiencies [ ] PM0 - no primary measures
PM1 - one primary measure LNB
PM2 - two primary measures LNBSAS
PM3 - two primary measures LNBOFA
PM4 - three primary measures LNBSASOFA
1A1 Energy industries
EMEPEEA air pollutant emission inventory guidebook 2019 96
Table 26 NMVOC emission factors [gGJ] for combustion plants
Thermal boiler capacity [MW] no speci-
Type of fuel NAPFUE gt= 50 lt 50 fication
code boiler GF boiler Gas turbine Stationary engine CORINAIR906)
s coal hc coking 101 35)
302) 502) 6001) 36)
s coal hc steam 102 35)
302) 502) 6001) 1 - 156)
s coal hc sub-bituminous 103 35)
302) 502) 6001) 15 - 156)
s coal bc brown coallignite 105 302)3) 502) 15 - 156)
s coal bc briquettes 106 1501)
s coke hc coke oven 107 121) 5 - 156)
s coke bc coke oven 108
s coke petroleum 110 156)
s biomass wood 111 802) 1005) 1501) 4004) 10 - 486)
s biomass charcoal 112
s biomass peat 113 302)3) 302) 3 - 486)
s waste municipal 114 106)
s waste industrial 115
s waste wood 116 40 - 486)
s waste agricultural 117 506)
l oil residual 203 102)3) 37) 507) 15 - 4766)
l oil gas 204 52) 151) 52) 15 - 27) 15 - 1007) 1002) 15 - 936)
l oil diesel 205
l kerosene 206 36)
l gasoline motor 208
l naphtha 210 36)
l black liquor 215 36)
g gas natural 301 52) 52) 25 - 47) 2002) 2 - 46)
g gas liquified petroleum gas 303 2 - 266)
g gas coke oven 304 25 - 1676)
g gas blast furnace 305 1 - 256)
g gas coke oven and blast furnace gas 306
g gas waste 307 256)
g gas refinery 308 252) 257) 21 - 106)
g gas biogas 309 256)
g gas from gas works 3111) LIS 1977 92 2) CORINAIR 1992 80 3) DBB only 4) small consumers cf 24 5) power plants cf 246) CORINAIR90 data of combustion plants as point sources with a thermal capacity of gt 300 50 - 300 lt 50 MW 7) CORINAIR90 data point sources
1A1 Energy industries
EMEPEEA air pollutant emission inventory guidebook 2019 97
Table 28 CO emission factors [gGJ] for combustion plants
Type of combustion no speci-
Utility combustion Commercial comb Industrial combustion fication
Type of fuel NAPFUE DBBWBB GF boiler GF DBBWBB GF GT stat E CORINAIR909)
code boilers1) stoker boiler1) stoker
spreader travell spreader travelling
s coal hc coking 101 143) 1213) 1953) 972) 134) 812) 1154) 9722) 159)
s coal hc steam 102 143) 1213) 1953) 972) 134) 1154) 972) 10 - 17529)
s coal hc sub-bituminous 103 143) 1213) 1953) 972) 134) 812) 1154) 9722) 12 - 24699)
s coal bc brown coallignite 105 143) 1213) 1953) 162) 134) 1332) 1154) 1602) 96 - 6449)
s coal bc briquettes 106
s coke hc coke oven 107 102 - 1219)
s coke bc coke oven 108
s coke petroleum 110 159)
s biomass wood 111 14733) 1993) 15043) 30 - 3009)
s biomass charcoal 112
s biomass peat 113 30 - 1609)
s waste municipal 114 983)6) 193) 193)7) 963)7) 42 kgMg3)8) 309)
s waste industrial 115
s waste wood 116 12 - 3009)
s waste agricultural 117 58 kgMg3)8) 209)
l oil residual 203 153) 173) 153) 10 - 1510) 10010) 3 - 3269)
l oil gas 204 153) 163) 123) 10 - 2010) 12 - 113010) 10 - 4649)
20611)
l oil diesel 205
l kerosene 206 129)
l gasoline motor 208
l naphtha 210 159)
l black liquor 215 111 - 3149)
g gas natural 301 193) 963) 173) 135) 10 - 2010) 323) 005 - 609)
g gas liquified petroleum gas 303 10 - 139)
g gas coke oven 304 003 - 1309)
g gas blast furnace 305 03 - 6449)
g gas coke oven and blast furnace gas 306
g gas waste 307 01 - 2559)
g gas refinery 308 1010) 2 - 159)
g gas biogas 309 139)
g gas from gas works 311
1A1 Energy industries
EMEPEEA air pollutant emission inventory guidebook 2019 98
1) DBBWBB for coal combustion boiler for other fuel combustion2) EPA 1987 85 CORINAIR 1992 803) Radian 1990 102 IPCC 1994 88 without primary measure4) OECD 1989 100 CORINAIR 1992 805) CORINAIR 1992 80 part 86) grate firing without specification7) small combustion 19 gGJ mass burning 96 gGJ8) open burning9) CORINAIR90 data of combustion plants as point sources with a thermal capacity of gt 300 50 - 300 lt 50 MW10) CORINAIR90 data point sources11) AP42 115
1A1 Energy industries
EMEPEEA air pollutant emission inventory guidebook 2019 99
Chapter B111(S1)PMv1
Table 82a Emission factors for combustion processes burning hard coal
Fuel NAPFUE NFR Codes Activity description Activity detail Emission factor Notes
Hard coal TSP PM10 PM25
Bituminous
coal 101 Various Electricity CHP heat
FF lt 20 mgNm-3 6 6 5 CEPMEIP lsquoBATrsquo
ESP (or FF) lt 50 mgNm-3 15 12 6 Scaled from CEPMEIP ESP factor TSP scaled to a
nominal 100 mgNm-3 limit
ESP lt 100 mgNm-3 30 25 12 From CEPMEIP sub-bit coal lsquohigh efficiency ESPrsquo
TSP scaled to a nominal 100 mgNm-3 limit
ESP Oldconventional
lt 500 mgNm-3 140 70 17
CEPMEIP
Unit with multicyclone 100 60 35 CEPMEIP
Unit uncontrolled or cyclone 500 250 100 CEPMEIP (NB such a high emission
concentration would apply to few if any plant)
Sub-
bituminous
coal
103 Various Electricity CHP heat
plant
FF lt 20 mgNm-3 6 6 5 CEPMEIP lsquoBATrsquo
ESP (or FF)
lt 50 mgNm-3 15 12 6
Scaled from CEPMEIP ESP factor (TSP scaled to a
nominal 100 mgNm-3 limit)
ESP
lt 100 mgNm-3 30 25 12
From CEPMEIP sub-bit coal lsquohigh efficiency ESPrsquo
TSP scaled to a nominal 100 mgNm-3 limit
ESP Oldconventional
lt 500 mgNm-3 140 70 17
CEPMEIP
Unit with multicyclone 100 60 35 CEPMEIP
Unit uncontrolled or cyclone 500 250 100
CEPMEIP (the lower of the two TSP factors the
800 g GJ-1 for small uncontrolled plant is such a
high emission concentration that would apply to
few if any plant)
Coke 107 1A1b Oil refineries Uncontrolled 500 250 100
Coke is unlikely to be burned as primary fuel
when co-fired use the factor for the principal fuel
1A1 Energy industries
EMEPEEA air pollutant emission inventory guidebook 2019 100
Table 82b Emission factors for combustion processes burning brown coal
Fuel
NAPFUE NFR Code Activity description Activity detail Emission factor Notes
TSP PM10 PM25
Brown coal 105 Various Electricity plant CHP
plant heat plant Modern FF lt 20 mgNm-3 9 8 6 CEPMEIP lsquoBATrsquo
High efficiency ESP (or FF) 40 30 14 CEPMEIP
Conventional large unit with
multicyclone
100 60 35 CEPMEIP
Peat 113 Various Electricity plant CHP
plant heat plant
Modern abatement (FF)
lt 30 mgNm3
9 8 6 CEPMEIP
Efficient abatement
lt 50 mgNm3
20 15 10 TSP scaled from emission limit
of 50 mgNm-3
Efficient abatement
lt 100 mgNm3
40 30 20 TSP scaled from emission limit
of 100 mgNm-3
Conventional technology 120 40 20 CEPMEIP
Conventional smaller
multicyclone
300 40 20 CEPMEIP
1A1 Energy industries
EMEPEEA air pollutant emission inventory guidebook 2019 101
Table 82c Emission factors for combustion processes burning other solid fuels
Fuel NAPFUE NFR Code Activity description Activity detail Emission factor Notes
TSP PM10 PM25
Municipal
solid waste 114 Various
Electricity plant CHP
plant heating plant
Effective emission control (BAT) 15 13 10
CEPMEIP (NB care should be taken using
this factor as waste burning is often
controlled under nationalinternational
regulation to a more stringent specification)
Conventional emission control 100 70 55
CEPMEIP (uncontrolled optimised
combustion) (NB care should be taken
using this factor as waste burning is often
controlled under nationalinternational
regulation to a more stringent specification)
Industrial
waste 115 Various
Electricity CHP
heating plant
Effective emission control (BAT) 15 13 10
CEPMEIP (NB care should be taken using
this factor as waste burning is often
controlled under nationalinternational
regulation to a more stringent specification)
Conventional emission control 100 70 55
CEPMEIP (uncontrolled optimised
combustion) (NB care should be taken
using this factor as waste burning is often
controlled under nationalinternational
regulation to a more stringent specification)
Older small uncontrolled 600 350 210
CEPMEIP (uncontrolled optimised
combustion) (NB care should be taken
using this factor as waste burning is often
controlled under nationalinternational
regulation to a more stringent specification)
1A1 Energy industries
EMEPEEA air pollutant emission inventory guidebook 2019 102
Table 82d Emission factors for combustion processes burning natural gas
Fuel NAPFUE NFR Code Activity description Activity detail Emission factor Notes
TSP PM10 PM25
Natural gas 301 Various Electricity CHP and
heating plant
Burner with optimised
combustion 01 01 01
CEPMEIP
Conventional installation 02 02 02 CEPMEIP
Conventional installation 09 09 09 USEPA filterable
1A1 Energy industries
EMEPEEA air pollutant emission inventory guidebook 2019 103
Table 82e Emission factors for combustion of derived gases
Fuel NAPFUE NFR Code Activity description Activity detail Emission factor Notes
TSP PM10 PM25
Gas works
gas 311 Various
Electricity CHP and
heating plant
Clean fuel efficient
combustion 01 01 01 CEPMEIP
Clean fuel conventional
installation 02 02 02 CEPMEIP (conventional installation)
Conventional installation 5 5 5 CEPMEIP (high PM due to fuel quality)
Other
gaseous fuel 314 Various
Electricity CHP and
heating plant
Clean fuel efficient
combustion 01 01 01 CEPMEIP
Conventional installation 5 5 5 CEPMEIP
Coke oven
gas 304 Various
Electricity CHP
heating plant coke
ovens
Clean fuel efficient
combustion 01 01 01 CEPMEIP
Clean fuel conventional
installation 02 02 02 CEPMEIP (conventional installation)
Conventional installation 5 5 5 CEPMEIP
Blast furnace
gas 305 Various
Electricity CHP and
heating plant coke
ovens
Clean fuel efficient
combustion 01 01 01 CEPMEIP
Clean fuel conventional
installation 02 02 02 CEPMEIP (conventional installation)
Conventional installation 5 5 5 CEPMEIP
1A1 Energy industries
EMEPEEA air pollutant emission inventory guidebook 2019 104
Table 82f Emission factors for combustion of heavy fuel oil
Fuel NAPFUE NFR Code Activity description Activity detail Emission factor Notes
TSP PM10 PM25
Residual fuel oil 203 Various Electricity CHP and
heating plant
Low S fuel with optimised
burner and abatement 3 3 25 CEPMEIP (about 10 mgNm-3 or BAT)
Low S fuel efficient
combustion 14 12 10 CEPMEIP (about 50 mgNm-3)
Low-medium S fuel
conventional installation 20 15 9 CEPMEIP (about 70 mgNm-3)
Low-medium S fuel
conventional installation 60 50 40
CEPMEIP (higher of two entries used About
200 mgN Nm-3)
High S fuel 210 190 130
CEPMEIP (lower of two entries for high S
used (higher entry 240 g GJ-1 for TSP) Very
high emission concentration (about
750 mgNm-3)
Petroleum coke 110 1A1b Oil refineries Conventional multicyclone 100 60 35 CEPMEIP Bit coal factors more
appropriate
1A1 Energy industries
EMEPEEA air pollutant emission inventory guidebook 2019 105
Table 82g Emission factors for combustion of other liquid fuels
Fuel NAPFUE NFR Code Activity description Activity detail Emission factor Notes
TSP PM10 PM25
Gasdiesel oil 205 Various Electricity CHP
heating plant
Optimised burner 2 2 2 CEPMEIP
Conventional burner 5 5 5 CEPMEIP
Naphtha 210 1A1b Oil refineries All units 5 5 5 CEPMEIP
Liquefied
petroleum gas 303 Various
Electricity CHP
heating plant
Optimised burner 01 01 01 CEPMEIP
Conventional burner 5 5 5 CEPMEIP
Refinery gas 308 Various Electricity CHP
heating plant
Optimised burner 01 01 01 CEPMEIP
Conventional burner 5 5 5 CEPMEIP
Other oil 224 Various Electricity CHP
heating plant
Low S fuel optimised burner 3 3 25 CEPMEIP
Low S fuel efficient
combustion 14 12 10
CEPMEIP for residual oil (About 50 mgNm-
3 LCPD limit for existing plant)
Low-medium S fuel
conventional installation 20 15 9 CEPMEIP (about 70 mgNm-3)
Low-medium S fuel
conventional installation 60 50 40
CEPMEIP (highest of similar entries with TSP
of 35 40 50 and 60 used About 200 mgN
Nm-3)
High S fuel 210 190 130
CEPMEIP lower of two entries for high S
used (This is a very high emission
concentration about 750 mgN Nm-3)
1A1 Energy industries
EMEPEEA air pollutant emission inventory guidebook 2019 106
Table 82h Emission factors for combustion of biomass
Fuel NAPFUE NFR Code Activity description Activity detail Emission factor Notes
TSP PM10 PM25
Wood 111 Various Electricity CHP
heating plant
Modern unit with FF
lt 20 mgNm3 TSP 7 7 6
TSP scaled from BAT benchmark fractions
applied based on bit Coal
Older unit lt 100 mgNm3 TSP 35 25 12 TSP scaled from emission concentration
fractions based on bit Coal
Uncontrolled conventional
installation 100 70 55 CEPMEIP (uncontrolled multicyclone)
Conventional minimal control 160 150 150 CEPMEIP for conventional installation
Charcoal 112 1A2c Chemicals
Conventional large unit with
multicyclone 100 60 35
CEPMEIP the use of charcoal is likely to be
very rare
400 100 35 CEPMEIP the use of charcoal is likely to be
very rare
Black liquour 215 1A2f Textile and leather
(pulp and paper) Conventional installation 160 150 150
CEPMEIP (NB such a high emission
concentration would apply to few if any
plant)
Biogas 309 Various Electricity CHP
heating plant
Modern optimised large
installation 3 3 25 (CEPMEIP clean fuel)
Conventional burner 5 5 5 CEPMEIP
Modern optimised 20 15 10 CEPMEIP (gasification plant)
1A1 Energy industries
EMEPEEA air pollutant emission inventory guidebook 2019 107
Chapter B111(S2)PMv2
Default emission factors for use with simpler methodology (Tier 1)
Fuel Technology Emission factor g GJ-1 Notes (4)
TSP PM10 PM25
Hard coal (assumes
20 ash)
Brown coal
Other solid fuels
Pulverised coal ESP 30 20 9 Based on AP-42 mdash assumes 20 ash content and PM emissions from solid mineral
fuels generally similar to coal Pulverised coal fluid bed other FF 74 74 37
Cyclone furnace ESP 61 42 23
Stoker with multicyclone 330 230 27
Pulverised coal ESP + wet limestone FGD 6 6 5 From CEPMEIP data (US EPA default factors for wet scrubbers are very high)
Natural gas 09 09 09 AP-42 filterable PM factor
Derived gases 5 5 5 CEPMEIP data worst case for derived gases
Heavy fuel oil
(1 S)
No control 25 18 13 Assumes 1 sulphur as specified in the EU sulphur content of liquid fuels Directive
FGD 15 15 15
Heavy fuel oil
(3 S)
No control 64 45 33 Assumes 3 sulphur (maximum permitted in EU countries)
FGD 38 38 37
Other liquid fuels LPG 20 20 20
Biomass FF 51 38 33 AP-42 wood waste
ESP 28 21 18
(4) Source R Stewart (2006) US EPA AP 42 (1996) CEPMEIP (2006)
1A1 Energy industries
EMEPEEA air pollutant emission inventory guidebook 2019 108
Table 82a Emission factors for combustion processes burning hard coal
Fuel NAPFUE NFR Codes Activity description Activity detail (5) Emission factor
gGJ-1 Notes (6)
Hard coal TSP PM10 PM25
Bituminous
coal 101 Various
Electricity plant CHP
plant
FGD ESP or FF lt 20 mgNm-3 (BAT) 6 6 5 CEPMEIP
ESP (or FF) lt 50 mgNm-3 (LCPD) 15 12 6 Scaled from CEPMEIP ESP factor
ESP lt 100 mgNm-3 (LCPD) 30 25 12
From CEPMEIP sub-bit coal lsquohigh
efficiency ESPrsquo TSP scaled to the EU LCP
Directive existing plant sub 100 MWth limit
ESP Oldconventional
lt 500 mg Nm-3 140 70 17 CEPMEIP
Large unit with multicyclone 100 60 35 CEPMEIP
Large unit uncontrolled or cyclone 500 250 100
CEPMEIP (NB such a high emission
concentration would apply to few if any
plant)
Sub-
bituminous
coal
103 Various Electricity plant CHP
plant heat plant
FGD ESP or FF lt 20 mgNm-3 (BAT) 6 6 5 CEPMEIP
ESP (or FF) lt 50 mgNm-3 (LCPD) 15 12 6 Scaled from CEPMEIP ESP factor
ESP lt 100 mgNm-3 (LCPD) 30 25 12
From CEPMEIP sub-bit coal lsquohigh
efficiency ESPrsquo TSP scaled to LCPD
existing plant sub 100 MWth limit
ESP oldconventional
lt 500 mgNm-3 140 70 17 CEPMEIP
Conventional large unit with
multicyclone 100 60 35 CEPMEIP
Conventional unit uncontrolled or
cyclone 500 250 100
CEPMEIP (NB such a high emission
concentration would apply to few if any
plant)
Coke 107
Coke is unlikely to be burned as primary
fuel when co-fired use the factor for the
principal fuel
(5) KEY FGD flue gas desulphurisation ESP electrostatic precipitator FF fabric filter BAT Best Available Techniques LCPD large combustion plant data
(6) Sources R Stewart (2006) US EPA AP-42 (1996) CEPMEIP (2006)
1A1 Energy industries
EMEPEEA air pollutant emission inventory guidebook 2019 109
Table 82b Emission factors for combustion processes burning brown coal
Fuel
NAPFUE NFR Code Activity description Activity detail Emission factor
ReferenceComments
TSP PM10 PM25
Brown coal 105 Various Electricity plant CHP
plant heat plant
FGD ESP or FF lt 20 mgNm-3 (BAT) 9 8 6 CEPMEIP
High efficiency ESP (or FF) 40 30 14
CEPMEIP (NB such a high emission
concentration would apply to few if any
plant)
Conventional large unit with
multicyclone 100 60 35
CEPMEIP (NB such a high emission
concentration would apply to few if any
plant)
Older ESP 160 80 20
CEPMEIP (NB such a high emission
concentration would apply to few if any
plant)
Older installation uncontrolled or
cyclone 500 250 100
CEPMEIP (NB such a high emission
concentration would apply to few if any
plant)
Peat 113 Various Electricity plant CHP
plant heat plant
BATnew LCPD modern end-of-
pipe abatement FGD ESP or FF
lt 30 mgNm3
9 8 6 CEPMEIP
Efficient abatement LCP larger
facility lt 50 mgNm3 20 15 10
TSP scaled from LCP emission limit of
50 mgNm-3
Efficient abatement LCP
lt 100 MWth lt 100 mgNm3 40 30 20
TSP scaled from LCP emission limit of
50 mgNm-3
Conventional technology 120 40 20 CEPMEIP
Conventional smaller
multicyclone 300 40 20 CEPMEIP
1A1 Energy industries
EMEPEEA air pollutant emission inventory guidebook 2019 110
Table 82c Emission factors for combustion processes burning other solid fuels
Fuel
NAPFUE NFR Code Activity description Activity detail Emission factor Reference
TSP PM10 PM25
Municipal
solid waste
114 Various Electricity plant CHP
plant heating plant
Effective emission control (BAT) 15 13 10
CEPMEIP (NB care should be taken using this
factor as waste burning is often controlled
under nationalinternational regulation to a
more stringent specification)
(Solid) Conventional emission control 100 70 55
CEPMEIP (uncontrolled optimised combustion)
(NB care should be taken using this factor as
waste burning is often controlled under
nationalinternational regulation to a more
stringent specification)
Industrial
Waste 115 Various
Electricity CHP
heating plant
Effective emission control (BAT) 15 13 10
CEPMEIP (NB care should be taken using this
factor as waste burning is often controlled
under nationalinternational regulation to a
more stringent specification)
Conventional emission control 100 70 55
CEPMEIP (uncontrolled optimised combustion)
(NB care should be taken using this factor as
waste burning is often controlled under
nationalinternational regulation to a more
stringent specification)
Table 82d Emission factors for combustion processes burning natural gas
Fuel (IPCC
Cat)
NAPFUE NFR Code Activity description Activity detail Emission factor Reference
TSP PM10 PM25
Natural gas 301 Various Electricity CHP and heating
plant
Burner with optimised combustion 01 01 01 CEPMEIP
Conventional installation 02 02 02 CEPMEIP
Conventional installation 09 09 09 USEPA AP-42 filterable PM (all PM stated to
be PM1 )
1A1 Energy industries
EMEPEEA air pollutant emission inventory guidebook 2019 111
Table 82e Emission factors for combustion of derived gases
Fuel
(IPCC Cat) NAPFUE NFR Code Activity description Activity detail Emission factor
Reference
TSP PM10 PM25
Gas works
gas 311 Various
Electricity CHP and
heating plant
Clean fuel efficient combustion 01 01 01 CEPMEIP
Clean fuel conventional
installation 02 02 02
CEPMEIP (conventional
installation)
Conventional installation 5 5 5 CEPMEIP (NB high PM due
to fuel quality)
Other
gaseous fuel 314 Various
Electricity CHP and
heating plant
Clean fuel efficient combustion 01 01 01 CEPMEIP
Conventional installation 5 5 5
CEPMEIP
Coke oven
gas 304 Various
Electricity CHP
heating plant coke
ovens
Clean fuel efficient combustion 01 01 01 CEPMEIP
Clean fuel conventional
installation 02 02 02
CEPMEIP (conventional
installation)
Conventional installation 5 5 5 CEPMEIP
Blast furnace
gas 305 Various
Electricity CHP and
heating plant coke
ovens
Clean fuel efficient combustion 01 01 01 CEPMEIP
Clean fuel conventional
installation 02 02 02
CEPMEIP (conventional
installation)
Conventional installation 5 5 5 CEPMEIP
1A1 Energy industries
EMEPEEA air pollutant emission inventory guidebook 2019 112
Table 82f Emission factors for combustion of heavy fuel oil
Fuel
(IPCC Cat) NAPFUE NFR Code Activity description Activity detail Emission factor
Reference
TSP PM10 PM25
Residual fuel
oil 203 Various
Electricity CHP and
heating plant
Low S fuel with optimised
burner or abatement 3 3 25
CEPMEIP (equivalent to about 10 mgNm3 or
BAT)
Low S fuel efficient
combustion 14 12 10
CEPMEIP about 50 mgNm3 (EU LCPD limit
for existing plant)
Low-medium S fuel
conventional installation 20 15 9
CEPMEIP (equivalent to about 70mgNm3
Low-medium S fuel
conventional installation 60 50 40
CEPMEIP the higher of two entries used
about 200 mgNm3
High S fuel 210 190 130
CEPMEIP the lower of two entries for high S
used (NB such a high emission
concentration 750 mgNm3 would apply to
few if any plant)
Petroleum
coke 110 1A1b Oil refineries Conventional multicyclone 100 60 35
CEPMEIP NB the factor is very high
compared to the EU LCP Directive ELVs and
BAT for large furnaces Bit coal factors more
appropriate
1A1 Energy industries
EMEPEEA air pollutant emission inventory guidebook 2019 113
Table 82g Emission factors for combustion of other liquid fuels
Fuel
(IPCC Cat) NAPFUE NFR Code Activity description Activity detail Emission factor
Reference
TSP PM10 PM25
Gasdiesel oil 205 Various Electricity CHP
heating plant
Optimised burner 2 2 2 CEPMEIP
Conventional burner 5 5 5 CEPMEIP
Naphtha 210 1A1b Oil refineries All units 5 5 5 CEPMEIP
Liquefied
petroleum gas 303 Various
Electricity CHP
heating plant
Optimised burner 01 01 01 CEPMEIP
Conventional burner 5 5 5 CEPMEIP
Refinery gas 308 Various Electricity CHP
heating plant
Optimised burner 01 01 01 CEPMEIP
Conventional burner 5 5 5 CEPMEIP
Other oil 224 Various Electricity CHP
heating plant
Low S fuel optimised burner 3 3 25 CEPMEIP
Low S fuel efficient combustion 14 12 10 CEPMEIP for residual oil About 50 mgNm3
(LCPD limit for existing plant)
Low-medium S fuel conventional
installation 20 15 9
CEPMEIP (equivalent to about 70 mgNm3
Low-medium S fuel conventional
installation 60 50 40
CEPMEIP (highest of similar entries with
TSP of 35 40 50 and 60 used About
200 mgNm-3)
High S fuel 210 190 130
CEPMEIP lower of two entries for high S
used (NB this is a very high emission
concentration ~750 mgNm3)
1A1 Energy industries
EMEPEEA air pollutant emission inventory guidebook 2019 114
Table 82h Emission factors for combustion of biomass
Fuel
(IPCC Cat) NAPFUE NFR Code Activity description Activity detail Emission factor
Reference
TSP PM10 PM25
Wood 111 Various Electricity CHP
heating plant
Modern BAT unit
lt 20 mgNm3 TSP 7 7 6
TSP scaled from BAT benchmark fractions
applied based on bit coal
Older unit lt 100 mgNm3 TSP 35 25 12 TSP scaled from emission concentration
fractions based on bit coal
Uncontrolled conventional 100 70 55 CEPMEIP (equivalent to an uncontrolled
multicyclone)
Charcoal 112 1A2c Chemicals Conventional large unit with
multicyclone 100 60 35
CEPMEIP (NB the use of charcoal in LCP is
likely to be rare
Black liquour 215 1A2f Textile and leather
(pulp and paper ) Conventional installation 160 150 150
CEPMEIP (NB such a high emission
concentration would apply to few if any
plant)
Biogas 309 Various Electricity CHP
Heating plant
Modern optimised large
installation 3 3 25
CEPMEIP (cleaned fuel)
Conventional burner 5 5 5 CEPMEIP
Modern optimised 20 15 10 CEPMEIP (gasification plant) seems high
for gaseous fuel
Conventional installation 160 150 150
CEPMEIP (NB such a high emission
concentration would apply to few if any
plant)
1A1 Energy industries
EMEPEEA air pollutant emission inventory guidebook 2016 115
Chapter B111(S3)PMv3
Default emission factors for use with simpler methodology (Tier 1)
Fuel Technology Emission factor gGJ-1 Notes
TSP PM10 PM25
Hard coal - - - Not applicable
Brown coal - - - Not applicable
Other solid fuels - - - Not applicable
Natural gas Gas turbines 09 09 09 US EPA
Spark ignition 18 18 18 US EPA 2-stroke lean burn 4-stroke lean burn is 004 gGJ-1
Derived gases Gas turbine 11 11 11 Based on US EPA landfill gas
Heavy fuel oil Diesel 28 23 22 US EPA factor for diesel engines
Other liquid fuels Gas turbine 20 20 20 US EPA factor for PM applied to other fractions
Diesel 28 23 22 US EPA
Biomass Gas turbine 11 11 11 Landfill gas
Gas turbine 57 57 57 Anaerobic digester gas
Table 92a Emission factors for gas turbines combustion processes
Fuel
NAPFUE NFR Codes Activity description Activity detail Emission factor gGJ-1 Notes
TSP PM10 PM25
Natural gas 09 09 09 Sierra (234 tests) assumed all
PM25
Gas oil 3 3 3 Sierra (15 tests) assumed all
PM25
1A1 Energy industries
EMEPEEA air pollutant emission inventory guidebook 2016 116
Table 92b Emission factors for compression ignition combustion processes
Fuel
(IPCC Cat) NAPFUE NFR Code Activity description Activity detail
Emission factor
gGJ-1
ReferenceComments
TSP PM10 PM25
Natural gas Dual fuel engine gas with HFO 11 11 11 LCP BREF assumed all PM25
Heavy fuel oil
Diesel engine 50 41 39 LCP BREF lsquoBATrsquo US EPA profile applied
Diesel engine lt 64 53 50 LCP BREF US EPA profile applied applicable to
older equipment
Gas oil
Diesel engine lt 002 S lt 26 21 20 LCP BREF US EPA profile
Diesel engine lt 17 14 14 Smaller unit with diesel particulate filter US EPA
profile

1A1 Energy industries
EMEPEEA air pollutant emission inventory guidebook 2019 8
314 Combustion of gas and oil
31411 Boilers and furnaces
The technologies in use range from comparatively small package firetube boilers (capacities up to
about 20 MWth) to large water tube boilers of up to about 2 000 MWth capacity
31412 Gas turbines
Gas turbines are installed with a thermal capacity ranging from several hundred kW up to about
1 000 MWth Gaseous fuels are mainly used such as natural gas or in some instances process gases
or gasification products Liquid fuels are used such as light distillates (eg naphtha kerosene or gas
oil) but in general use of liquid fuels is limited to specific applications or as a standby fuel
Gas turbines are aero-derivative designs (ie based on multiple shaft engines derived from aircraft
engine types) or industrial heavy-duty gas turbines (based on single shaft designs) Gas turbines for
electricity generation can be open (simple) cycle units but are often installed as a part of a combined
cycle gas turbine (CCGT) In a CCGT installation a heat recovery steam generator (HRSG) is used to
recover waste heat from the combustion gases providing steam to power a steam turbine which
drives an alternator providing more electricity The net rated efficiency of a modern CCGT is in excess
of 50
Gas turbines are often found in co-generation plant the gas turbine directly coupled to an electricity
generator and the energy from hot exhaust gases recovered in a suitable HRSG (boiler) or used
directly (for example drying) Supplementary burners are commonly used to provide additional heat
input to the exhaust gases
Integrated coal gasification combined cycle gas turbine (IGCC) plants use fuel gas derived from coal
Note that for IGCC plants the only emission relevant unit considered here is the gas turbine
31413 Stationary engines
Stationary engines are spark-ignition engines and compression-ignition engines (2- and 4-stroke)
with electrical outputs ranging from less than 100 kW to over 20 MW Both types represent relevant
emission sources Such units are common as island generators (away from a supply grid) small
combined heat and power CHP units or for cogeneration and standby or emergency uses
32 Emissions
The contributions of point source emissions released by combustion plants to the total emissions
reported by countries to the Convention on Long-Range Transboundary Air Pollution (CLRTAP) can
be found in the emission databases hosted by the EMEP Centre on Emission Inventories and
projections (1)
The main pollutants are described below with further details provided (from the previous Guidebook
chapter) in Appendix B
Note that the inventory methodologies for Greenhouse gas emissions (carbon dioxide methame
and nitrous oxide) are not included ndash refer to IPCC guidance [IPCC 2006]
(1) Available here httpwwwceipat
1A1 Energy industries
EMEPEEA air pollutant emission inventory guidebook 2019 9
32111 Sulphur oxides
In the absence of flue gas desulphurisation (FGD) technology the emissions of sulphur oxides (SOx)
are directly related to the sulphur content of the fuel The sulphur content of refined natural gas is
negligible The majority of SOx is sulphur dioxide (SO2) although small proportions of sulphur trioxide
(SO3) can arise
32112 Nitrogen oxides
Emissions of nitrogen oxides (nitric oxide and nitrogen dioxide mdash NOx) arise from nitrogen in the
fuel (mainly relevant to solid and liquid fuels) and from reaction of atmospheric nitrogen
Combustion control can provide a high degree of NOx emission control (low NOx burner technology)
and this may be supplemented by use of selective catalytic reduction (SCR) or selective non-catalytic
reduction techniques (SNCR)
32113 Non-methane volatile organic compounds (NMVOC)
Emissions of non-methane volatile organic compounds (NMVOC) eg olefins ketones aldehydes
result from incomplete combustion Furthermore unreacted fuel compounds such as ethane (C2H6)
can be emitted The relevance of NMVOC and CH4 emissions from boilers which are often reported
together as VOC is very low for large-sized combustion plants VOC emissions tend to decrease as
the plant size increases (Rentz et al 1993)
32114 Carbon monoxide (CO)
Carbon monoxide (CO) appears always as an intermediate product of the combustion process and
in particular under sub-stoichiometric combustion conditions However the relevance of CO
released from combustion plants is not very high compared to CO2 The formation mechanisms of
CO and VOC are similarly influenced by combustion conditions Substantial emissions of CO can
occur if combustion conditions are poor
32115 Ammonia (NH3)
Emissions of ammonia (NH3) are not generally associated with a combustion process emissions can
result from incomplete reaction of NH3 additive in NOx abatement systems mdash selective catalytic and
non-catalytic reduction (SCR and SNCR)
32116 Particulate matter
Particulate matter (PM) emissions from large combustion installations (gt 50 MW) burning solid fuels
are often lower than emissions from smaller plants (per unit of energy input) the physical and
chemical characteristics of the PM also differ This is because different combustion and abatement
techniques are applied
Combustion of fuels can generate solid residues which may be deposited within combustion
chambers (furnace bottom ash) within the furnace boiler surfaces or ducting (fly ash) or on heat
exchanger surfaces (soot and fly ash) Coal and other fuels with significant ash content have the
highest potential to emit PM Suspended ash material in exhaust gases may be retained by
particulate abatement or other emission abatement equipment (abatement residues) Material
which remains in the flue gases beyond the abatement equipment and passes to the atmosphere is
primary PM Secondary PM is formed by chemical and physical processes after discharge to
atmosphere and is NOT considered here
1A1 Energy industries
EMEPEEA air pollutant emission inventory guidebook 2019 10
A number of factors influence the measurement and determination of primary PM emissions from
activities and the quantity of PM determined in an emission measurement depends to a large extent
on the measurement conditions This is particularly true of activities involving high temperature and
semi-volatile emission components ndash in such instances the PM emission may be partitioned between
a solidaerosol phase and material which is gaseous at the sampling point but which can condense
in the atmosphere The proportion of filterable and condensable material will vary depending on the
temperature of the flue gases and in sampling equipment
A range of filterable PM measurement methods are applied around the world typically with filter
temperatures of 70-160degC (the temperature is set by the test method) Condensable fractions can
be determined directly by recovering condensed material from chilled impinger systems
downstream of a filter ndash note that this is condensation without dilution and can require additional
processing to remove sampling artefacts Another approach for total PM includes dilution where
sampled flue or exhaust gases are mixed with ambient air (either using a dilution tunnel or dilution
sampling systems) and the filterable and condensable components are collected on a filter at lower
temperatures (but depending on the method this can be 15-52degC) The use of dilution methods
however may be limited due to practical constraints with weight andor size of the equipment
The PM emission factors (for TSP PM10 and PM25) can represent the total primary PM emission or
the filterable PM fraction The basis of the emission factor is described (see individual emission
factor tables)
32117 Black carbon (BC)
Combustion of fossil fuel and biomass is the main source of black carbon (BC) emission (Diehl et al
2012) Black carbon is the term for a wide range of carbon containing compounds but is determined
by assessment of the optical properties of collected particulate matter It covers large polycyclic
species charred plants to highly graphitized soot Other commonly used classifications include
elemental carbon (EC) and organic carbon (OC) which refer to carbon species that have been
classified chemically EC and OC are always co-emitted but in different proportions dependent upon
the fuel properties and the combustion conditions
Using these classifications BC and EC (as the more light absorbing refractory species) are often
treated as equal In reality there may be small differences in the PM fraction of BC and EC resulting
from the different classification techniques used Black Carbon was selected as the term identified
within the Gothenburg Protocol with the requirement that Parties develop emission inventories and
projections for BC and it is proposed that a similar requirement be included under the new NECD
As such in this guidebook emission factors are presented as BC
Literature values of emission factors for BC are often derived by thermal chemical techniques
representative of EC It is therefore important for inventory compilers to understand that the tier 1
BC emission factors presented in this guidance are assumed to be equal to the emission factors for
EC and therefore some uncertainty is introduced Where possible appendices of full carbon
speciation are provided for key sources Country-specific (higher tier) methods will be preferable
where this is feasible
The same emission control techniques that limit the emission of PM will also reduce the emission of
BC However measurement data that address the abatement efficiencies for BC are limited This
means that in general it is assumed that the BC emission can be reduced proportionally to the
filterable PM emission and in particular PM25 emission Consequently for inventory development
the BC emission factors are expressed as percentage of the PM25 emission It must be noted that
1A1 Energy industries
EMEPEEA air pollutant emission inventory guidebook 2019 11
measurement of BC emissions is not a standardised technique and that particle number or surface
area may be relevant metrics However the approach adopted in the present chapter is to develop
a mass inventory based on the PM25 inventory
32118 Metals
Most of the heavy metals considered (As Cd Cr Cu Hg Ni Pb Se Zn and V) are normally released
as compounds (eg oxides chlorides) in association with particulates Only Hg and Se are at least
partly present in the vapour phase The content of heavy metals in coal is normally several orders of
magnitude higher than in oil (except occasionally for Ni and V in heavy fuel oil) and in natural gas
For natural gas emissions of mercury and arsenic are relevant During the combustion of coal
particles undergo complex changes which lead to vaporisation of volatile elements The rate of
volatilisation of heavy metal compounds depends on fuel characteristics (eg concentrations in coal
fraction of inorganic components such as calcium) and on technology characteristics (eg type of
boiler operation mode)
33 Controls
Details of relevant abatement technologies for combustion plant are described in the BREF note for
large combustion plant ( httpeippcbjrceceuropaeureference) some further detail on NOx and
SO2 emission controls are also provided in Appendix B Relevant abatement technologies for
selected pollutants are outlined below
331 Sulphur oxides
There are in-furnace technologies which incorporate injection of an absorbent material (typically
lime) into the furnace Use of such systems is quite common in FBC where the lime can be added to
the bed and high recirculation is possible
Post combustion flue gas desulphurisation (FGD) processes are more common and are designed to
remove SO2 from the flue gas of combustion installations Most processes like the wet scrubbing
process (WS) the spray dryer absorption (SDA) the dry sorbent injection (DSI) and the Walther
process (WAP) are based on the reaction of the SO2 with an alkaline agent added as solid or as
suspensionsolution of the agent in water to form the respective salts In secondary reactions SO3
fluorides and chlorides are also removed In the case of some processes the SO2 is recovered as
sulphur or sulphuric acid Use of FGD processes can also reduce particulate and metal emissions
The most common technologies are described below
33111 Limelimestone wet scrubbing (WS)
The pollutants are removed from the flue gas by chemical reactions with alkaline slurry (suspension
of calcium compounds in water) The main product is gypsum The WS process represents the main
technology used by FGD-equipped electrical capacity installed in European Organisation for
Economic Co-operation and Development (OECD) countries Facilities are in operation at combustion
units using hard coal lignite and oil with sulphur contents from about 08 to more than 30 wt The
SO2 reduction efficiency is gt 90
1A1 Energy industries
EMEPEEA air pollutant emission inventory guidebook 2019 12
33112 Spray dryer (semi-dry) absorption (SDA)
The SDA process removes the pollutant components from flue gas of fossil-fired combustion units
by injection of Ca(OH)2 slurry The process forms a dry by-product requiring downstream collection
of PM The SO2 reduction efficiency is gt 90
33113 Dry sorbent injection (DSI)
The DSI process is based on a gassolid reaction of the flue gas and a dry sorbent (typically lime but
sodium hydrogen carbonate NaHCO3 is used in some smaller applications)
332 Nitrogen oxides
33211 Primary measures
Primary measures minimise formation of NOx in the furnace or combustion chamber and include
low-NOx burners (LNB) staged air supply flue gas recirculation overfire air reburn watersteam
injection and related technology These measures can be retrofitted to existing boilers to achieve
varying degrees of NOx reduction Modern gas turbines can achieve very low NOx emissions by
application of dry low NOx (DLN) burner technology without secondary measures
33212 Secondary measures mdash DeNOx processes
The principal abatement measures are selective non-catalytic reduction (SNCR) and selective
catalytic reduction (SCR) The reduction of nitrogen oxides in the flue gas is based on the selective
reaction of NOx The SNCR process involves injection of ammonia or urea near the furnace Emission
reduction with SNCR can be limited (up to 50 ) and is lower than with SCR An SCR system is based
on selective reactions with injected additives in the presence of a catalyst The additives used are
mostly ammonia (gaseous and in solution) but also urea The NOx reduction efficiency can be
between 70 and 90
333 Particulate matter
The main technology in use is electrostatic precipitation (EP) however fabric filters (FF) are also used
Removal of particulate also reduces emissions of most heavy metals as these are mainly in the
particulate phase Both modern EP and FF can represent Best Available Techniques (BAT) but note
that EP performance can vary widely between older and modern equipment FGD can also be an
effective PM abatement device DSI and SDA systems often incorporate FF for sorbent and PM
removal Wet scrubbing systems can also achieve BAT achievable emission levels for PM
Multicyclone devices can be found on smaller older combustion units or as an initial treatment
stage
34 Methods
341 Choice of method
Figure 3-1 presents the procedure to select the methods for estimating process emissions from
combustion in energy and transformation industries The basic concept is
if detailed information is available use it
if the source category is a key source a Tier 2 or better method must be applied and detailed
input data must be collected The decision tree directs the user in such cases to the Tier 2
method since it is expected that it is easier to obtain the necessary input data for this approach
1A1 Energy industries
EMEPEEA air pollutant emission inventory guidebook 2019 13
than to collect facility-level data needed for a Tier 3 estimate However the inventory compiler
should be aware that because the number of sources may be comparatively small in many
instances the data required for a Tier 3 approach may be only a little more difficult to obtain
than at Tier 2
detailed process modelling is not explicitly included in this decision tree However detailed
modelling will usually be done at facility level and results of such modelling could be seen as
lsquofacility datarsquo (Tier 3) in the decision tree
Figure 3-1 Decision tree for combustion in energy transformation industries
Start
Are all single
sources in the source
category Measured
reported
Use Tier 3
Facility data
only
Is a detailed
estimation model
available
Use Tier 2
technology specific
activity data
and EFs
Key source
Get
technology stratified
activity data
and EFs
Apply Tier 1
default EFs
Yes
Yes
Yes
Yes
No
No
Is specific fuel
use data available
for the source
Use measurements Tier
3 approach and
combine with country
specific EFs from Tier 2
Can modelled fuel
consumption be reconciled
with national fuel statistics
from independent
sources
Use model Tier 3
approach
No
No
No
Yes
1A1 Energy industries
EMEPEEA air pollutant emission inventory guidebook 2019 14
342 Tier 1 default approach
3421 Algorithm
The Tier 1 approach for process emissions from combustion uses the general equation
pollutantptionfuelconsumpollutant EFARE (1)
Epollutant annual emission of pollutant
EFpollutant emission factor of pollutant
ARfuel consumption activity rate by fuel consumption
This equation is applied at the national level using annual national total fuel use (disaggregated by
fuel type) Information on fuel consumption suitable for estimating emissions using the simpler
estimation methodology is widely available from UN statistical yearbooks or national statistics
The Tier 1 emission factors assume an average or typical technology and abatement
implementation
In cases where specific combustion technology and abatement techniques are to be taken into
account a Tier 1 method is not applicable and a Tier 2 or Tier 3 approach must be used Some
further detail on NOx and SO2 emission controls and abatement efficiency are provided in
Appendix B
3422 Default Tier 1 emission factors (EF)
The Tier 1 default emission factors derived from available data and information have been
developed for key fuel groups (Table 3-1) and are given in Table 3-2 to Table 3-7
Table 3-1 Tier 1 fuel classifications
Tier 1 Fuel type Associated fuel types
Hard coal Coking coal other bituminous coal sub-bituminous coal coke manufactured
lsquopatentrsquo fuel
Brown coal Lignite oil shale manufactured lsquopatentrsquo fuel peat
Gaseous fuels Natural gas natural gas liquids liquefied petroleum gas refinery gas (EFs for
refinery gas are available in section 42) gas works gas coke oven gas blast
furnace gas
Heavy fuel oil Residual fuel oil refinery feedstock petroleum coke orimulsion bitumen
Light oil Gas oil kerosene naphtha shale oil
Biomass Wood charcoal vegetable (agricultural) waste
Note The associated fuel types indicated in Table 3-2 are based on the emission characteristics and are not to
be used for categorising fuels into the main fuel groups (solid liquid gaseous biomass) used for reporting
The emission factors provided in Table 3-2 to Table 3-7 have been derived from available materials
taking into account the results of an assessment of emission factors included in previous versions
of the Guidebook and elsewhere including the newer information from the BREF document on Best
Available Techniques in Large Combustion Plants (European Commission 2006) The emission
factors are grouped by major fuel types In the absence of detail on types and relative use of types
1A1 Energy industries
EMEPEEA air pollutant emission inventory guidebook 2019 15
of combustion or abatement technology which will be different for each country the proposed
factors represent a mean for the range of technologies in use with the 95 figures a measure of the
range of emissions in the sector The factors will represent a very wide range of combustion
technologies and emissions they do not represent BAT or unabated emissions
Note that NOx emission factors are expressed as NO2 and that PCDDF emission factors are
presented as I-TEQ (NATO) toxic equivalents
Emission factors for sulphur oxides are provided in the Tier 1 tables but these assume no SO2
abatement and a defined fuel sulphur content Where countries have no FGD and have knowledge
of fuel sulphur content then it is recommended that a sulphur oxides emission factor is calculated
from fuel sulphur content assuming 100 conversion to SO2 and no retention in ash
EF SO2 = [S] x 20000 CVNet
where
EF SO2 is the SO2 emission factor (gGJ)
[S] is sulphur content of the fuel ( ww)
CVNet is fuel CV (GJtonne net basis)
For emission factors for the combustion of waste please refer to Chapters 6Ca 6Cb and 6Cc
depending on the type of waste that is being combusted
The BC emission factors presented in this Guidance are derived on the basis of EC and it is therefore
assumed that BC=EC
Table 3-2 Tier 1 emission factors for source category 1A1a using hard coal
Tier 1 default emission factors
Code Name
NFR Source Category 1A1a Public electricity and heat production
Fuel Hard Coal
Not applicable
Not estimated NH3
Pollutant Value Unit 95 confidence
interval
Reference
Lower Upper
NOx 209 gGJ 200 350 US EPA (1998) chapter 11
CO 87 gGJ 615 15 US EPA (1998) chapter 11
NMVOC 10 gGJ 06 24 US EPA (1998) chapter 11
SOx 820 gGJ 330 5000 See Note
TSP 114 gGJ 3 300 US EPA (1998) chapter 11
PM10 77 gGJ 2 200 US EPA (1998) chapter 11
PM25 34 gGJ 09 90 US EPA (1998) chapter 11
BC 22 of PM25 027 808 See Note
Pb 73 mgGJ 516 12 US EPA (1998) chapter 11
Cd 09 mgGJ 0627 146 US EPA (1998) chapter 11
Hg 14 mgGJ 102 238 US EPA (1998) chapter 11
As 71 mgGJ 504 118 US EPA (1998) chapter 11
Cr 45 mgGJ 32 746 US EPA (1998) chapter 11
Cu 78 mgGJ 0233 155 Expert judgement derived
from EMEPEEA (2006)
Ni 49 mgGJ 344 803 US EPA (1998) chapter 11
Se 23 mgGJ 16 373 US EPA (1998) chapter 11
1A1 Energy industries
EMEPEEA air pollutant emission inventory guidebook 2019 16
Zn 19 mgGJ 775 155 Expert judgement derived
from EMEPEEA (2006)
PCB 33 ng WHO-
TEGGJ
11 99 Grochowalski amp
Konieczyński 2008
PCDDF 10 ng I-
TEQGJ
5 15 UNEP (2005) Coal fired
power boilers
Benzo(a)pyrene 07 microgGJ 0245 221 US EPA (1998) chapter 11
Benzo(b)fluoranthene 37 microgGJ 37 370 Wenborn et al 1999
Benzo(k)fluoranthene 29 microgGJ 29 290 Wenborn et al 1999
Indeno(123-cd)pyrene 11 microgGJ 0591 236 US EPA (1998) chapter 11
HCB 67 microgGJ 22 201 Grochowalski amp
Konieczyński 2008
Notes
The default tier 1 emission factors are based on the tier 2 emission factors for dry bottom boilers For conversion
of the US EPA data the heating value as provided in the reference has been used (26 MMBTUton) This has been
converted to NCV using a factor of 095 Furthermore units have been converted using 10550559 JBTU and
45359237 glb
The EFs for benzo(b)fluoranthene and benzo(k)fluoranthene are converted using the average NCV for other
bituminous coal of 241 GJton from Energy Statistics Manual (OECDIEA 2005)
The factor for SOx assumes no SO2 abatement and is based on 1 mass sulphur content using EF calculation
from subsection 3422 of the present chapter 95 confidence intervals calculated using range from Table C-1
in Appendix C
The BC share is derived as the average of data from Henry amp Knapp (1980) Olmez et al (1988) Watson et al
(2001) Fisher et al (1979) Griest amp Tomkins (1984) Engelbrecht et al (2002) Chow et al (2004) and Speciate (US
EPA 2011)
The TSP PM10 and PM25 emission factors represent filterable PM emissions and are based on an ash content of
82 Note that condensable PM emission factors are also provided in US EPA (1998) Chapter 11
Table 3-3 Tier 1 emission factors for source category 1A1a using brown coal
Tier 1 default emission factors
Code Name
NFR Source Category 1A1a Public electricity and heat production
Fuel Brown Coal
Not applicable
Not estimated NH3 PCB HCB
Pollutant Value Unit 95 confidence
interval
Reference
Lower Upper
NOx 247 gGJ 143 571 US EPA (1998) chapter 17
CO 87 gGJ 672 605 US EPA (1998) chapter 17
NMVOC 14 gGJ 084 336 US EPA (1998) chapter 17
SOx 1680 gGJ 330 5000 See Note
TSP 117 gGJ 12 117 US EPA (1998) chapter 17
PM10 79 gGJ 1 79 US EPA (1998) chapter 17
PM25 32 gGJ 1 32 US EPA (1998) chapter 17
BC 1 of PM25 01 4 Kupiainen and Klimont 2007
Pb 15 mgGJ 106 247 US EPA (1998) chapter 17
Cd 18 mgGJ 129 3 US EPA (1998) chapter 17
Hg 29 mgGJ 209 488 US EPA (1998) chapter 17
As 143 mgGJ 103 241 US EPA (1998) chapter 17
Cr 91 mgGJ 655 153 US EPA (1998) chapter 17
Cu 10 mgGJ 02 5 EMEPEEA (2006)
Ni 97 mgGJ 706 165 US EPA (1998) chapter 17
Se 45 mgGJ 328 765 US EPA (1998) chapter 17
Zn 88 mgGJ 0504 168 EMEPEEA (2006)
1A1 Energy industries
EMEPEEA air pollutant emission inventory guidebook 2019 17
PCBs 33 ng WHO-
TEGGJ
11 99 Grochowalski amp Konieczyński 2008
PCDDF 10 ng I-
TEQGJ
5 15 UNEP (2005) Coal fired power boilers
Benzo(a)pyrene 13 microgGJ 026 65 US EPA (1998) chapter 17
Benzo(b)fluoranthene 37 microgGJ 37 370 Wenborn et al 1999
Benzo(k)fluoranthene 29 microgGJ 29 290 Wenborn et al 1999
Indeno(123-cd)pyrene 21 microgGJ 042 105 US EPA (1998) chapter 17
HCB 67 microgGJ 22 201 Grochowalski amp Konieczyński 2008
Notes
The tier 1 default emission factors are based on the tier 2 emission factors for drywet bottom boilers
For conversion of the US EPA data the heating value as provided in the reference has been used (6500 BTUlb)
This has been converted to NCV using a factor of 095 Furthermore units have been converted using 10550559
JBTU 2000 lbton and 45359237 glb The EFs for Cu and Zn are converted using the average NCV 119 GJMg
from IPCC Guidelines (IPCC 2006)
The factor for SOx assumes no SO2 abatement and is based on 1 mass sulphur content using EF calculation
from subsection 3422 of the present chapter 95 confidence intervals calculated using range from Table C-1
in Appendix C
The TSP PM10 and PM25 emission factors represent filterable PM emissions and are based on an ash content of
5 Note that condensable PM emission factors are also provided in US EPA (1998) Chapter 17
Table 3-4 Tier 1 emission factors for source category 1A1a using gaseous fuels
Tier 1 default emission factors
Code Name
NFR Source Category 1A1a Public electricity and heat production
Fuel Gaseous fuels
Not applicable
Not estimated NH3 PCBs HCB
Pollutant Value Unit 95 confidence
interval
Reference
Lower Upper
NOx 89 gGJ 15 185 US EPA (1998) chapter 14
CO 39 gGJ 20 60 US EPA (1998) chapter 14
NMVOC 26 gGJ 065 104 US EPA (1998) chapter 14
SOx 0281 gGJ 0169 0393 US EPA (1998) chapter 14
TSP 089 gGJ 0445 134 US EPA (1998) chapter 14
PM10 089 gGJ 0445 134 US EPA (1998) chapter 14
PM25 089 gGJ 0445 134 US EPA (1998) chapter 14
BC 25 of PM25 1 63 See Note
Pb 00015 mgGJ 00005 00045 Nielsen et al 2012
Cd 000025 mgGJ 000008 000075 Nielsen et al 2012
Hg 01 mgGJ 001 1 Nielsen et al 2010
As 012 mgGJ 004 036 Nielsen et al 2012
Cr 000076 mgGJ 000025 000228 Nielsen et al 2012
Cu 0000076 mgGJ 0000025 0000228 Nielsen et al 2012
Ni 000051 mgGJ 000017 000153 Nielsen et al 2012
Se 00112 mgGJ 000375 00337 US EPA (1998) chapter 14
Zn 00015 mgGJ 00005 00045 Nielsen et al 2012
PCDDF 05 ng I-
TEQGJ
025 075 UNEP (2005)
Benzo(a)pyrene 056 microgGJ 019 056 US EPA (1998) chapter 14 (Less
than value based on method
detection limits)
1A1 Energy industries
EMEPEEA air pollutant emission inventory guidebook 2019 18
Benzo(b)fluoranthene 084 microgGJ 028 084 US EPA (1998) chapter 14 (Less
than value based on method
detection limits)
Benzo(k)fluoranthene 084 microgGJ 028 084 US EPA (1998) chapter 14 (Less
than value based on method
detection limits)
Indeno(123-cd)pyrene 084 microgGJ 028 084 US EPA (1998) chapter 14 (Less
than value based on method
detection limits)
Notes
For conversion of the US EPA data the heating value as provided in the reference has been used (102 BTUscf)
This has been converted to NCV using a factor of 090 Furthermore units have been converted using 10550559
JBTU and 45359237 glb
The factor for SOx is based on approximately 001 gm3 mass sulphur content Emission factor for PCDDF is stated
to be applicable light fuel oil and natural gas use in power station boilers but is based mainly on data from oil
combustion UNEP also reports limited data for gas combustion of between 002 and 003 ng TEQGJ for natural
gas-fired boilers
The BC emission factor is the average of the data available in England et al (2004) Wien et al (2004) and the
Speciate database (US EPA 2011)
The TSP PM10 and PM25 emission factors represent filterable PM emissions Note that condensable PM emission
factors are also provided in US EPA (1998) Chapter 14
Table 3-5 Tier 1 emission factors for source category 1A1a using heavy fuel oil
Tier 1 default emission factors
Code Name
NFR Source Category 1A1a Public electricity and heat production
Fuel Heavy Fuel Oil
Not applicable
Not estimated NH3 PCBs Benzo(a)pyrene HCB
Pollutant Value Unit 95 confidence
interval
Reference
Lower Upper
NOx 142 gGJ 70 300 US EPA (2010) chapter 13
CO 151 gGJ 906 211 US EPA (2010) chapter 13
NMVOC 23 gGJ 14 32 US EPA (2010) chapter 13
SOx 495 gGJ 146 1700 See Note
TSP 354 gGJ 2 200 US EPA (2010) chapter 13
PM10 252 gGJ 15 150 US EPA (2010) chapter 13
PM25 193 gGJ 09 90 US EPA (2010) chapter 13
BC 56 of PM25 022 869 See Note
Pb 456 mgGJ 228 911 US EPA (2010) chapter 13
Cd 12 mgGJ 06 24 US EPA (2010) chapter 13
Hg 0341 mgGJ 017 0682 US EPA (2010) chapter 13
As 398 mgGJ 199 797 US EPA (2010) chapter 13
Cr 255 mgGJ 127 51 US EPA (2010) chapter 13
Cu 531 mgGJ 266 106 US EPA (2010) chapter 13
Ni 255 mgGJ 127 510 US EPA (2010) chapter 13
Se 206 mgGJ 103 412 US EPA (2010) chapter 13
Zn 878 mgGJ 439 176 US EPA (2010) chapter 13
PCDDF 25 ng I-
TEQGJ
125 375 UNEP (2005) Heavy fuel
fired power boilers
Benzo(b)fluoranthene 45 microgGJ 15 135 US EPA (2010) chapter 13
Benzo(k)fluoranthene 45 microgGJ 15 135 US EPA (2010) chapter 13
Indeno(123-cd)pyrene 692 microgGJ 346 138 US EPA (2010) chapter 13
Note
1A1 Energy industries
EMEPEEA air pollutant emission inventory guidebook 2019 19
For conversion of the US EPA data the heating value as provided in the reference has been used (150 MMBTU103
gal) This has been converted to NCV using a factor of 095 Furthermore units have been converted using
10550559 JBTU and 45359237 glb
The factor for SOx assumes no SO2 abatement and is based on 1 mass sulphur content using EF calculation
from subsection 3422 of the present chapter 95 confidence intervals calculated using range from Table C-1
in Appendix C
The BC emission factor is derived as the average of the data found in Olmez et al (1988) England et al (2007)
and the Speciate database (US EPA 2011)
The TSP PM10 and PM25 emission factors represent filterable PM emissions and are based on a sulphur content
of 1 Note that condensable PM emission factors are also provided in US EPA (1998) Chapter 13
Table 3-6 Tier 1 emission factors for source category 1A1a using gas oil
Tier 1 default emission factors
Code Name
NFR Source Category 1A1a Public electricity and heat production
Fuel Gas oil
Not applicable
Not estimated NH3 PCB Benzo(a)pyrene Benzo(b)fluoranthene
Benzo(k)fluoranthene HCB
Pollutant Value Unit 95 confidence
interval
Reference
Lower Upper
NOx 65 gGJ 22 195 US EPA (1998) chapter 13
CO 162 gGJ 4 65 US EPA (1998) chapter 13
NMVOC 08 gGJ 048 128 US EPA (1998) chapter 13
SOx 465 gGJ 465 465 See Note
TSP 65 gGJ 2 20 US EPA (1998) chapter 13
PM10 32 gGJ 1 10 US EPA (1998) chapter 13
PM25 08 gGJ 03 25 US EPA (1998) chapter 13
BC 335 of PM25 289 38 Hildemann et al 1981 amp
Bond et al 2006
Pb 407 mgGJ 041 40 US EPA (1998) chapter 13
Cd 136 mgGJ 014 15 US EPA (1998) chapter 13
Hg 136 mgGJ 014 15 US EPA (1998) chapter 13
As 181 mgGJ 018 20 US EPA (1998) chapter 13
Cr 136 mgGJ 014 15 US EPA (1998) chapter 13
Cu 272 mgGJ 027 30 US EPA (1998) chapter 13
Ni 136 mgGJ 014 15 US EPA (1998) chapter 13
Se 679 mgGJ 068 70 US EPA (1998) chapter 13
Zn 181 mgGJ 018 20 US EPA (1998) chapter 13
PCDDF 05 ng I-
TEQGJ
025 1 UNEP 2005
Indeno(123-cd)pyrene 692 microgGJ 346 138 US EPA (1998) chapter 13
Note
For conversion of the US EPA data the heating value as provided in the reference has been used (140 MMBTU103
gal) This has been converted to NCV using a factor of 095 Furthermore units have been converted using
10550559 JBTU and 45359237 glb
The factor for SOx assumes no SO2 abatement and is based on 01 mass sulphur content
The TSP PM10 and PM25 emission factors represent filterable PM emissions Note that condensable PM emission
factors are also provided in US EPA (1998) Chapter 13
1A1 Energy industries
EMEPEEA air pollutant emission inventory guidebook 2019 20
Table 3-7 Tier 1 emission factors for source category 1A1a using biomass
Tier 1 default emission factors
Code Name
NFR Source Category 1A1a Public electricity and heat production
Fuel Biomass
Not applicable
Not estimated NH3
Pollutant Value Unit 95 confidence
interval
Reference
Lower Upper
NOx 81 gGJ 40 160 Nielsen et al 2010
CO 90 gGJ 45 180 Nielsen et al 2010
NMVOC 731 gGJ 244 219 US EPA (2003) chapter 16
SOx 108 gGJ 645 151 US EPA (2003) chapter 16
TSP 172 gGJ 86 344 US EPA (2003) chapter 16
PM10 155 gGJ 77 310 US EPA (2003) chapter 16
PM25 133 gGJ 66 266 US EPA (2003) chapter 16
BC 33 of PM25 16 66 See Note
Pb 206 mgGJ 124 289 US EPA (2003) chapter 16
Cd 176 mgGJ 106 247 US EPA (2003) chapter 16
Hg 151 mgGJ 0903 211 US EPA (2003) chapter 16
As 946 mgGJ 568 132 US EPA (2003) chapter 16
Cr 903 mgGJ 542 126 US EPA (2003) chapter 16
Cu 211 mgGJ 126 295 US EPA (2003) chapter 16
Ni 142 mgGJ 851 199 US EPA (2003) chapter 16
Se 12 mgGJ 0722 169 US EPA (2003) chapter 16
Zn 181 mgGJ 108 253 US EPA (2003) chapter 16
PCB 35 microgGJ 035 35 US EPA (2003) chapter 16
PCDDF 50 ng I-
TEQGJ
25 75 UNEP (2005) (for clean
wood)
Benzo(a)pyrene 112 mgGJ 0671 157 US EPA (2003) chapter 16
Benzo(b)fluoranthene 0043 mgGJ 00215 00645 US EPA (2003) chapter 16
Benzo(k)fluoranthene 00155 mgGJ 000774 00232 US EPA (2003) chapter 16
Indeno(123-cd)pyrene 00374 mgGJ 00187 00561 US EPA (2003) chapter 16
HCB 5 microgGJ 05 50 Bailey 2001
Note For conversion of the US EPA data units have been converted using 10550559 JBTU and 45359237 glb
The BC emission factor is an average of the data in Dayton amp Bursey (2001) and the Speciate database (US EPA
2011)
The TSP PM10 and PM25 emission factors represent filterable PM emissions Note that a condensable PM
emission factor is also provided in US EPA (1998) Chapter 16
3423 Tier 1 activity data
Information on the use of energy and production of power suitable for estimating emissions using
the Tier 1 simpler estimation methodology is available from national statistics agencies or the
International Energy Agency (IEA)
Further guidance is provided in the 2006 IPCC Guidelines for National Greenhouse Gas Inventories
volume 2 on Stationary Combustion
wwwipcc-nggipigesorjppublic2006glpdf2_Volume2V2_2_Ch2_Stationary_Combustionpdf
The activity rate and the emission factor have to be determined on the same level of aggregation
depending on the availability of data The activity statistic should be determined within the
considered country or region by using adequate statistics The activity should refer to the energy
input of the emission sources considered (net or inferior fuel consumption in [GJ])
1A1 Energy industries
EMEPEEA air pollutant emission inventory guidebook 2019 21
343 Tier 2 technology-specific approach
3431 Algorithm
The Tier 2 approach is similar to the Tier 1 approach To apply the Tier 2 approach both the activity
data and the emission factors need to be applied according to a countryrsquos fuel usage and installed
combustion technologies These techniques may include
relative mix of fuels
types of combustion plant
There are two approaches possible
disaggregate the fuel use in the country to model the different combustion and abatement types
into the inventory by
a) defining the activity data using each of the identified process types (together called
lsquotechnologiesrsquo in the formulae below) separately and
b) applying technology-specific emission factors for each process type
estechnologi
pollutanttechnologytechnologyproductionpollutant EFARE (2)
develop country-specific emission factors from the understanding of the relative contributions of
the different technologies within the national combustion plant portfolio (and relative fuel use)
and apply this country-specific emission factor for the national fuel use
pollutantcountryproductionpollutant
estechnologi
pollutanttechnologytechnologypollutantcountry
EFARE
EFnPenetratioEF
(3)
Both approaches are mathematically very similar or even identical Using one or the other
approach depends mainly on the availability of data If the activity data are indeed available the
first approach seems to be more appropriate If however no direct activity data are available
penetration of different technologies within the industry could be estimated from data on
capacities or other surrogate data that reflect relative sizes of facilities using the different
technologies
3432 Technology-specific emission factors
Applying a Tier 2 approach for the process emissions from public power and heat production
technology-specific emission factors are needed The main technology distinction is by combustion
unit type (boiler technologies gas turbine stationary engine) and fuel type Note that factors for
smaller combustion units (lt 50 MWth) are provided in Chapter 1A4 where available size-based
factors for boilers are also provided for Example factors are provided in this section however it
should be noted that these cannot address every fuel combustion and abatement combination that
can exist The number of sources in this activity is usually comparatively small and the inventory
compiler may wish to consider gathering data to allow a Tier 3 approach as a more robust
methodology Knowledge of emission concentrations and emission limit values (ELVs) can allow a
first estimation of emission factors without detailed knowledge of plant combustion and abatement
technology
1A1 Energy industries
EMEPEEA air pollutant emission inventory guidebook 2019 22
Emission factors derived from the achievable emission levels values (AELs) as defined in the BREF
document are provided in subsection 631 for comparison In addition ELVs for selected emission
instruments are provided as emission factors in Appendix D
Table 3-8 Technology-specific Tier 2 factors
Combustion technology Relevant fuels
Dry bottom boiler Coking coal steam coal sub-bituminous coal brown coal lignite
wood peat coke oven coke residual oil natural gas
Wet bottom boiler Coking coal steam coal sub-bituminous coal brown coal lignite
Fluid bed boiler Hard coal brown coal
Gas turbine Natural gas gas oil refinery gas blast furnace gas
Stationary engine Natural gas gas oil
This section provides a series of technology-specific pollutant emission factors for combustion these
factors represent a wider range of fuels and combustion technologies than for Tier 1 They do not
represent specific combustion and abatement technologies (which would be needed in a Tier 3
approach) but do offer more disaggregation than Tier 1 Extension of Tier 2 to reflect emission
abatement is possible through use of factors derived from emission data
The BC emission factors presented in this Guidance are derived on the basis of EC and it is therefore
assumed that BC=EC
1A1 Energy industries
EMEPEEA air pollutant emission inventory guidebook 2019 23
Table 3-9 Tier 2 emission factors for source category 1A1a dry bottom boilers using
coking coal steam coal and sub-bituminous coal
Tier 2 emission factors
Code Name
NFR Source Category 1A1a Public electricity and heat production
Fuel Coking Coal Steam Coal amp Sub-Bituminous Coal
SNAP (if applicable) 010101
010102
Public power - Combustion plants gt= 300 MW (boilers)
Public power - Combustion plants gt= 50 and lt 300 MW (boilers)
TechnologiesPractices Dry Bottom Boilers
Region or regional
conditions
NA
Abatement technologies Abatement assumed except for SO2 EF
Not applicable
Not estimated NH3
Pollutant Value Unit 95 confidence
interval
Reference
Lower Upper
NOx 209 gGJ 200 350 US EPA (1998) chapter 11
CO 87 gGJ 615 15 US EPA (1998) chapter 11
NMVOC 10 gGJ 06 24 US EPA (1998) chapter 11
SOx 820 gGJ 330 5000 See Note
TSP 114 gGJ 3 300 US EPA (1998) chapter 11
PM10 77 gGJ 2 200 US EPA (1998) chapter 11
PM25 34 gGJ 09 90 US EPA (1998) chapter 11
BC 22 of PM25 027 808 See Note
Pb 73 mgGJ 516 12 US EPA (1998) chapter 11
Cd 09 mgGJ 0627 146 US EPA (1998) chapter 11
Hg 14 mgGJ 102 238 US EPA (1998) chapter 11
As 71 mgGJ 504 118 US EPA (1998) chapter 11
Cr 45 mgGJ 32 746 US EPA (1998) chapter 11
Cu 78 mgGJ 0233 155 Expert judgement derived from
EMEPEEA (2006)
Ni 49 mgGJ 344 803 US EPA (1998) chapter 11
Se 23 mgGJ 16 373 US EPA (1998) chapter 11
Zn 19 mgGJ 775 155 Expert judgement derived from
EMEPEEA (2006)
PCB 33 ng WHO-
TEGGJ
11 99 Grochowalski amp Konieczyński
2008
PCDDF 10 ng I-TEQGJ 5 15 UNEP (2005) Coal fired power
boilers
Benzo(a)pyrene 07 microgGJ 0245 221 US EPA (1998) chapter 11
Benzo(b)fluoranthene 37 microgGJ 37 370 Wenborn et al 1999
Benzo(k)fluoranthene 29 microgGJ 29 290 Wenborn et al 1999
Indeno(123-cd)pyrene 11 microgGJ 0591 236 US EPA (1998) chapter 11
HCB 67 microgGJ 22 201 Grochowalski amp Konieczyński
2008
Notes
For conversion of the US EPA data the heating value as provided in the reference has been used (26 MMBTUton)
This has been converted to NCV using a factor of 095 Furthermore units have been converted using 10550559
JBTU and 45359237 glb The EFs for benzo(b)fluoranthene and benzo(k)fluoranthene are converted using the
average NCV for other bituminous coal of 241 GJton from Energy Statistics Manual (OECDIEA 2005)
The factor for SOx assumes no SO2 abatement and is based on 1 mass sulphur content using EF calculation
from subsection 3422 of the present chapter 95 confidence intervals calculated using range from Table C-1
in Appendix C
1A1 Energy industries
EMEPEEA air pollutant emission inventory guidebook 2019 24
The BC share is derived as the average of data from Henry amp Knapp (1980) Olmez et al (1988) Watson et al
(2001) Fisher et al (1979) Griest amp Tomkins (1984) Engelbrecht et al (2002) Chow et al (2004) and Speciate (US
EPA 2011)
The TSP PM10 and PM25 emission factors represent filterable PM emissions and are based on an ash content of
82 Note that condensable PM emission factors are also provided in US EPA (1998) Chapter 11
Table 3-10 Tier 2 emission factors for source category 1A1a wet and dry bottom boilers
using brown coallignite
Tier 2 emission factors
Code Name
NFR Source Category 1A1a Public electricity and heat production
Fuel Brown CoalLignite
SNAP (if applicable) 010101
010102
Public power - Combustion plants gt= 300 MW (boilers)
Public power - Combustion plants gt= 50 and lt 300 MW (boilers)
TechnologiesPractices Wet and Dry Bottom Boilers
Region or regional
conditions
NA
Abatement technologies NA
Not applicable
Not estimated BC NH3
Pollutant Value Unit 95 confidence
interval
Reference
Lower Upper
NOx 247 gGJ 143 571 US EPA (1998) chapter 17
CO 87 gGJ 672 605 US EPA (1998) chapter 17
NMVOC 14 gGJ 084 336 US EPA (1998) chapter 17
SOx 1680 gGJ 330 5000 See Note
TSP 117 gGJ 12 117 US EPA (1998) chapter 17
PM10 79 gGJ 1 79 US EPA (1998) chapter 17
PM25 32 gGJ 1 32 US EPA (1998) chapter 17
Pb 15 mgGJ 106 247 US EPA (1998) chapter 17
Cd 18 mgGJ 129 3 US EPA (1998) chapter 17
Hg 29 mgGJ 209 488 US EPA (1998) chapter 17
As 143 mgGJ 103 241 US EPA (1998) chapter 17
Cr 91 mgGJ 655 153 US EPA (1998) chapter 17
Cu 10 mgGJ 02 5 EMEPEEA (2006)
Ni 97 mgGJ 706 165 US EPA (1998) chapter 17
Se 45 mgGJ 328 765 US EPA (1998) chapter 17
Zn 88 mgGJ 0504 168 EMEPEEA (2006)
PCBs 33 ng WHO-
TEGGJ
11 99 Grochowalski amp Konieczyński
2008
PCDDF 10 ng I-
TEQGJ
5 15 UNEP (2005) Coal fired power
boilers
Benzo(a)pyrene 13 microgGJ 026 65 US EPA (1998) chapter 17
Benzo(b)fluoranthene 37 microgGJ 37 370 Wenborn et al 1999
Benzo(k)fluoranthene 29 microgGJ 29 290 Wenborn et al 1999
Indeno(123-cd)pyrene 21 microgGJ 042 105 US EPA (1998) chapter 17
HCB 67 microgGJ 22 201 Grochowalski amp Konieczyński
2008
Notes
For conversion of the US EPA data the heating value as provided in the reference has been used (6500 BTUlb)
This has been converted to NCV using a factor of 095 Furthermore units have been converted using 10550559
JBTU 2000 lbton and 45359237 glb The EFs for Cu and Zn are converted using the average NCV 119 GJMg
from IPCC Guidelines (IPCC 2006)
1A1 Energy industries
EMEPEEA air pollutant emission inventory guidebook 2019 25
The factor for SOx assumes no SO2 abatement and is based on 1 mass sulphur content using EF calculation
from subsection 3422 of the present chapter 95 confidence intervals calculated using range from Table C-1
in Appendix C
The emission factors for PCBs benzo(b)fluoranthene benzo(k)fluoranthene and HCB are based on data for hard
coal combustion in dry bottom boilers
The TSP PM10 and PM25 emission factors represent filterable PM emissions and are based on an ash content of
5 Note that condensable PM emission factors are also provided in US EPA (1998) Chapter 17
Table 3-11 Tier 2 emission factors for source category 1A1a dry bottom boilers using
residual oil
Tier 2 emission factors
Code Name
NFR Source Category 1A1a Public electricity and heat production
Fuel Residual Oil
SNAP (if applicable) 010101
010102
Public power - Combustion plants gt= 300 MW (boilers)
Public power - Combustion plants gt= 50 and lt 300 MW
(boilers)
TechnologiesPractices Dry Bottom Boilers
Region or regional
conditions
NA
Abatement technologies NA
Not applicable
Not estimated NH3 PCBs Benzo(a)pyrene HCB
Pollutant Value Unit 95 confidence
interval
Reference
Lower Upper
NOx 142 gGJ 70 300 US EPA (2010) chapter 13
CO 151 gGJ 906 211 US EPA (2010) chapter 13
NMVOC 23 gGJ 14 32 US EPA (2010) chapter 13
SOx 495 gGJ 146 1700 See Note
TSP 354 gGJ 2 200 US EPA (2010) chapter 13
PM10 252 gGJ 15 150 US EPA (2010) chapter 13
PM25 193 gGJ 09 90 US EPA (2010) chapter 13
BC 56 of PM25 022 869 See Note
Pb 456 mgGJ 228 911 US EPA (2010) chapter 13
Cd 12 mgGJ 06 24 US EPA (2010) chapter 13
Hg 0341 mgGJ 017 0682 US EPA (2010) chapter 13
As 398 mgGJ 199 797 US EPA (2010) chapter 13
Cr 255 mgGJ 127 51 US EPA (2010) chapter 13
Cu 531 mgGJ 266 106 US EPA (2010) chapter 13
Ni 255 mgGJ 127 510 US EPA (2010) chapter 13
Se 206 mgGJ 103 412 US EPA (2010) chapter 13
Zn 878 mgGJ 439 176 US EPA (2010) chapter 13
PCDDF 25 ng I-
TEQGJ
125 375 UNEP (2005) Heavy fuel
fired power boilers
Benzon(b)fluoranthene 45 microgGJ 15 135 US EPA (2010) chapter 13
Benzon(k)fluoranthene 45 microgGJ 15 135 US EPA (2010) chapter 13
Indeno(123-cd)pyrene 692 microgGJ 346 138 US EPA (2010) chapter 13
Note
For conversion of the US EPA data the heating value as provided in the reference has been used (150 MMBTU103
gal) This has been converted to NCV using a factor of 095 Furthermore units have been converted using
10550559 JBTU and 45359237 glb
1A1 Energy industries
EMEPEEA air pollutant emission inventory guidebook 2019 26
The factor for SOx assumes no SO2 abatement and is based on 1 mass sulphur content using EF calculation
from subsection 3422 of the present chapter 95 confidence intervals calculated using range from Table C-1
in Appendix C
The BC emission factor is derived as the average of the data found in Olmez et al (1988) England et al (2007)
and the Speciate database (US EPA 2011)
The TSP PM10 and PM25 emission factors represent filterable PM emissions and are based on a sulphur content
of 1 Note that condensable PM emission factors are also provided in US EPA (1998) Chapter 13
Table 3-12 Tier 2 emission factors for source category 1A1a dry bottom boilers using
natural gas
Tier 2 emission factors
Code Name
NFR Source Category 1A1a Public electricity and heat production
Fuel Natural Gas
SNAP (if applicable) 010101
010102
Public power - Combustion plants gt= 300 MW (boilers)
Public power - Combustion plants gt= 50 and lt 300 MW
(boilers)
TechnologiesPractices Dry Bottom Boilers
Region or regional
conditions
NA
Abatement
technologies
NA
Not applicable
Not estimated NH3 PCBs HCB
Pollutant Value Unit 95 confidence
interval
Reference
Lower Upper
NOx 89 gGJ 15 185 US EPA (1998) chapter 14
CO 39 gGJ 20 60 US EPA (1998) chapter 14
NMVOC 26 gGJ 065 104 US EPA (1998) chapter 14
SOx 0281 gGJ 0169 0393 US EPA (1998) chapter 14
TSP 089 gGJ 0445 134 US EPA (1998) chapter 14
PM10 089 gGJ 0445 134 US EPA (1998) chapter 14
PM25 089 gGJ 0445 134 US EPA (1998) chapter 14
BC 25 of PM25 1 63 See Note
Pb 00015 mgGJ 00005 00045 Nielsen et al 2012
Cd 000025 mgGJ 000008 000075 Nielsen et al 2012
Hg 01 mgGJ 001 1 Nielsen et al 2010
As 012 mgGJ 004 036 Nielsen et al 2012
Cr 000076 mgGJ 000025 000228 Nielsen et al 2012
Cu 0000076 mgGJ 0000025 0000228 Nielsen et al 2012
Ni 000051 mgGJ 000017 000153 Nielsen et al 2012
Se 00112 mgGJ 000375 00337 US EPA (1998) chapter 14
Zn 00015 mgGJ 00005 00045 Nielsen et al 2012
PCDDF 05 ng I-
TEQGJ
025 075 UNEP (2005)
Benzo(a)pyrene 056 microgGJ 019 056 US EPA (1998) chapter 14
(Less than value based
on method detection
limits)
Benzo(b)fluoranthene 084 microgGJ 028 084 US EPA (1998) chapter 14
(Less than value based
on method detection
limits)
Benzo(k)fluoranthene 084 microgGJ 028 084 US EPA (1998) chapter 14
(Less than value based
1A1 Energy industries
EMEPEEA air pollutant emission inventory guidebook 2019 27
on method detection
limits)
Indeno(123-cd)pyrene 084 microgGJ 028 084 US EPA (1998) chapter 14
(Less than value based
on method detection
limits)
Notes
For conversion of the US EPA data the heating value as provided in the reference has been used (102 BTUscf)
This has been converted to NCV using a factor of 090 Furthermore units have been converted using 10550559
JBTU and 45359237 glb
The factor for SOx is based on approximately 001 gm3 mass sulphur content
Emission factor for PCDDF is stated to be applicable light fuel oil and natural gas use in power station boilers
but is based mainly on data from oil combustion UNEP also reports limited data for gas combustion of between
002 and 003 ng TEQGJ for natural gas-fired boilers
The BC emission factor is the average of the data available in England et al (2004) Wien et al (2004) and the
Speciate database (US EPA 2011)
The TSP PM10 and PM25 emission factors represent filterable PM emissions Note that condensable PM emission
factors are also provided in US EPA (1998) Chapter 14
Table 3-13 Tier 2 emission factors for source category 1A1a dry bottom boilers using wood
waste
Tier 2 emission factors
Code Name
NFR Source Category 1A1a Public electricity and heat production
Fuel Wood and wood waste (clean wood waste)
SNAP (if applicable) 010101
010102
Public power - Combustion plants gt= 300 MW (boilers)
Public power - Combustion plants gt= 50 and lt 300 MW
(boilers)
TechnologiesPractices Dry Bottom Boilers
Region or regional
conditions
NA
Abatement technologies Primary NOx abatement ndash no PM abatement
Not applicable
Not estimated NH3
Pollutant Value Unit 95 confidence
interval
Reference
Lower Upper
NOx 81 gGJ 40 160 Nielsen et al 2010
CO 90 gGJ 45 180 Nielsen et al 2010
NMVOC 731 gGJ 244 219 US EPA (2003) chapter 16
SOx 108 gGJ 645 151 US EPA (2003) chapter 16
TSP 172 gGJ 86 344 US EPA (2003) chapter 16
PM10 155 gGJ 77 310 US EPA (2003) chapter 16
PM25 133 gGJ 66 266 US EPA (2003) chapter 16
BC 33 of PM25 16 66 See Note
Pb 206 mgGJ 124 289 US EPA (2003) chapter 16
Cd 176 mgGJ 106 247 US EPA (2003) chapter 16
Hg 151 mgGJ 0903 211 US EPA (2003) chapter 16
As 946 mgGJ 568 132 US EPA (2003) chapter 16
Cr 903 mgGJ 542 126 US EPA (2003) chapter 16
Cu 211 mgGJ 126 295 US EPA (2003) chapter 16
Ni 142 mgGJ 851 199 US EPA (2003) chapter 16
Se 12 mgGJ 0722 169 US EPA (2003) chapter 16
Zn 181 mgGJ 108 253 US EPA (2003) chapter 16
1A1 Energy industries
EMEPEEA air pollutant emission inventory guidebook 2019 28
PCB 35 microgGJ 035 35 US EPA (2003) chapter 16
PCDDF 50 ng I-
TEQGJ
25 75 UNEP (2005) (for clean
wood)
Benzo(a)pyrene 112 mgGJ 0671 157 US EPA (2003) chapter 16
Benzo(b)fluoranthene 0043 mgGJ 00215 00645 US EPA (2003) chapter 16
Benzo(k)fluoranthene 00155 mgGJ 000774 00232 US EPA (2003) chapter 16
Indeno(123-cd)pyrene 00374 mgGJ 00187 00561 US EPA (2003) chapter 16
HCB 5 microgGJ 05 50 Bailey 2001
Note For conversion of the US EPA data units have been converted using 10550559 JBTU and 45359237 glb
The BC emission factor is an average of the data in Dayton amp Bursey (2001) and the Speciate database (US EPA
2011)
The TSP PM10 and PM25 emission factors represent filterable PM emissions Note that a condensable PM
emission factor is also provided in US EPA (1998) Chapter 16
Table 3-14 Tier 2 emission factors for source category 1A1a wet bottom boilers using
coking coal steam coal and sub-bituminous coal
Tier 2 emission factors
Code Name
NFR Source Category 1A1a Public electricity and heat production
Fuel Coking Coal Steam Coal amp Sub-Bituminous Coal
SNAP (if applicable) 010101
010102
Public power - Combustion plants gt= 300 MW (boilers)
Public power - Combustion plants gt= 50 and lt 300 MW (boilers)
TechnologiesPractices Wet Bottom Boilers
Region or regional
conditions
NA
Abatement technologies Abatement assumed except for SO2
Not applicable
Not estimated NH3
Pollutant Value Unit 95 confidence
interval
Reference
Lower Upper
NOx 244 gGJ 120 488 US EPA (1998) chapter 11
CO 87 gGJ 615 150 US EPA (1998) chapter 11
NMVOC 07 gGJ 04 16 US EPA (1998) chapter 11
SOx 820 gGJ 330 5000 See Note
TSP 80 gGJ 75 30 US EPA (1998) chapter 11
PM10 60 gGJ 6 24 US EPA (1998) chapter 11
PM25 31 gGJ 3 12 US EPA (1998) chapter 11
BC 22 of PM25 027 808 See Note
Pb 73 mgGJ 516 12 US EPA (1998) chapter 11
Cd 09 mgGJ 0627 146 US EPA (1998) chapter 11
Hg 14 mgGJ 102 238 US EPA (1998) chapter 11
As 71 mgGJ 504 118 US EPA (1998) chapter 11
Cr 45 mgGJ 32 746 US EPA (1998) chapter 11
Cu 90 mgGJ 0233 155 Expert judgement derived from
EMEPEEA (2006)
Ni 49 mgGJ 344 803 US EPA (1998) chapter 11
Se 23 mgGJ 16 373 US EPA (1998) chapter 11
Zn 90 mgGJ 0388 155 Expert judgement derived from
EMEPEEA (2006)
PCB 33 ng WHO-
TEQGJ
11 99 Grochowalski amp Konieczyński
2008
PCDDF 10 ng I-TEQGJ 5 15 UNEP (2005) Coal fired power
boilers
Benzo(a)pyrene 07 microgGJ 0245 221 US EPA (1998) chapter 11
1A1 Energy industries
EMEPEEA air pollutant emission inventory guidebook 2019 29
Benzo(b)fluoranthene 37 microgGJ 37 370 Wenborn et al 1999
Benzo(b)fluoranthene 29 microgGJ 29 290 Wenborn et al 1999
Indeno(123-cd)pyrene 11 microgGJ 0591 236 US EPA (1998) chapter 11
HCB 67 microgGJ 22 201 Grochowalski amp Konieczyński
2008
Note For conversion of the US EPA data the heating value as provided in the reference has been used (26
MMBTUton) This has been converted to NCV using a factor of 095 Furthermore units have been converted
using 10550559 JBTU and 45359237 glb The EFs for benzo(b)fluoranthene and benzo(k)fluoranthene are
converted using the average NCV for other bituminous coal of 241 GJton from Energy Statistics Manual
(OECDIEA 2005)
The factor for SOx assumes no SO2 abatement and is based on 1 mass sulphur content using EF calculation
from subsection 3422 of the present chapter 95 confidence intervals calculated using range from Table C-1
in Appendix C
The BC share is derived as the average of data from Henry amp Knapp (1980) Olmez et al (1988) Watson et al
(2001) Fisher et al (1979) Griest amp Tomkins (1984) Engelbrecht et al (2002) Chow et al (2004) and Speciate (US
EPA 2011)
The TSP PM10 and PM25 emission factors provided in US EPA (1998) Chapter 11 represent filterable PM emissions
and are determined from fuel ash content Note that condensable PM emission factors are also provided in US
EPA (1998) Chapter 11
Table 3-15 Tier 2 emission factors for source category 1A1a fluid bed boilers using hard
coal
Tier 2 emission factors
Code Name
NFR Source Category 1A1a Public electricity and heat production
Fuel Hard Coal
SNAP (if applicable) 010101
010102
Public power - Combustion plants gt= 300 MW (boilers)
Public power - Combustion plants gt= 50 and lt 300 MW (boilers)
TechnologiesPractices Fluid Bed Boilers
Region or regional
conditions
NA
Abatement technologies Abatement assumed except for SO2
Not applicable
Not estimated NH3
Pollutant Value Unit 95 confidence
interval
Reference
Lower Upper
NOx 825 gGJ 10 112 European Commission (2006)
CO 313 gGJ 150 600 US EPA (1998) chapter 11
NMVOC 09 gGJ 06 24 US EPA (1998) chapter 11
SOx 820 gGJ 330 5000 See Note
TSP 84 gGJ 75 30 US EPA (1998) chapter 11
PM10 77 gGJ 6 24 US EPA (1998) chapter 11
PM25 52 gGJ 3 12 US EPA (1998) chapter 11
BC 22 of PM25 027 808 See Note
Pb 73 mgGJ 488 114 US EPA (1998) chapter 11
Cd 09 mgGJ 059 138 US EPA (1998) chapter 11
Hg 14 mgGJ 097 225 US EPA (1998) chapter 11
As 71 mgGJ 477 111 US EPA (1998) chapter 11
Cr 45 mgGJ 302 705 US EPA (1998) chapter 11
Cu 90 mgGJ 023 155 Expert judgement derived from
EMEPEEA (2006)
Ni 49 mgGJ 326 76 US EPA (1998) chapter 11
Se 23 mgGJ 151 353 US EPA (1998) chapter 11
1A1 Energy industries
EMEPEEA air pollutant emission inventory guidebook 2019 30
Zn 90 mgGJ 039 155 Expert judgement derived from
EMEPEEA (2006)
PCBs 33 ng WHO-
TEQGJ
11 99 Grochowalski amp Konieczyński
2008
PCDDF 10 ng I-TEQGJ 5 15 UNEP (2005) Coal fired power
boilers
Benzo(a)pyrene 07 microgGJ 0245 221 US EPA (1998) chapter 11
Benzo(b)fluoranthene 37 microgGJ 37 370 Wenborn et al 1999
Benzo(b)fluoranthene 29 microgGJ 29 290 Wenborn et al 1999
Indeno(123-cd)pyrene 11 microgGJ 0591 236 US EPA (1998) chapter 11
HCB 67 microgGJ 22 201 Grochowalski amp Konieczyński
2008
Note For conversion of the US EPA data the heating value as provided in the reference has been used (26
MMBTUton) This has been converted to NCV using a factor of 095 Furthermore units have been converted
using 10550559 JBTU and 45359237 glb The EFs for benzo(b)fluoranthene and benzo(k)fluoranthene are
converted using the average NCV for other bituminous coal of 241 GJton from Energy Statistics Manual
(OECDIEA 2005)
The factor for SOx assumes no SO2 abatement and is based on 1 mass sulphur content using EF calculation
from subsection 3422 of the present chapter 95 confidence intervals calculated using range from Table C-1
in Appendix C
The BC share is derived as the average of data from Henry amp Knapp (1980) Olmez et al (1988) Watson et al
(2001) Fisher et al (1979) Griest amp Tomkins (1984) Engelbrecht et al (2002) Chow et al (2004) and Speciate (US
EPA 2011)
The basis of the TSP PM10 and PM25 emission factors could not be determined in the reference
Table 3-16 Tier 2 emission factors for source category 1A1a fluid bed boilers using brown
coal
Tier 2 emission factors
Code Name
NFR Source Category 1A1a Public electricity and heat production
Fuel Brown Coal
SNAP (if applicable) 010101
010102
Public power - Combustion plants gt= 300 MW (boilers)
Public power - Combustion plants gt= 50 and lt 300 MW
(boilers)
TechnologiesPractices Fluid Bed Boilers
Region or regional
conditions
NA
Abatement technologies NA
Not applicable
Not estimated BC NH3
Pollutant Value Unit 95 confidence
interval
Reference
Lower Upper
NOx 60 gGJ 35 852 European Commission
(2006)
CO 13 gGJ 01 26 European Commission
(2006)
NMVOC 1 gGJ 02 5 US EPA (1998) chapter 17
SOx 1680 gGJ 330 5000 See Note
TSP 102 gGJ 34 306 US EPA (1998) chapter 17
PM10 69 gGJ 23 207 US EPA (1998) chapter 17
PM25 28 gGJ 09 84 US EPA (1998) chapter 17
Pb 15 mgGJ 106 247 US EPA (1998) chapter 17
Cd 18 mgGJ 129 3 US EPA (1998) chapter 17
Hg 29 mgGJ 209 488 US EPA (1998) chapter 17
1A1 Energy industries
EMEPEEA air pollutant emission inventory guidebook 2019 31
As 143 mgGJ 103 241 US EPA (1998) chapter 17
Cr 91 mgGJ 655 153 US EPA (1998) chapter 17
Cu 10 mgGJ 008 078 Expert judgement derived
from EMEPEEA (2006)
Ni 97 mgGJ 706 165 US EPA (1998) chapter 17
Se 45 mgGJ 328 765 US EPA (1998) chapter 17
Zn 88 mgGJ 05 168 Expert judgement derived
from EMEPEEA (2006)
PCBs 33 ng WHO-
TEQGJ
11 99 Grochowalski amp
Konieczyński 2008
PCDDF 10 ng I-
TEQGJ
5 15 UNEP (2005) Coal fired
power boilers
Benzo(a)pyrene 13 microgGJ 026 65 US EPA (1998) chapter 17
Benzo(b)fluoranthene 37 microgGJ 37 370 Wenborn et al 1999
Benzo(b)fluoranthene 29 microgGJ 29 290 Wenborn et al 1999
Indeno(123-cd)pyrene 21 microgGJ 04 105 US EPA (1998) chapter 17
HCB 67 microgGJ 22 201 Grochowalski amp
Konieczyński 2008
Note
For conversion of the US EPA data the heating value as provided in the reference has been used (6500 BTUlb)
This has been converted to NCV using a factor of 095 Furthermore units have been converted using 10550559
JBTU 2000 lbton and 45359237 glb The EFs for Cu and Zn are converted using the average NCV 119 GJMg
from IPCC Guidelines (IPCC 2006)
The factor for SOx assumes no SO2 abatement and is based on 1 mass sulphur content using EF calculation
from subsection 3422 of the present chapter 95 confidence intervals calculated using range from Table C-1
in Appendix C
The emission factors for PCBs benzo(b)fluoranthene benzo(k)fluoranthene and HCB are based on data for hard
coal combusted in FBB
The basis of the TSP PM10 and PM25 emission factors could not be determined in the reference
Table 3-17 Tier 2 emission factors for source category 1A1a gas turbines using gaseous
fuels
Tier 2 emission factors
Code Name
NFR Source Category 1A1a Public electricity and heat production
Fuel Gaseous Fuels
SNAP (if applicable) 010104 Public power - Gas turbines
TechnologiesPractices Gas Turbines
Region or regional
conditions
NA
Abatement
technologies
NA
Not applicable
Not estimated NH3 PCB PCDDF HCB
Pollutant Value Unit 95 confidence
interval
Reference
Lower Upper
NOx 48 gGJ 28 68 Nielsen et al 2010
CO 48 gGJ 1 70 Nielsen et al 2010
NMVOC 16 gGJ 05 76 Nielsen et al 2010
SOx 0281 gGJ 0169 0393 See note
TSP 02 gGJ 005 08 BUWAL 2001
PM10 02 gGJ 005 08 BUWAL 2001
PM25 02 gGJ 005 08 Assumed equal to PM25
1A1 Energy industries
EMEPEEA air pollutant emission inventory guidebook 2019 32
BC 25 of
PM25
1 63 See Note
Pb 00015 mgGJ 00005 00045 Nielsen et al 2012
Cd 000025 mgGJ 000008 000075 Nielsen et al 2012
Hg 01 mgGJ 001 1 Nielsen et al 2010
As 012 mgGJ 004 036 Nielsen et al 2012
Cr 000076 mgGJ 000025 000228 Nielsen et al 2012
Cu 0000076 mgGJ 0000025 0000228 Nielsen et al 2012
Ni 000051 mgGJ 000017 000153 Nielsen et al 2012
Se 00112 mgGJ 000375 00337 US EPA (1998) chapter 14
Zn 00015 mgGJ 00005 00045 Nielsen et al 2012
Benzo(a)pyrene 056 microgGJ 019 056 US EPA (1998) chapter 14
(Less than value based
on method detection
limits)
Benzo(b)fluoranthene 158 microgGJ 05 47 API 1998
Benzo(k)fluoranthene 111 microgGJ 04 33 API 1998
Indeno(123-cd)pyrene 836 microgGJ 28 251 API 1998
Notes
It must be noted that the Hg content (and other heavy metals) of natural gas varies between gas fields However
the differences after natural gas processing is thought to be of minor importance The US EPA (1998) provides an
emission factor of 01 mgGJ It is encouraged that countries obtain country specific data for the natural gas based
on the origin The factor for SOx is based on approximately 001 gm3 mass sulphur content An SO2 emission
factor can also be calculated using the EF calculation from subsection 3422 of the present chapter
The BC emission factor is the average of the data available in England et al (2004) Wien et al (2004) and the
Speciate database (US EPA 2011)
The basis of the TSP PM10 and PM25 emission factors could not be determined in the reference
Table 3-18 Tier 2 emission factors for source category 1A1a gas turbines using gas oil
Tier 2 emission factors
Code Name
NFR Source Category 1A1a Public electricity and heat production
Fuel Gas Oil
SNAP (if applicable) 010104 Public power ndash gas turbines
TechnologiesPractices Gas Turbines
Region or regional
conditions
NA
Abatement technologies NA
Not applicable
Not estimated NH3 As Cu Ni Se Zn PCB PCDDF Benzo(a)pyrene
Benzo(b)fluoranthene Benzo(k)fluoranthene Indeno(123-cd)pyrene
HCB
Pollutant Value Unit 95 confidence
interval
Reference
Lower Upper
NOx 398 gGJ 239 557 US EPA (2000) chapter 31
CO 149 gGJ 089 209 US EPA (2000) chapter 31
NMVOC 019 gGJ 011 026 US EPA (2000) chapter 31
SOx 465 gGJ 465 465 See Note
TSP 195 gGJ 065 585 US EPA (2000) chapter 31
PM10 195 gGJ 065 585 US EPA (2000) chapter 31
PM25 195 gGJ 065 585 US EPA (2000) chapter 31
BC 335 of PM25 289 38 Hildemann et al 1981 amp
Bond et al 2006
Pb 00069 mgGJ 00007 0069 Pulles et al (2012)
1A1 Energy industries
EMEPEEA air pollutant emission inventory guidebook 2019 33
Cd 00012 mgGJ 00001 0012 Pulles et al (2012)
Hg 0053 mgGJ 0005 053 Pulles et al (2012)
As 00023 mgGJ 00002 0023 Pulles et al (2012)
Cr 028 mgGJ 023 030 Pulles et al (2012)
Cu 017 mgGJ 014 020 Pulles et al (2012)
Ni 00023 mgGJ 00002 0023 Pulles et al (2012)
Se 00023 mgGJ 00002 0023 Pulles et al (2012)
Zn 044 mgGJ 037 051 Pulles et al (2012)
Note
For conversion of the US EPA data the values have been converted to NCV using a factor of 095 Furthermore
units have been converted using 10550559 JBTU and 45359237 glb
The factor for SOx is based on 01 mass sulphur content
Due to lack of data the BC emission factor refers to gas oil fired boilersThe TSP PM10 and PM25 emission factors
represent filterable PM emissions Note that a condensable PM emission factor is also provided in US EPA (2000)
Chapter 31
1A1 Energy industries
EMEPEEA air pollutant emission inventory guidebook 2019 34
Table 3-19 Tier 2 emission factors for source category 1A1a reciprocating engines using
gas oil
Tier 2 emission factors
Code Name
NFR Source Category 1A1a Public electricity and heat production
Fuel Gas Oil
SNAP (if applicable) 010105 Public power - Stationary engines
TechnologiesPractices Large stationary CI reciprocating engines
Region or regional
conditions
NA
Abatement technologies NA
Not applicable
Not estimated NH3
Pollutant Value Unit 95 confidence
interval
Reference
Lower Upper
NOx 942 gGJ 500 1380 Nielsen et al 2010
CO 130 gGJ 30 230 Nielsen et al 2010
NMVOC 371 gGJ 185 556 US EPA (1996) chapter 34
SOx 465 gGJ 465 465 See Note
TSP 281 gGJ 141 562 US EPA (1996) chapter 34
PM10 224 gGJ 112 448 US EPA (1996) chapter 34
PM25 217 gGJ 108 434 US EPA (1996) chapter 34
BC 78 of PM25 63 93 Hernandez et al 2004
Pb 407 mgGJ 041 407 US EPA (2010) chapter 13
Cd 136 mgGJ 014 136 US EPA (2010) chapter 13
Hg 136 mgGJ 014 136 US EPA (2010) chapter 13
As 181 mgGJ 018 181 US EPA (2010) chapter 13
Cr 136 mgGJ 014 136 US EPA (2010) chapter 13
Cu 272 mgGJ 027 271 US EPA (2010) chapter 13
Ni 136 mgGJ 014 136 US EPA (2010) chapter 13
Se 679 mgGJ 068 679 US EPA (2010) chapter 13
Zn 181 mgGJ 018 181 US EPA (2010) chapter 13
PCDDF 099 ng I-
TEQGJ
01 10 Nielsen et al 2010
HCB 022 microgGJ 0022 22 Nielsen et al 2010
PCBs 013 ng I-
TEQGJ
0013 13 Nielsen et al 2010
Benzo(a)pyrene 0116 mgGJ 00582 0116 US EPA (1996) chapter 34
(Less than value based on
method detection limits)
Benzo(b)fluoranthene 0502 mgGJ 0251 0754 US EPA (1996) chapter 34
Benzo(k)fluoranthene 00987 mgGJ 00493 00987 US EPA (1996) chapter 34
(Less than value based on
method detection limits)
Indeno(123-cd)pyrene 0187 mgGJ 00937 0187 US EPA (1996) chapter 34
(Less than value based on
method detection limits)
Notes
For conversion of the US EPA data the values have been converted to NCV using a factor of 095 Furthermore
units have been converted using 10550559 JBTU and 45359237 glb
The factor for SOx assumes no SO2 abatement and is based on 01 mass sulphur content using EF calculation
from subsection 3422 of the present chapterThe TSP PM10 and PM25 emission factors represent filterable PM
emissions Note that a condensable PM emission factor is also provided in US EPA (1996) Chapter 34
1A1 Energy industries
EMEPEEA air pollutant emission inventory guidebook 2019 35
Table 3-20 Tier 2 emission factors for source category 1A1a reciprocating engines using
natural gas
Tier 2 emission factors
Code Name
NFR Source Category 1A1a Public electricity and heat production
Fuel Natural gas
SNAP (if applicable) 010105 Public power - Stationary engines
TechnologiesPractices Stationary reciprocating Engines - gas-fired
Region or regional
conditions
NA
Abatement technologies NA
Not applicable
Not estimated NH3 PCBs HCB
Pollutant Value Unit 95 confidence
interval
Reference
Lower Upper
NOx 135 gGJ 65 200 Nielsen et al 2010
CO 56 gGJ 20 135 Nielsen et al 2010
NMVOC 89 gGJ 45 135 Nielsen et al 2010
SO2 05 gGJ 01 1 BUWAL 2001
TSP 2 gGJ 1 3 BUWAL 2001
PM10 2 gGJ 1 3 BUWAL 2001
PM25 2 gGJ 1 3 BUWAL 2001
BC 25 of PM25 1 63 See Note
Pb 004 mgGJ 0008 02 Nielsen et al 2010
Cd 0003 mgGJ 00006 0015 Nielsen et al 2010
Hg 01 mgGJ 002 05 Nielsen et al 2010
As 005 mgGJ 001 025 Nielsen et al 2010
Cr 005 mgGJ 001 025 Nielsen et al 2010
Cu 001 mgGJ 0002 005 Nielsen et al 2010
Ni 005 mgGJ 001 025 Nielsen et al 2010
Se 02 mgGJ 004 1 Nielsen et al 2010
Zn 291 mgGJ 06 146 Nielsen et al 2010
PCDDF 057 ng I-TEQGJ 028 12 Nielsen et al 2010
Benzo(a)pyrene 120 microgGJ 024 6 Nielsen et al 2010
Benzo(b)fluoranthene 900 microgGJ 18 45 Nielsen et al 2010
Benzo(k)fluoranthene 170 microgGJ 034 85 Nielsen et al 2010
Indeno(123-cd)pyrene 180 microgGJ 036 9 Nielsen et al 2010
Notes
SO2 emission factor can also be calculated using EF calculation from subsection 3422 of the present chapter
The BC emission factor is the average of the data available in England et al (2004) Wien et al (2004) and the
Speciate database (US EPA 2011)
The basis of the TSP PM10 and PM25 emission factors could not be determined in the reference
1A1 Energy industries
EMEPEEA air pollutant emission inventory guidebook 2019 36
3433 Abatement
A number of technologies exist that are aimed at reducing the emissions of specific pollutants The
resulting emission can be calculated by applying an abated emission factor as given in the formula
unabatedtechnologyabatementabatedtechnology EFEF )1( (5)
However this approach requires knowledge of emissions for the unabated or lsquobaselinersquo technology
and abatement efficiency which may be difficult to obtain
Abatement performance is rarely expressed in terms of efficiency but in terms of the achievable or
guaranteed emission concentration (for example to achieve compliance with an emission limit
value) Assessment of abatement performance is almost always determined by measurement of
emitted concentrations To allow users to assess if the Tier 2 emission factors for technologies can
be reasonably applied to their country subsection 63 Verification of the present chapter provides
guidance on conversion of emission concentrations (measured concentrations or emission limit
values) into emission factors for selected fuels
3434 Activity data
Information on the production of power which is suitable for estimating emissions using the
simpler estimation methodology (Tier 1 and 2) is available from national statistics agencies or the
International Energy Agency (IEA)
Further guidance is provided in the 2006 IPCC Guidelines for National Greenhouse Gas Inventories
volume 2 on Stationary Combustion wwwipcc-
nggipigesorjppublic2006glpdf2_Volume2V2_2_Ch2_Stationary_Combustionpdf
For a Tier 2 approach these data need to be stratified according to technologies applied Typical
sources for this data might be industrial or regulatory organisations within the country or from
specific questionnaires to the individual combustion installations
344 Tier 3 use of facility-specific data
3441 Algorithm
Where facility-level emission data of sufficient quality (see Chapter 3 Data collection in part A) are
available it is good practice to use these data There are two possibilities
the facility reports cover all relevant combustion processes in the country
facility-level emission reports are not available for all relevant combustion processes in the
country
If facility-level data are available covering all activities in the country the implied emission factors
(reported emissions divided by the national fuel use) should be compared with the default emission
factor values or technology-specific emission factors If the implied emission factors are outside the
95 confidence intervals for the values given it is good practice to explain the reasons for this in
the inventory report
Depending on the specific national circumstances and the coverage of the facility-level reports as
compared to the total combustion activity the emission factor (EF) in this equation should be chosen
from the following possibilities in decreasing order of preference
1A1 Energy industries
EMEPEEA air pollutant emission inventory guidebook 2019 37
technology-specific emission factors based on knowledge of the types of technologies
implemented at the facilities where facility-level emission reports are not available
the implied emission factor derived from the available emission reports
Facilities
Facility
Facilities
pollutantFacility
Production
E
EF
(7)
the default Tier 1 emission factor This option should only be chosen if the facility-level emission
reports cover more than 90 of the total national production
Sources of emission factor guidance for facilities include the USEPA (USEPA AP-42) BREF and
industry sector guidance (for example Eurelectric (The Union of the Electricity Industry) 2008)
Emission concentration data and ELVs can also be used by inventory compilers to develop emission
factors (Appendix E) The older versions of the Guidebook also provided a range of emission factors
which may be of use and these are provided at Appendix F
3442 Tier 3 use of facility data
Many combustion installations are major facilities and emission data for individual plants might be
available through a pollutant release and transfer registry (PRTR) or another national emission
reporting scheme The electricity sector is developing guidance on estimating emissions (Eurelectric
2008) When the quality of such data is assured by a well developed QAQC system and the emission
reports have been verified by an independent auditing scheme it is good practice to use such data
If extrapolation is needed to cover all activity in the country either the implied emission factors for
the facilities that did report or the emission factors as provided above could be used (see
subsection 3432)
3443 Activity data
Since PRTR generally do not report activity data such data in relation to the reported facility-level
emissions are sometimes difficult to find A possible source of facility-level activity might be the
registries of emission trading systems
In many countries national statistics offices collect production data on facility level but these are in
many cases confidential However in several countries national statistics offices are part of the
national emission inventory systems and the extrapolation if needed could be performed at the
statistics office ensuring that confidentiality of production data is maintained
1A1 Energy industries
EMEPEEA air pollutant emission inventory guidebook 2019 38
4 1A1b Petroleum refining
41 Techniques
Details of technologies used in this activity can be found within the Best Available Techniques
Reference Note (BREF) for refining installations (EIPPCB 2015)
411 Process energy
Refineries require electrical and thermal energy in substantial quantities Electrical and thermal
energy is typically generated by combined heat and power (CHP) or cogeneration facilities at the
refinery Thermal energy can be provided directly (process furnaces on the production unit) or via
steam produced within the production unit or from a utilities facility The technologies for production
of energy from combustion can be identical to those for 1A1a activities but in many instances the
difference will be that the fuels utilised will be refinery gaseous and liquid fuels Where non-refinery
fuels are used in combustion processes the information provided in the 1A1a activity can be
applied
412 Production activities
Many production activities incorporate process furnaces to heat feedstock these may use refinery
fuels and recover refinery by-products and these will have associated combustion emissions
Incineration and flaring of refinery by-products are other combustion activities (see Chapter 1B2c)
In addition process sources include bitumen blowing blowdown systems hydrogen plant fluid
coking units fluidised catalytic cracking (FCC) units and catalytic reforming units (see Chapter
1B2aiv)
42 Emissions
Note that the inventory methodologies for Greenhouse gas emissions (carbon dioxide methame
and nitrous oxide) are not included ndash refer to IPCC guidance [IPCC 2006]
42111 Sulphur oxides
Most emissions arise from process furnaces boilers sulphur recovery units FCC regenerators
flares incinerators and decoking units In the absence of flue gas desulphurisation (FGD) technology
the emissions of sulphur oxides (SOx) are directly related to the sulphur content of the fuel The
majority of SOx is sulphur dioxide (SO2) although small proportions of sulphur trioxide (SO3) can
arise
42112 Nitrogen oxides
Emissions of nitrogen oxides (nitric oxide and nitrogen dioxide mdash NOx) arise primarily from
combustion and the FCC unit Combustion control can provide a high degree of NOx emission control
(low NOx burner technology) and this may be supplemented by use of selective catalytic reduction
(SCR) or selective non catalytic reduction techniques (SNCR)
42113 Non-methane volatile organic compounds (NMVOC)
Emissions of non-methane volatile organic compounds (NMVOC) can result from combustion
activities (including flaring) and process discharges such as vents and blowdown systems However
many emission sources on refineries tend to be fugitive releases (See chapter 1B2aiv)
1A1 Energy industries
EMEPEEA air pollutant emission inventory guidebook 2019 39
42114 Carbon monoxide (CO)
Apart from combustion flaring and incineration activities the FCC and catalytic reforming units can
produce CO but include CO boilers (thermal oxidisers) to control emissions
42115 Ammonia (NH3)
Emissions can result from incomplete reaction of NH3 additive in NOx abatement systems mdash
selective catalytic and non-catalytic reduction (SCR and SNCR) Regenerators for FCC units may emit
ammonia but these emissions are eliminated by use of CO boilers In addition refrigeration systems
which use ammonia may have an associated emission
42116 Particulate matter
Particulate matter (PM) emissions from refinery operations are associated with combustion
activities and selected production units including coking units and fluid catalytic cracking units
Note that PM emission factors in the Guidebook represent primary emissions from the activities and
not formation of secondary aerosol from chemical reaction in the atmosphere after release
A number of factors influence the measurement and determination of primary PM emissions from
activities and the quantity of PM determined in an emission measurement depends to a large extent
on the measurement conditions This is particularly true of activities involving high temperature and
semi-volatile emission components ndash in such instances the PM emission may be partitioned between
a solidaerosol phase and material which is gaseous at the sampling point but which can condense
in the atmosphere The proportion of filterable and condensable material will vary depending on the
temperature of the flue gases and in sampling equipment
A range of filterable PM measurement methods are applied around the world typically with filter
temperatures of 70-160degC (the temperature is set by the test method) Condensable fractions can
be determined directly by recovering condensed material from chilled impinger systems
downstream of a filter ndash note that this is condensation without dilution and can require additional
processing to remove sampling artefacts Another approach for total PM includes dilution where
sampled flue or exhaust gases are mixed with ambient air (either using a dilution tunnel or dilution
sampling systems) and the filterable and condensable components are collected on a filter at lower
temperatures (but depending on the method this can be 15-52degC) The use of dilution methods for
routine measurements on refinery stacks however is limited due to practical constraints with
weight andor size of the equipment
The Guidebook identifies whether the PM emission factors (for TSP PM10 and PM25) represent total
PM filterable PM or whether the basis of the emission factor cannot be determined (see individual
emission factor tables)
42117 Metals
According to the BREF important heavy metals in crude oils are As Hg Ni and V Concawe (Concawe
2015) also present methodologies for Cd Cr Cu Pb and Zn with sources from combustion
incineration of gaseous streams FCC regenerators and fluid coking Nickel and vanadium tend to be
enriched in residues from distillation
1A1 Energy industries
EMEPEEA air pollutant emission inventory guidebook 2019 40
43 Controls
Details of relevant abatement technologies are described in the BREF notes for refineries and large
combustion plant httpeippcbjrceceuropaeureference Relevant abatement technologies for
refinery combustion units are described in 1A1a In general end of pipe treatment of FCC units
tends to be similar to the controls for combustion plant
44 Methods
441 Choice of method
Figure 4-1 presents the procedure to select the methods for estimating process emissions from
petroleum refining The basic idea is
if detailed information is available use it
if the source category is a key source a Tier 2 or better method must be applied and detailed
input data must be collected The decision tree directs the user in such cases to the Tier 2
method since it is expected that it is more easy to obtain the necessary input data for this
approach than to collect facility-level data needed for a Tier 3 estimate
the alternative of applying a Tier 3 method using detailed process modelling is not explicitly
included in this decision tree However detailed modelling will always be done at facility level
and results of such modelling could be seen as lsquofacility datarsquo in the decision tree
1A1 Energy industries
EMEPEEA air pollutant emission inventory guidebook 2019 41
Figure 4-1 Decision tree for combustion in petroleum refining
442 Tier 1 default approach
4421 Algorithm
The Tier 1 approach for process emissions from combustion uses the general equation
pollutantptionfuelconsumpollutant EFARE (1)
Epollutant annual emission of pollutant
EFpollutant emission factor of pollutant
ARfuel consumption activity rate by fuel consumption
This equation is applied at the national level using annual national total fuel use (disaggregated by
fuel type) Information on fuel consumption suitable for estimating emissions using the simpler
estimation methodology is widely available from UN statistical yearbooks or national statistics
Start
Are all single
sources in the source
category Measured
reported
Use Tier 3
Facility data
only
Is a detailed
estimation model
available
Use Tier 2
technology specific
activity data
and EFs
Key source
Get
technology stratified
activity data
and EFs
Apply Tier 1
default EFs
Yes
Yes
Yes
Yes
No
No
Is specific fuel
use data available
for the source
Use measurements Tier
3 approach and
combine with country
specific EFs from Tier 2
Can modelled fuel
consumption be reconciled
with national fuel statistics
from independent
sources
Use model Tier 3
approach
No
No
No
Yes
1A1 Energy industries
EMEPEEA air pollutant emission inventory guidebook 2019 42
The Tier 1 emission factors generally assume an average or typical technology and abatement
implementation However emission factors for this chapter reflect unabated emissions
In cases where specific abatement techniques are to be taken into account a Tier 1 method is not
applicable and a Tier 2 or Tier 3 approach must be used
4422 Default emission factors
The default emission factors for combustion activities at Tier 1 are based on fuel types including fuel
types common with the 1A1a activity As most combustion is in process furnaces without contact
with the material being heated Tier 1 default factors for refinery combustion can often be drawn
from the 1A1a Tier 1 default factors classifications (see Table 4-1)
Table 4-1 Tier 1 fuel classifications
Tier 1 fuel type Associated fuel types Location
Natural gas Natural gas See 1Ala Tier 1
Heavy fuel oil Residual fuel oil refinery feedstock
petroleum coke
See 1A1a Tier 1
Other liquid fuels (a) Gas oil kerosene naphtha natural gas
liquids liquefied petroleum gas
orimulsion bitumen shale oil
(b) refinery gas
(a) See 1A1a Tier 1
(b) Table 4-2
The Tier 1 default emission factors for refinery gas as given in
1A1 Energy industries
EMEPEEA air pollutant emission inventory guidebook 2019 43
Table 4-2 have been derived from emission factors published by USEPA (USEPA 1998) and elsewhere
including factors incorporated by the industry sector (Concawe 2015) In the absence of detail on
relative use of combustion or abatement technology which will be different for each country the
proposed factors represent a mean of unabated emissions for the range of combustion technologies
in use with the 95 figures a measure of the range of unabated emissions in the sector
An emission factor for sulphur oxides is provided in the Tier 1 table but this is based on a range of
published factors some of which represent very different sulphur levels in the fuels Where countries
have knowledge of fuel sulphur content then it is recommended that a sulphur oxides emission
factor is calculated from fuel sulphur content
1A1 Energy industries
EMEPEEA air pollutant emission inventory guidebook 2019 44
Table 4-2 Tier 1 emission factors for source category 1A1b refinery gas
Tier 1 default emission factors
Code Name
NFR Source Category 1A1b Petroleum refining
Fuel Refinery Gas
Not applicable
Not estimated NH3 PCDDF HCB
Pollutant Value Unit 95 confidence
interval
Reference
Lower Upper
NOx 63 gGJ 315 844 US EPA (1998) chapter 14
CO 121 gGJ 73 17 Concawe (2015)
NMVOC 258 gGJ 129 515 US EPA (1998) chapter 14
SOx 0281 gGJ 0169 0393 US EPA (1998) chapter 14
TSP 089 gGJ 0297 267 US EPA (1998) chapter 14
PM10 089 gGJ 0297 267 US EPA (1998) chapter 14
PM25 089 gGJ 0297 267 US EPA (1998) chapter 14
BC 184 of PM25 52 363 US EPA 2011
Pb 161 mgGJ 12 21 Concawe Report 916
Cd 219 mgGJ 06 38 Concawe Report 916
Hg 0372 mgGJ 02 05 Concawe Report 916
As 0352 mgGJ 03 04 Concawe Report 916
Cr 669 mgGJ 03 131 Concawe Report 916
Cu 329 mgGJ 24 42 Concawe Report 916
Ni 737 mgGJ 16 131 Concawe Report 916
Se 156 mgGJ 11 20 Concawe Report 916
Zn 170 mgGJ 120 220 Concawe Report 916
Benzo(a)pyrene 0669 microgGJ 0223 201 API (1998 2002)
Benzo(b)fluoranthene 114 microgGJ 0379 341 API (1998 2002)
Benzo(k)fluoranthene 0631 microgGJ 021 189 API (1998 2002)
Indeno(123-cd)pyrene 0631 microgGJ 021 189 API (1998 2002)
Note
The factor for SOx is based on approximately 001 gm3 mass sulphur content SO2 emission factor can also be
calculated using EF calculation from subsection 3422 of the present chapter
These PM factors represent filterable PM emissions only (excluding any condensable fraction)
If a Tier 1 approach is adopted for the process emissions (Chapter 1B2aiv) combustion emissions
are already covered and should not be reported again in Chapter 1A1b since this would lead to
double counting
4423 Tier 1 activity data
Information on the use of energy suitable for estimating emissions using the Tier 1 simpler
estimation methodology is available from national statistics agencies or the International Energy
Agency (IEA)
Further guidance is provided in the 2006 IPCC Guidelines for National Greenhouse Gas Inventories
volume 2 on Stationary Combustion
wwwipcc-nggipigesorjppublic2006glpdf2_Volume2V2_2_Ch2_Stationary_Combustionpdf
The activity rate and the emission factor have to be determined on the same level of aggregation
depending on the availability of data The activity statistic should be determined within the
considered country or region by using adequate statistics The activity should refer to the energy
input of the emission sources considered (net or inferior fuel consumption in [GJ])
1A1 Energy industries
EMEPEEA air pollutant emission inventory guidebook 2019 45
443 Tier 2 technology-specific approach
4431 Algorithm
The Tier 2 approach is similar to the Tier 1 approach To apply the Tier 2 approach both the activity
data and the emission factors need to be applied according to a countryrsquos installed combustion and
abatement technologies These techniques may include
types of refinery
capacities of refineries
implementation of abatement technologies in the country
There are two approaches possible
disaggregate the fuel use in the country to model the different combustion and abatement types
into the inventory by
o defining the activity data using each of the identified process types (together called
lsquotechnologiesrsquo in the formulae below) separately and
o applying technology-specific emission factors for each process type
estechnologi
pollutanttechnologytechnologyproductionpollutant EFARE (2)
develop country-specific emission factors from the understanding of the relative contributions of
the different technologies within the national combustion plant portfolio (and relative fuel use)
and apply this country-specific emission factor for the national fuel use
pollutantcountryproductionpollutant
estechnologi
pollutanttechnologytechnologypollutantcountry
EFARE
EFnPenetratioEF
(3)
Both approaches are mathematically very similar or even identical Using one or the other approach
depends mainly on the availability of data If the activity data are indeed available the first approach
seems to be more appropriate If however no direct activity data are available penetration of
different technologies within the industry could be estimated from data on capacities or other
surrogate data that reflect relative sizes of facilities using the different technologies
4432 Technology-specific emission factors
Applying a Tier 2 approach for the process emissions from refineries technology-specific emission
factors are needed Examples are provided in this section The BREF document for refineries is
available at httpeippcbjrceceuropaeureference and provides guidance on achievable emission
levels Emission factors derived from the achievable emission levels values (AELs) as defined in the
BREF document are provided for comparison in subsection 631
This section provides a series of technology-specific pollutant emission factors for combustion units
eg boilers and process heaters and furnaces these factors represent a wider range of fuels and
combustion technologies than for Tier 1 They do not represent specific combustion technologies
but do offer more disaggregation than Tier 1 Many of the factors have been included in the industry
1A1 Energy industries
EMEPEEA air pollutant emission inventory guidebook 2019 46
guidance for estimating facility releases for E-PRTR (Concawe 2015) and represent unabated
emission factors
Emission factors for sulphur oxides are provided in the Tier 2 tables Where countries have
knowledge of fuel sulphur content and of abatement technologies then it is recommended that a
sulphur oxides emission factor is calculated from fuel sulphur content taking into account
abatement efficiency
A methodology to calculate NOx emissions has been provided in Concawe 2015 as the sectorrsquos
recommended method for refineries to use for emission reporting However NOx formation is very
complex and depends on a number of parameters (for example hydrogen content humidity burner
intensity) which may not be available for a Tier 2 methodology
Extension of Tier 2 to reflect emission abatement is possible through use of factors derived from
emission data For emission factors specific to gas turbines please see 1A1a subsection 3432
Tier 2 emission factor tables of the present chapter
If LPG is used the emission factors presented for natural gas should be used when estimating
emissions
A summary of the Tier 2 factors is provided in Table 4-3
Table 4-3 Tier 2 default factors
Technology Associated fuel types Location of Tier 2 factors
Process furnaces Residual oil Table 4-4
Gas oil Table 4-5
Refinery gas See Tier 1 (Table 4-2)
Natural gas Table 4-7
Gas turbines Various See Section 1A1a
Gas engines Natural gas Table 4-7
Compression ignition engines Gas oil Table 4-8
1A1 Energy industries
EMEPEEA air pollutant emission inventory guidebook 2019 47
Table 4-4 Tier 2 emission factors for source category 1A1b process furnaces using
residual oil
Tier 2 emission factors
Code Name
NFR Source Category 1A1b Petroleum refining
Fuel Residual Oil (Refinery Fuel Oil)
SNAP (if applicable) 0103 Petroleum refining plants
TechnologiesPractices Process Furnaces Heaters and Boilers
Region or regional
conditions
NA
Abatement
technologies
NA
Not applicable
Not estimated NH3 Benzo(a)pyrene Benzo(k)fluoranthene Indeno(123-cd)pyrene PCBs HCB
Pollutant Value Unit 95 confidence
interval
Reference
Lower Upper
NOx 142 gGJ 71 284 US EPA (1998) chapter 13
CO 6 gGJ 36 84 Concawe (2015)
NMVOC 23 gGJ 0676 409 US EPA (1998) chapter 13
SOx 485 gGJ 146 1700 See Note
TSP 20 gGJ 12 28 Visschedijk et al (2004)
PM10 15 gGJ 9 21 Visschedijk et al (2004)
PM25 9 gGJ 54 126 Visschedijk et al (2004)
BC 56 of PM25 022 869 See Note
Pb 46 mgGJ 09 23 US EPA (1998) chapter 13
Cd 12 mgGJ 024 6 US EPA (1998) chapter 13
Hg 03 mgGJ 003 06 US EPA (1998) chapter 13
As 398 mgGJ 0796 199 US EPA (1998) chapter 13
Cr 148 mgGJ 296 74 API (1998 2002)
Cu 119 mgGJ 238 595 API (1998 2002)
Ni 773 mgGJ 647 900 Concawe Report 916
Se 21 mgGJ 040 105 US EPA (1998) chapter 13
Zn 493 mgGJ 986 247 API (1998 2002)
PCDDF 25 ng I-
TEQGJ
125 375 UNEP (2005) Heavy fuel fired power
boilers
Benzo(b)fluoranthene 37 microgGJ 074 185 API (1998 2002)
Note
The factor for SOx assumes no SO2 abatement and is based on 1 mass sulphur content using EF calculation
from subsection 3422 of the present chapter 95 confidence intervals calculated using range from Table C-1
in Appendix C
The BC emission factor is derived as the average of the data found in Olmez et al (1988) England et al (2007)
and the Speciate database (US EPA 2011)
For benzo(a)pyrene benzo(k)fluoranthene and indeno(123-cd)pyrene all measurements reported by API (1998)
were below the detection limit Using this the EFs would be 060 020 and 13 microgGJ respectively
These PM factors represent filterable PM emissions
1A1 Energy industries
EMEPEEA air pollutant emission inventory guidebook 2019 48
Table 4-5 Tier 2 emission factors for source category 1A1b process furnaces using gas oil
Tier 2 emission factors
Code Name
NFR Source Category 1A1b Petroleum refining
Fuel Gas Oil
SNAP (if applicable) 0103 Petroleum refining plants
TechnologiesPractices Process Furnaces Heaters and Boilers
Region or regional
conditions
NA
Abatement
technologies
NA
Not applicable
Not estimated NH3 PCDDF Benzo(a)pyrene Benzo(b)fluoranthene Benzo(k)fluoranthene
Indeno(123-cd)pyrene PCBs HCB
Pollutant Value Unit 95 confidence
interval
Reference
Lower Upper
NOx 65 gGJ 325 975 US EPA (1998) chapter 13
CO 162 gGJ 54 50 US EPA (1998) chapter 13
NMVOC 065 gGJ 022 195 US EPA (1998) chapter 13
Sox 461 gGJ 369 460 See Note
TSP 647 gGJ 129 323 US EPA (1998) chapter 13
PM10 323 gGJ 0647 162 US EPA (1998) chapter 13
PM25 0808 gGJ 0162 404 US EPA (1998) chapter 13
BC 335 of
PM25
289 38 Hildemann et al 1981 amp Bond et al
2006
Pb 407 mgGJ 204 814 US EPA (1998) chapter 13
Cd 136 mgGJ 068 272 US EPA (1998) chapter 13
Hg 136 mgGJ 068 272 US EPA (1998) chapter 13
As 181 mgGJ 0905 362 US EPA (1998) chapter 13
Cr 136 mgGJ 068 272 US EPA (1998) chapter 13
Cu 272 mgGJ 136 544 US EPA (1998) chapter 13
Ni 136 mgGJ 068 272 US EPA (1998) chapter 13
Se 679 mgGJ 068 679 US EPA (1998) chapter 13
Zn 181 mgGJ 0905 362 US EPA (1998) chapter 13
Note
Based on 01 mass sulphur content
These PM factors represent filterable PM emissions only (excluding any condensable fraction)
1A1 Energy industries
EMEPEEA air pollutant emission inventory guidebook 2019 49
Table 4-6 Tier 2 emission factors for source category 1A1b process furnaces using
natural gas
Tier 2 emission factors
Code Name
NFR Source Category 1A1b Petroleum refining
Fuel Natural Gas
SNAP (if applicable) 0103 Petroleum refining plants
TechnologiesPractices Process Furnaces Heaters and Boilers
Region or regional
conditions
NA
Abatement
technologies
NA
Not applicable
Not estimated NH3 PCDDF PCBs HCB
Pollutant Value Unit 95 confidence
interval
Reference
Lower Upper
NOx 63 gGJ 315 844 US EPA (1998) chapter 14
CO 393 gGJ 236 551 US EPA (1998) chapter 14
NMVOC 258 gGJ 129 516 US EPA (1998) chapter 14
SOx 0281 gGJ 0169 0393 US EPA (1998) chapter 14
TSP 089 gGJ 0297 267 US EPA (1998) chapter 14
PM10 089 gGJ 0297 267 US EPA (1998) chapter 14
PM25 089 gGJ 0297 267 US EPA (1998) chapter 14
BC 86 of
PM25
43 172 Wien et al 2004
Pb 00015 mgGJ 00005 00045 Nielsen et al 2012
Cd 000025 mgGJ 000008 000075 Nielsen et al 2012
Hg 01 mgGJ 001 1 Nielsen et al 2010
As 012 mgGJ 004 036 Nielsen et al 2012
Cr 000076 mgGJ 000025 000228 Nielsen et al 2012
Cu 0000076 mgGJ 0000025 0000228 Nielsen et al 2012
Ni 000051 mgGJ 000017 000153 Nielsen et al 2012
Se 00112 mgGJ 000375 00337 US EPA (1998) chapter 14
Zn 00015 mgGJ 00005 00045 Nielsen et al 2012
Benzo(a)pyrene 056 microgGJ 019 056 US EPA (1998) chapter 14
(Less than value based
on method detection
limits)
Benzo(b)fluoranthene 084 microgGJ 028 084 US EPA (1998) chapter 14
(Less than value based
on method detection
limits)
Benzo(k)fluoranthene 084 microgGJ 028 084 US EPA (1998) chapter 14
(Less than value based
on method detection
limits)
Indeno(123-cd)pyrene 084 microgGJ 028 084 US EPA (1998) chapter 14
(Less than value based
on method detection
limits)
Note
The factor for SOx is based on approximately 001 gm3 mass sulphur content SO2 emission factor can also be
calculated using EF calculation from subsection 3422 of the present chapter
It must be noted that the Hg content (and other heavy metals) of natural gas varies between gas fields However
the differences after natural gas processing is thought to be of minor importance The US EPA (1998) provides an
1A1 Energy industries
EMEPEEA air pollutant emission inventory guidebook 2019 50
emission factor of 01 mgGJ It is encouraged that countries obtain country specific data for the natural gas based
on the origin
These PM factors represent filterable PM emissions only (excluding any condensable fraction)
Table 4-7 Tier 2 emission factors for source category 1A1b stationary engines using
natural gas
Tier 2 emission factors
Code Name
NFR Source Category 1A1b Petroleum refining
Fuel Natural Gas
SNAP (if applicable) 010305 Petroleum refining - Stationary engines
TechnologiesPractices 4-stroke lean burn gas engines
Region or regional
conditions
NA
Abatement technologies NA
Not applicable
Not estimated NH3 PCDDF PCBs HCB
Pollutant Value Unit 95 confidence
interval
Reference
Lower Upper
NOx 405 gGJ 200 810 US EPA (2000) chapter 32
CO 266 gGJ 130 530 US EPA (2000) chapter 32
NMVOC 56 gGJ 30 110 US EPA (2000) chapter 32
SOx 0281 gGJ 0169 0393 US EPA (2000) chapter 32
TSP 0037 gGJ 0003 037 US EPA (2000) chapter 32
PM10 0037 gGJ 0003 037 US EPA (2000) chapter 32
PM25 0037 gGJ 0003 037 US EPA (2000) chapter 32
BC 25 of PM25 1 63 See Note
Pb 004 mgGJ 0013 012 Nielsen et al 2010
Cd 0003 mgGJ 0001 0009 Nielsen et al 2010
Hg 01 mgGJ 003 03 Nielsen et al 2010
As 005 mgGJ 0017 015 Nielsen et al 2010
Cr 005 mgGJ 0017 015 Nielsen et al 2010
Cu 001 mgGJ 0003 003 Nielsen et al 2010
Ni 005 mgGJ 0017 015 Nielsen et al 2010
Se 02 mgGJ 007 06 Nielsen et al 2010
Zn 291 mgGJ 097 873 Nielsen et al 2010
Benzo(a)pyrene 162 microgGJ 54 486 API (1998)
Benzo(b)fluoranthene 149 microgGJ 50 447 API (1998)
Benzo(k)fluoranthene 241 microgGJ 80 723 API (1998)
Indeno(123-cd)pyrene 545 microgGJ 175 158 API (1998)
Notes
It must be noted that the Hg content (and other heavy metals) of natural gas varies between gas fields The US
EPA (1998) provides an emission factor of 01 mgGJ It is encouraged that countries obtain country specific data
for the natural gas based on the origin Also the amount of lubricants oxidised during use can significantly
influence the emission factors of heavy metals
The factor for SOx is based on approximately 001 gm3 mass sulphur content SO2 emission factor can also be
calculated using EF calculation from subsection 3422 of the present chapter
The BC emission factor is the average of the data available in England et al (2004) Wien et al (2004) and the
Speciate database (US EPA 2011)
These PM factors represent filterable PM emissions only (excluding any condensable fraction)
1A1 Energy industries
EMEPEEA air pollutant emission inventory guidebook 2019 51
Table 4-8 Tier 2 emission factors for source category 1A1b diesel engines using gas oil
Tier 2 emission factors
Code Name
NFR Source Category 1A1b Petroleum refining
Fuel Gas Oil
SNAP (if applicable) 010305 Petroleum refining - Stationary engines
TechnologiesPractices Reciprocating Engines (compression injection)
Region or regional
conditions
NA
Abatement technologies NA
Not applicable
Not estimated NH3 PCDDF PCBs HCB
Pollutant Value Unit 95 confidence
interval
Reference
Lower Upper
NOx 942 gGJ 500 1380 Nielsen et al 2010
CO 130 gGJ 30 230 Nielsen et al 2010
NMVOC 371 gGJ 185 556 US EPA (1996) chapter 34
SOx 461 gGJ 461 461 See Note
TSP 281 gGJ 141 562 US EPA (1996) chapter 34
PM10 224 gGJ 112 448 US EPA (1996) chapter 34
PM25 217 gGJ 108 434 US EPA (1996) chapter 34
BC 78 of PM25 63 93 Hernandez et al 2004
Pb 407 mgGJ 041 407 US EPA (1998) chapter 13
Cd 136 mgGJ 014 136 US EPA (1998) chapter 13
Hg 136 mgGJ 014 136 US EPA (1998) chapter 13
As 181 mgGJ 018 181 US EPA (1998) chapter 13
Cr 136 mgGJ 014 136 US EPA (1998) chapter 13
Cu 272 mgGJ 027 271 US EPA (1998) chapter 13
Ni 136 mgGJ 014 136 US EPA (1998) chapter 13
Se 679 mgGJ 068 679 US EPA (1998) chapter 13
Zn 181 mgGJ 018 181 US EPA (1998) chapter 13
PCDDF 099 ng I-
TEQGJ
01 10 Nielsen et al 2010
HCB 022 microgGJ 0022 22 Nielsen et al 2010
PCBs 013 ng I-
TEQGJ
0013 13 Nielsen et al 2010
Benzo(a)pyrene 011 mgGJ 004 033 API 1998
Benzo(b)fluoranthene 049 mgGJ 016 147 API 1998
Benzo(k)fluoranthene 0096 mgGJ 0032 0288 API 1998
Indeno(123-cd)pyrene 018 mgGJ 006 054 API 1998
Notes
The factor for SOx assumes no SO2 abatement and is based on 01 mass sulphur content using EF calculation
from subsection 3422 of the present chapter
Emission factors for metals are based on factors for oil combustion in boilers
These PM factors represent filterable PM emissions only (excluding any condensable fraction)
4433 Activity data
Information on the refinery production suitable for estimating emissions using the simpler
estimation methodology (Tier 1 and 2) may be available from national statistics agencies or the
International Energy Agency (IEA)
1A1 Energy industries
EMEPEEA air pollutant emission inventory guidebook 2019 52
Further guidance is provided in the 2006 IPCC Guidelines for National Greenhouse Gas Inventories
volume 2 on Stationary Combustion
wwwipcc-nggipigesorjppublic2006glpdf2_Volume2V2_2_Ch2_Stationary_Combustionpdf
For a Tier 2 approach these data need to be stratified according to technologies applied Typical
sources for this data might be industrial or regulatory organisations within the country or from
specific questionnaires to the individual refineries
444 Tier 3 use of facility-specific data
4441 Algorithm
Where facility-level emission data of sufficient quality (see Chapter 3 Data collection in part A) are
available it is good practice to use these data There are two possibilities
the facility reports cover all refinery processes in the country
facility-level emission reports are not available for all the refinery processes
If facility-level data are available covering all activities in the country the implied emission factors
(reported emissions divided by the national fuel use) should be compared with the default emission
factor values or technology-specific emission factors If the implied emission factors are outside the
95 confidence intervals for the values given it is good practice to explain the reasons for this in
the inventory report
Depending on the specific national circumstances and the coverage of the facility-level reports as
compared to the total combustion activity the emission factor (EF) in this equation should be chosen
from the following possibilities in decreasing order of preference
technology-specific emission factors based on knowledge of the types of technologies
implemented at the facilities where facility-level emission reports are not available
the implied emission factor derived from the available emission reports
Facilities
Facility
Facilities
pollutantFacility
Production
E
EF
(7)
the default Tier 1 emission factor This option should only be chosen if the facility-level emission
reports cover more than 90 of the total national production
4442 Tier 3 emission modelling and use of facility data
Refinery installations are major facilities and emission data for individual plants could be available
through a pollutant release and transfer registry (PRTR) or another national emission reporting
scheme but possibly not for all pollutants When the quality of such data is assured by a well
developed QAQC system it is good practice to use such data Guidance on estimating refinery
emissions has been published by the industry sector [Concawe 2015] If extrapolation is needed to
cover all activity in the country either the implied emission factors for the facilities that did report
or the emission factors as provided above could be used (see subsection 3432 of the present
chapter)
1A1 Energy industries
EMEPEEA air pollutant emission inventory guidebook 2019 53
4443 Activity data
Since PRTR generally do not report activity data such data in relation to the reported facility-level
emissions are sometimes difficult to find A possible source of facility-level activity might be the
registries of emission trading systems
In many countries national statistics offices collect production data on facility level but these are in
many cases confidential However in several countries national statistics offices are part of the
national emission inventory systems and the extrapolation if needed could be performed at the
statistics office ensuring that confidentiality of production data is maintained
1A1 Energy industries
EMEPEEA air pollutant emission inventory guidebook 2019 54
5 1A1c Manufacture of solid fuels
and other energy industries
51 Techniques
Coke manufacture is mainly associated with iron and steel manufacture and details of technologies
used in this activity can be found within the Best Available Techniques Reference Note (BREF) for
Iron and Steel production [EIPPCB 2013] and within the USEPA guidance
Coke manufacture is a batch process with production occurring in a coke oven which is a battery of
ovens Coal is heated in a non-oxidising atmosphere (pyrolysis) The volatile components are driven
off to leave coke which is then pushed at high temperature from the oven into a rail car and taken
to a quench tower to stop oxidation in air Heating is provided by combustion of a portion of the
evolved gases following treatment to remove ammonia hydrogen sulphide tars and condensable
organic material Coke manufacture with by-product recovery includes process units to recover
condensed organic material and other by-products By-products are burnt in coke ovens which do
not have by-product recovery
52 Emissions
Note that the inventory methodologies for Greenhouse gas emissions (carbon dioxide methame
and nitrous oxide) are not included ndash refer to IPCC guidance [IPCC 2006]
52111 Sulphur oxides
Emissions arise from combustion of coke oven gas (COG) Gas is treated to removed H2S but residual
H2S is oxidised to form SO2
52112 Nitrogen oxides
Emissions of nitrogen oxides (nitric oxide and nitrogen dioxide mdash NOx) arise primarily from
combustion of COG
52113 Non-methane volatile organic compounds (NMVOC)
Emissions of non-methane volatile organic compounds (NMVOC) can result from combustion
activities and process discharges such as vents and blowdown systems However many emission
sources tend to be fugitive releases
52114 Carbon monoxide (CO)
Emissions arise from combustion activities and fugitive release of COG
52115 Particulate matter
Particulate matter (PM) emissions arise from combustion activities on the coke oven and materials
handling
53 Controls
Details- of relevant abatement technologies are described in the BREF note for iron and steel
production (httpeippcbjrceceuropaeureference) Control of SO2 emission is by removal of H2S
and other sulphurous material from the fuel gas
1A1 Energy industries
EMEPEEA air pollutant emission inventory guidebook 2019 55
54 Methods
541 Choice of method
Figure 5-1 presents the procedure to select the methods for estimating process emissions from
combustion in energy and transformation industries The basic idea is
if detailed information is available use it
if the source category is a key source a Tier 2 or better method must be applied and detailed
input data must be collected The decision tree directs the user in such cases to the Tier 2
method since it is expected that it is more easy to obtain the necessary input data for this
approach than to collect facility-level data needed for a Tier 3 estimate
the alternative of applying a Tier 3 method using detailed process modelling is not explicitly
included in this decision tree However detailed modelling will always be done at facility level
and results of such modelling could be seen as lsquoFacility datarsquo in the decision tree
Figure 5-1 Decision tree for combustion in manufacture of solid fuels
Start
Are all single
sources in the source
category Measured
reported
Use Tier 3
Facility data
only
Is a detailed
estimation model
available
Use Tier 2
technology specific
activity data
and EFs
Key source
Get
technology stratified
activity data
and EFs
Apply Tier 1
default EFs
Yes
Yes
Yes
Yes
No
No
Is specific fuel
use data available
for the source
Use measurements Tier
3 approach and
combine with country
specific EFs from Tier 2
Can modelled fuel
consumption be reconciled
with national fuel statistics
from independent
sources
Use model Tier 3
approach
No
No
No
Yes
1A1 Energy industries
EMEPEEA air pollutant emission inventory guidebook 2019 56
542 Tier 1 default approach
5421 Algorithm
The Tier 1 approach for process emissions from combustion uses the general equation
pollutantptionfuelconsumpollutant EFARE (1)
where
Epollutant = annual emission of pollutant
EFpollutant = emission factor of pollutant
ARfuel consumption = activity rate by coal consumption coke or iron production
This equation is applied at the national level using annual national coal use (disaggregated by
industrial sector) Information on fuel consumption suitable for estimating emissions using the
simpler estimation methodology is widely available from UN statistical yearbooks or national
statistics
The Tier 1 emission factors assume an average or typical technology and abatement
implementation
In cases where specific abatement techniques are to be taken into account a Tier 1 method is not
applicable and a Tier 2 or Tier 3 approach must be used
5422 Default emission factors
The Tier 1 default emission factors for process and combustion emissions are given in
1A1 Energy industries
EMEPEEA air pollutant emission inventory guidebook 2019 57
Table 5-1 and have been derived from emission factors provided in USEPA guidance The factors are
based on coal use expressed in terms of net energy content The factors include combustion and
process emissions from coke batteries including combustion stacks and preheater Emissions from
soaking decarbonisation charging door and lid leaks off-take leaks quenching and pushing are
included in Chapter 1B1b Fugitive emissions from solid fuels solid fuel transformation In the
absence of detail on relative use of coke oven types or abatement technology which will be different
for each country the proposed factors represent a mean for the range of technologies in use with
the 95 figures a measure of the range of emissions in the sector
1A1 Energy industries
EMEPEEA air pollutant emission inventory guidebook 2019 58
Table 5-1 Tier 1 emission factors for source category 1A1c
Tier 1 default emission factors
Code Name
NFR Source Category 1A1c Manufacture of solid fuels and other energy industries
Fuel Coal
Not applicable PCBs HCB
Not estimated NH3BC
Pollutant Value Unit 95 confidence
interval
Reference
Lower Upper
NOx 21 gGJ 115 42 See note
CO 6 gGJ 3 12 See note
NMVOC 08 gGJ 008 81 See note
SOx 91 gGJ 60 120 See note
TSP 82 gGJ 40 160 See note
PM10 79 gGJ 40 160 See note
PM25 55 gGJ 28 110 See note
Pb 28 mgGJ 592 145 See note
Cd 16 mgGJ 032 9 See note
Hg 30 mgGJ 6 150 See note
As 11 mgGJ 22 55 See note
Cr 57 mgGJ 118 295 See note
Cu 25 mgGJ 5 125 See note
Ni 52 mgGJ 11 26 See note
Se 29 mgGJ 06 15 See note
Zn 46 mgGJ 94 235 See note
PCDDF 26 ng I-
TEQGJ
52 130 See note
Benzo(a)pyrene 029 mgGJ 0066 165 See note
Benzo(b)fluoranthene 0003 mgGJ 00006 0015 See note
Benzo(k)fluoranthene 0001 mgGJ 00002 0005 See note
Indeno(123-cd)pyrene 0001 mgGJ 00002 0005 See note
Note
The tier 1 emission factors are calculated as an average of the tier 2 emission factors The tier 2 emission factors
have been converted using a NCV of 282 GJMg
The basis of the TSP PM10 and PM25 emission factors could not be determined in the reference
5423 Tier 1 Activity Data
Information on the use of energy suitable for estimating emissions using the Tier 1 simpler
estimation methodology is available from national statistics agencies or the International Energy
Agency (IEA)
Further guidance is provided in the 2006 IPCC Guidelines for National Greenhouse Gas Inventories
volume 2 on Stationary Combustion
wwwipcc-nggipigesorjppublic2006glpdf2_Volume2V2_2_Ch2_Stationary_Combustionpdf
The activity rate and the emission factor have to be determined on the same level of aggregation
depending on the availability of data The activity statistic should be determined within the
considered country or region by using adequate statistics The activity should refer to the energy
input of the emission sources considered (net or inferior fuel consumption in [GJ])
1A1 Energy industries
EMEPEEA air pollutant emission inventory guidebook 2019 59
543 Tier 2 approach
For a Tier 2 approach the emission factors are presented in terms of coal use with two technologies
Note that emission factors can be converted to gMg coke produced by applying a conversion of
1 285 kg coalMg coke (from the Iron and Steel BREF range of 1220ndash1 350 kg coalMg coke)
The factors represent combustion and process emissions from coke batteries including combustion
stacks and preheater Emissions from soaking decarbonisation charging door and lid leaks off-
take leaks quenching and pushing are included in Chapter 1B1b Fugitive emissions from solid
fuels solid fuel transformation
Table 5-2 Tier 2 default emission factors for source category 1A1c coke manufacture with
by-product recovery
Tier 2 emission factors
Code Name
NFR Source Category 1A1c Manufacture of solid fuels and other energy industries
Fuel Coal
SNAP (if applicable) 0104 Solid fuel transformation plants
TechnologiesPractices Coke oven (byproduct recovery)
Region or regional
conditions
NA
Abatement technologies NA
Not applicable PCB Hg
Not estimated NH3 Hg
Pollutant Value Unit 95 confidence
interval
Reference
Lower Upper
NOx 820 gMg Coal 530 1200 US EPA (2008) chapter 122
CO 340 gMg Coal 170 680 US EPA (2008) chapter 122
NMVOC 47 gMg Coal 24 94 US EPA (2008) chapter 122
SOx 420 gMg Coal 210 840 US EPA (2008) chapter 122
TSP 1914 gMg Coal 955 3830 US EPA (2008) chapter 122
PM10 1864 gMg Coal 932 3728 US EPA (2008) chapter 122
PM25 1176 gMg Coal 588 2352 US EPA (2008) chapter 122
BC 48 of PM25 5 95 Bond et al (2004)
Pb 22 mgMg Coal 11 44 US EPA (2008) chapter 122
Cd 01 mgMg Coal 005 02 US EPA (2008) chapter 122
As 16 mgMg Coal 08 32 US EPA (2008) chapter 122
Cr 36 mgMg Coal 18 72 US EPA (2008) chapter 122
Cu 17 mgMg Coal 085 34 US EPA (2008) chapter 122
Ni 09 mgMg Coal 045 18 US EPA (2008) chapter 122
Se 18 mgMg Coal 09 36 US EPA (2008) chapter 122
Zn 76 mgMg Coal 38 152 US EPA (2008) chapter 122
PCDDF 738 ng I-TEQMg
Coal
234 2335 UNEP (2005)
Benzo(a)pyrene 82 mgMg Coal 164 41 US EPA (2008) chapter 122
Benzo(b)fluoranthene 01 mgMg Coal 002 05 US EPA (2008) chapter 122
Benzo(k)fluoranthene 003 mgMg Coal 0006 015 US EPA (2008) chapter 122
Indeno(123-cd)pyrene 002 mgMg Coal 0004 01 US EPA (2008) chapter 122
NoteThe basis of the TSP PM10 and PM25 emission factors could not be determined in the reference (emission
factors for filterable and condensable PM are provided for a number of process activities but it is unclear which
have been incorporated in the Tier 2 emission factors)
1A1 Energy industries
EMEPEEA air pollutant emission inventory guidebook 2019 60
Table 5-3 Tier 2 default emission factors for source category 1A1c coke manufacture
without by-product recovery
Tier 2 emission factors
Code Name
NFR Source Category 1A1c Manufacture of solid fuels and other energy industries
Fuel Coal
SNAP (if applicable) 0104 Solid fuel transformation plants
TechnologiesPractices Coke oven (without byproduct recovery)
Region or regional
conditions
NA
Abatement technologies NA
Not applicable PCBs HCB
Not estimated NMVOC NH3 Benzo(b)fluoranthene Benzo(k)fluoranthene Indeno(123-
cd)pyrene
Pollutant Value Unit 95 confidence
interval
Reference
Lower Upper
NOx 360 gMg Coal 250 590 US EPA (2008) chapter 122
CO 25 gMg Coal 125 50 US EPA (2008) chapter 122
SOx 4700 gMg Coal 2350 9200 US EPA (2008) chapter 122
TSP 2700 gMg Coal 1350 5400 US EPA (2008) chapter 122
PM10 2618 gMg Coal 1309 5236 US EPA (2008) chapter 122
PM25 1913 gMg Coal 957 3826 US EPA (2008) chapter 122
BC 48 of PM25 5 95 Bond et al (2004)
Pb 1600 mgMg Coal 800 3200 US EPA (2008) chapter 122
Cd 90 mgMg Coal 45 180 US EPA (2008) chapter 122
Hg 1700 mgMg Coal 850 3400 US EPA (2008) chapter 122
As 630 mgMg Coal 315 1260 US EPA (2008) chapter 122
Cr 320 mgMg Coal 160 640 US EPA (2008) chapter 122
Cu 1400 mgMg Coal 700 2800 US EPA (2008) chapter 122
Ni 290 mgMg Coal 145 580 US EPA (2008) chapter 122
Se 160 mgMg Coal 80 320 US EPA (2008) chapter 122
Zn 2600 mgMg Coal 1300 5200 US EPA (2008) chapter 122
PCDDF 738 ng I-TEQMg
Coal
234 2335 UNEP (2005)
Benzo(a)pyrene 05 mgMg Coal 01 25 US EPA (2008) chapter 122
Note
The basis of the TSP PM10 and PM25 emission factors could not be determined in the reference (emission factors
for filterable and condensable PM are provided for a number of process activities but it is unclear which have
been incorporated in the Tier 2 emission factors)
544 Tier 3 use of facility-specific data
5441 Algorithm
Where facility-level emission data of sufficient quality (see Chapter 3 Data collection in part A) are
available it is good practice to use these data There are two possibilities
the facility reports cover all relevant combustion processes in the country
facility-level emission reports are not available for all relevant combustion processes in the
country
If facility-level data are available covering all activities in the country the implied emission factors
(reported emissions divided by the national fuel use) should be compared with the default emission
1A1 Energy industries
EMEPEEA air pollutant emission inventory guidebook 2019 61
factor values or technology-specific emission factors If the implied emission factors are outside the
95 confidence intervals for the values given it is good practice to explain the reasons for this in
the inventory report
Depending on the specific national circumstances and the coverage of the facility-level reports as
compared to the total combustion activity the emission factor (EF) in this equation should be chosen
from the following possibilities in decreasing order of preference
technology-specific emission factors based on knowledge of the types of technologies
implemented at the facilities where facility-level emission reports are not available
the implied emission factor derived from the available emission reports
Facilities
Facility
Facilities
pollutantFacility
Production
E
EF
(7)
the default Tier 1 emission factor This option should only be chosen if the facility-level emission
reports cover more than 90 of the total national production
5442 Tier 3 Use of facility data
Many coke ovens are (or are part of) major facilities and emission data for individual plants might
be available through a pollutant release and transfer registry (PRTR) or another national emission
reporting scheme When the quality of such data is assured by a well developed QAQC system and
the emission reports have been verified by an independent auditing scheme it is good practice to
use such data If extrapolation is needed to cover all activity in the country either the implied
emission factors for the facilities that did report or the emission factors as provided above could be
used (see subsection 3432 of the present chapter)
5443 Activity data
Since PRTR generally do not report activity data such data in relation to the reported facility-level
emissions are sometimes difficult to find A possible source of facility-level activity might be the
registries of emission trading systems
In many countries national statistics offices collect production data on facility level but these are in
many cases confidential However in several countries national statistics offices are part of the
national emission inventory systems and the extrapolation if needed could be performed at the
statistics office ensuring that confidentiality of production data is maintained
1A1 Energy industries
EMEPEEA air pollutant emission inventory guidebook 2019 62
6 Data quality
61 Completeness
No specific issues but the separation of combustion emissions from other emissions associated with
the activities may potentially lead to exclusion of emissions
62 Avoiding double counting with other sectors
In cases where it is possible to split the emissions it is good practice to do so However care must
be taken that the emissions are not double counted (for example between combustion and process
emissions)
63 Verification
631 Best Available Technique (BAT) emission factors
Table 6-1 BAT-based emission factors for source category 1A1a
Pollutant
Fuel
type
[1]
New or
existing
plant [2]
Boiler size
or
technology
Reference
O2
content
AEL concentration range
mgm-3 at STP (0ordmC 1013
kPa) dry at reference O2
content
Emission factor
gGJ-1
(net thermal
input)
MWth vv dry Low High Low High
TSP coal new 50-100 6 5 20 18 72
coal new 100-300 6 5 20 18 72
coal new gt 300 6 5 20 18 72
coal existing 50-100 6 5 30 18 109
coal existing 100-300 6 5 30 18 109
coal existing gt 300 6 5 30 18 109
wood new 50-100 6 5 20 19 77
wood new 100-300 6 5 20 19 77
wood new gt 300 6 5 20 19 77
wood existing 50-100 6 5 20 19 77
wood existing 100-300 6 5 20 19 77
wood existing gt 300 6 5 20 19 77
oil new 50-100 3 5 20 14 57
oil new 100-300 3 5 20 14 57
oil new gt 300 3 5 10 14 28
oil existing 50-100 3 5 30 14 85
oil existing 100-300 3 5 25 14 71
oil existing gt 300 3 5 20 14 57
gas new GT 15 5 43
gas existing GT 15 5 43
NOx coal new 50-100 6 90 300 326 1087
coal new 100-300 6 90 200 326 725
coal new gt 300 6 50 150 181 543
coal existing 50-100 6 90 300 326 1087
coal existing 100-300 6 90 200 326 725
coal existing gt 300 6 50 200 181 725
wood new 50-100 6 150 250 579 964
wood new 100-300 6 150 200 579 771
wood new gt 300 6 50 150 193 579
1A1 Energy industries
EMEPEEA air pollutant emission inventory guidebook 2019 63
Pollutant
Fuel
type
[1]
New or
existing
plant [2]
Boiler size
or
technology
Reference
O2
content
AEL concentration range
mgm-3 at STP (0ordmC 1013
kPa) dry at reference O2
content
Emission factor
gGJ-1
(net thermal
input)
MWth vv dry Low High Low High
wood existing 50-100 6 150 300 579 1157
wood existing 100-300 6 150 250 579 964
wood existing gt 300 6 50 200 193 771
oil new 50-100 3 150 300 424 849
oil new 100-300 3 50 150 141 424
oil new gt 300 3 50 100 141 283
oil existing 50-100 3 150 450 424 1273
oil existing 100-300 3 50 200 141 566
oil existing gt 300 3 50 150 141 424
gas new gt 50 3 50 100 142 283
gas existing gt 50 3 50 100 142 283
gas new GT 15 20 50 172 430
gas existing GT 15 20 90 172 773
gas new Gas engine 15 20 75 172 644
gas existing Gas engine 15 20 100 172 859
SO2 coal new 50-100 6 150 400 543 1449
coal new 100-300 6 100 200 362 725
coal new gt 300 6 20 200 72 725
coal existing 50-100 6 150 400 543 1449
coal existing 100-300 6 100 250 362 906
coal existing gt 300 6 20 200 72 725
wood new 50-100 6 200 300 771 1157
wood new 100-300 6 150 300 579 1157
wood new gt 300 6 50 200 193 771
wood existing 50-100 6 200 300 771 1157
wood existing 100-300 6 150 300 579 1157
wood existing gt 300 6 50 200 193 771
oil new 50-100 3 100 350 283 990
oil new 100-300 3 100 200 283 566
oil new gt 300 3 50 150 141 424
oil existing 50-100 3 100 350 283 990
oil existing 100-300 3 100 250 283 707
oil existing gt 300 3 50 200 141 566
gas new GT 15 10 86
gas existing GT 15 10 86
Notes
BAT-AELs are based on measurement of filterable PM
Fuel is main classification only limits may be for lsquosolid fuelsrsquo rather than coal or wood Limits for gaseous fuels
are for natural gas and may not be applicable to derived fuels
New and existing plants are as defined in IED (2010)
The refinery BREF provides somewhat wide-ranging views on BAT for refinery emissions Table 6-2
provides a summary of the information presented Note that in the absence of detail about fuel gas
composition the emission factors were derived from the emission concentrations assuming natural
gas BAT emissions for energy processes are not presented
1A1 Energy industries
EMEPEEA air pollutant emission inventory guidebook 2019 64
Table 6-2 BAT-based emission factors for refinery processes
Process
unit
Pollutant Average
period
Reference
O2
content
AEL concentration
range mgm-3 at STP
(0ordmC 1013 kPa) dry at
reference O2 content
Emission factor
gGJ-1
(net thermal
input)
vv dry Low High Low High
Whole
Refinery
SO2
daily 3 60 850 17 241
monthly 3 100 1200 28 340
yearly 3 1000 1400 283 396
NOx
daily 3 70 200 20 57
monthly 3 100 450 28 127
yearly 3 200 500 57 142
Cat cracker
CO boiler CO - 3 50 100 14 28
NOx - 3 100 500 28 142
No CO
boiler CO
- 3 50 100 14 28
(O2 control) NOx - 3 300 600 85 170
SCRSNCR NOx - 3 40 150 11 43
TSP - 3 10 50 3 14
FGDlow S SO2 - 3 10 350 3 99
The BAT document for coke ovens indicates that use of desulphurised coke oven gas and low-NOx
techniques represent BAT in new or modern plant Post-desulphurisation H2S levels of 500ndash
1 000 mgm-3 of fuel are indicated However further information is needed to calculate an emission
factor an estimated SO2 factor range of 60ndash120 gGJ-1 has been calculated assuming a calorific value
of 162 MJm-3[DUKES 2007]
Estimated BAT emission factors (assuming natural gas as the fuel) for NOx are 140ndash220 gGJ-1
632 Fuel sulphur content
For processes without SO2 abatement the sulphur content of the fuel provides a means to calculate
the SO2 emission factor
EFSO2 = [S] x 20000
CV
where
EFSO2 is the SO2 emission factor gGJ-1
[S] is the percent sulphur (ww)
CV is the netinferior calorific value GJtonne-1
2 is the ratio of the RMM of SO2 to sulphur
This equation can be extended to include a factor for retention of SO2 in ash
Liquid fuels in the EC are subject to sulphur limits (EC SCOLF 19992005) as summarised in Table
6-3 The SO2 emission factors in Table 6-3 have been calculated assuming 100 conversion of fuel
sulphur and applying UK net calorific values for fuel oils (DUKES 2007)
1A1 Energy industries
EMEPEEA air pollutant emission inventory guidebook 2019 65
Table 6-3 Sulphur emission factors from oil sulphur limits
Fuel oil Implementation
date
Maximum
sulphur content
SO2 emission
factor gGJ-1
Comment
Heavy fuel oil 112003 1 485 Assumes net CV of
412 GJtonne-1
Gas oil Pre 112008 02 92 Assumes net CV of
Post 112008 01 46 434 GJtonne-1
633 Other emission factors
The Industrial Emissions Directive Gothenburg protocol USEPA emission factor handbook and
sector-specific emission factor guidance (Eurelectric and Concawe) provide additional means of
assessing the validity of the default emission factors and factors from other sources to a national
inventory
Examples of emission factors derived from ELVs in the LCPD and Gothenburg protocol are provided
in Appendix D The USEPA emission factors can be found at wwwepagovttnchiefap42
634 Derivation of emission factors from emission concentrations for combustion processes
A methodology to develop emission factors from emission concentrations (for example
measurement reports and emission limit values) is provided in Appendix E
64 Developing a consistent time series and recalculation
The emissions of non-CO2 emissions from fuel combustion change with time as facilities are
upgraded or replaced by less-polluting energy technology The mix of technology used with each
fuel will change with time and this has implications for the choice of emission factor This is probably
most relevant to the aggregated factors used in Tier 1 and Tier 2 Over time the Tier 1 emissions
estimates become less relevant
For Tier 3 using facility level data it might occur that a different selection of facility level data is
included in different years This can lead to time series inconsistencies Moreover PRTR data are
generally available for specific years only Splicing such recent reported data under the European
Pollutant Release and Transfer Registry (EPRTR) European Pollutant Emission Register (EPER) with
historical data could be used to get consistent time series Splicing could be used for both the activity
data and the country-specific emission factors
Unexpected discontinuities in time series can occur when specific facilities come into operation or
are closed in specific years If this happens it is good practice to clearly document such explanations
in the inventory archives
65 Uncertainty assessment
651 Emission factor uncertainties
The uncertainty is partly the result of how emission factors are developed and applied The
expanded statistical uncertainty is made up of between plants variance within plant (operating)
variance and uncertainties associated with the measurement methodology used and the
aggregation of data
1A1 Energy industries
EMEPEEA air pollutant emission inventory guidebook 2019 66
Process measurements from which emission factors are developed at individual facility level are
subject to both systematic and random errors in the determination of mass concentration mass
emission size distribution and analytical errors etc
In addition bias may exist in emission factors arising from assumptions made about the abatement
used on lsquotypicalrsquo industrial installations For example emission factors lsquoagersquo the factors widely used
in the Guidebook and hence by many countries as default emission factors in their national
inventories become out of date Recent measurement work suggests that they may overestimate
emissions from the industrial processes subject to more modern industrial emissions regulation
They may however still be fully representative for older plant small plant or for poorer fuels
652 Activity data uncertainties
The uncertainty in national fuel and production statistics can be difficult to establish however
reporting procedures have generally been in place for many years Recent developments in emission
trading provide a lsquobottom-uprsquo and verified alternative to national statistics in some sectors
The uncertainty for disaggregated sector-specific activity data can be high as such data may be
collected infrequently or rely on assumptions which may vary substantially with time
The inventory compiler needs to understand how sector-specific activity data have been derived
66 Inventory quality assurancequality control QAQC
Emissions from fuel combustion are largely associated with electricity production It is good practice
to check whether the electricity production data are consistent with the reported fuel use
67 Mapping
The facilities within 1A1 should be considered as point sources if plant-specific data are available
Otherwise national emissions should be disaggregated on the basis of plant capacity employment
or population statistics
68 Reporting and documentation
No specific issues
1A1 Energy industries
EMEPEEA air pollutant emission inventory guidebook 2019 67
7 Glossary
Term Definition
Boiler any technical apparatus in which fuels are oxidised in order to
generate steam
Process heater or furnace any technical apparatus in which fuels are oxidised in order to
generate heat for a process activity
Coking coal (Nomenclature for Air
Pollution of Fuels (NAPFUE) 101)
subcategory of hard coal with a quality that allows the
production of a coke suitable for supporting a blast furnace
charge (Meijer 1995)
Co-generation plant Simultaneous production of electricity and steam (or process
heating)
Combined cycle gas turbine (CCGT) gas turbine combined with a steam turbine The boiler can also
be fuelled separately
Hard coal refers to coal of a gross caloric value greater than 23 865 kJkg
on an ash-free but moist basis and with a mean random
reflectance (2) of vitrinite of at least 06 Hard coal comprises
the subcategories coking coal and steam coal (3) [Meijer 1995]
Integrated coal gasification
combined cycle gas turbine (IGCC)
gas turbine fuelled by gas which is a product of a coal
gasification process
Lignite (NAPFUE 105) non-agglomerating coals with a gross caloric value less than
17 435 kJkg and containing more than 31 volatile matter on
a dry mineral matter free basis
Power plant installation or facility for electricity generation
Stationary engines spark-ignition or compression-ignition engines (2- and 4-
stroke)
Steam coal (NAPFUE 102) subcategory of hard coal used for steam raising and space
heating purposes Steam coal includes all anthracite and
bituminous coals not included under coking coal (Meijer 1995)
Sub-bituminous coal
(NAPFUE 103)
non-agglomerating coals with a gross caloric value between
17 435 and 23 865 kJkg containing more than 31 volatile
matter on a dry mineral free matter basis (Meijer 1995)
(2) Mean random reflectance characteristic value which stands for a defined coal composition (modular
component is eg vitrinite)
(3) The following coal classification codes cover those coals which would fall into these subcategories (Meijer
1995)
International classification codes
(UN Geneva 1995)
323 333 334 423 433 435 523 533 534 535 623 633
634 635 723 733 823
USA classification Class II group 2 lsquomedium volatile bituminousrsquo
British classification Class 202 203 204 301 302 400 500 600
Polish classification Class 33 34 351 352 36 37
Australian classification Class 4A 4B 5
1A1 Energy industries
EMEPEEA air pollutant emission inventory guidebook 2019 68
8 References
API Air toxics emission factors for combustion sources using petroleum based fuels Volume 1
Development of emission factors using APIWSPA approach No 348 Washington DC American
Petroleum Institute 181998
API Comparison of API and EPA toxic air pollutant emission factors for combustion sources No 4720
Washington DC American Petroleum Institute 192002
Bailey RE 2001 Global hexachlorobenzene emissions Chemosphere Volume 43 Issue 2 April
2001 Pages 167ndash182
Bond TC Streets DG Yarber KF Nelson SM Woo J-H amp Klimont Z 2004 A Technology-based
10 Global Inventory of Black and Organic Carbon Emissions from Combustion Journal of Geophysical
Research 11 109 D14203 doi1010292003JD003697
Bond TC Wehner B Plewka A Wiedensohler A Heintzenberg J amp Charlson RJ 2006 Climate-
relevant properties of primary particulate emissions from oil and natural gas combustion
Atmospheric Environment 40 (2006) 3574ndash3587
BUWAL 2001 Massnahmen zur Reduktion der PM10-Emissionen Umwelt-Materialen Nr 136 Luft
Bundesamt fuumlr Umwelt Wald und Landschaft (BUWAL) Bern (in German)
Chow JC Watson JG Kuhns HD Etyemezian V Lowenthal DH Crow DJ Kohl SD
Engelbrecht JP amp Green MC 2004 Source profiles for industrial mobile and area sources in the
Big Bend Regional Aerosol Visibility and Observational (BRAVO) Study Chemosphere 54 (2) 185-
208
CITEPA CORINAIR Inventory-Default Emission Factors Handbook (second edition) CEC-DG XI (ed)
1992
Concawe 2015 Air pollutant emission estimation methods for E-PRTR reporting by refineries 2015
edition CONCAWE Report 0315 2015 available at
httpswwwconcaweeuuploadsModulesPublicationsrpt_15-3pdf
Concawe 2016 Emission factors for metals from combustion of refinery fuel gas and residual fuel
oil CONCAWE Report No 0916 2016 available at httpswwwconcaweeupublicationemission-
factors-for-metals-from-combustion-of-refinery-fuel-gas-and-residual-fuel-oil
CORINAIR 1990 CORINAIR 90 Emission Inventory (Proposals) mdash working paper for the 19ndash20
September 1991 meeting mdash Annex 4 Definition of Large Point Sources
Dayton DP amp Bursey JT 2001 Source sampling fine particulate matter Wood-fired industrial
boiler Report No EPA-600R-01-106 US Environmental Protection Agency Research Triangle Park
NC
Diehl T Heil A Chin M Pan X Streets D Schultz M and Kinne S 2012 Anthropogenic
biomass burning and volcanic emissions of black carbon organic carbon and SO2 from 1980 to
2010 for hindcast model experiments Atmos Chem Phys Discuss 12 24895-24954
DUKES 2007 Digest of UK Energy Statistics 2007 published by BERR and available here
httpstatsberrgovukenergystatsdukesa_1-a_3xls
1A1 Energy industries
EMEPEEA air pollutant emission inventory guidebook 2019 69
EC SCOLF 19992005 Sulphur Content of Liquid Fuels Directive and 2005 Marine oil amendment
EC-IED 2010 Directive 201075EU on industrial emissions (integrated pollution prevention and
control)
EC-LCPD 2001 Directive 200180EC of the European Parliament and of the Council of
23 October 2001 on the limitation of emissions of certain pollutants into the air from large
combustion plants
EIPPCB 2013 BAT Reference Document for Iron and Steel Production EC-IED 201075EU European
IPPC Bureau available at httpeippcbjrceceuropaeureference
EIPPCB 2015 Best Available Techniques (BAT) Reference Document for the Refining of Mineral Oil
and Gas European Commission Joint Research Centre Institute for Prospective Technological
Studies European IPPC Bureau 2015 available at httpeippcbjrceceuropaeureference
EIPPCB 2006 IPPC BAT Reference Document for Large Combustion Plant European IPPC Bureau
2006 available at httpeippcbjrceceuropaeureference
Engelbrecht JP Swanepoel L Chow JC Watson JG amp Egami RT 2002 The comparison of
source contributions from residential coal and low-smoke fuels using CMB modeling in South Africa
Environmental Science and Policy 5 (2) 157ndash167
England GC Wien S McGrath T amp Hernandez D 2004 Development of Fine Particulate Emission
Factors and Speciation Profiles for Oil and Gas Fired Combustion Systems Topical Report Test
Results for a Combined Cycle Power Plant with Oxidation Catalyst and SCR at Site Echo Prepared for
the US Department of Energy National Energy Technology Laboratory Pittsburgh PA the Gas
Research Institute Des Plains IL and the American Petroleum Institute Washington DC 2004
Eurelectric 2008 European Wide Sector Specific Calculation Method for Reporting to the European
Pollutant Release and Transfer Register VGB EURELECTRIC RecommendationsVGB European
Working Group lsquoE-PRTRrsquo January 2008 Ref 2008ndash030-0105 (Confidential report)
Fisher GL Chrisp CE amp Hayes TL 1979 Carbonaceous particles in coal fly ash In Proceedings
Carbonaceous Particles in the Atmosphere March 20ndash22 1978 Lawrence Berkeley Laboratory
University of California
Griest WH amp Tomkins BA 1984 Carbonaceous particles in coal combustion stack ash and their
interaction with polycyclic aromatic hydrocarbons Science of the Total Environment 36 209ndash214
Grochowalski A amp Konieczyński J 2008 PCDDsPCDFs dl-PCBs and HCB in the flue gas from coal
fired CFB boilers Chemosphere 73 (2008) 97ndash103
EMEPEEA (2006) EMEPCORINAIR Emission Inventory Guidebook version 4 (2006 edition)
published by the European Environmental Agency Technical report No 112006 available via
httpreportseeaeuropaeuEMEPCORINAIR4enpage002html
Henry WM amp Knapp KT 1980 Compound forms of fossil fuel fly ash emissions Environmental
Science and Technology 14 (4) 450ndash456
Hernandez D Nguyen Q amp England GC 2004 Development of Fine Particulate Emission Factors
and Speciation Profiles for Oil and Gas Fired Combustion Systems Topical Report Test Results for a
Diesel-Fired Compression Ignition Reciprocating Engine with a Diesel Particulate Filter at Site Foxtrot
Prepared for the US Department of Energy National Energy Technology Laboratory Pittsburgh PA
1A1 Energy industries
EMEPEEA air pollutant emission inventory guidebook 2019 70
the Gas Research Institute Des Plains IL and the American Petroleum Institute Washington DC
2004
Hildemann LM Markowski GR amp Cass GR 1991 Chemical Composition of Emissions from Urban
Sources of Fine Organic Aerosol Environmental Science amp Technology 25(4) 744-759
IPCC 2006 UN IPCC Guidelines for national greenhouse gas inventories available at
wwwipcc-nggipigesorjppublic2006glpdf2_Volume2V2_2_Ch2_Stationary_Combustionpdf
Kupiainen K and Klimont Z 2007 Primary emissions of fine carbonaceous particles in Europe
Atmospheric Environment 41 (10) 2156ndash2170
Meijer Jeroen Personal communication IEA (International Energy Agency) Fax of 2441995
Nielsen M Nielsen O-K amp Thomsen M 2010 Emissions from decentralised CHP plants 2007 -
Energinetdk Environmental project no 071882 Project report 5 ndash Emission factors and emission
inventory for decentralised CHP production National Environmental Research Institute Aarhus
University 113 pp ndash NERI Technical report No 786 httpwwwdmudkPubFR786pdf
Nielsen M Nielsen O-K amp Hoffmann L 2012 Improved inventory for heavy metal emissions from
stationary combustion plants ndash 1990-2009 (in prep)
Olmez I Sheffield AE Gordon GE Houck JE Pritchett LC Cooper JA Dzubay TG amp Bennett
RL 1988 Compositions of Particles from Selected Sources in Philadelphia for Receptor Modeling
Applications JAPCA 381392-1402 (1988)
Pulles T van der Gon HD Appelman W amp Verheul M (2012) Emission factors for heavy metals
from diesel and petrol used in European vehicles Atmospheric Environment 61 (2012) 641-651
Rentz et al 1993 Rentz O Holtmann T Oertel D Roumlll C et al Konzeption zur Minderung der VOC-
Emissionen in Baden-Wuumlrttemberg Umweltministerium Baden-Wuumlrttemberg (ed) Heft 21
Karlsruhe (Germany) 1993
Rubenstein G 2003 Gas turbine PM emissions mdash Update Sierra Research June 2003 Paper to
ASMEIGTI Turbo-Expo Atlanta 2003
Stobbelaar G Reduction of Atmospheric Emissions under the terms of the North Sea Action
Programme Report Lucht 102 Ministry of Housing Physical Planning and Environment The
Netherlands 1992
Theloke J Kummer U Nitter S Geftler T and Friedrich R Uumlberarbeitung der Schwermetallkapitel im
CORINAIR Guidebook zur Verbesserung der Emissionsinventare und der Berichterstattung im
Rahmen der Genfer Luftreinhaltekonvention Report for Umweltbundesamt April 2008
TNO Technical Paper to the OSPARCOM-HELCOM-UNECE Emission Inventory (1995) TNO-report
TNO-MEP-R95247
Umweltbundesamt Germany 1980 Umwelt- und Gesundheitskritierien fuumlr Quecksilber UBA-
Berichte 580 Berlin 1980
UNEP 2005 Standardised toolkit for identification and quantification of dioxin and furan releases
Edition 21 UNEP Chemicals Geneva December 2005
USEPA AP-42 (and USEPA various dates) US-EPA (ed) Compilation of Air Pollutant Emission Factors
Stationary Point and Area Sources Fifth Edition available at wwwepagovttnchiefap42
1A1 Energy industries
EMEPEEA air pollutant emission inventory guidebook 2019 71
US-EPA (ed) Criteria Pollutant Emission Factors for the NAPAP Emission Inventory EPA6007-
87015 1987
US EPA 2011 SPECIATE database version 43 US Environmental Protection Agencyrsquos (EPA)
Available at httpcfpubepagovsispeciate
van der Most PFJ Veldt C Emission Factors Manual PARCOM-ATMOS Emission factors for air
pollutants 1992 Final version TNO and Ministry of Housing Physical Planning and the Environment
Air and Energy Directorate Ministry of Transport and Water Management The Netherlands
Reference No 92ndash235 1992
Visschedijk AJH J Pacyna T Pulles P Zandveld and H Denier van der Gon 2004 Cooordinated
European Particulate Matter Emission Inventory Program (CEPMEIP) P Dilara et Al (eds)
Proceedings of the PM emission inventories scientific workshop Lago Maggiore Italy 18 October
2004 EUR 21302 EN JRC pp 163ndash174
Wenborn MJ Coleman PJ Passant NR Lymberidi E Sully J amp Weir RA 1999 Speciated PAH
inventory for the UK AEAT-3512REMC20459131ISSUE 1
Wien S England G amp Chang M 2004a Development of Fine Particulate Emission Factors and
Speciation Profiles for Oil and Gas Fired Combustion Systems Topical Report Test Results for a Dual
Fuel-Fired Commercial Boiler at Site Delta Prepared for the US Department of Energy National
Energy Technology Laboratory Pittsburgh PA the Gas Research Institute Des Plains IL and the
American Petroleum Institute Washington DC 2004
Wien S England G amp Chang M 2004b Development of Fine Particulate Emission Factors and
Speciation Profiles for Oil and Gas Fired Combustion Systems Topical Report Test Results for a
Combined Cycle Power Plant with Supplementary Firing Oxidation Catalyst and SCR at Site Bravo
Prepared for the US Department of Energy National Energy Technology Laboratory Pittsburgh PA
the Gas Research Institute Des Plains IL and the American Petroleum Institute Washington DC
2004
Wien S England G Chang M 2004c Development of Fine Particulate Emission Factors and
Speciation Profiles for Oil and Gas Fired Combustion Systems Topical Report Test Results for a Gas-
Fired Process Heater with Selective Catalytic Reduction (Site Charlie) Prepared for the US
Department of Energy National Energy Technology Laboratory Pittsburgh PA the Gas Research
Institute Des Plains IL and the American Petroleum Institute Washington DC 2004
9 Point of enquiry
Enquiries concerning this chapter should be directed to the relevant leader(s) of the Task Force on
Emission Inventories and Projectionrsquos expert panel on combustion and industry (TFEIP) Please refer
to the TFEIP website (wwwtfeip-secretariatorg) for the contact details of the current expert panel
leaders
1A1 Energy industries
EMEPEEA air pollutant emission inventory guidebook 2019 72
Annex A Summary of combustion
plant and NFR codes
Table A1 Combustion plant and sector codes
Combustion plants as point and area sources
NFR
CODE
SNAP97
Codes
NOSE
CODE
Thermal
capacity
[MWth ]
Public
power and
cogeneratio
n plants
District
heating
Industrial
combustion
and specific
sector
Commercia
l and
institutiona
l
combustio
n
Residential
combustion
Agricultur
e forestry
and
fishing
Gas
turbin
es
Stationary
engines
1A1a 01 01 01 10101 x
1A1a 01 02 01 10101 x
1A1b 01 03 01 10101 x
1A1c 01 04 01 10101 ge 300 x
1A1c 01 05 01 10101 x
1A4a 02 01 01 10101 X
1A2a-f 03 01 01 10101 x
1A1a 01 01 02 10102 x
1A1a 01 02 02 10102 x
1A1b 01 03 02 10102 x
1A1c 01 04 02 10102 ge 50 x
1A1c 01 05 02 10102 and x
1A4a 02 01 02 10102 lt 300 X
1A4bi 02 02 01 10102 x
1A4ci 02 03 01 10102 x
1A2a-f 03 01 02 10102 x
1A1a 01 01 03 10103 x
1A1a 01 02 03 10103 x
1A1b 01 03 03 10103 x
1A1c 01 04 03 10103 x
1A1c 01 05 03 10103 lt 50 x
1A4a 02 01 03 10103 X
1A4bi 02 02 02 10103 x
1A4ci 02 03 02 10103 x
1A2a-f 03 01 03 10103 x
1A1a 01 01 04 10104 x
1A1a 01 02 04 10104 x
1A1b 01 03 04 10104 x
1A1c 01 04 04 10104 not x
1A1c 01 05 04 10104 relevant x
1A4a 02 01 04 10104 x
1A4bi 02 02 03 10104 x
1A4ci 02 03 03 10104 x
1A2a-f 03 01 04 10104 x
1A1a 01 01 05 10105 x
1A1a 01 02 05 10105 x
1A1b 01 03 05 10105 x
1A1 Energy industries
EMEPEEA air pollutant emission inventory guidebook 2019 73
Combustion plants as point and area sources
NFR
CODE
SNAP97
Codes
NOSE
CODE
Thermal
capacity
[MWth ]
Public
power and
cogeneratio
n plants
District
heating
Industrial
combustion
and specific
sector
Commercia
l and
institutiona
l
combustio
n
Residential
combustion
Agricultur
e forestry
and
fishing
Gas
turbin
es
Stationary
engines
1A1c 01 04 05 10105 not x
1A1c 01 05 05 10105 relevant x
1A4a 02 01 05 10105 x
1A4bi 02 02 04 10105 x
1A4ci 02 03 04 10105 x
1A2a-f 03 01 05 10105 x
Note
x = indicates relevant combination
1A1 Energy industries
EMEPEEA air pollutant emission inventory guidebook 2019 74
Annex B Further details on emissions and controls
Additional information taken from the 2006 Guidebook (Chapter B111) which may be relevant when
assessing pollutants and controls Note that the Large Combustion Plant BREF provides a more
recent review of emissions and abatement technologies
Emissions
The emissions are released through the stack Fugitive emissions (from seals etc) can be neglected
for combustion plants
The emissions of sulphur oxides (SOx) are directly related to the sulphur content of the fuel which
for coal normally varies between 03 and 12 wt- (maf) (up to an extreme value of 45 wt-) and
for fuel oil (including heavy fuel oil) from 03 up to 30 wt-
Sulphur appears in coal as pyritic sulphur (FeS2) organic sulphur sulphur salts and elemental
sulphur A major part of the sulphur in coal comes from pyritic and organic sulphur both types are
responsible for SOx formation
For nitric oxide (NO together with NO2 normally expressed as nitrogen oxides NOx) three different
formation mechanisms are relevant
formation of lsquofuel-NOrsquo from the conversion of chemically-bound nitrogen in the fuel (NOfuel)
formation of lsquothermal-NOrsquo from the fixation of atmospheric nitrogen coming from the
combustion air (NOthermal)
formation of lsquoprompt-NOrsquo
In the temperature range considered (up to 1 700 degC) the formation of lsquoprompt-NOrsquo can be neglected
The majority of NOx emissions from coal combustion (80 to more than 90 ) is formed from fuel
nitrogen Depending on combustion temperatures the portion of thermal- NOx formed is lower than
20 The content of nitrogen in solid fuels varies
for hard coal between 02 and 35 wt- (maf)
for lignite between 04 and 25 wt- (maf)
for coke between 06 and 155 wt- (maf)
for peat between 07 and 34 wt- (maf)
for wood between 01 and 03 wt- (maf) and
for waste between 03 and 14 wt- (maf)
The content of nitrogen in liquid fuels varies for heavy fuel oil between 01 and 08 wt- and for
fuel oil between 0005 and 007 wt- Natural gas contains no organically-bound nitrogen The
content of molecular nitrogen in natural gas has no influence on the formation of fuel-NO only
thermal-NO is formed
Emissions of non-methane volatile organic compounds (NMVOC) eg olefins ketones aldehydes
result from incomplete combustion Furthermore unreacted fuel compounds such as methane (CH4)
can be emitted The relevance of NMVOCCH4 emissions from boilers which are often reported
together as VOC is very low for large-sized combustion plants
1A1 Energy industries
EMEPEEA air pollutant emission inventory guidebook 2019 75
VOC emissions tend to decrease as the plant size increases Carbon monoxide (CO) appears always
as an intermediate product of the combustion process and in particular under sub-stoichiometric
combustion conditions
The formation mechanisms of CO thermal-NO and VOC are similarly influenced by combustion
conditions
Emissions of ammonia (NH3) are not caused by a combustion process the emissions result from
incomplete reaction of NH3 additive in the denitrification process (slip of ammonia in SCR and SNCR
units)
Most of the heavy metals considered (As Cd Cr Cu Hg Ni Pb Se Zn and V) are normally released
as compounds (eg oxides chlorides) in association with particulates Only Hg and Se are at least
partly present in the vapour phase Less volatile elements tend to condense onto the surface of
smaller particles in the flue gas stream Therefore enrichment in the finest particle fractions is
observed The content of heavy metals in coal is normally several orders of magnitude higher than
in oil (except occasionally for Ni and V in heavy fuel oil) and in natural gas For natural gas only
emissions of mercury are relevant
During the combustion of coal particles undergo complex changes which lead to vaporisation of
volatile elements The rate of volatilisation of heavy metal compounds depends on fuel
characteristics (eg concentrations in coal fraction of inorganic components such as calcium) and
on technology characteristics (eg type of boiler operation mode)
From DBB all heavy metals of concern are emitted as particulate matter except Hg and Se
Emissions from lignite-fired DBB are potentially lower than from hard coal as the trace element
content in lignite and the combustion temperatures are lower In WBB the recirculation of fly ash is
a common operation mode which creates an important increase in heavy metal concentrations in
the raw gas Heavy metal emissions from FBC units are expected to be lower due to the lower
operating temperatures and a smaller fraction of fine particles The addition of limestone in FBC
facilities might reduce the emission of some heavy metals corresponding to an increased retention
of heavy metals in the bottom ash This effect can be partially compensated by the increase in the
fraction of fine particulates in the flue gas leading to increased emissions from particulates highly
enriched by heavy metals High concentrations of As poison denitrification catalysts Therefore
selected catalytic reduction plants (SCR) in a high-dust configuration may require special measures
(eg reduction of fly ash recirculation)
Controls
Relevant abatement technologies for SO2 NOx and heavy metals are outlined below Abatement
techniques for gas turbines and stationary engines are treated separately Average reduction
efficiencies and availabilities of abatement technologies for SOx and NOx are summarised in
Tables B1ndashB3
Sulphur oxides flue gas desulphurisation (FGD) processes
FGD processes are designed to remove SO2 from the flue gas of combustion installations Most
processes like the wet scrubbing process (WS) the spray dryer absorption (SDA) the dry sorbent
injection (DSI) and the Walther process (WAP) are based on the reaction of the SO2 with an alkaline
agent added as solid or as suspensionsolution of the agent in water to form the respective salts In
secondary reactions SO3 fluorides and chlorides are also removed In the case of the DESONOX
1A1 Energy industries
EMEPEEA air pollutant emission inventory guidebook 2019 76
process the SO2 is catalytically oxidised to SO3 and reacts with water to form sulphuric acid The
activated carbon process and the Wellman-Lord process remove the SO2 to produce a SO2 rich gas
which may be further processed to sulphur or sulphuric acid
The Large Combustion Plant BREF indicates that use of low sulphur fuel or co-firing with gas or other
low sulphur fuels are primary measures for SO2 control Wet limestone scrubbing process (with
gypsum production) is the main FGD process applied to coal and oil-fired boilers but is rarely applied
in plant smaller than 100 MWth Seawater scrubbing and SDA are listed as alternative possible FGD
techniques for new and retrofit boilers DSI is also listed as possible for coal Other techniques are
considered possible but rarely applied to new plant and would be plant-dependent for existing
boilers
Nitrogen oxides primary measures
Low NOx burner (LNB)
A characteristic of LNB is the staged air to fuel ratio at the burner Three different technical
modifications are in use
air-staged LNB an under-stoichiometric zone is created by a fuel-air mixture and primary air
An internal recirculation zone occurs due to the swirl of primary air A burn-out zone is created
due to secondary air fed by air nozzles arranged around the primary air nozzles
air-staged LNB with flue gas recirculation (FGR) the basic function is similar to air-staged LNB
The distances between the primary and secondary nozzles are greater therefore a flue gas
layer is formed As a result the residence time in the reducing atmosphere increases and the
oxygen concentration decreases
air-fuel-staged LNB an additional reduction zone around the primary zone is achieved by the
extremely over-stoichiometric addition of secondary fuel around the secondary flame
LNB is operational with all fuels and all types of burners The NOx reduction efficiency for coal-fired
boilers varies between 10 and 30
Staged air supply (SAS)
Staged air means the creation of two divided combustion zones mdash a primary zone with a lack of
oxygen and a burn-out zone with excess air SAS covers the low excess air (LEA) burners out of
service (BOOS) and biased burner firing (BBF) techniques
low excess air (LEA) means reduction of the oxygen content in the primary combustion zone of
the burners When firing hard coal experience has shown that the general limitations are fouling
and corrosion caused by the reducing atmosphere and incomplete burn-out When firing gas
the reduction efficiency is limited by the CO formed LEA is more suitable for lignite and often
used for retrofitting combustion plants For oil-fired boilers a reduction efficiency of 20 has
been achieved
burners out of service (BOOS) means that the lower burner row(s) in the boiler operate under a
lack of oxygen (fuel rich) the upper burners are not in use This technology is in particular
suitable for older installations but the thermal capacity of the boiler decreases by about 15ndash
20
biased burner firing (BBF) means that the lower burner rows in the boiler operate under a lack
of oxygen (fuel rich) and the upper burners with an excess of oxygen The boiler efficiency is less
compared to BOOS and the NOx reduction is also lower The NOx reduction efficiency for coal-
fired boilers varies between 10 and 40
1A1 Energy industries
EMEPEEA air pollutant emission inventory guidebook 2019 77
Overfire air (OFA)
All burner rows in the boiler operate with a lack of oxygen The combustion air is partly (5ndash20 )
injected through separate ports located above the top burner row in the boiler OFA is operational
with most fuels and most types of boilers For gas-fired boilers a reduction efficiency of 10ndash30 and
for oil-fired boilers 10ndash40 has been achieved The NOx reduction efficiency for coal-fired boilers
varies between 10 and 40
Flue gas recirculation (FGR)
The recirculation of flue gas into the combustion air is an efficient NOx abatement method for firing
modes with high combustion temperatures such as wet bottom boilers and especially for gas- and
oil-fired boilers The recirculated flue gas can be added to the secondary or primary air In the first
case the flame core is not affected and the only effect is a reduction of the flame temperature which
is favourable for thermal-NOx abatement The influence on dry bottom boilers is thus very limited
considering the fact that about 80 of the NOx formed originates from fuel-bound nitrogen FGR
can be used as an additional measure A more efficient method is the introduction of flue gas into
the primary air of an unstaged burner High reduction efficiencies of FGR in the primary flow (15ndash
20 ) have been achieved in gas- and oil-fired boilers The NOx reduction efficiency for coal-fired
boilers varies between 5 and 25
Split primary flow (SPF or Reburn)
Split primary flow means fuel staging in the furnace This technique involves injecting fuel into the
furnace above the main combustion zone thereby producing a second sub-stoichiometric
combustion zone In the primary zone of the boiler the main fuel is burnt under fuel-lean conditions
This zone is followed by a secondary zone with a reducing atmosphere into which the secondary
fuel is injected Finally secondary air is injected into the burn-out zone of the boiler This reburning
technique can in principle be used for all types of fossil fuel-fired boilers and in combination with
low NOx combustion techniques for the primary fuels When nitrogen is present in the reburning
fuel a part of it will be converted into NOx in the burn-out zone Therefore use of natural gas
provides the largest potential reduction Trials on large boilers indicate NOx reduction potentials of
50ndash70
The Large Combustion Plant BREF lists similar measures for coal- and oil-fired boilers including
low excess air
air staging (OFA and similar measures)
LNB
reburning
Reburn is not relevant for natural gas-fired boilers
Simultaneous processes for removal of nitrogen oxides and sulphur oxides
Activated carbon process (AC)
The AC process is a dry process for simultaneous SO2 and NOx removal based on the adsorption of
the pollutants in a moving bed filter of activated carbon The sulphur oxides undergo catalytic
oxidation with the moisture in the flue gas to form sulphuric acid NO2 is completely reduced to N2
NO reacts catalytically with the ammonia injected and forms N2 and H2O The AC process has been
installed at four power plants in Germany (in two cases downstream of a SDA process) The sulphur
1A1 Energy industries
EMEPEEA air pollutant emission inventory guidebook 2019 78
content in the fuel used should not exceed 23 wt- The SO2 reduction efficiency is gt 95 the NOx
reduction efficiency is gt 70
The DESONOX processSNOX process (DESONOX)
The purification of the flue gas by the DESONOX process is based on the simultaneous catalytic
reduction of nitrogen oxides (NOx) to nitrogen (N2) and water (H2O) and on the catalytic oxidation of
sulphur dioxide (SO2) to sulphur trioxide (SO3) The by-product is sulphuric acid The process has
been installed at one power plant in Germany where hard coal is used with a sulphur content of
about 1 wt- The concentration of catalyst toxics (mainly arsenic but also chromium selenium
etc) has to be taken into account The SO2 reduction efficiency is up to 95 the NOx reduction
efficiency is also up to 95 The SNOX process works on the same basic principle as the DESONOX
process with the main difference that reduction and oxidation take place in two separate reaction
towers The SNOX process has been applied at one Danish power plant No reduction efficiency has
been reported yet The SNOX process is also known as a combination of the Topsoslashe WSA-2 process
and the SCR process
Heavy metals secondary measures
Heavy metal emissions are mainly reduced by dust control equipment Particulate control systems
which are used in coal-fired power plants are cyclones wet scrubbers electrostatic precipitators
(ESP) and fabric filters In most power plants 99 of the particulates are removed from the flue
gases by using ESP or fabric filters The latter are more efficient in controlling fine particulate matter
wet scrubbers and cyclones are less efficient The reduction efficiency of ESP for most elements in
the solid state is gt 99 Only for some higher volatile elements such as Cd Pb Zn and Se is the
reduction efficiency less but it remains above 90 The reduction efficiency of an ESP for Hg
depends on the operating temperature of the ESP A cold-side ESP operating at about 140 degC is
estimated to have an average Hg reduction efficiency of about 35
The influence of FGD- and DeNOx-units on heavy metal emissions has been investigated mainly in
the frame of mass balance studies WS-FGD-units remove a further fraction of particulate matter in
flue gas in addition to dust control Particle-bound elements are removed by FGD-units with an
efficiency of about 90 In FGD-units in particular WS-units the gaseous compounds can
additionally condense on particulate matter which are mainly removed in the prescrubber With
regard to gaseous elements various studies have shown reduction efficiencies of 30ndash50 for Hg
and 60ndash75 for Se Lime contributes over 90 of the input of As Cd Pb and Zn to the FGD
The abatement of Hg emissions is influenced indirectly by DeNOx-units A high dust SCRunit
improves Hg removal in a subsequent FGD-unit using a lime scrubbing system The SCR-unit
increases the share of ionic mercury (HgCl2) to up to 95 which can be washed out in the
prescrubber of the FGD-unit A study in the Netherlands found no influence of LNB on heavy metal
emissions
Gas turbines
For gas turbines mainly NOx emissions are of most relevance Primary measures for NOx reduction
are the following
dry controls (eg over-stoichiometric combustion in a dry low NOx burner and
wet controls (injection of water andor steam) in order to regulate the combustion temperature
Stationary engines
1A1 Energy industries
EMEPEEA air pollutant emission inventory guidebook 2019 79
For spark-ignition engines the main pollutants emitted are NOx CO and unburned hydrocarbons
(VOC) For diesel engines sulphur dioxide (SO2) emissions have also to be considered Emissions of
soot also contribute to emissions of heavy metals and persistent organic pollutants but little
information is available
Primary measures are installed to optimise combustion conditions (air ratio reduced load water
injection exhaust-gas recirculation optimised combustion chamber etc) Reduction efficiencies can
be given eg for exhaust gas recirculation from 65 to 12 and for internal exhaust gas recirculation
from 4 to 37 External exhaust gas recirculation (turbo-charged models) can have reductions of
NOx varying from 25 to 34 Secondary measures (NSCR SCR) are installed if the emission
thresholds cannot be met by adjustments to the engine itself
Table B1 FGD abatement measure efficiencies and availabilities
No Type of
secondary
measure
Reduction
efficiency
ηsec [ ]
Availability
β [ ]
1 WS 090 099
2 SDA 090 099
3 DSI 045 098
4 LIFAC 070 098
5 WL 097 099
6 WAP 088 099
7 AC 095 099
8 DESONOX 095 099
Notes
WS ndash limelimestone wet scrubbing
SDA ndash spray-dryer absorption
DSI ndash dry sorbent injection
LIFAC DSI system with additional water injection
WL ndash Wellman Lord process (regenerable FGD process)
WAP ndash Walther process
AC ndash activated carbon process (simultaneous FGD and DeNOx process)
DESONOX ndash combined FGD and DeNOx process
1A1 Energy industries
EMEPEEA air pollutant emission inventory guidebook 2019 80
Table B2 NOx primary abatement measure efficiencies
Type of primary measure1)
Reduction efficiency DBB η [ ] Reduction efficiency WBB η [ ]
Hard coal Lignite Hard coal
range value3) range value3) range value3)
no measure4) 0 0 0 0 0 0
LNB 010 - 030 020 010 - 030 020 010 - 030 020
SAS 010 - 040 030 010 - 040 030 010 - 040 030
OFA 010 - 040 030 010 - 035 025 010 - 035 025
FGR 005 - 015 010 005 - 020 015 010 - 025 020
LNBSAS 020 - 060 045 020 - 060 040 020 - 060 045
LNBOFA 020 - 060 045 020 - 055 040 020 - 060 045
LNBFGR 015 - 040 030 015 - 045 030 020 - 050 035
SASOFA 020 - 065 050 020 - 060 040 020 - 060 040
SASFGR 015 - 050 040 015 - 050 040 020 - 055 045
OFAFGR 015 - 050 040 015 - 050 035 020 - 050 040
LNBSASOFA 030 - 075 060 030 - 075 060 030 - 075 060
LNBSASFGR 025 - 065 050 025 - 070 050 030 - 070 055
LNBOFAFGR 025 - 065 050 025 - 065 050 030 - 065 050
old installationoptimised 015 015 015
old installationretrofitted2) 050 050 050
new installation2) 040 040 040
Note
1) Selection from the DECOF database developed by and available at the Institute for Industrial Production
(IPP)
2) Recommended values when no information concerning the type of primary measure is available
3) Default values used in the computer programme
4) No primary measures are installed This case is mainly relevant for old installations
1A1 Energy industries
EMEPEEA air pollutant emission inventory guidebook 2019 81
Table B3 NOx secondary abatement measure efficiencies and availabilities
No
Type of
secondary
measure
Reduction
efficiency
η [ ]
Availabilty
β [ ]
1 SNCR 050 099
2 SCR 080 099
3 AC 070 099
4 DESONOX 095 099
1A1 Energy industries
EMEPEEA air pollutant emission inventory guidebook 2019 82
Annex C Sulphur content in fuels
Fuel sulphur contents from the previous Guidebook (Chapter B111)
Table C-1 Sulphur content in fuels
Type of fuel
Sulphur content of fuel
NAPFUE
code value1) range unit
Solid
Coal
hc coking 101 04 ndash 62 wt- (maf)
hc steam 102 04 ndash 62 wt- (maf)
hc sub-bituminous 103 04 ndash 62 wt- (maf)
bc broan coalligninte 105 04 ndash 62 wt- (maf)
bc briquettes 106 025 ndash 04510) wt- (maf)
Coke
hc coke oven 107 lt 13) wt- (maf)
bc coke oven 108 05 ndash 1 3) 4) wt- (maf)
petroleum 110
Biomass
wood 111 lt 0033) wt- (maf) charcoal 112 lt 0033) wt- (maf)
peat 113
Waste
municipal 114 industrial 115 wood 116
agricultural 117
Liquid
Oil
residual 203 03 5) ndash 35 6) wt- gas 204 038) 008 ndash 10 wt- diesesl 205 038) wt-
kerosene
motor
206
lt 0059)
wt-
gasoline 208
naphtha 210
black liquour 215
Gas
Gas2) natural 301 000757) gm-3
Gas
liquified petroleum gas 303 - coke oven 304 8 gm-3 blast furnace 305 4510-3 7) gm-3 coke oven and blast furnace 306 waste 307 refinery 308 le 8 7) gm-3 biogas 309
from gas works 311
Notes
1) Recommended value
2) Only trace amounts
3) Marutzky 1989
4) Boelitz 1993
5) Mr Hietamaumlki (Finland) personal communication
6) Referring to NL-handbook 198899 the range is 20 ndash 35
7) NL-handbook 1988
8) 87219 CEE 1987
9) as ~ 0
10) Davids 1986
1A1 Energy industries
EMEPEEA air pollutant emission inventory guidebook 2019 83
Annex D Emission factors derived from emission limit values
Table D1 TSP
Source
[1]
Fuel
type
[2]
New or
existing
plant [3]
Boiler size
or
technology
MWth
Reference
O2
content
vv dry
AEL or ELV concentration
mgm-3 at STP (0ordmC 1013
kPa) dry at reference O2
content
Emission factor[4]
gGJ-1
(net thermal
input)
Low High Low High
BREF coal new 50-100 6 5 20 18 72
BREF coal new 100-300 6 5 20 18 72
BREF coal new gt 300 6 5 20 18 72
LCPD coal new 50-500 6 100 362
LCPD coal new gt 500 6 50 181
LCPD coal new 50-100 6 50 181
LCPD coal new gt 100 6 30 109
BREF coal existing 50-100 6 5 30 18 109
BREF coal existing 100-300 6 5 30 18 109
BREF coal existing gt 300 6 5 30 18 109
LCPD coal existing 50-500 6 100 362
LCPD coal existing gt 500 6 50 181
BREF wood new 50-100 6 5 20 19 77
BREF wood new 100-300 6 5 20 19 77
BREF wood new gt 300 6 5 20 19 77
BREF wood existing 50-100 6 5 20 19 77
BREF wood existing 100-300 6 5 20 19 77
BREF wood existing gt 300 6 5 20 19 77
BREF oil new 50-100 3 5 20 14 57
BREF oil new 100-300 3 5 20 14 57
BREF oil new gt 300 3 5 10 14 28
LCPD oil new gt 50 3 50 141
LCPD oil new 50-100 6 50 170
LCPD oil new gt 100 6 30 102
BREF oil existing 50-100 3 5 30 14 85
BREF oil existing 100-300 3 5 25 14 71
BREF oil existing gt 300 3 5 20 14 57
LCPD oil existing gt 50 3 50 141
LCPD gas new gt 50 3 5 14
LCPD gas new gt 50 3 5 14
LCPD gas existing gt 50 3 5 14
Notes
1) BREF denotes the large combustion plant BAT reference document LCPD denotes Directive
200180EC
2) Fuel is main classification only limits may be for lsquosolid fuelsrsquo rather than coal or wood Limits for gaseous
fuels are for natural gas and may not be applicable to derived or other gaseous fuels
3) Note that new and existing plant have specific meanings under LCPD
4) Emission factors calculated from emission concentrations using USEPA methodology (See Appendix E
for details)
1A1 Energy industries
EMEPEEA air pollutant emission inventory guidebook 2019 84
Table D2 Nitrogen oxides
Source [1]
Fuel type [2]
New or existing plant [3]
Boiler size or technology
MWth
Reference O2 content vv dry
AEL or ELV concentration mg NO2m-3 at STP (0ordmC 1013 kPa) dry at reference O2 content
Emission factor [4] gGJ-1 (net thermal input)
Low High Low High
BREF coal new 50-100 6 90 300 326 1087
BREF coal new 100-300 6 90 200 326 725
BREF coal new gt 300 6 50 150 181 543
LCPD coal new 50-500 6 600 2174
LCPD coal new gt 500 6 500 1811
LCPD coal New 2016 gt 500 6 200 725
Goburg coal new 50-100 6 400 1449
Goburg coal new 100-300 6 300 1087
Goburg coal new gt 300 6 200 725
BREF coal existing 50-100 6 90 300 326 1087
BREF coal existing 100-300 6 90 200 326 725
BREF coal existing gt 300 6 50 200 181 725
LCPD coal existing 50-500 6 600 2174
LCPD coal existing gt 500 6 500 1811
LCPD coal Ex 2016 gt 500 6 200 725
Goburg coal existing gt 50 6 650 2355
BREF wood new 50-100 6 150 250 579 964
BREF wood new 100-300 6 150 200 579 771
BREF wood new gt 300 6 50 150 193 579
LCPD wood new 50-100 6 400 1543
LCPD wood new 100-500 6 300 1157
LCPD wood new gt 500 6 200 771
Goburg wood new 50-100 6 400 1543
Goburg wood new 100-300 6 300 1157
Goburg wood new gt 300 6 200 771
BREF wood existing 50-100 6 150 300 579 1157
BREF wood existing 100-300 6 150 250 579 964
BREF wood existing gt 300 6 50 200 193 771
Goburg wood existing gt 50 6 650 2507
BREF oil new 50-100 3 150 300 424 849
BREF oil new 100-300 3 50 150 141 424
BREF oil new gt 300 3 50 100 141 283
LCPD oil new 50-100 3 400 1132
LCPD oil new 100-300 3 200 566
LCPD oil new gt 300 3 200 566
Goburg oil new 50-100 3 400 1132
Goburg oil new 100-300 3 300 849
Goburg oil new gt 300 3 200 566
BREF oil existing 50-100 3 150 450 424 1273
BREF oil existing 100-300 3 50 200 141 566
BREF oil existing gt 300 3 50 150 141 424
LCPD oil existing 50-500 3 450 1273
LCPD oil existing gt 500 3 400 1132
Goburg oil existing gt 50 3 450 1273
BREF gas new gt 50 3 50 100 142 283
LCPD gas new 50-300 3 150 425
LCPD gas new gt 300 3 100 283
Goburg gas new 50-300 3 150 425
Goburg gas new gt 300 3 100 283
BREF gas existing gt 50 3 50 100 142 283
LCPD gas existing 50-500 3 300 850
LCPD gas existing gt 500 3 200 566
Goburg gas existing gt 50 3 350 991
Notes
1) BREF denotes the large combustion plant BAT reference document LCPD denotes Directive
200180EC Goburg denotes the Gothenburg protocol of 1999
2) Fuel is main classification only limits may be for lsquosolid fuelsrsquo rather than coal or wood Limits for gaseous
fuels are for natural gas and may not be applicable to derived or other gaseous fuels
3) Note that new and existing plant have specific meanings under LCPD
4) Emission factors calculated from emission concentrations using USEPA methodology (See Appendix E
for details)
1A1 Energy industries
EMEPEEA air pollutant emission inventory guidebook 2019 85
Table D3 Sulphur oxidesdioxide
Source [1]
Fuel type [2]
New or existing plant [3]
Boiler size or technology
MWth
Reference O2 content vv dry
AEL or ELV concentration mgm-3 at STP (0ordmC 1013 kPa) dry at reference
O2 content
Emission factor [4] gGJ-1 (net thermal input)
Low High Low High
BREF coal new 50-100 6 150 400 543 1449
BREF coal new 100-300 6 100 200 362 725
BREF coal new gt 300 6 20 200 72 725
LCPD coal new 50-100 6 2000 7245
LCPD coal new 100-500 6 400 2000 1449 7245
LCPD coal new gt 500 6 400 1449
Goburg coal new 50-100 6 850 3079
Goburg coal new 100-300 6 200 850 725 3079
Goburg coal new gt 300 6 200 725
BREF coal existing 50-100 6 150 400 543 1449
BREF coal existing 100-300 6 100 250 362 906
BREF coal existing gt 300 6 20 200 72 725
LCPD coal existing 50-100 6 2000 7245 00
LCPD coal existing 100-500 6 400 2000 1449 7245
LCPD coal existing gt 500 6 400 1449
Goburg coal existing 50-100 6 2000 7245
Goburg coal existing 100-500 6 400 2000 1449 7245
Goburg coal existing gt 500 6 400 1449 00
BREF wood new 50-100 6 200 300 771 1157
BREF wood new 100-300 6 150 300 579 1157
BREF wood new gt 300 6 50 200 193 771
LCPD wood new 50-100 6 200 771
LCPD wood new 100-500 6 200 771
LCPD wood new gt 500 6 200 771
Goburg wood new 50-100 6 850 3278
Goburg wood new 100-300 6 200 850 771 3278
Goburg wood new gt 300 6 200 771
BREF wood existing 50-100 6 200 300 771 1157
BREF wood existing 100-300 6 150 300 579 1157
BREF wood existing gt 300 6 50 200 193 771
Goburg wood existing 50-100 6 2000 7714
Goburg wood existing 100-500 6 400 2000 1543 7714
Goburg wood existing gt 500 6 400 1543
BREF oil new 50-100 3 100 350 283 990
BREF oil new 100-300 3 100 200 283 566
BREF oil new gt 300 3 50 150 141 424
LCPD oil new 50-100 3 850 2405
LCPD oil new 100-300 3 200 400 566 1132
LCPD oil new gt 300 3 200 566
Goburg oil new 50-100 3 850 2405
Goburg oil new 100-300 3 200 850 566 2405
Goburg oil new gt 300 3 200 566
BREF oil existing 50-100 3 100 350 283 990
BREF oil existing 100-300 3 100 250 283 707
BREF oil existing gt 300 3 50 200 141 566
LCPD oil existing 50-300 3 1700 4810
LCPD oil existing 300-500 3 400 1700 1132 4810
LCPD oil existing gt 500 3 400 1132
Goburg oil existing 50-300 3 1700 4810
Goburg oil existing 300-500 3 400 1700 1132 4810
Goburg oil existing gt 500 3 400 1132
Goburg gas new gt 50 3 35 99
LCPD gas new gt 50 3 35 99
LCPD gas existing gt 50 3 35 99
Goburg gas existing gt 50 3 35 99
Notes
1) BREF denotes the large combustion plant BAT reference document LCPD denotes Directive
200180EC Goburg denotes the Gothenburg protocol of 1999
2) Fuel is main classification only limits may be for lsquosolid fuelsrsquo rather than coal or wood Limits for gaseous
fuels are for natural gas and may not be applicable to derived or other gaseous fuels
3) Note that new and existing plant have specific meanings under LCPD
4) Emission factors calculated from emission concentrations using USEPA methodology (See Appendix E
for details)
1A1 Energy industries
EMEPEEA air pollutant emission inventory guidebook 2019 86
Table D4 Gas turbines and stationary engines
Source
[1]
Fuel
type
[2]
New or
existing
plant [3]
Technology Reference
O2 content
vv dry
Pollutant AEL or ELV concentration
mgm-3 at STP (0ordmC 1013 kPa)
dry at reference O2 content
Emission factor [4]
gGJ-1
(net thermal input)
Low High Low High
BREF gas new GT 15 TSP 5 43
BREF gas existing GT 15 TSP 5 43
BREF gas new GT 15 SO2 10 86
BREF gas existing GT 15 SO2 10 86
BREF gas new GT 15 NOx 20 50 172 430
LCPD gas new GT 15 NOx 50 75 430 644
LCPD oil new GT 15 NOx 120 1030
Goburg gas new GT 15 NOx 50 75 430 644
Goburg oil new GT 15 NOx 120 1030
BREF gas existing GT 15 NOx 20 90 172 773
Goburg gas existing GT 15 NOx 150 1289
Goburg oil existing GT 15 NOx 200 1717
BREF gas new Gas engine 15 NOx 20 75 172 644
Goburg gas new Gas engine 5 NOx 250 500 797 1594
BREF gas existing Gas engine 15 NOx 20 100 172 859
Goburg gas new CI Engine 5 NOx 500 1594
Goburg oil new CI Engine 5 NOx 500 600 1593 1911
Notes
1) BREF denotes the large combustion plant BAT reference document LCPD denotes Directive
200180EC Goburg denotes the Gothenburg protocol of 1999
2) Fuel is main classification only limits may be for lsquosolid fuelsrsquo rather than coal or wood Limits for gaseous
fuels are for natural gas and may not be applicable to derived or other gaseous fuels
3) Note that new and existing plant have specific meanings under LCPD
4) Emission factors calculated from emission concentrations using USEPA methodology (See Appendix E
for details)
1A1 Energy industries
EMEPEEA air pollutant emission inventory guidebook 2019 87
Annex E Calculation of emission factors from concentrations
E1 Emission factors for combustion activities
Standardisation of emission concentrations from combustion activities
Annual emissions emission rates and emission limit values are generally expressed in terms of
pollutant mass (for example tonnesyear-1 kghr-1 mgm-3) Note that a mass concentration is
meaningless unless the volume conditions are defined mdash typically for a combustion process the
conditions will be a dry volume at STP (0 degC 1013 kPa) and normalised to a reference oxygen
concentration Consumption of fuel requires a minimum theoretical (stoichiometric) quantity of air
In practise more air than the stoichiometric quantity is required to achieve combustion The oxygen
content in exhaust gases from a combustion appliance is indicative of the amount of excess air and
air ingress in the combustion system Normalisation to a reference oxygen content allows
comparison between technologies as it removes a diluting (or concentrating) effect of different levels
of excess airair ingress on the pollutant concentration
Common oxygen concentrations for emission normalisation are
oil- or gas-fired boilers mdash 3 O2
solid-fuel boilers mdash 6 7 O2
wood-fired boilers mdash 6 10 11 or 13 O2
incineration mdash 11 O2
gas turbines mdash 15 O2
stationary engines mdash 5 15 O2
dryers mdash 17 O2
Other normalisation oxygen concentrations are used including 0 O2 which is commonly used in
testing of residential gas appliances Concentrations can also be normalised using carbon dioxide
(although this is much less common)
Usually emission concentration data will be provided as mass concentrations at a specified oxygen
content However where emission data are provided in other forms the following equations may
help the user manipulate the date into a more useful form
Some pollutants are measured and reported on a wet basis and may require standardisation to the
dry condition
[X]d = [X]w 100
(100-[H2O])
where
[X]w is the measured concentration for a wet flue gas (ppm mgm-3 vv)
[X]d is the measured concentration for a dry flue gas (same units as the dry concentration)
[H2O] is the flue gas moisture content as vv on a wet basis
1A1 Energy industries
EMEPEEA air pollutant emission inventory guidebook 2019 88
Many pollutants are measured as volume (molar) concentrations Conversion to a mass
concentration assumes ideal gas behaviour and is detailed below
[X]m = [X]d MW
224
where
[X]d is the measured concentration in ppm (parts per million) by volume for a dry flue gas
[X]m is the measured concentration in mgm-3 by volume for a dry flue gas
MW is the relative molecular mass of the pollutant (for example 64 for SO2)
224 is the volume occupied by 1 kgmole of an ideal gas at 0 degC 1013 kPa (m3)
Note that NOx emission concentrations and emission factors are defined in terms of NO2 Hence the
relative molecular mass used for NOx is 46 VOC emission concentrations are often defined in terms
of carbon Hence the relative molecular mass used for VOC is 12 but this will often be modified
further for the calibration gas applied (for example MW for concentrations measured as propane
C3H8 lsquoequivalentsrsquo would be 3 x 12 = 36)
Normalisation to a reference O2 concentration is given by
[X]ref = [X]m (209-[ O2]ref)
(209-[O2]m)
where
[X]ref is the standardised concentration of the pollutant at the reference O2 content
[x]m is the measured concentration in mgm-3 for a dry flue gas
[O2]m is the measured O2 concentration in on a dry basis
[O2]ref is the reference O2 concentration in on a dry basis (for example 3 6 or 15 )
This calculation is appropriate where pollutant and O2 concentrations are measured on a dry basis
Calculation of emission factors
An emission factor relates the release of a pollutant to a process activity For combustion processes
emission factors are commonly described as the mass of pollutant released per unit of fuel burned
An emission factor can be calculated in several ways the approach adopted uses the standardised
pollutant emission concentrations and the specific theoretical (stoichiometric) volume of flue gas for
the relevant fuel This approach avoids measurement of exhaust gas flow and fuel flows which can
have a high uncertainty and may not be practical at many combustion plant
The approach requires knowledge of the fuel used the pollutant concentration and the oxygen
concentration
Fuel analysis where available allows calculation of the specific flue gas volume from the elemental
analysis However the US Environmental Protection Agency Method 19 provides flue gas volume for
common fuels For other fuels (for example derived gases landfill gas unrefined natural gas or
waste-derived fuels) fuel analysis is advised to minimise uncertainty
1A1 Energy industries
EMEPEEA air pollutant emission inventory guidebook 2019 89
Fuel analysis route the fuel analysis and combustion calculations are used to determine the
stoichiometric air requirement and dry flue gas volume per volume or mass of fuel Note that it is
important to understand the analysis reporting conditions particularly for solid fuels The
calculations assume ideal gas behaviour A dry flue gas volume is calculated for the reference O2
concentration used to normalise the pollutant emission concentration A pollutant emission factor
(EF) can hence be calculated by multiplying the standardised pollutant concentration by the dry flue
gas volume at the same reference oxygen content
Generally the flue gas volumes generated from combustion of fuel can be calculated in accordance
with the following equations
CXHY + (X+(Y4)O2 = X CO2 + (Y2) H2O
Note that some of the oxygen may be sourced from the fuel For combustion in air each cubic metre
of oxygen is associated with (791209) cubic metres of nitrogen
The dry flue gas volume at stoichiometric conditions (DFGVSC) per unit mass of fuel (or volume for
gaseous fuels) can be calculated and hence the dry flue gas volume at the normalised condition
(DFGVref) for the required reference oxygen content
DFGVref = DFGVSC (209(209-[O2ref]))
A pollutant emission factor (EF) can hence be calculated by multiplying the standardised pollutant
concentration by the dry flue gas volume at the same reference oxygen content For example at 15
oxygen
EF = [X]15 DFGV15
Emission factors are reported in several ways and these are generally recalculated using physical or
other properties of the fuel
For example a thermal emission factor (as used in the Guidebook) can be derived by dividing the
emission factor calculated above by the calorific value of the fuel For the Guidebook this is the net
(inferior) CV
EFthermal = EF
CV
where
EFthermal is the thermal emission factor expressed in units to suit the user (for example g GJ-1)
CV is the net calorific value of the fuel in appropriate units to suit the units of the emission factor
USEPA Method 19 The USEPA provides stoichiometric dry flue gas volume for fuel oil The USEPA
data can be found in USEPA Method 19 (US Code of Federal Regulations Title 40 Part 60
Appendix A) The USEPA lsquoF-factorrsquo data are presented as the volume of dry flue gas at 20 degC
associated with the gross thermal input of the fuel These USEPA conditions are not consistent with
the Guidebook (net calorific basis) or emission concentration reporting practise in Europe (dry gas
at STP mdash 0ordmC 1013 kPa) and consequently some manipulation of the data is required Calculations
assume an ideal gas
The USEPA method can be obtained here wwwepagovttnemcmethodsmethod19html and the
F-factors are provided below
1A1 Energy industries
EMEPEEA air pollutant emission inventory guidebook 2019 90
Fuel type Fd1) Fw1) Fc1)
dscmJ dscf106 Btu wscmJ wscf106 Btu scmJ scf106 Btu
Coal
Anthracite2 27110-7 10100 28310-7 10540 053010-7 1970
Bituminus2 26310-7 9780 28610-7 10640 048410-7 1800
Lignite 26510-7 9860 32110-7 11950 051310-7 1910
Oil3) 24710-7 9190 27710-7 10320 038310-7 1420
Gas
Natural 23410-7 8710 28510-7 10610 028710-7 1040
Propane 23410-7 8710 27410-7 10200 032110-7 1190
Butane 23410-7 8710 27910-7 10390 033710-7 1250
Wood 24810-7 8710 - - 049210-7 1830
Wood bark 25810-7 9240 - - 051610-7 1920
Municipal 25710-7 9600 - - 048810-7 1820
Solid waste - 9570
Notes
1) determined at standard conditions 20degC (68degF) and 760mmHg (2992 inHg)
2) as classified according to ASTM D 388
3) Crude residual or distillate
The Fd factors are used mdash these represent the dry stoichiometric flue gas volume per unit of energy
input The Fw and Fc factors represent the wet flue gas volume and CO2 volumes respectively
The USEPA dry flue gas volume at stoichiometric conditions are first recalculated to provide the flue
gas volume (DFGVref) for the required oxygen content at STP and for the net energy input
Fdrsquo = Fd (273293) ((CVgross)CVnet))
Where
Fdrsquo is the stoichiometric dry flue gas volume at STP per unit of net energy input ndash m3J-1
Fd is the USEPA factor (20 degC and gross energy input)
273293 Volume correction mdash ratio of temperatures in Kelvin
Note that it is the ratio between the fuelsrsquo gross and net calorific values that is needed Indicative
ratios are provided below based on UK data (DUKES 2007)
Fuel CVgross CVnet Unit Ratio grossnet
Power stn coal 262 249 GJtonne-1 105
Industrial coal 266 253 GJtonne-1 105
Wood 119 10 GJtonne-1 108
HFO 433 412 GJtonne-1 105
Gas oil 456 434 GJtonne-1 105
Natural gas 398 358 MJm-3 111
The dry flue gas volume at the normalised oxygen content can then be calculated
Fdref = Fdrsquo (209(209-[O2ref]))
1A1 Energy industries
EMEPEEA air pollutant emission inventory guidebook 2019 91
A pollutant emission factor (EFthermal) can then be calculated by multiplying the standardised
pollutant concentration by the dry flue gas volume at the same reference oxygen content For
example at 15 oxygen
EFthermal = [X]15 Fd15
Emission factors are reported in several ways and these are generally recalculated using physical or
other properties of the fuel
For example a mass emission factor can be derived by multiplying the thermal emission factor
calculated above by the net calorific value of the fuel
EF = EFthermal CV
where
EFthermal is the thermal emission factor expressed in units to suit the user (for example g GJ-1)
CV is the net calorific value of the fuel in appropriate units to suit the units of the emission factor
Example figures for correlation of emission concentrations to emission factors from USEPA
Method 19 F factors are provided in Figures C1 and C2 below
Figure E1 Emission factors mdash selected fuels and standardised concentrations up to
1 000 mgm-3
Emission Factors and Concentrations
0
100
200
300
400
500
600
700
800
900
1000
0 100 200 300 400 500 600 700 800 900 1000
Emission concentration mgm3 dry STP (0C 1013 kPa) at Reference O2
Em
iss
ion
fa
cto
r g
GJ
ne
t
Coal (6 O2)
Wood (6 O2)
Oil gas (3 O2)
Oil gas (15 O2)
1A1 Energy industries
EMEPEEA air pollutant emission inventory guidebook 2019 92
Figure E2 Emission factors mdash selected fuels and standardised concentrations up to
200 mgm-3
0
20
40
60
80
100
120
140
160
180
200
0 20 40 60 80 100 120 140 160 180 200
Emissions concnetrations mgm3 dry at STP (0C 1013kPa) at Reference O2
Em
iss
ion
fa
cto
rs g
GJ
(n
et)
Coal (6 O2)
Wood (6 O2)
Oil gas (3 O2)
Oil gas (15 O2)
1A1 Energy industries
EMEPEEA air pollutant emission inventory guidebook 2019 93
Annex F Emission factors from older versions of the Guidebook
Chapter B111
Table 24 NOx emission factors [gGJ] for combustion plants
Thermal boiler capacity [MW] Thermal boiler capacity [MW]
gt= 30032) gt= 50 and lt 30032)
Type of fuel NAPFUE Type of boiler43) Type of boiler Type of boiler
code DBBboiler27) WBB FBC DBBboiler27) WBB
CFBC
s coal hc coking 101 see table 25 see table 25 701) see table 25 see table 25
s coal hc steam 102 see table 25 see table 25 701) see table 25 see table 25
s coal hc sub-bitumious 103 see table 25 see table 25 701) see table 25 see table 25
s coal bc brown coallignite 105 see table 25 701) see table 25
s coal bc briquettes 106
s coke hc coke oven 107
s coke bc coke oven 108
s coke petroleum 110 3001)
s biomass wood 111 2001)15)
s biomass charcoal 112
s biomass peat 113 3001)28) 3001)
s waste municipal 114
s waste industrial 115
s waste wood 116
s waste agricultural 117
l oil residual 203 2101)29) 2601)28) 155 - 29619)20) 1501)29) 1701)29) 1901)30) 2101)30)
l oil gas 204 64 - 6821) 1001)
l oil diesel 205
l kerosene 206
l gasoline motor 208
l naphtha 210
l black liquor 215
g gas natural 301 1701) 48 - 33322) 23) 1251)25) 1501)26) 48 - 33322)23)24)
g gas liquified petroleum gas 303 88 - 33323)24) 88 - 33323)24)
g gas coke oven 304 1501) 88 - 33323) 24) 1101)25) 1301)26) 88 - 33323)24)
g gas blast furnace 305 951) 88 - 33323) 24) 651)25) 801)26) 88 - 33323)24)
g gas coke oven and blast furnace gas 306 88 - 33323)24) 88 - 33323)24)
g gas waste 307 88 - 33323)24) 88 - 33323)24)
g gas refinery 308 88 - 33323)24) 1401) 88 - 33323)24)
g gas biogas 309 88 - 33323)24) 88 - 33323)24)
g gas from gas works 311
1A1 Energy industries
EMEPEEA air pollutant emission inventory guidebook 2019 94
Table 24 continued
Thermal boiler capacity [MW] no speci-
gt 50 and lt 300 32)
lt 5032) fication
Type of boiler Type of boiler Gas turbine Stationary engine CORINAIR 9044)
FBC GF DBBboiler27) WBB FBC GF
PFBCCFBC PFBC CFBCAFBC SC CC CI SI
1501) 701) 1501) 1801)31) 2301)29) 701) 1501) 54544)
1501) 701) 1501) 1801)31) 2301)29) 701) 1501) 365 - 76144)
1501) 701) 1501) 1801)31) 2301)29) 701) 1501) 205 - 168344)
1501) 701) 1501) 1801)31) 2301)29) 701) 1501) 180 - 38044)
333 - 17544)
3001) 3001) 3001)
2001) 33 - 11515)2001) 33 - 11515) 2001)15) 50 - 20044)
1601) 1001) 2301) 2801) 1601) 1001) 150 - 24044)
90 - 46316)17) 90 - 46316)17) 22044)
139 - 14018) 139 - 14018)
80 - 20044)
886) 16044)
1401)29) 1801)30) 25045) 1090-120045) 24 - 37044)
801) 1001) 120 1)35) 3501)33) 3801)34) 7801)36) 100 - 120045) 50 - 26944)
100 - 70045) 30046) 6001)37)42) 12001)38)10001)40)42) 18001)39)42)
18044)
20 - 44044)
1001) 48 - 33322)23)24) 150 - 36045) 6001)37)42) 12001)38)42)10001)40)42) 18001)39)42) 22 - 35044)
1884)41) 1874)41)
88 - 33323)24) 35 - 10044)
901)23)24) 70 - 57144)
88 - 33323)24) 67 - 33044)
88 - 33323)24)
88 - 33323)24) 35 - 32744)
1401)23)24) 150-15145) 35 - 14044)
88 - 33323)24) 6044)
1A1 Energy industries
EMEPEEA air pollutant emission inventory guidebook 2019 95
Table 25 NOx emission factors [gGJ] for coal combustion according to the model (see Annexes 4 and 5)
Thermal boiler capacity [MW]
gt= 50 sup1)
Type of fuel coal mining country NAPFUE Hu [MJkg] Type of boiler
code (maf) DBB WBB
PM0sup2) PM1 PM2 PM3 PM4 PM0 PM1 PM2 PM3 PM4
s coal hc Australia (101) 34 568 454 312 312 227 703 562 387 422 281
Canada (101) 33 500 405 278 278 202 627 501 345 376 251
China (101) 32 413 331 227 227 165 512 409 281 307 205
Columbia (101) 32 535 428 394 394 214 662 529 364 397 265
Czech Republic (101) 34 483 387 266 266 193 598 479 329 359 239
France 101 35 374 299 205 205 149 463 370 254 278 185
Germany RAG 102 35 384 307 211 211 154 476 381 262 285 190
Germany others 101 30 495 396 272 272 198 613 490 337 368 245
CIS (101) 32 308 247 169 169 123 382 305 210 229 153
Hungary 101 34 401 320 220 220 160 496 397 273 298 198
India 103 30 551 441 303 303 220 682 545 375 409 273
South Africa (101) 32 569 456 313 313 228 705 504 388 423 282
USA (101) 34 563 450 310 310 225 697 558 383 418 279
Venezuela (101) 34 588 471 324 324 235 728 583 401 437 291
s coal bc Czech Republic 105 28 506 405 278 304 202
Germany
- Rheinisch Coal 105 27 325 260 179 195 130
- Middle Germany 105 25 504 403 277 302 202
- East Germany 105 26 539 431 296 323 215
Hungary-1 105 36 379 303 208 227 151
Hungary-2 103 28 379 304 209 228 152
Poland 105 25 531 425 292 319 213
Portugal 105 25 461 369 254 277 185
Turkey-2 103 27 725 580 399 435 2901) The emission factors [gGJ] are given at full load operating modus2) PM0 PM4 = most used combinations of primary
measures = reduction efficiencies [ ] PM0 - no primary measures
PM1 - one primary measure LNB
PM2 - two primary measures LNBSAS
PM3 - two primary measures LNBOFA
PM4 - three primary measures LNBSASOFA
1A1 Energy industries
EMEPEEA air pollutant emission inventory guidebook 2019 96
Table 26 NMVOC emission factors [gGJ] for combustion plants
Thermal boiler capacity [MW] no speci-
Type of fuel NAPFUE gt= 50 lt 50 fication
code boiler GF boiler Gas turbine Stationary engine CORINAIR906)
s coal hc coking 101 35)
302) 502) 6001) 36)
s coal hc steam 102 35)
302) 502) 6001) 1 - 156)
s coal hc sub-bituminous 103 35)
302) 502) 6001) 15 - 156)
s coal bc brown coallignite 105 302)3) 502) 15 - 156)
s coal bc briquettes 106 1501)
s coke hc coke oven 107 121) 5 - 156)
s coke bc coke oven 108
s coke petroleum 110 156)
s biomass wood 111 802) 1005) 1501) 4004) 10 - 486)
s biomass charcoal 112
s biomass peat 113 302)3) 302) 3 - 486)
s waste municipal 114 106)
s waste industrial 115
s waste wood 116 40 - 486)
s waste agricultural 117 506)
l oil residual 203 102)3) 37) 507) 15 - 4766)
l oil gas 204 52) 151) 52) 15 - 27) 15 - 1007) 1002) 15 - 936)
l oil diesel 205
l kerosene 206 36)
l gasoline motor 208
l naphtha 210 36)
l black liquor 215 36)
g gas natural 301 52) 52) 25 - 47) 2002) 2 - 46)
g gas liquified petroleum gas 303 2 - 266)
g gas coke oven 304 25 - 1676)
g gas blast furnace 305 1 - 256)
g gas coke oven and blast furnace gas 306
g gas waste 307 256)
g gas refinery 308 252) 257) 21 - 106)
g gas biogas 309 256)
g gas from gas works 3111) LIS 1977 92 2) CORINAIR 1992 80 3) DBB only 4) small consumers cf 24 5) power plants cf 246) CORINAIR90 data of combustion plants as point sources with a thermal capacity of gt 300 50 - 300 lt 50 MW 7) CORINAIR90 data point sources
1A1 Energy industries
EMEPEEA air pollutant emission inventory guidebook 2019 97
Table 28 CO emission factors [gGJ] for combustion plants
Type of combustion no speci-
Utility combustion Commercial comb Industrial combustion fication
Type of fuel NAPFUE DBBWBB GF boiler GF DBBWBB GF GT stat E CORINAIR909)
code boilers1) stoker boiler1) stoker
spreader travell spreader travelling
s coal hc coking 101 143) 1213) 1953) 972) 134) 812) 1154) 9722) 159)
s coal hc steam 102 143) 1213) 1953) 972) 134) 1154) 972) 10 - 17529)
s coal hc sub-bituminous 103 143) 1213) 1953) 972) 134) 812) 1154) 9722) 12 - 24699)
s coal bc brown coallignite 105 143) 1213) 1953) 162) 134) 1332) 1154) 1602) 96 - 6449)
s coal bc briquettes 106
s coke hc coke oven 107 102 - 1219)
s coke bc coke oven 108
s coke petroleum 110 159)
s biomass wood 111 14733) 1993) 15043) 30 - 3009)
s biomass charcoal 112
s biomass peat 113 30 - 1609)
s waste municipal 114 983)6) 193) 193)7) 963)7) 42 kgMg3)8) 309)
s waste industrial 115
s waste wood 116 12 - 3009)
s waste agricultural 117 58 kgMg3)8) 209)
l oil residual 203 153) 173) 153) 10 - 1510) 10010) 3 - 3269)
l oil gas 204 153) 163) 123) 10 - 2010) 12 - 113010) 10 - 4649)
20611)
l oil diesel 205
l kerosene 206 129)
l gasoline motor 208
l naphtha 210 159)
l black liquor 215 111 - 3149)
g gas natural 301 193) 963) 173) 135) 10 - 2010) 323) 005 - 609)
g gas liquified petroleum gas 303 10 - 139)
g gas coke oven 304 003 - 1309)
g gas blast furnace 305 03 - 6449)
g gas coke oven and blast furnace gas 306
g gas waste 307 01 - 2559)
g gas refinery 308 1010) 2 - 159)
g gas biogas 309 139)
g gas from gas works 311
1A1 Energy industries
EMEPEEA air pollutant emission inventory guidebook 2019 98
1) DBBWBB for coal combustion boiler for other fuel combustion2) EPA 1987 85 CORINAIR 1992 803) Radian 1990 102 IPCC 1994 88 without primary measure4) OECD 1989 100 CORINAIR 1992 805) CORINAIR 1992 80 part 86) grate firing without specification7) small combustion 19 gGJ mass burning 96 gGJ8) open burning9) CORINAIR90 data of combustion plants as point sources with a thermal capacity of gt 300 50 - 300 lt 50 MW10) CORINAIR90 data point sources11) AP42 115
1A1 Energy industries
EMEPEEA air pollutant emission inventory guidebook 2019 99
Chapter B111(S1)PMv1
Table 82a Emission factors for combustion processes burning hard coal
Fuel NAPFUE NFR Codes Activity description Activity detail Emission factor Notes
Hard coal TSP PM10 PM25
Bituminous
coal 101 Various Electricity CHP heat
FF lt 20 mgNm-3 6 6 5 CEPMEIP lsquoBATrsquo
ESP (or FF) lt 50 mgNm-3 15 12 6 Scaled from CEPMEIP ESP factor TSP scaled to a
nominal 100 mgNm-3 limit
ESP lt 100 mgNm-3 30 25 12 From CEPMEIP sub-bit coal lsquohigh efficiency ESPrsquo
TSP scaled to a nominal 100 mgNm-3 limit
ESP Oldconventional
lt 500 mgNm-3 140 70 17
CEPMEIP
Unit with multicyclone 100 60 35 CEPMEIP
Unit uncontrolled or cyclone 500 250 100 CEPMEIP (NB such a high emission
concentration would apply to few if any plant)
Sub-
bituminous
coal
103 Various Electricity CHP heat
plant
FF lt 20 mgNm-3 6 6 5 CEPMEIP lsquoBATrsquo
ESP (or FF)
lt 50 mgNm-3 15 12 6
Scaled from CEPMEIP ESP factor (TSP scaled to a
nominal 100 mgNm-3 limit)
ESP
lt 100 mgNm-3 30 25 12
From CEPMEIP sub-bit coal lsquohigh efficiency ESPrsquo
TSP scaled to a nominal 100 mgNm-3 limit
ESP Oldconventional
lt 500 mgNm-3 140 70 17
CEPMEIP
Unit with multicyclone 100 60 35 CEPMEIP
Unit uncontrolled or cyclone 500 250 100
CEPMEIP (the lower of the two TSP factors the
800 g GJ-1 for small uncontrolled plant is such a
high emission concentration that would apply to
few if any plant)
Coke 107 1A1b Oil refineries Uncontrolled 500 250 100
Coke is unlikely to be burned as primary fuel
when co-fired use the factor for the principal fuel
1A1 Energy industries
EMEPEEA air pollutant emission inventory guidebook 2019 100
Table 82b Emission factors for combustion processes burning brown coal
Fuel
NAPFUE NFR Code Activity description Activity detail Emission factor Notes
TSP PM10 PM25
Brown coal 105 Various Electricity plant CHP
plant heat plant Modern FF lt 20 mgNm-3 9 8 6 CEPMEIP lsquoBATrsquo
High efficiency ESP (or FF) 40 30 14 CEPMEIP
Conventional large unit with
multicyclone
100 60 35 CEPMEIP
Peat 113 Various Electricity plant CHP
plant heat plant
Modern abatement (FF)
lt 30 mgNm3
9 8 6 CEPMEIP
Efficient abatement
lt 50 mgNm3
20 15 10 TSP scaled from emission limit
of 50 mgNm-3
Efficient abatement
lt 100 mgNm3
40 30 20 TSP scaled from emission limit
of 100 mgNm-3
Conventional technology 120 40 20 CEPMEIP
Conventional smaller
multicyclone
300 40 20 CEPMEIP
1A1 Energy industries
EMEPEEA air pollutant emission inventory guidebook 2019 101
Table 82c Emission factors for combustion processes burning other solid fuels
Fuel NAPFUE NFR Code Activity description Activity detail Emission factor Notes
TSP PM10 PM25
Municipal
solid waste 114 Various
Electricity plant CHP
plant heating plant
Effective emission control (BAT) 15 13 10
CEPMEIP (NB care should be taken using
this factor as waste burning is often
controlled under nationalinternational
regulation to a more stringent specification)
Conventional emission control 100 70 55
CEPMEIP (uncontrolled optimised
combustion) (NB care should be taken
using this factor as waste burning is often
controlled under nationalinternational
regulation to a more stringent specification)
Industrial
waste 115 Various
Electricity CHP
heating plant
Effective emission control (BAT) 15 13 10
CEPMEIP (NB care should be taken using
this factor as waste burning is often
controlled under nationalinternational
regulation to a more stringent specification)
Conventional emission control 100 70 55
CEPMEIP (uncontrolled optimised
combustion) (NB care should be taken
using this factor as waste burning is often
controlled under nationalinternational
regulation to a more stringent specification)
Older small uncontrolled 600 350 210
CEPMEIP (uncontrolled optimised
combustion) (NB care should be taken
using this factor as waste burning is often
controlled under nationalinternational
regulation to a more stringent specification)
1A1 Energy industries
EMEPEEA air pollutant emission inventory guidebook 2019 102
Table 82d Emission factors for combustion processes burning natural gas
Fuel NAPFUE NFR Code Activity description Activity detail Emission factor Notes
TSP PM10 PM25
Natural gas 301 Various Electricity CHP and
heating plant
Burner with optimised
combustion 01 01 01
CEPMEIP
Conventional installation 02 02 02 CEPMEIP
Conventional installation 09 09 09 USEPA filterable
1A1 Energy industries
EMEPEEA air pollutant emission inventory guidebook 2019 103
Table 82e Emission factors for combustion of derived gases
Fuel NAPFUE NFR Code Activity description Activity detail Emission factor Notes
TSP PM10 PM25
Gas works
gas 311 Various
Electricity CHP and
heating plant
Clean fuel efficient
combustion 01 01 01 CEPMEIP
Clean fuel conventional
installation 02 02 02 CEPMEIP (conventional installation)
Conventional installation 5 5 5 CEPMEIP (high PM due to fuel quality)
Other
gaseous fuel 314 Various
Electricity CHP and
heating plant
Clean fuel efficient
combustion 01 01 01 CEPMEIP
Conventional installation 5 5 5 CEPMEIP
Coke oven
gas 304 Various
Electricity CHP
heating plant coke
ovens
Clean fuel efficient
combustion 01 01 01 CEPMEIP
Clean fuel conventional
installation 02 02 02 CEPMEIP (conventional installation)
Conventional installation 5 5 5 CEPMEIP
Blast furnace
gas 305 Various
Electricity CHP and
heating plant coke
ovens
Clean fuel efficient
combustion 01 01 01 CEPMEIP
Clean fuel conventional
installation 02 02 02 CEPMEIP (conventional installation)
Conventional installation 5 5 5 CEPMEIP
1A1 Energy industries
EMEPEEA air pollutant emission inventory guidebook 2019 104
Table 82f Emission factors for combustion of heavy fuel oil
Fuel NAPFUE NFR Code Activity description Activity detail Emission factor Notes
TSP PM10 PM25
Residual fuel oil 203 Various Electricity CHP and
heating plant
Low S fuel with optimised
burner and abatement 3 3 25 CEPMEIP (about 10 mgNm-3 or BAT)
Low S fuel efficient
combustion 14 12 10 CEPMEIP (about 50 mgNm-3)
Low-medium S fuel
conventional installation 20 15 9 CEPMEIP (about 70 mgNm-3)
Low-medium S fuel
conventional installation 60 50 40
CEPMEIP (higher of two entries used About
200 mgN Nm-3)
High S fuel 210 190 130
CEPMEIP (lower of two entries for high S
used (higher entry 240 g GJ-1 for TSP) Very
high emission concentration (about
750 mgNm-3)
Petroleum coke 110 1A1b Oil refineries Conventional multicyclone 100 60 35 CEPMEIP Bit coal factors more
appropriate
1A1 Energy industries
EMEPEEA air pollutant emission inventory guidebook 2019 105
Table 82g Emission factors for combustion of other liquid fuels
Fuel NAPFUE NFR Code Activity description Activity detail Emission factor Notes
TSP PM10 PM25
Gasdiesel oil 205 Various Electricity CHP
heating plant
Optimised burner 2 2 2 CEPMEIP
Conventional burner 5 5 5 CEPMEIP
Naphtha 210 1A1b Oil refineries All units 5 5 5 CEPMEIP
Liquefied
petroleum gas 303 Various
Electricity CHP
heating plant
Optimised burner 01 01 01 CEPMEIP
Conventional burner 5 5 5 CEPMEIP
Refinery gas 308 Various Electricity CHP
heating plant
Optimised burner 01 01 01 CEPMEIP
Conventional burner 5 5 5 CEPMEIP
Other oil 224 Various Electricity CHP
heating plant
Low S fuel optimised burner 3 3 25 CEPMEIP
Low S fuel efficient
combustion 14 12 10
CEPMEIP for residual oil (About 50 mgNm-
3 LCPD limit for existing plant)
Low-medium S fuel
conventional installation 20 15 9 CEPMEIP (about 70 mgNm-3)
Low-medium S fuel
conventional installation 60 50 40
CEPMEIP (highest of similar entries with TSP
of 35 40 50 and 60 used About 200 mgN
Nm-3)
High S fuel 210 190 130
CEPMEIP lower of two entries for high S
used (This is a very high emission
concentration about 750 mgN Nm-3)
1A1 Energy industries
EMEPEEA air pollutant emission inventory guidebook 2019 106
Table 82h Emission factors for combustion of biomass
Fuel NAPFUE NFR Code Activity description Activity detail Emission factor Notes
TSP PM10 PM25
Wood 111 Various Electricity CHP
heating plant
Modern unit with FF
lt 20 mgNm3 TSP 7 7 6
TSP scaled from BAT benchmark fractions
applied based on bit Coal
Older unit lt 100 mgNm3 TSP 35 25 12 TSP scaled from emission concentration
fractions based on bit Coal
Uncontrolled conventional
installation 100 70 55 CEPMEIP (uncontrolled multicyclone)
Conventional minimal control 160 150 150 CEPMEIP for conventional installation
Charcoal 112 1A2c Chemicals
Conventional large unit with
multicyclone 100 60 35
CEPMEIP the use of charcoal is likely to be
very rare
400 100 35 CEPMEIP the use of charcoal is likely to be
very rare
Black liquour 215 1A2f Textile and leather
(pulp and paper) Conventional installation 160 150 150
CEPMEIP (NB such a high emission
concentration would apply to few if any
plant)
Biogas 309 Various Electricity CHP
heating plant
Modern optimised large
installation 3 3 25 (CEPMEIP clean fuel)
Conventional burner 5 5 5 CEPMEIP
Modern optimised 20 15 10 CEPMEIP (gasification plant)
1A1 Energy industries
EMEPEEA air pollutant emission inventory guidebook 2019 107
Chapter B111(S2)PMv2
Default emission factors for use with simpler methodology (Tier 1)
Fuel Technology Emission factor g GJ-1 Notes (4)
TSP PM10 PM25
Hard coal (assumes
20 ash)
Brown coal
Other solid fuels
Pulverised coal ESP 30 20 9 Based on AP-42 mdash assumes 20 ash content and PM emissions from solid mineral
fuels generally similar to coal Pulverised coal fluid bed other FF 74 74 37
Cyclone furnace ESP 61 42 23
Stoker with multicyclone 330 230 27
Pulverised coal ESP + wet limestone FGD 6 6 5 From CEPMEIP data (US EPA default factors for wet scrubbers are very high)
Natural gas 09 09 09 AP-42 filterable PM factor
Derived gases 5 5 5 CEPMEIP data worst case for derived gases
Heavy fuel oil
(1 S)
No control 25 18 13 Assumes 1 sulphur as specified in the EU sulphur content of liquid fuels Directive
FGD 15 15 15
Heavy fuel oil
(3 S)
No control 64 45 33 Assumes 3 sulphur (maximum permitted in EU countries)
FGD 38 38 37
Other liquid fuels LPG 20 20 20
Biomass FF 51 38 33 AP-42 wood waste
ESP 28 21 18
(4) Source R Stewart (2006) US EPA AP 42 (1996) CEPMEIP (2006)
1A1 Energy industries
EMEPEEA air pollutant emission inventory guidebook 2019 108
Table 82a Emission factors for combustion processes burning hard coal
Fuel NAPFUE NFR Codes Activity description Activity detail (5) Emission factor
gGJ-1 Notes (6)
Hard coal TSP PM10 PM25
Bituminous
coal 101 Various
Electricity plant CHP
plant
FGD ESP or FF lt 20 mgNm-3 (BAT) 6 6 5 CEPMEIP
ESP (or FF) lt 50 mgNm-3 (LCPD) 15 12 6 Scaled from CEPMEIP ESP factor
ESP lt 100 mgNm-3 (LCPD) 30 25 12
From CEPMEIP sub-bit coal lsquohigh
efficiency ESPrsquo TSP scaled to the EU LCP
Directive existing plant sub 100 MWth limit
ESP Oldconventional
lt 500 mg Nm-3 140 70 17 CEPMEIP
Large unit with multicyclone 100 60 35 CEPMEIP
Large unit uncontrolled or cyclone 500 250 100
CEPMEIP (NB such a high emission
concentration would apply to few if any
plant)
Sub-
bituminous
coal
103 Various Electricity plant CHP
plant heat plant
FGD ESP or FF lt 20 mgNm-3 (BAT) 6 6 5 CEPMEIP
ESP (or FF) lt 50 mgNm-3 (LCPD) 15 12 6 Scaled from CEPMEIP ESP factor
ESP lt 100 mgNm-3 (LCPD) 30 25 12
From CEPMEIP sub-bit coal lsquohigh
efficiency ESPrsquo TSP scaled to LCPD
existing plant sub 100 MWth limit
ESP oldconventional
lt 500 mgNm-3 140 70 17 CEPMEIP
Conventional large unit with
multicyclone 100 60 35 CEPMEIP
Conventional unit uncontrolled or
cyclone 500 250 100
CEPMEIP (NB such a high emission
concentration would apply to few if any
plant)
Coke 107
Coke is unlikely to be burned as primary
fuel when co-fired use the factor for the
principal fuel
(5) KEY FGD flue gas desulphurisation ESP electrostatic precipitator FF fabric filter BAT Best Available Techniques LCPD large combustion plant data
(6) Sources R Stewart (2006) US EPA AP-42 (1996) CEPMEIP (2006)
1A1 Energy industries
EMEPEEA air pollutant emission inventory guidebook 2019 109
Table 82b Emission factors for combustion processes burning brown coal
Fuel
NAPFUE NFR Code Activity description Activity detail Emission factor
ReferenceComments
TSP PM10 PM25
Brown coal 105 Various Electricity plant CHP
plant heat plant
FGD ESP or FF lt 20 mgNm-3 (BAT) 9 8 6 CEPMEIP
High efficiency ESP (or FF) 40 30 14
CEPMEIP (NB such a high emission
concentration would apply to few if any
plant)
Conventional large unit with
multicyclone 100 60 35
CEPMEIP (NB such a high emission
concentration would apply to few if any
plant)
Older ESP 160 80 20
CEPMEIP (NB such a high emission
concentration would apply to few if any
plant)
Older installation uncontrolled or
cyclone 500 250 100
CEPMEIP (NB such a high emission
concentration would apply to few if any
plant)
Peat 113 Various Electricity plant CHP
plant heat plant
BATnew LCPD modern end-of-
pipe abatement FGD ESP or FF
lt 30 mgNm3
9 8 6 CEPMEIP
Efficient abatement LCP larger
facility lt 50 mgNm3 20 15 10
TSP scaled from LCP emission limit of
50 mgNm-3
Efficient abatement LCP
lt 100 MWth lt 100 mgNm3 40 30 20
TSP scaled from LCP emission limit of
50 mgNm-3
Conventional technology 120 40 20 CEPMEIP
Conventional smaller
multicyclone 300 40 20 CEPMEIP
1A1 Energy industries
EMEPEEA air pollutant emission inventory guidebook 2019 110
Table 82c Emission factors for combustion processes burning other solid fuels
Fuel
NAPFUE NFR Code Activity description Activity detail Emission factor Reference
TSP PM10 PM25
Municipal
solid waste
114 Various Electricity plant CHP
plant heating plant
Effective emission control (BAT) 15 13 10
CEPMEIP (NB care should be taken using this
factor as waste burning is often controlled
under nationalinternational regulation to a
more stringent specification)
(Solid) Conventional emission control 100 70 55
CEPMEIP (uncontrolled optimised combustion)
(NB care should be taken using this factor as
waste burning is often controlled under
nationalinternational regulation to a more
stringent specification)
Industrial
Waste 115 Various
Electricity CHP
heating plant
Effective emission control (BAT) 15 13 10
CEPMEIP (NB care should be taken using this
factor as waste burning is often controlled
under nationalinternational regulation to a
more stringent specification)
Conventional emission control 100 70 55
CEPMEIP (uncontrolled optimised combustion)
(NB care should be taken using this factor as
waste burning is often controlled under
nationalinternational regulation to a more
stringent specification)
Table 82d Emission factors for combustion processes burning natural gas
Fuel (IPCC
Cat)
NAPFUE NFR Code Activity description Activity detail Emission factor Reference
TSP PM10 PM25
Natural gas 301 Various Electricity CHP and heating
plant
Burner with optimised combustion 01 01 01 CEPMEIP
Conventional installation 02 02 02 CEPMEIP
Conventional installation 09 09 09 USEPA AP-42 filterable PM (all PM stated to
be PM1 )
1A1 Energy industries
EMEPEEA air pollutant emission inventory guidebook 2019 111
Table 82e Emission factors for combustion of derived gases
Fuel
(IPCC Cat) NAPFUE NFR Code Activity description Activity detail Emission factor
Reference
TSP PM10 PM25
Gas works
gas 311 Various
Electricity CHP and
heating plant
Clean fuel efficient combustion 01 01 01 CEPMEIP
Clean fuel conventional
installation 02 02 02
CEPMEIP (conventional
installation)
Conventional installation 5 5 5 CEPMEIP (NB high PM due
to fuel quality)
Other
gaseous fuel 314 Various
Electricity CHP and
heating plant
Clean fuel efficient combustion 01 01 01 CEPMEIP
Conventional installation 5 5 5
CEPMEIP
Coke oven
gas 304 Various
Electricity CHP
heating plant coke
ovens
Clean fuel efficient combustion 01 01 01 CEPMEIP
Clean fuel conventional
installation 02 02 02
CEPMEIP (conventional
installation)
Conventional installation 5 5 5 CEPMEIP
Blast furnace
gas 305 Various
Electricity CHP and
heating plant coke
ovens
Clean fuel efficient combustion 01 01 01 CEPMEIP
Clean fuel conventional
installation 02 02 02
CEPMEIP (conventional
installation)
Conventional installation 5 5 5 CEPMEIP
1A1 Energy industries
EMEPEEA air pollutant emission inventory guidebook 2019 112
Table 82f Emission factors for combustion of heavy fuel oil
Fuel
(IPCC Cat) NAPFUE NFR Code Activity description Activity detail Emission factor
Reference
TSP PM10 PM25
Residual fuel
oil 203 Various
Electricity CHP and
heating plant
Low S fuel with optimised
burner or abatement 3 3 25
CEPMEIP (equivalent to about 10 mgNm3 or
BAT)
Low S fuel efficient
combustion 14 12 10
CEPMEIP about 50 mgNm3 (EU LCPD limit
for existing plant)
Low-medium S fuel
conventional installation 20 15 9
CEPMEIP (equivalent to about 70mgNm3
Low-medium S fuel
conventional installation 60 50 40
CEPMEIP the higher of two entries used
about 200 mgNm3
High S fuel 210 190 130
CEPMEIP the lower of two entries for high S
used (NB such a high emission
concentration 750 mgNm3 would apply to
few if any plant)
Petroleum
coke 110 1A1b Oil refineries Conventional multicyclone 100 60 35
CEPMEIP NB the factor is very high
compared to the EU LCP Directive ELVs and
BAT for large furnaces Bit coal factors more
appropriate
1A1 Energy industries
EMEPEEA air pollutant emission inventory guidebook 2019 113
Table 82g Emission factors for combustion of other liquid fuels
Fuel
(IPCC Cat) NAPFUE NFR Code Activity description Activity detail Emission factor
Reference
TSP PM10 PM25
Gasdiesel oil 205 Various Electricity CHP
heating plant
Optimised burner 2 2 2 CEPMEIP
Conventional burner 5 5 5 CEPMEIP
Naphtha 210 1A1b Oil refineries All units 5 5 5 CEPMEIP
Liquefied
petroleum gas 303 Various
Electricity CHP
heating plant
Optimised burner 01 01 01 CEPMEIP
Conventional burner 5 5 5 CEPMEIP
Refinery gas 308 Various Electricity CHP
heating plant
Optimised burner 01 01 01 CEPMEIP
Conventional burner 5 5 5 CEPMEIP
Other oil 224 Various Electricity CHP
heating plant
Low S fuel optimised burner 3 3 25 CEPMEIP
Low S fuel efficient combustion 14 12 10 CEPMEIP for residual oil About 50 mgNm3
(LCPD limit for existing plant)
Low-medium S fuel conventional
installation 20 15 9
CEPMEIP (equivalent to about 70 mgNm3
Low-medium S fuel conventional
installation 60 50 40
CEPMEIP (highest of similar entries with
TSP of 35 40 50 and 60 used About
200 mgNm-3)
High S fuel 210 190 130
CEPMEIP lower of two entries for high S
used (NB this is a very high emission
concentration ~750 mgNm3)
1A1 Energy industries
EMEPEEA air pollutant emission inventory guidebook 2019 114
Table 82h Emission factors for combustion of biomass
Fuel
(IPCC Cat) NAPFUE NFR Code Activity description Activity detail Emission factor
Reference
TSP PM10 PM25
Wood 111 Various Electricity CHP
heating plant
Modern BAT unit
lt 20 mgNm3 TSP 7 7 6
TSP scaled from BAT benchmark fractions
applied based on bit coal
Older unit lt 100 mgNm3 TSP 35 25 12 TSP scaled from emission concentration
fractions based on bit coal
Uncontrolled conventional 100 70 55 CEPMEIP (equivalent to an uncontrolled
multicyclone)
Charcoal 112 1A2c Chemicals Conventional large unit with
multicyclone 100 60 35
CEPMEIP (NB the use of charcoal in LCP is
likely to be rare
Black liquour 215 1A2f Textile and leather
(pulp and paper ) Conventional installation 160 150 150
CEPMEIP (NB such a high emission
concentration would apply to few if any
plant)
Biogas 309 Various Electricity CHP
Heating plant
Modern optimised large
installation 3 3 25
CEPMEIP (cleaned fuel)
Conventional burner 5 5 5 CEPMEIP
Modern optimised 20 15 10 CEPMEIP (gasification plant) seems high
for gaseous fuel
Conventional installation 160 150 150
CEPMEIP (NB such a high emission
concentration would apply to few if any
plant)
1A1 Energy industries
EMEPEEA air pollutant emission inventory guidebook 2016 115
Chapter B111(S3)PMv3
Default emission factors for use with simpler methodology (Tier 1)
Fuel Technology Emission factor gGJ-1 Notes
TSP PM10 PM25
Hard coal - - - Not applicable
Brown coal - - - Not applicable
Other solid fuels - - - Not applicable
Natural gas Gas turbines 09 09 09 US EPA
Spark ignition 18 18 18 US EPA 2-stroke lean burn 4-stroke lean burn is 004 gGJ-1
Derived gases Gas turbine 11 11 11 Based on US EPA landfill gas
Heavy fuel oil Diesel 28 23 22 US EPA factor for diesel engines
Other liquid fuels Gas turbine 20 20 20 US EPA factor for PM applied to other fractions
Diesel 28 23 22 US EPA
Biomass Gas turbine 11 11 11 Landfill gas
Gas turbine 57 57 57 Anaerobic digester gas
Table 92a Emission factors for gas turbines combustion processes
Fuel
NAPFUE NFR Codes Activity description Activity detail Emission factor gGJ-1 Notes
TSP PM10 PM25
Natural gas 09 09 09 Sierra (234 tests) assumed all
PM25
Gas oil 3 3 3 Sierra (15 tests) assumed all
PM25
1A1 Energy industries
EMEPEEA air pollutant emission inventory guidebook 2016 116
Table 92b Emission factors for compression ignition combustion processes
Fuel
(IPCC Cat) NAPFUE NFR Code Activity description Activity detail
Emission factor
gGJ-1
ReferenceComments
TSP PM10 PM25
Natural gas Dual fuel engine gas with HFO 11 11 11 LCP BREF assumed all PM25
Heavy fuel oil
Diesel engine 50 41 39 LCP BREF lsquoBATrsquo US EPA profile applied
Diesel engine lt 64 53 50 LCP BREF US EPA profile applied applicable to
older equipment
Gas oil
Diesel engine lt 002 S lt 26 21 20 LCP BREF US EPA profile
Diesel engine lt 17 14 14 Smaller unit with diesel particulate filter US EPA
profile