catchment area analysis of tarafeni river based on ...2researcher, krishnagar govt. college, nadia,...
TRANSCRIPT

International Journal of Science and Research (IJSR) ISSN: 2319-7064
ResearchGate Impact Factor (2018): 0.28 | SJIF (2018): 7.426
Volume 8 Issue 5, May 2019
www.ijsr.net Licensed Under Creative Commons Attribution CC BY
Catchment Area Analysis of Tarafeni River based
on Morphometric Characteristics, West Bengal,
India
Dr. Lila Mahato1, Sri Sanjit Mahanta
2
1Associate Professor, Post Graduate Department of Geography, Krishnagar Govt. College, Nadia, West Bengal, India
2Researcher, Krishnagar Govt. College, Nadia, West Bengal Nadia, West Bengal, India
Abstract: River Basin is considered as the fundamental unit of fluvial geomorphology as they are well-defined areas, clearly separated
from each other by drainage divides. The physical features of the basin with its erosional activities constitute the natural unit for the
analysis of fluvial-eroded landscapes. A river basin always represents an area drain by a main stream and its tributaries It represents a
set of networks, mostly tree-like, that consists of links and nodes. The networks are the combination of two aspects- topological, that
describes the connectivity of the streams and geometrical, that includes shape, length, area, relief, etc. Tarafeni basin and its course
form distinctive setting where the quantitative approach has been applied to understand the land forms in fluvial terrain. Entire
watershed, the main channel with left and right banks and stream beds consist a typical riverine landscape of silt, sand, pebble, cobble,
gravel, and boulders. Present study looks into the systematic and analytical study of the morphological characteristics of the catchment.
Keywords: River Network, morphometric analysis, Tarafeni river, quantitative approach
1. Introduction
The study of river basin has always been considered as an
important aspect since the inception of civilization. The
catchment area from where river collects its water influences
the people living within the region itself. Therefore proper
understanding of the rivulets, streams and river is of utmost
importance in developing and implementing watershed
plans. The river basin, being a fundamental geomorphic unit
(Chorley, 1969), portrays distinctive geometrical features
and processes. Systematic and quantitative measurement of
various parameters of the river basin in terms of relief, linear
and areal aspects help largely to assess hydrological
behavior of the basin. Morphometric analysis is the way for
better understanding of spatial characteristics of river. The
word morphometry means ‘measurement of form’, derived
from ‘morpho’ (form) and ‘metry’ (measurement). The
techniques related to the form measurements in
geomorphology include measurement of large number of
variables, spatial pattern and forms of the landform.
Clarke observed that since World War II, morphometry has
entered a phase of micro-morphometry with the introduction
of more micro level studies being ‘closely associated with
dynamic geomorphology’. Basically, morphometry includes
the analysis of quantitative and qualitative variables. The
quantitative variables are – Linear aspects, Areal aspects and
Relief aspect and qualitative variables are – geology,
structure, soil type, vegetation, landform type, terrace, water
divide, drainage type, flood plain etc.
2. The identity of Study Area
The undulating tracts of Belpahari area of Binpur II and
Binpur I block of Jhargram District display lateritic soil and
a large number of streamlets and rivulets. The monsoonal
channels flows down the slope and bring water into the next
ordered streams. Most of the streams are non perennial in
nature. River Tarafeni, a 5th
order stream and tributary to the
river Kangsabati, flows over the rugged surface for a length
of about 48.7 km. It joins the Bhairabbanki river and meet
Kangsabati. Its absolute location is within 22°34´12´´ N to
22°44´0´´N and 82°30´29´´ E to 86°33´55´´E and falls in the
jurisdiction of Belpahari and Binpur Police Station.
Figure 1: Location Map of the Study Area
Physiographically, it is located in the eastern end of the
Choto Nagpur plateau .The area gradually slopes down over
undulating terrain with infertile laterite soil. The basin
experiences hot, humid climate with high temperature in
Paper ID: ART20198072 10.21275/ART20198072 1428

International Journal of Science and Research (IJSR) ISSN: 2319-7064
ResearchGate Impact Factor (2018): 0.28 | SJIF (2018): 7.426
Volume 8 Issue 5, May 2019
www.ijsr.net Licensed Under Creative Commons Attribution CC BY
summer months. The rainfall is poor to moderate in March
to July; the average annual rainfall in the basin is 1,247mm.
The vegetation of the basin is tropical deciduous plant
species.
Table 1: Brief Profile of River Tarafeni
S. No. Parameters Values
1 Basin Area 529.05 Sq.Km
2 Perimeter 1268.71 Km
3 Number of 1st order streams 239
4 Number of 2nd order streams 68
5 Number of 3rd order streams 14
6 Number of 4th order streams 4
7 Total stream length 48.7 Km
8 Drainage Density 0.1598 Km/Sq.Km
10 Relative relief 190 m
12 Circulatory Ratio 0.2348
14 Elongation Ratio 0.5105
3. Objectives
The major objectives of the study include
1) To find out the geomorphic characteristics and to
quantify different attributes of the Tarafeni River Basin.
2) To analyse the morphometric parameters of the basin.
4. Methodology
The morphometric analysis of this study area have
commonly undertaken with the help of Survey of India (S. O.
I.) topographical sheet, numbered 73/J- 9, 73/J- 10, 73/J-13,
73/J-14 on a scale of 1 50,000 ׃ with the contour intervals of
20 m. The database is created using various techniques for
the watershed management. The maps are prepared by geo-
referencing and digitization from SOI toposheets. The
Survey of India toposheets of scale 1: 50,000 and DEM
(Digital Elevation Model) is used for delineating the
watershed boundary. Maps have been prepared by TNT
Mips software. The stream order has been assigned by
following Strahler’s (1964) stream ordering technique. The
drainage basin characteristics help in deciphering and
understanding the interrelated relief and slope properties.
The DEM has been prepared using the Cartosat-1 (DEM)
data and GIS techniques to understand the relief, slope and
flow direction.
The numbers of streams of different order in the watershed
has been counted and their lengths from source to
confluence are measured with the help of GIS software
(TNT Mips). Different quantitative attributes (table:2) have
been analysed based on various aspects of the cat
Table 2: Quantitative parameters of the Basin
Linear Aspect (One
Dimension)
Areal Aspect (Two
Dimensions)
Relief Aspect (Three
Dimensions)
Stream Ordering Basin Shape Relative Relief (Rr)
Stream Length (Lu) Drainage Density (Dd) Relief Ratio (R)
Mean Stream
Length Stream Frequency (Fs)
Ruggedness number
(Rn)
Stream Length
Ratio (RL)
Horton’s Form Factor
(F) Dissection Index (DI)
Bifurcation Ratio
(Rb)
V.C.Miller’s
Circularity Ratio (Rc)
5. Morphometric Characteristics and
Quantitative analysis of the watershed
Morphometry is the measurement and analysis of shape of
the river basin. This helps to discover holistic inherent
properties of various stream attributes. It is important to
appraise the characteristics of a basin. Another important
property of catchment area is its hierarchical nature. Each
tributary in this system has its own basin area contributing
runoff. Following the pioneer work of R.E. Horton (1945)
and A.N. Strahler (1952), many of the important properties
of river can be expressed quantitatively. All this helps to
compare one basin with another. Such quantitative
description is termed as morphometric attributes and can be
applied to the area and relief properties of basins as well as
the characteristics of the river channel systems.
Fluvial morphometry has become a fundamental concern of
post-war geomorphological research in US, UK and is being
widely used in other areas, especially India (Vaidyanadhan,
1977), Brazil, Austalia and Canada. The analysis basically
consists of several stages, like network delimitation,
sampling, measurement, variable definition and analysis
(Gardiner, 1975). Tarafeni catchment has a large number
of variable of its linear, areal and relief properties.
5.1 Linear Aspect (One Dimension)
The linear aspects of basin include stream order, stream
length, mean stream length, stream length ratio and
bifurcation ratio. Actually, river networks with its
differential channel pattern and orientation impacts the
landscape of the river. Various drainage patterns are the
result of the underlying structure but the surface expression
is quite interesting in nature.
5.1.1. Stream Order (u)
There are four different system of ordering streams that are
available [Gravelius (1914), Horton (1945), Strahler (1952)
and Schideggar (1970)]. Strahler’s system, which is a
slightly modified form of Horton’s system, has been
followed because of its simplicity, where the smallest,
unbranched fingertip streams are designated as 1st order, the
confluence of two 1st order channels give a channels
segments of 2nd order, two 2nd order streams join to form a
segment of 3rd order and so on. When two channel of
different order join, then the higher order is maintained. The
trunk stream is the stream segment of highest order. It is
found that Tarafeni river is 5th order (figure: 2). In all, 326
streams were identified in the entire basin. Of which 239 are
first order, 68 are second order, 14 are third order, and 4 in
fourth order and 1 is fifth order (table:3). Drainage patterns
of stream network have been observed as mainly of dendritic
type which indicates the homogeneity in texture and lack of
structural control.
Paper ID: ART20198072 10.21275/ART20198072 1429

International Journal of Science and Research (IJSR) ISSN: 2319-7064
ResearchGate Impact Factor (2018): 0.28 | SJIF (2018): 7.426
Volume 8 Issue 5, May 2019
www.ijsr.net Licensed Under Creative Commons Attribution CC BY
Figure 2: Stream Ordering followed by Strahler’s method
5.1.2. Stream Length (Lu)
The stream length (Lu) has been computed based on the law
proposed by Horton. It is one of the most significant
hydrological features of the basin as it reveals surface runoff
characteristics. The stream of relatively smaller length is
characteristics of areas with greater slopes and finer textures.
Longer lengths of streams are generally indicative of flat
gradient. Generally, the total length of stream segments is
maximum in first order stream and decreases as stream order
increases. The total length of all first order streams is
172.663 km, second order stream is 94.787 km, third order
stream is 50.569 km, fourth order 13.03 km and fifth order
stream is 43.514 km. The change may indicate flowing of
streams from high altitude, lithological variation and
moderately steep slopes (Singh, 1997). The observation of
stream order verifies the Horton’s law of stream number i.e.
the number of stream segment of each order forms an
inverse geometric sequence with order number. Horton
applied morphometric analysis to the stream attributes of
basin which is known as the Laws of drainage composition.
The regression line indicates Horton’s Law of Stream
Numbers. It shows that Number of streams decreased to
higher orders causing a negative functional relationship (r =
0.84). As the stream order increases, the number of streams
decreases (figure: 3). Remarkable departure in 1st order
streams here means more tributaries join in upper reaches.
But departure in 2nd
and 3rd
order signifies lesser number of
streams than the normal.
Figure 3: Relationship between stream order and number of
streams
5.1.3. Mean Stream Length (Lsm)
The mean stream length is a characteristic property related
to the drainage network and its associated surfaces (Strahler,
1964). The mean stream length (Lsm) has been calculated by
dividing the total stream length of order by the number of
stream. The mean stream length of study area is 0.72 km for
first order, 1.39 km for second order, 3.61km for third order,
3.26 km for fourth order and 43.514 km for fifth order. The
mean stream length of stream increases with increase of the
order (Figure 4).
Figure 4: Relationship between stream order and stream
length
The 1st order stream segments of have shorter length but the
mean length increases with the increasing order. This
follows the general rules of Laws of Stream Length of
Horton. Total stream lengths continue to decrease from the
1st order to successive higher orders. Mean stream length of
river Tarafeni and its order present a direct relationship (r =
0.75). Mean stream length increase with increase in order.
5.1.4. Stream Length Ratio (RL)
The stream length ratio can be defined as the ratio of the
mean stream length of a given order to the mean stream
length of next lower order and has an important relationship
with surface flow and discharge (Horton, 1945). The RL
values between streams of different order in the basin reveal
that there are variations in slope and topography. The stream
length ratio of study area is 0.003 for first order, 0.021 for
second order, and 0.26 for third order, 0.81 for fourth order
Paper ID: ART20198072 10.21275/ART20198072 1430

International Journal of Science and Research (IJSR) ISSN: 2319-7064
ResearchGate Impact Factor (2018): 0.28 | SJIF (2018): 7.426
Volume 8 Issue 5, May 2019
www.ijsr.net Licensed Under Creative Commons Attribution CC BY
and 43.51 for fifth order. The mean stream length of stream
increases with increase of the order of the stream. Mean
length ratio of the basin varies a little and shows the
dependence on relief. Drainage network is developed in
orderly manner and the basin is shaped by the process of
lateral planation. 5.1.5. Bifurcation Ratio (Rb)
Bifurcation ratio (Rb) may be defined as the ratio of the
number of stream segments of given order to the number of
segments of the next higher order (Schumn 1956). Horton
(1945) considered the bifurcation ratio as an index of relief
and dissections. Strahler (1957) demonstrated that the
bifurcation ratio shows a small range of variation for
different regions or different environmental conditions,
except where the geology dominates. It is observed that Rb is
not the same from one order to its next order. In the study
area, mean Rb varies from 3.51 to 4 and the mean Rb of the
entire basin is 3.97 (table 3). Usually these values are
common in the areas where geologic structures do not
exercise a dominant influence on the drainage pattern.
Table 3: Empirical Study of the river Catchment Stream
Order
(u)
Number
of
Streams
(Nu)
Bifurcation
Ratio
(Rb)
Total
Length
in km
(Lu)
Mean
length
km
(Lsm)
Cumulative
Mean
Length in
km
No. of
Stream
(%)
1 239 172.66 0.72 0.72 73.31
2 68 3.51 94.78 1.39 2.11 20.86
3 14 4.85 50.57 3.61 5.72 4.28
4 4 3.50 13.03 3.25 8.98 1.22
5 1 4.00 43.51 43.51 52.49 0.33
Total 326 Mean -3.97 52.49
5.2. Areal Aspect (Two Dimensions)
It deals with the total area projected upon a horizontal plane
contributing overland flow to the channel segment of the
given order and includes tributaries of lower order. Total
area of the catchment is 529 sq. km (approx.) as measured
with the help of GIS software and from the survey of India
toposheets. It comprises of basin shape, drainage density,
drainage texture, stream frequency, form factor, circularity
ratio, elongation ratio and length of overland flow.
According to the Law of Basin Area as propounded by
Horton, the first order basins have the smallest mean basin
area and the successive higher order represents an increase
in areas. It signifies the main river i.e. the 5th
order possess
the largest basin area. The regression line is drawn to test
the validity of positive exponential function model of the
Law of Basin Area that clearly indicate a negative
relationship (r =0.73) with some departure from normal
(figure: 5).
Figure 5: Relation between mean basin area and stream
order
5.2.1 Basin Shape
The geometry of basin shape is of paramount significance as
it helps in the description and comparison of different forms
of basins. The ideal drainage basin is usually of pear shaped
but since it is dependent on the size and the length of the
master stream and basin perimeter, the differences also been
observed. The other variables such as absolute relief, slope,
geological structure and lithology etc. also are important
determinant. Thus, various methods have been suggested to
calculate the shapes of the basin. Different popular methods
of computation are as follows- i) Horton’s Form
Factor(1932), ii) Stoddart’s Elipticity Index, iii) V. C.
Miller’s Circularity Index, iv) S. A. Schumm’s Elongation
Ratio.
Horton’s Form Factor (F)
Form factor (F) is defined as the ratio of the basin area to the
square of the basin length. This factor indicates the flow
intensity of a defined area (Horton, 1945).
F = A
Lb 2 Where, F = Form factor indicating elongation
of the basin shape,
A = Basin area, Lb = Basin length.
The form factor value should be always less than ‘1’ (the
value corresponding to a perfectly circular basin). The
smaller value’0’ of the form factor, the more elongated will
be the basin. Basins with high form factors experience larger
peak flows of shorter duration, whereas elongated
watersheds with low form factors experience lower peak
flows of longer duration. The F value for study area is 0.38,
indicating highly elongated basin with lower peak flows of
longer duration than the average.
Circularity Ratio (Rc)
Circularity Ratio is the ratio of the area of a basin to the area
of circle having the same circumference as the perimeter of
the basin (Miller, 1953). The value of Rc varies ‘0’ (a line)
to ‘1’ (a circle). It is influenced by the length and frequency
of streams, geological structures, land use/ land cover,
climate and slope of the basin.
Where, Rc = Circularity Index.
The Rc value of whole basin is 0.46 and it indicate the area
is characterized by elongated one with moderate to low
relief (table: 5) and drainage system seems to be less
influenced by structural disturbances. The high value of
circularity ratio shows the late maturity stage of topography.
Paper ID: ART20198072 10.21275/ART20198072 1431

International Journal of Science and Research (IJSR) ISSN: 2319-7064
ResearchGate Impact Factor (2018): 0.28 | SJIF (2018): 7.426
Volume 8 Issue 5, May 2019
www.ijsr.net Licensed Under Creative Commons Attribution CC BY
The Rc value of different order basin has been displayed in
the (figure: 6)
Figure 6: Circularity ratio of 1
st, 2
nd , 3
rd and 4
th order
streams
Elongation Ratio (Re)
Schumm (1956) defined elongation ratio as the ratio of
diameter of a circle of the same area as the drainage basin
and the maximum length of the basin. The ratio is measured
by the following equation
Values of Re generally vary from 0.6 to 1.0 over a wide
variety of climatic and geological formation. Re values close
to unity correspond typically to regions of low relief,
whereas values in the range 0.6–0.8 are usually associated
with high relief and steep ground slope (Strahler 1964).
These values can be Grouped into three categories namely
(a) circular (> 0.9), (b) oval (0.9 - 0.8), (c) less elongated (<
0.7). The Re values in the study area is 0.64 indicates
moderate to less slope ground and area when collaborated
with Strahler’s range seem to suggest an elongated shape
(table: 5).
5.2.2. Drainage Density (Dd)
Horton (1932), introduced the drainage density (Dd) is an
important indicator of land form elements in stream eroded
topography. Stream length per unit area is called drainage
density (Horton, 1945)..The drainage density indicates the
closeness of spacing of channels, thus providing a
quantitative measure of the average length of stream channel
for the whole basin.
It has been observed from drainage density measurement
made over a wide range of geologic and climatic type that a
low drainage density is more likely to occur in region of
highly resistant of highly permeable subsoil under dense
vegetative cover and where relief is low. High drainage
density is the resultant of weak or impermeable subsurface
material, sparse vegetation and mountainous relief. Low
drainage density leads to coarse drainage texture while high
drainage density leads to fine drainage texture (Strahler,
1964).The drainage density (Dd) of study area is 0.160
km/Sq.km indicating the basin possess highly permeable
subsoil and vegetative cover (Nag, 1998).
Figure 6: Drainage density of 1
st, 2
nd , 3
rd and 4
th order basin
5.2.3. Stream Frequency (Fs)
Stream frequency (Fs), is expressed as the total number of
stream segments of all orders per unit area.
Fs = 𝐍𝐮
𝐀 (Horton, 1945), Where, Nu = Total number of
streams in all order and A = Area of the basin. It exhibits
positive correlation with drainage density in the watershed
indicating an increase in stream number with respect to
increase in drainage density. The Fs for the basin is 1.19
streams/ sq.km.
Paper ID: ART20198072 10.21275/ART20198072 1432

International Journal of Science and Research (IJSR) ISSN: 2319-7064
ResearchGate Impact Factor (2018): 0.28 | SJIF (2018): 7.426
Volume 8 Issue 5, May 2019
www.ijsr.net Licensed Under Creative Commons Attribution CC BY
5.2.4 Drainage Texture (RT) Horton (1945) stated drainage texture is the total number of
stream segments of all orders per perimeter of that area.
Which are simply define as following equation
RT = Nu
P (Horton, 1945), Where, RT= Drainage Texture, Nu
= Total number of streams in all order and P = Perimeter of
the watershed. Here, the value of ‘RT’ is 2.60, which denotes
the course drainage texture (Smith, 1950).
Table 5: Areal aspects of Tarafeni basin River
order
Mean relative
relief (m)
Drainage
density
Relief
ratio
Circularity
ratio
Elongation
ratio
1 11.74 3.79 0.01 0.64 0.59
2 22.05 0.25 0.01 0.84 0.95
3 65.00 0.19 0.01 0.51 0.67
4 90.00 0.24 0.01 0.24 0.41
5 190.00 0.05 0.00 0.49 0.60
Tarafeni basin 0.005 0.46 0.64
5.3 Relief Aspect (Three Dimensional)
The relief aspects of the drainage basin are three directional
features including area, volume and altitude of vertical
dimension where different morphometric methods are used
to analysis terrain characteristics. There is a close
relationship among drainage density, mean slope and relief.
Difference in elevation between the highest and lowest point
in a basin is termed as relief. Relief of an area influences the
slope and stream gradient involving the slope processes,
erosion, transportation and deposition. Increase in relief is
due to incision of streams.
Figure 7: DEM showing altitudinal zones
5.3.1. Relative Relief (Rr)
Relative relief termed as ‘amplitude of available relief’ or
‘local relief’ and is defined as difference in heights between
the highest and the lowest point of any area. M. A. Milton
(1957) suggested to calculate relative relief by dividing the
difference of the height between the highest and lowest
points. The maximum elevation of the basin lie near the
source area and it is 260 m. At the point where the main
river meets Bhairabbanki is the lowest elevation point .The
relief at confluence is 70 m. First order and second order
basins shows very little variation in relief while the third
order and fourth order stream exhibits comparatively larger
variation ( figure 8)
Figure 8: Relative relief of 1
st, 2
nd , 3
rd and 4
th order basin
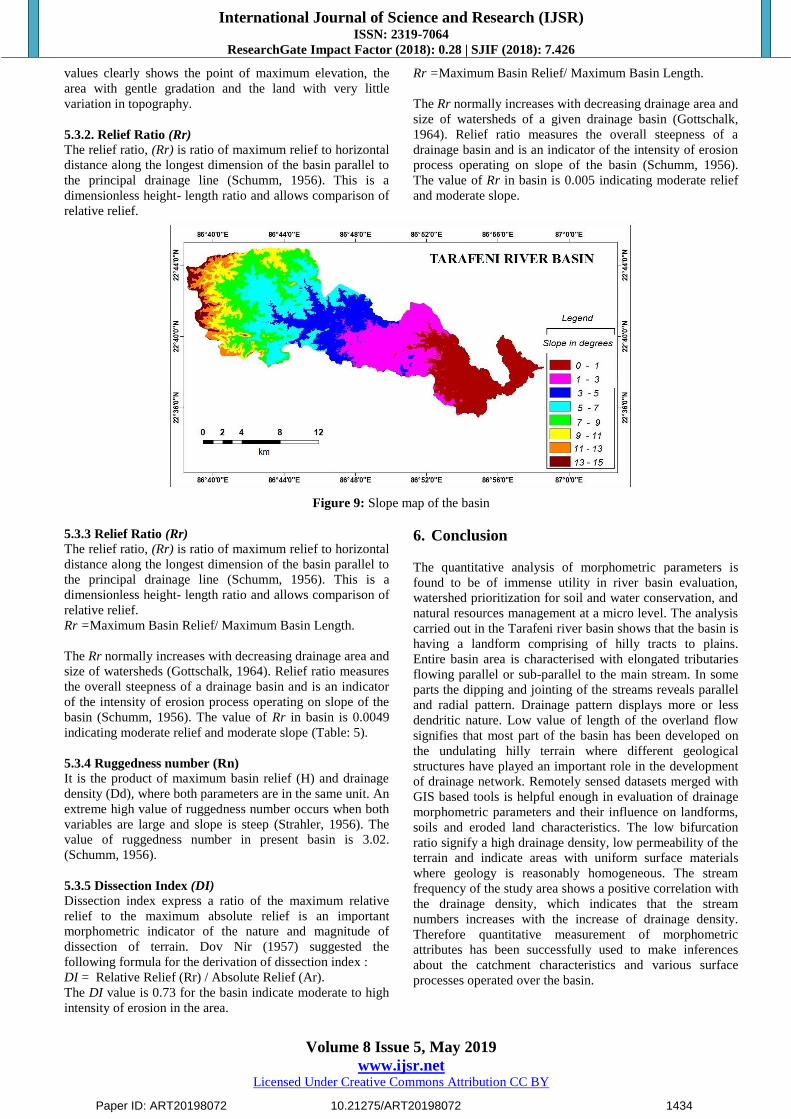
The slope map (Figure: 9) of the basin clearly points out the
maximum slope direction with small inlet’s slope pattern in
various other direction. The slope condition with variation in
relief obviously directs the stream and streamlets to
accumulate their water in well distinguished flow channels.
Relief controls the rate of conversion of potential to kinetic
energy of water draining through the basin. Run-off is
generally faster in steeper basins, producing more peaked
basin discharges and greater erosive power. The DEM
produced by TNT Mips software considering the contour
Paper ID: ART20198072 10.21275/ART20198072 1433
International Journal of Science and Research (IJSR) ISSN: 2319-7064
ResearchGate Impact Factor (2018): 0.28 | SJIF (2018): 7.426
Volume 8 Issue 5, May 2019
www.ijsr.net Licensed Under Creative Commons Attribution CC BY
values clearly shows the point of maximum elevation, the
area with gentle gradation and the land with very little
variation in topography.
5.3.2. Relief Ratio (Rr)
The relief ratio, (Rr) is ratio of maximum relief to horizontal
distance along the longest dimension of the basin parallel to
the principal drainage line (Schumm, 1956). This is a
dimensionless height- length ratio and allows comparison of
relative relief.
Rr =Maximum Basin Relief/ Maximum Basin Length.
The Rr normally increases with decreasing drainage area and
size of watersheds of a given drainage basin (Gottschalk,
1964). Relief ratio measures the overall steepness of a
drainage basin and is an indicator of the intensity of erosion
process operating on slope of the basin (Schumm, 1956).
The value of Rr in basin is 0.005 indicating moderate relief
and moderate slope.
Figure 9: Slope map of the basin
5.3.3 Relief Ratio (Rr)
The relief ratio, (Rr) is ratio of maximum relief to horizontal
distance along the longest dimension of the basin parallel to
the principal drainage line (Schumm, 1956). This is a
dimensionless height- length ratio and allows comparison of
relative relief.
Rr =Maximum Basin Relief/ Maximum Basin Length.
The Rr normally increases with decreasing drainage area and
size of watersheds (Gottschalk, 1964). Relief ratio measures
the overall steepness of a drainage basin and is an indicator
of the intensity of erosion process operating on slope of the
basin (Schumm, 1956). The value of Rr in basin is 0.0049
indicating moderate relief and moderate slope (Table: 5).
5.3.4 Ruggedness number (Rn)
It is the product of maximum basin relief (H) and drainage
density (Dd), where both parameters are in the same unit. An
extreme high value of ruggedness number occurs when both
variables are large and slope is steep (Strahler, 1956). The
value of ruggedness number in present basin is 3.02.
(Schumm, 1956).
5.3.5 Dissection Index (DI)
Dissection index express a ratio of the maximum relative
relief to the maximum absolute relief is an important
morphometric indicator of the nature and magnitude of
dissection of terrain. Dov Nir (1957) suggested the
following formula for the derivation of dissection index :
DI = Relative Relief (Rr) / Absolute Relief (Ar).
The DI value is 0.73 for the basin indicate moderate to high
intensity of erosion in the area.
6. Conclusion
The quantitative analysis of morphometric parameters is
found to be of immense utility in river basin evaluation,
watershed prioritization for soil and water conservation, and
natural resources management at a micro level. The analysis
carried out in the Tarafeni river basin shows that the basin is
having a landform comprising of hilly tracts to plains.
Entire basin area is characterised with elongated tributaries
flowing parallel or sub-parallel to the main stream. In some
parts the dipping and jointing of the streams reveals parallel
and radial pattern. Drainage pattern displays more or less
dendritic nature. Low value of length of the overland flow
signifies that most part of the basin has been developed on
the undulating hilly terrain where different geological
structures have played an important role in the development
of drainage network. Remotely sensed datasets merged with
GIS based tools is helpful enough in evaluation of drainage
morphometric parameters and their influence on landforms,
soils and eroded land characteristics. The low bifurcation
ratio signify a high drainage density, low permeability of the
terrain and indicate areas with uniform surface materials
where geology is reasonably homogeneous. The stream
frequency of the study area shows a positive correlation with
the drainage density, which indicates that the stream
numbers increases with the increase of drainage density.
Therefore quantitative measurement of morphometric
attributes has been successfully used to make inferences
about the catchment characteristics and various surface
processes operated over the basin.
Paper ID: ART20198072 10.21275/ART20198072 1434

International Journal of Science and Research (IJSR) ISSN: 2319-7064
ResearchGate Impact Factor (2018): 0.28 | SJIF (2018): 7.426
Volume 8 Issue 5, May 2019
www.ijsr.net Licensed Under Creative Commons Attribution CC BY
References
[1] Chorley, R. J., Malm, D. E., Pogorzelski, H. A. (1957).
A New Standard for estimating Drainage Basin
shape. American Journal of Science, 255(2), 138-141.
[2] Dury, G.H. 1966, Essays in Geomorphology,
Heinemann, London.
[3] Horton, R. E. (1932). Drainage Basin
characteristics. Eos, transactions American geophysical
union, 13(1), 350-361.
[4] Horton, R. E. (1945). Erosional Development of
Streams and their Drainage Basins; Hydrophysical
approach to Quantitative Morphology. Geological
society of America bulletin, 56(3), 275-370.
[5] Langbein W. B, et al (1947): Topographic
characteristics of drainage basins. USGS Water-
[6] Supply Paper,968-C, pp 125-158
[7] Leopold, L. B., Wolman, M. G.and Miller, J. P. (1964):
Fluvial process in geomorphology,
[8] Freeman, San Francisco, Calif.
[9] Miller, V. C. (1953). Quantitative Geomorphic study of
Drainage Basin Characteristics in the Clinch Mountain
area, Virginia and Tennessee. Technical report, No 3
(Columbia University. Department of Geology)
[10] Moriswa, M. (1985) Rivers: Forms and Processes,
Longman. Pp 137 - 155
[11] Schumm, S. A. (1956). Evolution of Drainage Systems
and slopes in badlands at Perth Amboy, New
Jersey. Geological society of America bulletin, 67(5),
597-646
[12] Sharma, H.S. (edtd), Perspective in Geomorphology-
vol. 2, Concept, New Delhi.
[13] Smith, K. G. (1950). Standards for Grading Texture of
Erosional Topography. American Journal of
Science, 248(9), 655-668.
[14] Strahler, A. N. (1952). Hypsometric (area-altitude)
Analysis of Erosional Topography. Geological Society
of America Bulletin, 63(11), 1117-1142.
[15] Strahler, A. N. (1964). Quantitative Geomorphology of
Drainage Basin and Channel networks. Handbook of
Applied Hydrology.
[16] Waikar, M. L., Nilawar, A. P. (2014). Morphometric
analysis of a drainage basin using geographical
information system: a case study. International Journal
of Multidisciplinary and Current Research, 2, 179
Paper ID: ART20198072 10.21275/ART20198072 1435