catalytic partial oxidation of methane to methanol using
TRANSCRIPT

1
Catalytic Partial Oxidation of Methane to Methanol Using
Nitrous Oxide
Akanksha Tyagi
A Dissertation Submitted to
Indian Institute of Technology Hyderabad
In Partial Fulfillment of the Requirements for
The Degree of Master of Science
Department of Chemistry
April, 2014

2
3

4
Acknowledgements
It is my immense pleasure to express my gratitude to Dr. Ch. Subrahmanyam for his
constant inputs and encouragement that helped me to complete this project
successfully. I would also like to thank Department of Chemistry, IIT Hyderabad for
providing me financial support.
This journey would not have been so smooth and informative without the healthy lab
environment provided by my lab mates. I extend my sincere thanks to Mrs. Shaik
Mahammadunnisa and other research scholars for helping me out throughout the
project.
Above all I would like to thank god and my parents for their unconditional support.
Without them I would not have been a fraction of what I am today.
Akanksha Tyagi

5
Dedicated to
My Parents
And
Sister

6
Abstract
Partial oxidation of methane to methanol using nitrous oxide is an important reaction which
has the potential of curbing the twin problems of energy and environment. Both the reactants
are major greenhouse gases and they can be made to react together to yield a product which
holds the potential to replace the existing non-renewable energy sources: coal and petroleum.
Partial oxidation of methane is usually done using steam reforming process. But because
practical limitations, this method is not used on industrial scale. Hence the focus has shifted
to find new ways like thermal and plasma catalysis which could bring down the involved cost
and make the process free for general use. Lot of work has been reported on partial oxidation
of methane using N2O using thermal catalysis. But most of them involve the use of expensive
metals like Rh, Ru, Pt, Au etc.
This work was aimed to design an economical and novel catalyst which can carry out the
concerned reaction at low temperatures. We first prepared a series of cobalt oxide doped with
cerium oxide catalysts which were tested for decomposition of nitrous oxide and then the best
one among them was subjected to partial oxidation of methane. All the catalysts were
characterized using physic-chemical techniques like XRD, Raman spectroscopy, UV-Vis
spectroscopy, BET analysis and TPR. Also the best were analyzed using TEM and XPS too.
A pictorial representation of the work is shown in figure 1.
Figure 1: Pictorial representation of partial oxidation of methane to methanol

7
Nomenclature
Abbreviations
1. P-XRD: Powder X-ray Diffraction
2. UV: Ultraviolet
3. BET: Brunner Emmett Teller
4. TPR: Temperature Programmed Reduction
5. TEM: Transmission Electron Microscope
6. TPD: Temperature Programmed Desorption
7. TCD: Thermal Conductivity Detector
8. CCD: Charged Coupled Detector
9. SHS: Self propagating High temperature Synthesis
10. LCS: Low temperature Combustion Synthesis
11. SCS: Solution Combustion Synthesis
12. FS: Flame Synthesis
13. GS: Gel combustion Synthesis
14. SGC: Sol Gel Combustion
15. EC: Emulsion Combustion
16. VC: Volume Combustion
17. HREM: High Resolution Electron Microscopy
18. XPS: X-ray Photoelectron Spectroscopy
19. ESCA: Electron Spectroscopy for Chemical Analysis
20. GC-MS: Gas Chromatography Mass Spectrometer
21. GC-TCD: Gas Chromatography Thermal Conductivity Detector
22. FCC: Face Centered Cubic
23. LMCT: Ligand to Metal Charge Transfer
24. MFC: Mass Flow Controller
25. TWC: Three Way Catalysis
26. ZSM: Zeolite Socony Mobil
Symbols
1. α: Alpha
2. β: Beta
3. ɸ: Phi: Fuel: Oxidant ratio
4. ɸ0: Work function
5. λ: Wavelength

8
6. Ɵ: Theta
7. ν: Frequency
8. h: Planck constant
9. NA: Avogadro constant
10. Ea: Activation Energy
11. Å: Angstrom
12. μm: Micrometer
13. nm: Nanometer
14. mm: Millimeter
15. ml: Milliliter

9
Contents
List of figures 12
List of tables 12
1. Chapter 1: Introduction 13
1.1 Catalytic decomposition of N2O 13
1.2 Partial oxidation of methane 15
2. Chapter 2: Experimental section 17
2.1 Catalyst preparation methods 17
2.1.1. Hydrothermal synthesis 17
2.1.2. Coprecipitation synthesis 17
2.1.3. Combustion synthesis 18
2.2 Characterization techniques 19
2.2.1. X-ray diffraction for powder catalysts 19
2.2.2 Surface area determination: BET Analysis 20
2.2.3 Temperature Programmed Reduction 21
2.2.4 Raman Spectroscopy 21
2.2.5 Transmission Electron Microscopy (TEM) 22
2.2.6 X-ray Photoelectron Spectroscopy (XPS) 22
3. Chapter 3: Decomposition of nitrous oxide 24
3.1 Introduction 24
3.2 Experimental section 24
3.2.1 Preparation of Co3O4 24
3.2.1.1. Combustion synthesis: 24
3.2.1.2. Hydrothermal synthesis 25
3.2.1.3. Coprecipitation synthesis 25

10
3.2.2. Preparation of Ce/Co catalysts using SCS 25
3.3 Results and discussion 25
3.3.1 Characterization and activity measurements of Co3O4 26
3.3.1.1 P-XRD 26
3.3.1.2 Surface area determination 27
3.3.1.3. Raman Spectroscopy 27
3.3.1.4. UV Visible Spectroscopy 28
3.3.1.5. Temperature Programmed Reduction (TPR) 29
3.3.1.6. Activity measurement of Co3O4 29
3.3.2 Characterization and activity measurements of (xCeCo) catalysts 31
3.3.2.1 P-XRD 31
3.3.2.2 Determination of surface area (BET analysis) 33
3.3.2.3 TEM 33
3.3.2.4 XPS 34
3.3.2.5. Raman spectroscopy 34
3.3.2.6. UV-Visible spectroscopy 35
3.3.2.7. TPR 36
3.3.2.8. Activity measurement: 37
3.4 Conclusions 38
4. Chapter 4: Partial oxidation of methane using nitrous oxide 40
4.1 Introduction 40
4.2 Experimental section 40
4.2.1 Catalyst preparation: 40
4.2.2 Catalyst characterization 40
4.2.3. Activity measurements 41
4.3 Results and discussions 41

11
4.4 Conclusions 42
5. References 44

12
List of figures
Figure 1: Pictorial representation of partial oxidation of methane to methanol 6
Figure 2: Emission of X-rays 19
Figure 3: Electronic levels in an atom 23
Figure 4: A sample prepared using combustion synthesis 25
Figure 5: Activity measurement experimental setup 26
Figure 6: P-XRD patterns of Co3O4prepared by different methods 27
Figure 7: Raman spectra of Co3O4 28
Figure 8: UV-Vis. Spectra of Co3O4 28
Figure 9: TPR of Co3O4 29
Figure 10: Decomposition of nitrous oxide by Co3O4 30
Figure 11: XRD pattern of xCeCo catalysts 32
Figure 12: TEM image of (a) CeO2 and (b) 10CeCo catalyst 33
Figure 13: Core level XPS spectra of 10CeCo (a): Co (2p), (b): Ce (3d) 34
Figure 14: Raman spectra of xCeCo catalysts 35
Figure 15: UV-Visible spectra of xCeCo catalysts 35
Figure 16: TPR profile of xCeCo catalysts 36
Figure 17: N2O decomposition by xCeCo 37
Figure 18: Activation energy calculations for Co3O4, 10CeCo and 20CeCo 38
Figure 19: Conversion data for N2O and CH4 41
Figure 20: Selectivity profile of various products 42
List of tables
Table 1: BET surface area of Co3O4 catalysts 27
Table 2: lattice parameters, surface area and particle diameter of xCeCo catalysts 32
Table 3: Selectivity towards different products upon partial oxidation of CH4 using N2O 43
13
1. Chapter 1
Introduction
1.1 Catalytic decomposition of N2O
Recent studies have proved N2O to be one of the most dominant ozone-depleting substance
[1]. Also with a global warming potential, nearly 300 times more than CO2 and a lifetime of
nearly 100 years, N2O is a potential threat to atmosphere [2]. About 40% of total global N2O
emissions are a result of human activities like agriculture, transportation, combustion of fossil
fuels and industries involved in preparation of adipic and nitric acid. Many natural processes,
like nitrogen cycle and breakdown of nitrogen by bacteria in soil and oceans too are
responsible for nitrous oxide emissions. It is also released as a by-product during the
abatement of other environmentally harmful species like three-way catalytic decomposition
of NOx, CO, hydrocarbons etc. [3]. Hence the growing levels of N2O in atmosphere is of
major concern. To curb this many new ways of emission reduction are being investigated.
Broadly there can be two possible ways, either controlling the amount of N2O being released
or by decomposition of released N2O. Later turns out to be more realistic as lot of time needed
to bring down the current emission levels. Although thermodynamically unstable, the N2O
molecule is quiet stable room temperature. In the asymmetric N-N-O molecule the N-N bond
order is about 2.7 and that of N-O about 1.6. Hence it is this N-O bond which may be cleaved
during decomposition of N2O as per equation 1.
N2O → N2 + 1
2 O2 (ΔrH⁰ (298) = -163 kJ/ mol) (1)
The decomposition reaction is useful in many applications like use of nitrous oxide as an
anesthetic, reprocessing of fossil fuel rods using nitric acid to name few [2]. One of the most
famous example of usage of N2O decomposition is in hydroxylation of benzene using Fe
ZSM-5 [4]

14
This reaction is an industrial procedure for preparation of phenol. Phenol is used in synthesis
of chemicals like caprolactam and adipic acid.
Various attempts have been reported on the catalytic decomposition of N2O. Initially pure
metals like Pt [3] and Au [5] were employed as catalysts. They were effective but needed high
operational temperatures. Also they were easily deactivated by the products of reaction (N2
and O2) when used for a longer time. This along with their high cost forced researchers to
look out for other alternatives. It was realized that the efficiency of the catalyst could be
enhanced by using it with a proper support. M. Hussain et al. used Rh supported on
mesoporous silica (SBA-15-S) as catalyst [6]. H. Yoshida et al. studied the effect of the nature
of support on the catalytic activity of Pd and Pt for N2O decomposition [7]. Metal oxides,
both pure and mixed have also been employed for this reaction. H. Zhou et.al used Copper
and cerium oxide mixed oxide as catalyst [8]. While pure CeO2 was inactive, CeO2 doped
CuO showed better activity than CuO for N2O decomposition.
Cobalt oxides, especially those with a promoter, have been shown to exhibit good catalytic
properties in many processes like oxidation of CO [9, 10], CH4 [11], higher hydrocarbons and
ammonia as well as reduction of nitrous oxide [12]. E. Wilczkowska et al demonstrated the
use of pure cobalt oxide spinel (Co3O4) for N2O decomposition [13]. Co3O4 has cubic structure
and is expected to have 1:2 ratio of Co+3: Co+2 ions. However presence of non-stoichiometry
results in an increased concentration of oxide ions which in turn causes an increased ratio of
Co+3 due to charge transfer to oxygen. The redox couple of Co+3/Co+2 plays an important role
in the usage of cobalt oxide as catalyst. But undoped cobalt oxide has numerous limitations
for its use as catalyst for N2O decomposition especially at higher temperatures because of
reduction of its active phase to CoO. Further the catalyst particles tend to sinter and form
clusters which results in reduced activity. Hence a dopant is needed which apart from
stabilizing the catalyst, provides additional and enhanced catalytic activity too. Dou Zhe et al.
used gold doped Co3O4 and Zn- Co2O4 catalysts [14]. They found that although Zn Co2O4 was
more active than Co3O4, gold doping increased activity of Co3O4 more than Zn/Co2O4. Among
the various structural modifiers available, cerium oxide (CeO2) seems a good candidate
because of its well-known ‘oxygen storage capacity’. Cerium oxide plays an important role
in two most important industrial processes: three way catalysis (TWC) and fluid catalytic

15
cracking. Apart from this cerium oxide has been used in the treatment of gaseous emissions
like SOx, and liquid wastes. However in all these processes it always acts as structural/
electronic promoter or as co-catalyst but never as true catalyst. Hence, effective stabilization
of the dispersed state of transition metal oxides by prevention of sintering, retention of their
high surface area and its redox/oxidation properties along with high oxygen mobility further
encourage usage of cerium oxide in preparation of efficient transition metal oxide based
catalysts.
1.2 Partial oxidation of methane
One of the recent use of decomposition of nitrous oxide is in the partial oxidation of methane
to methanol. Methane (CH4) is a potential greenhouse gas. Its’ global warming potential over
a 100 year time scale is nearly 25 times that of carbon dioxide (CO2) [2]. Also methane is the
major constituent of natural gas (95%) and hence it is potential clean source of energy too.
The natural reserves of methane are comparable to that of petroleum. But they are located in
remote places and so in order to use methane as fuel, it needs to be transported from these
reserves to centers of consumption. It is not an easy task since the boiling point of methane is
-1650C and requires expensive liquid nitrogen refrigeration throughout the transportation.
Hence it is uneconomical to bring methane to market in the gaseous form. The most attractive
alternative is to convert methane to any other liquid product which would overcome these
limitations and at the same time retains its energy content. Methanol (CH3OH) is one such
product. And hence partial oxidation of methane to methanol is an extensively studied area.
Methanol is one of the most important industrial chemicals and its major application is its use
as solvent or an as intermediate for many chemicals that are used as fuels or fuel additives.
When blended with gasoline, methanol can used directly as an automobile fuel. Natural gas
can be converted to products like methanol, formaldehyde etc. via two ways: direct and
indirect. Indirect routes involve conversion of methane to carbon monoxide and hydrogen (a
mixture called syngas) by steam reforming followed by catalytic conversion of syngas to
methanol. On the other hand direct routes as the name suggests involve use of an oxidizing
agent which oxidizes methane to methanol [15]. Commercially this is done by indirect route.
But this is not a profitable process since steam reforming of methane is an energy intensive
process which requires high operational temperatures and pressure which increases the cost
of production. In order to reduce the reforming cost, direct routes have been developed. Here
also one limitation being faced is that although formation of methanol is thermodynamically
favored but formation of oxides of carbon like carbon monoxide and dioxide is even more

16
favorable and hence it becomes necessary that the oxidation is controlled so as to give only
methanol.
Initial catalytic reactions for methane oxidation were based on the concept of activation of C-
H bond. Of the most commonly used catalysts were molybdenum and vanadium based. First
report of usage of molybdenum oxide, MoO3 was published by Dowden and Walker [16].
Later Spencer exploited silica supported MoO3 catalysts [17]. However soon it was realized
that this is not a viable process and hence a new concept was developed. This involved a
catalyst capable of transferring and stabilizing active oxidizing species. Some of the early
works involved use of mixed metal oxides like Mo-V-Cr-Bi-Ox/SiO2 [18].Since this process
is an oxidation process, several oxidizing agents have been tested like air [19] , peroxide [20]
etc. Nitrous oxide too has been exploited for the said reaction. One of the earliest report for
this was by Lunsford and co-workers who used Mo/SiO2 [21]. Later other catalysts like
Ru/alumina [22], Co-Al/Au [23] etc. were also tested.
Earlier Xue et al. have reported decomposition of nitrous oxide over cerium oxide promoted
cobalt oxide catalyst prepared by Coprecipitation method [24]. However it is well known that
catalyst activity can be modified by the preparatory methods [25]. This is true for Co3O4.
Hence we first prepared pure Co3O4 using different preparation methods: combustion,
Coprecipitation and hydrothermal and tested their activity for N2O decomposition. Later the
best one was chosen and was doped with varying contents of cerium oxide (CeO2) as to get a
series of CeO2 doped Co3O4 catalysts. All were further subjected for N2O decomposition. The
one which was showing best activity for nitrous oxide decomposition was then tested for
methane oxidation.

17
2. Chapter 2
Experimental section
2.1 Catalyst preparation methods
The catalysts used in the project were prepared by three different methods. A brief description
of all three is given below.
2.1.1. Hydrothermal synthesis: Hydrothermal synthesis can be defined as a method of
synthesis of materials that depends on the solubility of minerals in hot water under high
pressure. The crystal growth is performed in an apparatus consisting of a steel pressure vessel
called an autoclave, in which a nutrient is supplied along with water. A temperature gradient
is maintained between the opposite ends of the growth chamber. At the hotter end the nutrient
solute dissolves, while at the cooler end it is deposited on a seed crystal, growing the desired
crystal. Possible advantages of the hydrothermal method over other types of crystal growth
include the ability to create crystalline phases which are not stable at the melting point. Also,
materials which have a high vapor pressure near their melting points can also be grown by
the hydrothermal method. The method is also particularly suitable for the growth of large
good-quality crystals while maintaining good control over their composition. Disadvantages
of the method include the need of expensive autoclaves, and the impossibility of observing
the crystal as it grows.
2.1.2. Coprecipitation synthesis: Coprecipitation means the precipitation of one substance
along with another. Sometimes the concentration of a particular substance in the solution is
so low that it can’t be precipitated in the usual way. Coprecipitation of a salt happens in such
a case. This method involves the utilization of the concept of solubility and ionic product. The
reactants are dissolved in water and then an appropriate precipitating agent is added to it.
When the ionic product of a substance (salt) exceeds its solubility product, the salt precipitates
out of the solution. The synthesis involves nucleation, growth and digestion. Also the choice
and amount of precipitating agent added is important in ensuring complete precipitation.
Generally slow and small addition of the precipitating agent is important for complete
precipitation.

18
2.1.3. Combustion synthesis: Combustion synthesis stands out an important and popular
method which enables ample control over the resultant shape and size of the synthesized
solids. Combustion synthesis means synthesis of compounds in a wave of chemical reaction
(combustion) that propagates over a starting reaction mixture owing to layer by layer heat
transfer. It is an exothermic redox process. The term combustion covers flaming, smoldering
as well as explosive reactions. Also depending on the nature of reactants and the exothermicity
of reaction combustion synthesis is classified as: self-propagating high temperature synthesis
(SHS), low temperature combustion synthesis (LCS), solution combustion synthesis (SCS),
flame synthesis (FS), gel combustion (GS), sol gel combustion (SGC), emulsion combustion
(EC) and volume combustion (VC).
Solution combustion synthesis: The process involves an aqueous solution of a combustible
redox mixture (metal precursors) and a fuel. Solution is heated to a particular temperature
called ignition temperature (Ti), the point at which the combustion synthesis reaction is
dynamically activated without further external heat supply. The actual combustion
temperature, Tc is the maximum temperature achieved and this can be as high as 15000C. The
process duration is around 10 seconds. Some advantages of SCS are: tight control over
reaction stoichiometry and homogeneity of products because of solution synthesis, high purity
products: high temperature volatilizes impurities, fast process and no special equipment is
needed, rapidity of the process allows the formation of metastable phases too.
Various metal precursors are nitrates, carboxylates, hydrazine, hydrazide, hydrazinium etc.
All of them have an underlying requirement that they are a combination of redox couple and
upon decomposition, they should give gaseous products like CO2, H2O, N2 and fine oxide
particles of small size and high surface area. Also they should have good aqueous solubility
since this ensures concentrated solutions. Fuel is an organic compound which is a source of
carbon and hydrogen and which on combustion releases CO2, H2O and heat. Also it should
be able to form complexes with metal ions facilitating homogenous mixing of cations in
solution. Commonly used fuels are glycine, urea, hydrazine or a precursor containing a
carboxylate anion like citric acid. The products’ morphology can be controlled by modifying
the reactants stoichiometry which is governed by a ratio called oxidant-fuel ratio, ɸ. As
amount of fuel increases, the heat realized also increases which increases gas phase
production which gives particles of small size and spongy morphology. For better intimacy
throughout the reaction mixture, stoichiometry is essential. The farther from this ratio, the
longer the time needed for ignition to occur. This happens in fuel rich and fuel lean conditions.
However the delay is more for later. In fuel lean condition, delay is because of less fuel is
19
dispersed in larger oxidizer mass. Whereas mass transfer control of external oxygen needed
for complete combustion of fuel is the reason for delay in fuel rich condition. Hence an
optimum ratio as per requirement is needed for desires results [26].
2.2 Characterization techniques
All the catalysts that were used, were characterized using the techniques discussed below.
2.2.1. X-ray diffraction for powder catalysts
Most catalysts are crystalline solids and hence X-ray powder diffraction (XRD) is becomes a
fundamental technique enabling us to evaluate nature of crystalline phases, their concentration
in the solid and crystallite size. X-rays are generated as a result of bombardment of a metal
electrode by high energy electrons accelerated by a large potential, as shown in fig.2.
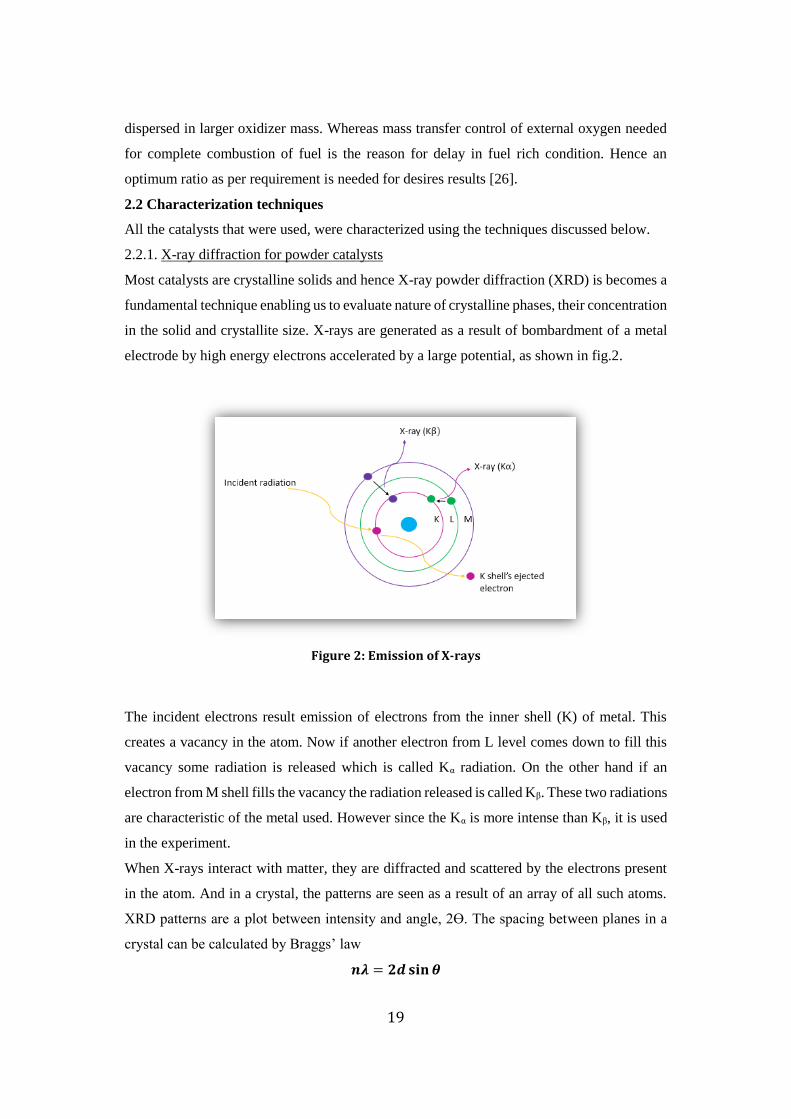
Figure 2: Emission of X-rays
The incident electrons result emission of electrons from the inner shell (K) of metal. This
creates a vacancy in the atom. Now if another electron from L level comes down to fill this
vacancy some radiation is released which is called Kα radiation. On the other hand if an
electron from M shell fills the vacancy the radiation released is called Kβ. These two radiations
are characteristic of the metal used. However since the Kα is more intense than Kβ, it is used
in the experiment.
When X-rays interact with matter, they are diffracted and scattered by the electrons present
in the atom. And in a crystal, the patterns are seen as a result of an array of all such atoms.
XRD patterns are a plot between intensity and angle, 2Ɵ. The spacing between planes in a
crystal can be calculated by Braggs’ law
𝒏𝝀 = 𝟐𝒅 𝐬𝐢𝐧 𝜽

20
Here, λ is the wavelength of X-ray source. n is the order of diffraction. d is inter planar spacing
and Θ is angle of diffraction. Also the particle size can be determined by Scherrer’s formula
< 𝑳 >=𝑩 𝐜𝐨𝐬(𝟐𝜽
𝟐⁄ )
𝝀𝒌
Where L is particle size, B is the broadening of signal, k is the constant which is usually taken
to be 1.
In project, XRD was used to investigate the bulk phases present in the sample and to determine
the calcination induced solid-solid phase transformation, if any. This was done using
PANalytical X’pert pro X-ray diffractometer with Cu Kα (λ = 1.541 Å radiation, 30 mA, 40
kV).
2.2.2 Surface area determination: BET Analysis
Specific surface area of a powdered solid is obtained by physical adsorption of gas on the
surface of the solid and by calculating the amount of adsorbate gas corresponding to a
monomolecular layer on the surface. Brunner Emmett Teller method is one of the most
reliable and widely used methods of surface area determination. It can be thought as a
generalization of Langmuir adsorption isotherm. This theory explains multilayer adsorption,
however all the postulates of Langmuir isotherm are applicable to every monolayer
adsorption. BET equation is:
𝒑
(𝒑𝟎−𝒑)𝑽𝒕𝒐𝒕𝒂𝒍 =
𝟏
𝑪 𝑽𝒎𝒐𝒏𝒐+
(𝑪−𝟏)𝒑
𝑪 𝑽𝒎𝒐𝒏𝒐𝒑𝟎
Where
𝑽𝒎𝒐𝒏𝒐: Volume of the gas required to form one complete monolayer of adsorbate on the
surface of the adsorbent.
𝑽𝒕𝒐𝒕𝒂𝒍: Total volume of gas adsorbed, on the surface of the adsorbent, at the given
temperature and pressure reduced to standard condition.
𝒑𝟎: Saturated vapor pressure of the gas at temperature T and p is the pressure of the gas.
C: constant, at given conditions, which depends on the nature of the gas for a particular
adsorbate- adsorbent pair. C= 𝒆((𝑬𝟏−𝑬𝑳)/ 𝑹𝑻)
Where E1 is heat of adsorption in the first layer and EL is that in second and higher layers and
is equal to the enthalpy of liquefaction. It is an indication of the magnitude of the
adsorbent/adsorbate interactions.
A plot between 𝒑
(𝒑𝟎−𝒑)𝑽𝒕𝒐𝒕𝒂𝒍 (y axis) and
𝒑
𝒑𝟎 (x axis) gives
𝟏
𝑪 𝑽𝒎𝒐𝒏𝒐 as intercept and
(𝑪−𝟏)
𝑪 𝑽𝒎𝒐𝒏𝒐 as
slope. Vmono is used to calculate the surface area of adsorbate.

21
The experiment is performed at 77K and the measured parameter is pressure p, amount of
added gas Vtotal is controlled by the instrument. Vmono and C are calculated by the computer
and are used to calculate surface area as per the equation
Specific surface area( 𝒎𝟐
𝒈) =
𝑨𝒎𝑵𝑨𝑽𝒎𝒐𝒏𝒐
𝑾𝑽𝟎
Here NA is Avogadro constant= 6.023 X 10²³
Am is the cross sectional area of the adsorbate molecule (for N2 it is .162 nm2 at 77K)
W is the weight of the sample and V0 = 22.4 L mol-1.
In the present work, the BET surfaces were determined by N2 adsorption using a
Quantachrome autosorb automated gas sorption analyzer (NOVA 2200e). Before keeping
samples for analysis, they were oven dried at 3000C for 12 hrs under vacuum and flushed with
Argon gas for 2 hrs. All the BET values in this study were within ±5% error. N2 physisorption
was used to measure the surface area. The principle is physisorbed N2 forms a monolayer over
the adsorbent at low temperatures. This monolayer is independent of the size of the adsorbent
molecules and depends only on the nature of adsorbed gas’s molecules. Hence knowing the
size of gas molecule, one can calculate the while surface area of the adsorbent.
2.2.3 Temperature Programmed Reduction
Temperature Programmed Reduction (TPR), temperature programmed decomposition (TPD)
and catalytic activity measurements were carried out in a flow system (Quantachrome
autosorb-IQ automated gas sorption Analyzer) equipped with a thermal conductivity detector
(TPR-TCD). For TPR measurements, 50mg of the sample was sandwiched between quartz
wool plugs in a U-shaped quartz reactor and flushed with He for 30 min. The TPR profiles
were obtained by heating the sample from room temperature to the desired temperature
(600oC) in 10% H2 in Ar, (gas flow rates 40 ml min-1 and heating rate of 10oC min-1) and the
gaseous products were sampled through a fine control leak valve to TCD after passing through
a cold tarp to remove H2O. Quantitative analysis was done by integrating the reduction signal
and comparison was made by pre-calibrated signals.
2.2.4 Raman Spectroscopy
Raman scattering is the inelastic scattering of light with momentum and energy transfer
between the photons and scattering material. It is one of the most useful techniques for
characterization of catalytic materials. It provides information about M-O bond arrangement
and lattice defects. In the Raman experiment the intensity of scattered light is measured as a
function of the frequency shift (Raman shift, cm-1) of the photons. Due to interactions of light
with different elementary excitations in solids, Raman spectroscopy is a powerful tool for the
investigation of different solid state properties. That is why a Raman spectrum shows many
22
different features. In the project, Raman spectra were recorded with a Bruker senterra
dispersive Raman microscope with laser excitation of wavelength of 532 nm, equipped with
a confocal microscope and liquid-nitrogen cooled charge-coupled device (CCD) detector. The
emission line at 532 nm from He-Cd laser (Melles Griot Laser) was focused on the sample
under the microscope, with the diameter of the analysed spot being ~1 µm. The time of
acquisition in both the cases was adjusted according to the intensity of the Raman scattering.
2.2.5 Transmission Electron Microscopy (TEM)
Transmission Electron Microscopy (TEM) offers increased resolution imaging, down to
individual atoms, as well as ability of carrying out diffraction from Nano- sized volumes.
TEM involves transmission of electrons through an ultra-thin specimen, interacting with the
specimen as it passes through. An image is formed form the interaction of the transmitted
electrons through the specimen. In a transmission electron microscope electrons are
accelerated at high voltage (100- 1000 kV) to a velocity approaching the speed of light (.6-.9
c). The wavelength associated with these is five times smaller than that with light. A
maximum thickness of 60 nm is required for TEM and HREM (High Resolution Electron
Microscopy). Samples are deposited on 2/3 mm diameter carbon coated copper grids covered
with a thin amorphous carbon film. In the project, the size and morphology of the
nanoparticles were examined by using an FEI model TECNAI G 220 S-Twin TEM
instrument.
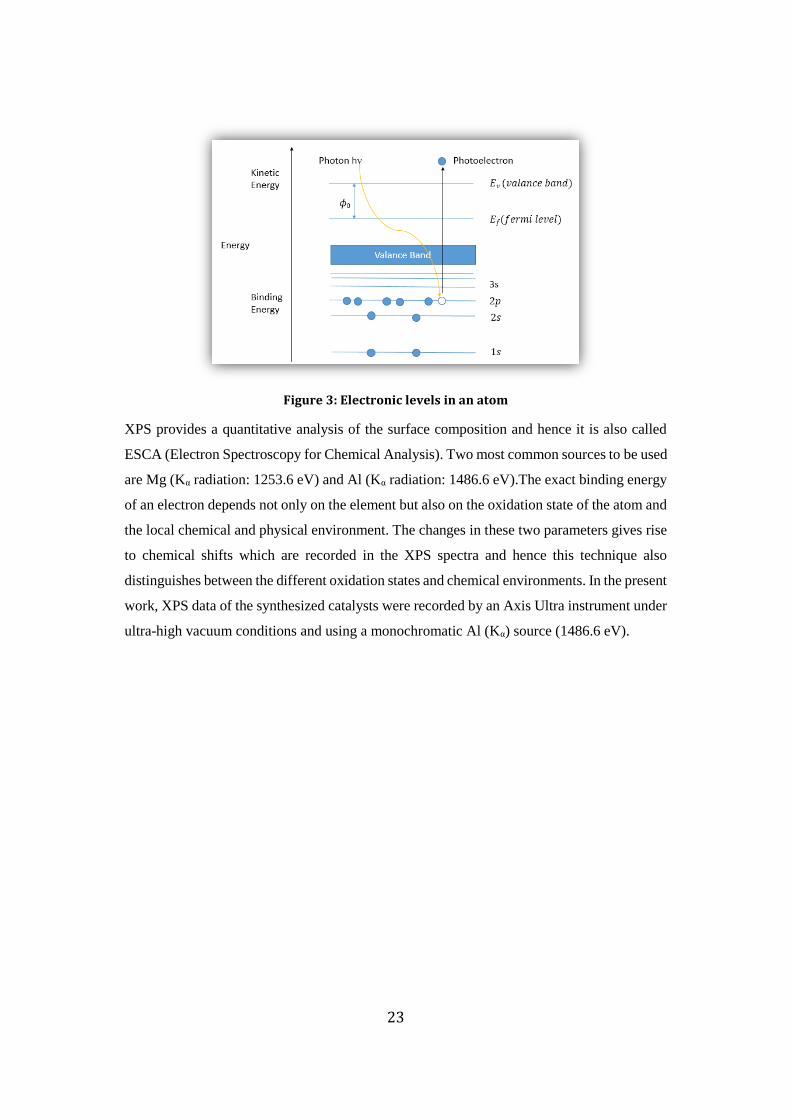
2.2.6 X-ray Photoelectron Spectroscopy (XPS)
XPS utilizes photo-ionization and analysis of the kinetic energy distribution of the emitted
photoelectrons to study the composition and electronic state of the surface region of a sample.
X-ray Photoelectron Spectroscopy (XPS) involves use of soft x-rays i.e. the ones which have
energy between 200-2000 eV. It is used to obtain information on chemical states from the
variations in binding energies or chemical shifts of the sample. Here a photon is absorbed, by
the sample, which causes ionization and emission of a core (inner shell) electron, as shown in
fig. 3. The detector records the distribution of energy of these photoelectrons and gives a XPS
spectra. An equation commonly used in XPS is
KE = hν – (BE + ɸ0)
23
Figure 3: Electronic levels in an atom
XPS provides a quantitative analysis of the surface composition and hence it is also called
ESCA (Electron Spectroscopy for Chemical Analysis). Two most common sources to be used
are Mg (Kα radiation: 1253.6 eV) and Al (Kα radiation: 1486.6 eV).The exact binding energy
of an electron depends not only on the element but also on the oxidation state of the atom and
the local chemical and physical environment. The changes in these two parameters gives rise
to chemical shifts which are recorded in the XPS spectra and hence this technique also
distinguishes between the different oxidation states and chemical environments. In the present
work, XPS data of the synthesized catalysts were recorded by an Axis Ultra instrument under
ultra-high vacuum conditions and using a monochromatic Al (Kα) source (1486.6 eV).

24
3. Chapter 3
Decomposition of nitrous oxide
3.1 Introduction
Here we used cobalt oxide (Co3O4) as catalyst for N2O decomposition. Also we prepared it
using three different methods: hydrothermal, combustion and Coprecipitation and tested all
three for nitrous oxide decomposition.
Later in order to improve its efficiency, we doped it with cerium oxide (CeO2), prepared a
series of catalysts, and then again tested it for N2O decomposition.
3.2 Experimental section
3.2.1 Preparation of Co3O4
3.2.1.1. Combustion synthesis:
Cobalt nitrate (Co(NO3)2 .6H2O) (taken as cobalt precursor) and citric acid (C6H8O7) (cerium
oxide precursor), purchased from Sigma, were dissolved in minimum amount of water and
was sonicated for 15 min. Amount of the two reactants was determined by fuel: oxidant ratio,
ɸ. It is a ratio of the total valency of oxidant to that of fuel. If ɸ =1 then the reaction is
stoichiometric and the initial mixture doesn’t require atmospheric oxygen for complete
oxidation of fuel. ɸ >1 denotes oxidant rich (fuel lame) situation. ɸ <1 denotes fuel rich
situation. The resultant solution was kept on hot plate so as to get a froth. This was then taken
inside a preheated furnace maintained at 4500C for 15 min. The spongy solid so obtained was
crushed to a fine powder and stored for further characterization and reactions. A sample
prepared via combustion synthesis is shown in fig.4.

25
Figure 4: A sample prepared using combustion synthesis
3.2.1.2. Hydrothermal synthesis
Cobalt nitrate, cetyl trimethyl ammonium bromide (CTAB) and urea were dissolved in
calculated amount of water and were stirred for 10 min. they were then transferred to a Teflon
beaker and kept in a bomb, which was kept inside an oven at 1600C for 15 hrs. After the
completion of reaction, contents were filtered and washed with water. They were then kept
for calcination at 5000C for 12 hrs.
3.2.1.3. Coprecipitation synthesis
Cobalt nitrate was dissolved in optimum amount of water and was kept for stirring. To this,
2M sodium hydroxide solution was added drop wise to maintain pH around 11. Precipitate so
obtained was left undisturbed for ageing overnight. Later it was filtered and washed with hot
water. Solid so obtained was then calcined at 4500C for 12 hrs.
3.2.2. Preparation of Ce/Co catalysts using SCS
In order to improve the activity of cobalt oxide, cerium oxide was doped on it. A series of
catalysts was prepared, by doping different amounts of cerium oxide, using combustion
synthesis. Catalysts so prepared were labelled as xCeCo catalysts. Percentage of cerium oxide
was varied from 10 to 100% {100 * CeO2/ (Co3O4+ CeO2) %} so as to get xCeCo catalysts
with different mole fractions of cerium oxide and cobalt oxide. Calculated amounts Co3O4,
ceric ammonium nitrate, CAN ((NH4)2Ce(NO3)6•6H2O) (taken as cerium oxide precursor) and
citric acid were dissolved in minimum amount of water. Contents were sonicated for 15 min.
and later concentrated on a hot plate so as to get a froth. Later they were taken inside a
preheated furnace maintained at 4500C for 15 min. Solid so obtained was crushed to a fine
powder.
3.3 Results and discussion
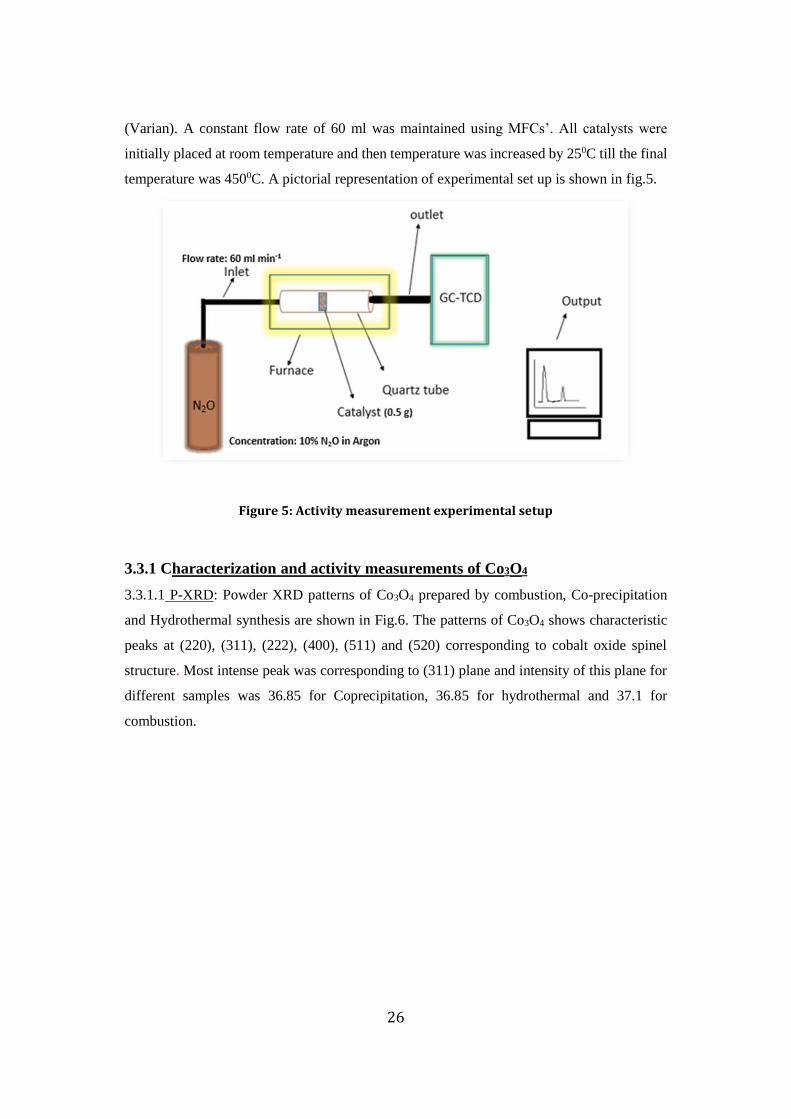
For activity measurements, fixed amount of catalyst was taken in a quartz tube and placed in
a temperature programmed furnace. Inlet of the tube was connected to N2O cylinder (10 %
N2O in Argon) and products were analyzed by connecting the outlet to GC coupled with TCD
26
(Varian). A constant flow rate of 60 ml was maintained using MFCs’. All catalysts were
initially placed at room temperature and then temperature was increased by 250C till the final
temperature was 4500C. A pictorial representation of experimental set up is shown in fig.5.
Figure 5: Activity measurement experimental setup
3.3.1 Characterization and activity measurements of Co3O4
3.3.1.1 P-XRD: Powder XRD patterns of Co3O4 prepared by combustion, Co-precipitation
and Hydrothermal synthesis are shown in Fig.6. The patterns of Co3O4 shows characteristic
peaks at (220), (311), (222), (400), (511) and (520) corresponding to cobalt oxide spinel
structure. Most intense peak was corresponding to (311) plane and intensity of this plane for
different samples was 36.85 for Coprecipitation, 36.85 for hydrothermal and 37.1 for
combustion.

27
Figure 6: P-XRD patterns of Co3O4prepared by different methods
3.3.1.2 Surface area determination: Surface areas of some of the synthesized catalysts, as
determined using N2 adsorption, BET analysis, are given in table 1.
Table 1: BET surface area of Co3O4 catalysts
Catalyst Preparatory method Surface area (m2g-1)
Co3O4 Combustion 50
Co3O4 Co-precipitation 32
Co3O4 Hydrothermal 26
3.3.1.3. Raman Spectroscopy: Raman spectra of Co3O4, prepared by different methods is
shown in Fig.7.

28
Figure 7: Raman spectra of Co3O4
Co3O4 belongs to the space group Oh, Fd3m and bulk Co3O4 has five major Raman active
modes around 194, 482, 522, 618 and 691 cm−1 assigned to F2g, Eg, F2g, F2g and A1g
respectively. The most intense A1g peak (691 cm-1) is assigned to the octahedral site CoO6
symmetry and the Eg and F2g peaks are together assigned to the tetrahedral site CoO4
symmetry [27, 28].
3.3.1.4. UV Visible Spectroscopy: UV-Visible spectra of cobalt oxide catalysts is shown in
Fig.8.
Figure 8: UV-Vis. Spectra of Co3O4
There are two bands corresponding to the two transitions occurring in the Co3O4 spinel. Both
the transitions are ligand to metal charge transfer transitions. The lower wavelength band
29
corresponds to O-2 to Co+2 transition while the higher wavelength band corresponds to O-2 to
Co+3 transition [29].
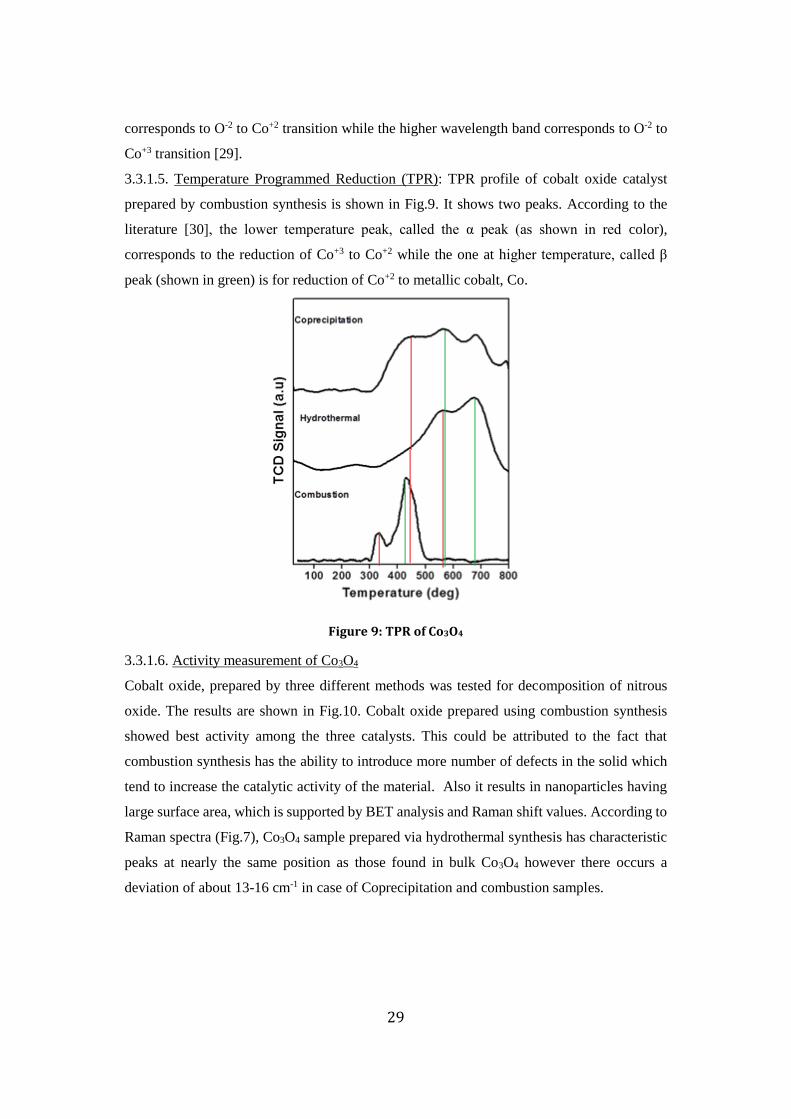
3.3.1.5. Temperature Programmed Reduction (TPR): TPR profile of cobalt oxide catalyst
prepared by combustion synthesis is shown in Fig.9. It shows two peaks. According to the
literature [30], the lower temperature peak, called the α peak (as shown in red color),
corresponds to the reduction of Co+3 to Co+2 while the one at higher temperature, called β
peak (shown in green) is for reduction of Co+2 to metallic cobalt, Co.
Figure 9: TPR of Co3O4
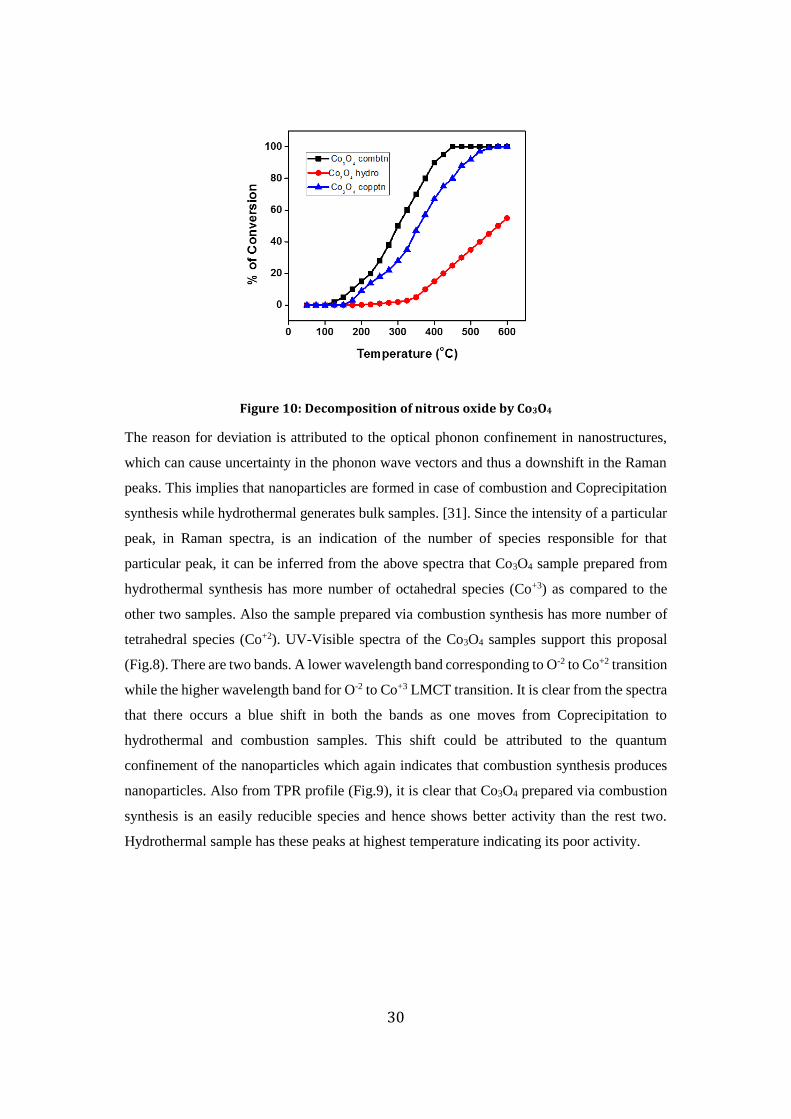
3.3.1.6. Activity measurement of Co3O4
Cobalt oxide, prepared by three different methods was tested for decomposition of nitrous
oxide. The results are shown in Fig.10. Cobalt oxide prepared using combustion synthesis
showed best activity among the three catalysts. This could be attributed to the fact that
combustion synthesis has the ability to introduce more number of defects in the solid which
tend to increase the catalytic activity of the material. Also it results in nanoparticles having
large surface area, which is supported by BET analysis and Raman shift values. According to
Raman spectra (Fig.7), Co3O4 sample prepared via hydrothermal synthesis has characteristic
peaks at nearly the same position as those found in bulk Co3O4 however there occurs a
deviation of about 13-16 cm-1 in case of Coprecipitation and combustion samples.
30
Figure 10: Decomposition of nitrous oxide by Co3O4
The reason for deviation is attributed to the optical phonon confinement in nanostructures,
which can cause uncertainty in the phonon wave vectors and thus a downshift in the Raman
peaks. This implies that nanoparticles are formed in case of combustion and Coprecipitation
synthesis while hydrothermal generates bulk samples. [31]. Since the intensity of a particular
peak, in Raman spectra, is an indication of the number of species responsible for that
particular peak, it can be inferred from the above spectra that Co3O4 sample prepared from
hydrothermal synthesis has more number of octahedral species (Co+3) as compared to the
other two samples. Also the sample prepared via combustion synthesis has more number of
tetrahedral species (Co+2). UV-Visible spectra of the Co3O4 samples support this proposal
(Fig.8). There are two bands. A lower wavelength band corresponding to O-2 to Co+2 transition
while the higher wavelength band for O-2 to Co+3 LMCT transition. It is clear from the spectra
that there occurs a blue shift in both the bands as one moves from Coprecipitation to
hydrothermal and combustion samples. This shift could be attributed to the quantum
confinement of the nanoparticles which again indicates that combustion synthesis produces
nanoparticles. Also from TPR profile (Fig.9), it is clear that Co3O4 prepared via combustion
synthesis is an easily reducible species and hence shows better activity than the rest two.
Hydrothermal sample has these peaks at highest temperature indicating its poor activity.

31
3.3.2 Characterization and activity measurements of Cerium oxide doped Co3O4
(xCeCo) catalysts
In order to improve the efficiency of the catalyst, cerium oxide was doped on cobalt oxide
and these catalysts too were prepared using combustion synthesis. CeO2 has been proposed
as a component activating Co3O4 spinel for catalytic decomposition of N2O. Xue et al. [24]
have shown that the CeO2– Co3O4 oxide systems are significantly more active comparing
to pure Co3O4 spinel and the activation effect of cerium is related to modifications of
the redox properties of cobalt as well as preservation of the relatively high surface
area of the catalysts (especially for the samples with low loading of cerium). The redox
properties of CeO2– Co3O4 oxide systems and optimal composition of the catalysts were also
described. Surface ceria oxygen is involved in oxidation of N2O into the surface nitrogenated
species. Decomposition of such species results in the formation of vacant sites on ceria,
by oxygen depletion, and filling up such vacant sites by N2O oxygen. Although this
oxide system is very interesting for potential application in N2O decomposition, the
number of scientific reports related to this type of catalysts is rather limited. Up till
now, the CeO2– Co3O4 catalysts for N2O decomposition were synthesized by co-
precipitation (with K2CO3 or KOH as precipitants), impregnation, citrate and thermal
(thermal decomposition of mixture of Ce(NO3)3 and Co(NO3)2) methods. It was shown
that method used for the synthesis of CeO2– Co3O4 oxide systems significantly
differentiates their catalytic performance. Therefore, in this work, we applied another
way for synthesis of CeO2– Co3O4 oxide system. Solution combustion method,
guaranteeing the formation of nanocrystalline oxide materials, was used for the synthesis
of two series of the samples, which were tested in the role of the catalysts for N2O
decomposition. Amount of cerium oxide was increased from 10 to 90 weight percent so as to
have xCeCo catalysts where x varied from 10 to 90 %. These catalysts too were characterized
using XRD, BET, UV, Raman and TPR. The results are discussed in the following section.
3.3.2.1 P-XRD: Powder- XRD patterns of xCeCo catalysts, prepared via combustion
synthesis are shown in fig.11. All the reflections of pure cobalt oxide and pure cerium belong
to cobalt spinel structure and fluorite oxide-type structure respectively. No other phase was
detected on these xCeCo catalysts except from these two phases.

32
Figure 11: XRD pattern of xCeCo catalysts
The P-XRD patterns show prominent peaks at 2θ values of 19.1, 31.4, 36.8, 38.6, 44.9, 56.3,
59.3 and 65.4 which are indexed respectively as (111), (220), (311), (222), (400), (422), (511)
and (440) planes of FCC type Co3O4 with space group of Fd3m (227).The diffraction lines
corresponding to the ceria phase started appearing after 40% ceria content i.e. 40CeCo
onwards. The intensity of Co3O4 signals increases with the cobalt content. The CeO2 lattice
constant in the undoped ceria catalyst is 5.14 Å. The lattice constant of Co3O4 in 10 to 50CeCo
is equals 8.18 Å (Table 2).
Table 2: lattice parameters, surface area and particle diameter of xCeCo catalysts
Catalyst Surface area
(m2 g
-1)
Lattice parameter (Å)
XRD Particle diameter (nm)
CeO2 Co3O4 CeO2 Co3O4
Co3O4 50 - 8.1801 - 8
10CeCo 65 5.09 8.1800 15 (10 nm from TEM)
8 (4 nm from TEM)
20CeCo 70 5.10 8.1800 - 9
30CeCo 72 5.11 8.1800 - 10
40CeCo 75 5.12 8.1800 - 12
50CeCo 78 5.14 8.1800 - 15
CeO2 80 5.14 - 18 -

33
3.3.2.2 Determination of surface area (BET analysis): The specific surface area of xCeCo
catalysts are given in table 2 above. In accordance with the XRD results, the specific surface
area of xCeCo catalyst increased from 50 (for pure Co3O4) to 78 m2g-1 with the increase of
ceria content. Surface area of pure CeO2 had the maximum surface area among these catalysts.
The above results indicate that an appropriate amount of Co in xCeCo could help to stabilize
the catalyst structure and obtain a larger surface area in these catalysts.
3.3.2.3 TEM: Figure 12 shows typical TEM images taken over the bare CeO2 support (a) and
10CeCo catalysts (b). The areas highlighted by the black circles indicate Co3O4 particles.
Overall, Co3O4 particles are well dispersed throughout the entire CeO2 particle surfaces
examined. The cobalt oxide particles are easily discriminated from the CeO2 particles, due to
their distinct morphological difference. The CeO2 support has a characteristic rectangular
shape as seen in the TEM images taken before Co loading, whereas, the Co3O4 particles
formed after doping of CeO2 to Co3O4 are mostly round. Moreover, the Co3O4 and CeO2 phase
identifications have also been confirmed through characteristic lattice structure analysis at
high resolution with lattice fringe spacing of 0.24 nm for Co3O4 ([3 1 1]) and 0.27 nm ([1 0
0]) for CeO2, respectively. Lattice parameter values re-establish the fact that the only phases
present in the xCeCo catalysts are the individual phases and not mixed oxides.
Figure 12: TEM image of (a) CeO2 and (b) 10CeCo catalyst

34
3.3.2.4 XPS: XPS spectrum of Co and Ce in Ce10Co is shown in fig.13. The spectra shows
Co 2p1/2 and 2p3/2 peaks at 795 eV and 780 eV respectively. Some satellite peaks are also
observed, indicating the presence of both +2 and +3 oxidation states. The XPS spectra of Ce
3d shows number of peaks in 3d5/2 and 3d3/2 region. These peaks are at 882, 889, 898, 900.7,
907.3 and 916 eV. CeO2 XPS spectra is difficult to interpret because of the possibility of +3
oxidation state. However complete overlap of 3d region clarifies this discrepancy. Hence the
only species present in CeO2 is Ce+4. Presence of characteristic peaks in the spectra supports
the proposal that the only phases that are formed in xCeCo catalysts are the individual phases
and no mixed oxides are produced [32].
Figure 13: Core level XPS spectra of 10CeCo (a): Co (2p), (b): Ce (3d)
3.3.2.5. Raman spectroscopy: Raman spectra of xCeCo samples prepared by combustion
synthesis is shown in Fig.14. Cerium oxide is much more Raman active than cobalt oxide
[32]. Cerium oxide shows only one characteristic Raman peak at 464 cm-1. As the content of
cerium oxide increases, the 484 cm-1 peak of cobalt oxide gets masked by cerium oxide peak.
Also the intensity of both the modes (A1g and F2g) decreases with the increase in cerium oxide
content. This indicates that there is replacement of some Co+2/+3 species by cerium upon
doping. There occurs a considerable broadening of peaks too. It might be due to change in the
composition of Co3O4 oxide. When a perfectly octahedral metal oxide undergoes
displacement by other metal ions to generate a mixed metal oxide, its Raman spectra gets
broadened due to interactions between different metals.

35
Figure 14: Raman spectra of xCeCo catalysts
3.3.2.6. UV-Visible spectroscopy: the UV–visible spectra of xCeCo catalysts is shown in
fig.15.
Figure 15: UV-Visible spectra of xCeCo catalysts

36
The lower wavelength band corresponding to O-2 to Co+2 LMCT transitions while the higher
wavelength band corresponding to O-2 to Co+3 remains almost unchanged. This implies that
cerium oxide doping interacts with Co+2 more than Co+3 and stabilizes it more. Thereby
decreasing the energy separation between O-2 and Co+2 levels which facilitates such transition.
Also the intensity of the first band increases as compared to other band, as cerium oxide
content increases. This indicates that cerium oxide introduction makes the charge transfer
process more feasible as a result of increased interactions. TPR data supports this observation,
as discussed in next section.
3.3.2.7. TPR: The TPR profile of xCeCo catalysts is shown in fig.16. Cerium oxide exhibits
2 peaks. The first peak is a low temperature peak which appears at about 5000C which is
assigned for the reduction of surface capped oxygen. While another high temperature peak at
about 8000C corresponds to the reduction of bulk oxygen [33].
Figure 16: TPR profile of xCeCo catalysts
Cobalt oxide shows its two characteristic reduction peaks, as explained in earlier sections. An
observation to be made is regarding the intensity of the two peaks. The intensity of α peak
increases while that of β peak decreases upon an increase in the content of cerium oxide.
Moreover a considerable broadening of β peak occurs. The increased intensity implies that
more Co+3 species are now undergoing reduction as compared to the Co+2 species. Also tailing
can be explained by weak reducibility of cerium oxide. Thus presence of cerium oxide makes
reduction of Co+2 difficult which could be attributed to the increased interactions between the
two.

37
3.3.2.8. Activity measurement:
Under the same experimental conditions, described above, xCeCo catalysts were tested for
nitrous oxide decomposition. As is clear from figure 17, addition of CeO2 to Co3O4 obviously
improves the catalytic activity of the catalyst. The promotion effect is strongly dependent on
the molar ratio of Ce/Co. In the case of Co3O4, the reaction light-off temperature (50% N2O
conversion) is 3000C, and the complete conversion temperature is 4500C. Addition of small
amounts of CeO2 to Co3O4 increased the activity, so that, for the sample 20CeCo, the reaction
reaches 50% conversion at 250oC and reaches 100% conversion at nearly 3800C.
Figure 17: N2O decomposition by xCeCo
With further increase of Ce, the promotion effect of CeO2 on the catalytic activity was
weakened. Pure CeO2 was almost inactive for the decomposition of N2O below 4000C (not
shown in figure).
10CeCo catalyst shows the highest activity for the decomposition reaction in this series. 50%
conversion was achieved at 2300C while 100% conversion was achieved at 3500C. From BET
surface area it can be suggested that the increased surface area is a very important factor for
the high catalytic activity of 10CeCo. In addition, the presence of appropriate amount of CeO2
could minimize the crystallites of Co3O4, and thus improve its reduction behavior. When more
CeO2 was added, the promotion effect of CeO2 on the reduction behavior of Co3O4 was
weakened. In addition, available active site (Co2+) on the surface of the catalysts decreased
because of the surface segregation of CeO2. Therefore, the catalytic activity of xCeCo (x > 10
wt. %) decreased, even though they have larger surface area than 10CeCo.
It is clear from characterization data that cerium oxide interacts with Co+2 more than Co+3.
Moreover the activity of catalysts decreases as content of cerium oxide is increased beyond

38
20 mass %. Hence it can be proposed that Co+2 is the active site for reaction to occur. More
cerium oxide means more interactions which in turn implies less availability of Co+2 for
reaction. These interaction are favorable at low cerium oxide concentrations because it leads
to better dispersion and stabilization of active species. However high concentrations might
bind to these species more strongly thereby rendering them less available for reaction.
Activation energies (Ea) of the reaction over xCeCo catalysts were calculated according to
the Arrhenius equation and results are shown in Fig.18.
Figure 18: Activation energy calculations for Co3O4, 10CeCo and 20CeCo
0.5g of catalyst was taken and kept inside quartz tube. N2O was flushed through inlet at a flow
rate of 60 ml min-1. According to our results, the activation energies vary with the ceria
loading and follow the order: Co3O4 (54 kJ mol-1) < 20CeCo (39 kJ mol-1) and 10CeCo (36
kJ mol-1). 10CeCo sample is better than the other active catalysts. Comparison of these results
with the TEM analysis, suggests that the change of surface morphology and the optimal ceria
loading can increase both dispersion and surface area of catalyst and reduces the activation
energies that can affect the rate of catalytic N2O decomposition.
During our earlier studies, we tested few commercially available catalysts like Co/ Al2O3,
Rh/Al2O3 and Ir/ Al2O3. However none of them showed appreciable activity for
decomposition of nitrous oxide. Although literature provides sufficient data about the activity
of Rh for nitrous oxide decomposition [5] but nature of support can drastically change the
activity of a catalyst as was evident in our experiment.
3.4 Conclusions

39
Three different Co3O4 catalysts were prepared by solution combustion, hydrothermal and
Coprecipitation methods. More importantly, contribution of each Co3O4 species in N2O
decomposition was evaluated. It was found that the Co3O4 catalyst by combustion method
showed better activity of N2O decomposition than rest of two methods.
A single step solution combustion method was employed to prepare a series of Ceria doped
cobalt oxide catalysts so as to enhance the activity of Co3O4. The resultant catalysts were
characterized and evaluated for N2O decomposition. Lattice oxygen is highly activated
because of the Ce substitution and it plays a key role in decomposition of N2O and
influences the oxygen storage capacity and properties such as reducibility and reduction
temperature. According to the results we got, it can be concluded that the optimum loading
of ceria is 10wt. % (10CeCo). The 10CeCo sample exhibits highest surface area and best
catalytic activity on N2O decomposition (T50 =2500C) among these catalysts. We propose
that the optimal ceria loading can increase both dispersion and surface area of catalyst and
weaken the Co–O bond strength to promote the N2O decomposition activity.
40
4. Chapter 4
Partial oxidation of methane using
nitrous oxide
4.1 Introduction
Initial catalytic reactions for methane oxidation were based on the concept of activation of C-
H bond. Of the most commonly used catalysts were molybdenum and vanadium based. First
report of usage of molybdenum oxide, MoO3 was published by Dowden and Walker [16].
Later Spencer exploited silica supported MoO3 catalysts [17]. However soon it was realized
that this is not a viable process and hence a new concept was developed. This involved a
catalyst capable of transferring and stabilizing active oxidizing species. Some of the early
works involved use of mixed metal oxides like Mo-V-Cr-Bi-Ox/SiO2 [18].Since this process
is an oxidation process, several oxidizing agents have been tested like air [19] , peroxide [20]
etc. Nitrous oxide too has been exploited for the said reaction. One of the earliest report for
this was by Lunsford and co-workers who used Mo/SiO2 [21]. Later other catalysts like
Ru/alumina [22], Co-Al/Au [23] etc.
4.2 Experimental section
4.2.1 Catalyst preparation:
10CeCo was giving best activity for N2O decomposition and that catalyst was used in partial
oxidation of methane. The catalyst was prepared using combustion synthesis as described in
previous chapter.
4.2.2 Catalyst characterization
The catalyst was synthesized by following techniques P-XRD, UV-visible spectra and Raman
spectroscopy, TPR, XPS and TEM. Results are described in previous chapter.

41
4.2.3. Activity measurements
0.5 g of catalyst was taken in a quartz tube and 30 ml each of N2O (10% Ar) and CH4 (10 %)
were flushed in, through inlet. The furnace temperature was increased from room temperature
to 5500C and the products were analyzed using GC-TCD.
4.3 Results and discussions
Under the given experimental conditions, decomposition of nitrous oxide was greater than
methane. The conversion data of both the gases is shown in fig.19.
Figure 19: Conversion data for N2O and CH4
At 5000C, the maximum conversion for N2O was nearly 30% while for CH4, it was 15%.
Apart from methanol, various other products were also formed upon partial oxidation of
methane. Some of them were formaldehyde, carbon monoxide, carbon dioxide and hydrogen.
Selectivity profile for all of them is shown in fig.20.
42
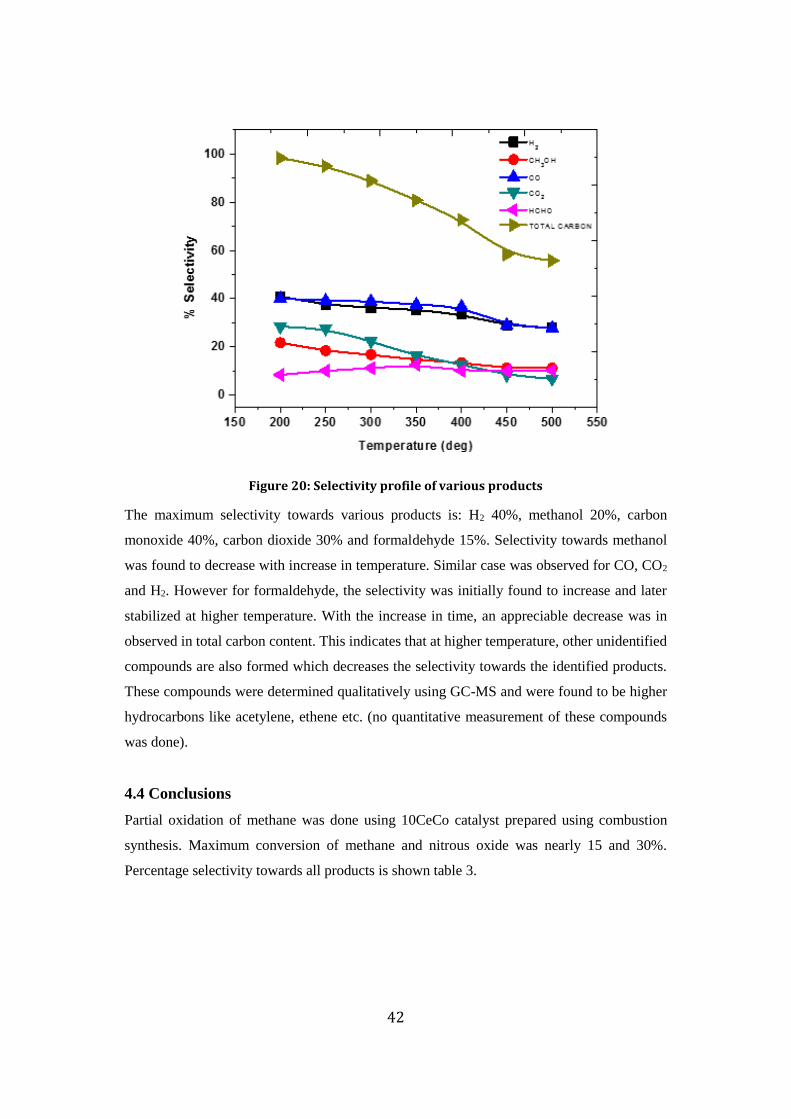
Figure 20: Selectivity profile of various products
The maximum selectivity towards various products is: H2 40%, methanol 20%, carbon
monoxide 40%, carbon dioxide 30% and formaldehyde 15%. Selectivity towards methanol
was found to decrease with increase in temperature. Similar case was observed for CO, CO2
and H2. However for formaldehyde, the selectivity was initially found to increase and later
stabilized at higher temperature. With the increase in time, an appreciable decrease was in
observed in total carbon content. This indicates that at higher temperature, other unidentified
compounds are also formed which decreases the selectivity towards the identified products.
These compounds were determined qualitatively using GC-MS and were found to be higher
hydrocarbons like acetylene, ethene etc. (no quantitative measurement of these compounds
was done).
4.4 Conclusions
Partial oxidation of methane was done using 10CeCo catalyst prepared using combustion
synthesis. Maximum conversion of methane and nitrous oxide was nearly 15 and 30%.
Percentage selectivity towards all products is shown table 3.
43
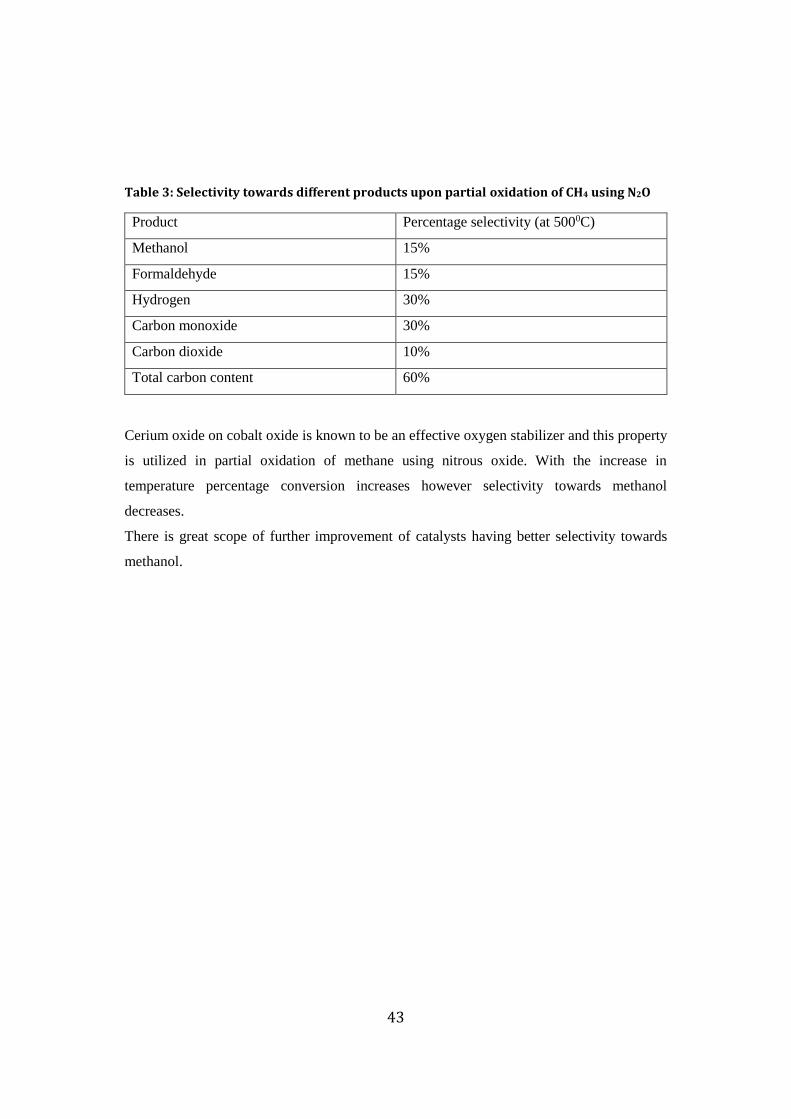
Table 3: Selectivity towards different products upon partial oxidation of CH4 using N2O
Product Percentage selectivity (at 5000C)
Methanol 15%
Formaldehyde 15%
Hydrogen 30%
Carbon monoxide 30%
Carbon dioxide 10%
Total carbon content 60%
Cerium oxide on cobalt oxide is known to be an effective oxygen stabilizer and this property
is utilized in partial oxidation of methane using nitrous oxide. With the increase in
temperature percentage conversion increases however selectivity towards methanol
decreases.
There is great scope of further improvement of catalysts having better selectivity towards
methanol.

44
5. References
1. A.R Ravishankara, John S Daniel et al. Nitrous Oxide (N2O): The Dominant
Ozone-Depleting Substance Emitted in the 21st Century. Science, (2009) 362.
2. Caillol Sylvain, Richter Renaud-de. Fighting global warming: the potential of
photocatalysis against CO2, CH4, N2O, CFCs, tropospheric O3, BC and other major
contributors to climate change. Jphotochemrev 12, (2011) 1-19.
3. F. Kapteijn, J. Rodriguez, J. A. Moulijin. Heterogeneous catalytic decomposition of
nitrous oxide. Appl. Catal. B 9, (1996) 25-64.
4. G.I. Panov, A.S. Kharitonov, V.I. Sobolev Oxidative hydroxylation using dinitrogen
monoxide: a possible route for organic synthesis over zeolites. Appl.catal.A. 98,
(1993)1-20.
5. W. M. Kalback , C. M. Sliepcevich. Kinetics of Decomposition of Nitrous Oxide.
Ind.Eng.Chem.Fundam 17, (1978) 165.
6. M. Hussain, D. Fino, N. Russo. N2O decomposition by mesoporous silica supported
Rh catalysts. J. Hazard. Mater. 211, (2012) 255-265.
7. H. Yoshida, T. Tsuruta, Y. Yazawa, T. Hattori. Support effect on oxidation resistance
of precious metal catalysts as examined by N2O decomposition. Appl. Catal., A 325,
(2007) 50-56.
8. H. Zhou, Z. Huang, C Sun, F Qin, D Xiong. Catalytic decomposition of N2O over
CuxCe1−xOy mixed oxides. Appl. Catal. B 125, (2012) 492-498.
9. H. Gandhi, M. Shelef, K. Otto. The oxidation of CO by O2 and by NO on supported
chromium oxide and other metal oxide catalysts. J.Catal. 12, (1968) 361-375.
10. X. Xie, Y. Li, Z. Liu, M. Haruta, W. Shen. Low-temperature oxidation of CO
catalyzed by Co3O4 nanorods. Nature 458, (2009) 746-749.
11. N. Bahlawane et al. Kinetics of methane combustion over CVD-made cobalt oxide
Catalysts. Appl. Catal. B 67, (2006) 168-176.
12. K. Schmidt, K. Krawczyk. The properties of cobalt oxide catalyst for ammonia
oxidation Appl. Catal., A 175, (1998) 147-157.

45
13. E. Wilczowska et al. Direct nitrous oxide decomposition with a cobalt oxide catalyst
Appl. Catal., A 389, (2013) 165-172.
14. Zhe DOU, Ming FENG, XU Xiu-feng. Catalytic decomposition of N2O over
Au/Co3O4 and Au/ZnCo2O4 catalysts. J Fuel Chem Technol 41(10), (2013) 1234-
1240.
15. Zhang Qijian, He Dehua, Zhu Qiming. Partial Oxidation of Methane to Formaldehyde
over Superfine Mo/ZrO2 Catalysts. J. Nat. Gas Chem. 12(2), (2003).
16. Dowden D A, Walker G T, U K 1 244 001, 1971.
17. N. D. Spencer, C J. Pereira. Partial oxidation of CH4 to HCHO over a MoO3-SiO2
catalyst: A kinetic study. AIChE J 33(11), (1987) 1808.
18. Z. S. Han, W. Pan, W. X. Pan et al. Preparation and effect of Mo-V-Cr-Bi-Si oxide
catalysts on controlled oxidation of methane to methanol and formaldehyde. Korea J
Chem Eng 15(5), (1998) 1.
19. N. R. Hunter, H. D. Gesser, L. A. Morton, P. S.Yarlogadda. Methanol formation at
high pressure by the catalyzed oxidation of natural gas and by the sensitized oxidation
of methane. Appl. Catal.,A 57, (1990) 45.
20. A Rahim, M Hasbi, MM Forde, RL Jenkins. Oxidation of Methane to Methanol with
Hydrogen Peroxide Using Supported Gold–Palladium Alloy Nanoparticles. Angew.
125, (2013) 1318-1322.
21. R.S. Liu, M. Iwamoto, J. H. Lunsford. Partial oxidation of methane by nitrous oxide
oxide over molybdenum oxide supported on silica. J. Chem. Soc. Chem.Commun,
78-79 (1982).
22. P. Reddy, Nayeem Pasha, Chalapathi Rao, N. Lingaiah. Direct decomposition of
nitrous oxide over Ru/Al2O3 catalysts prepared by deposition–precipitation method
Catal.comm. 8, (2007) 1406-1410.
23. XU Xiao-ling, XU Xiu-feng, Zhang Guo-tao, NIU Xian-jun, Preparation of Co-Al
mixed oxide-supported gold catalysts and their catalytic activity for N2O
decomposition. J Fuel Chem Technol 37(5), (2009) 595-600.
24. L. Xue, C. Zhang, H. He. Catalytic decomposition of N2O over CeO2 promoted Co3O4
spinel catalyst. Appl. Catal., B 75, (2007) 167-174.
25. K. Asano, C. Ohnishi, S. Iwamoto. Potassium-doped Co3O4 catalyst for direct
decomposition of N2O. Appl. Catal., B 78, (2008) 242-249.
26. Maximilian Lackner, Franz Winter, Avinash K. Agarwal. Handbook of Combustion
Synthesis (Vol. 5) John Wiley & Sons, 2010.
46
27. Na Chan Woong, Hyung-Sik Woo a et al., Controlled transformation of ZnO
nanobelts into CoO/Co3O4 nanowires CrystEngComm. 14, (2012) 3737-37.
28. Jin Seog Gwag† and Youngku Sohn, Interfacial Natures and Controlling Morphology
of Co Oxide Nanocrystal Structures by Adding Spectator Ni Ions Bull. Korean Chem.
Soc 33, No. 2, (2012) 505.
29. Nasser A. M Barakat, Myung Seob Khil, Faheem A Sheikh. Synthesis and Optical
Properties of Two Cobalt Oxides (CoO and Co3O4) Nanofibers produced by
Electrospinning Process. J. Phys. Chem. C 112, (2008) 12225–12233.
30. Jin-bing Lia; Zhi-quan Jiangb; Kun Qianb; Wei-xin Huang, Effect of Calcination
Temperature on Surface Oxygen Vacancies and Catalytic Performance Towards CO
Oxidation of Co3O4 Nanoparticles Supported on SiO2 Chin. J. Chem. Phys. 25, No.
1, (2012) 103-109.
31. Farhadi Saeid, Pourzare Kolsoum et al. Simple preparation of ferromagnetic Co3O4
nanoparticles by thermal dissociation of the [CoII(NH3)6](NO3)2 complex at low
temperature J Nanostructure Chem 3, (2013) 16.
32. H. Song, U. Ozkan. The role of impregnation medium on the activity of ceria-
supported cobalt catalysts for ethanol steam reforming. J. Mol. Catal. A: Chem. 318,
(2010) 21-29.
33. Boaro Marta, Vicario Michela et al., The use of temperature-programmed and
dynamic/transient methods in catalysis: characterization of ceria-based, model three-
way catalysts. Catal. Today 77, (2003) 407–417.