catalytic oxidative dehydrogenation of propane over...
TRANSCRIPT

t
es
strywere moren increasenstrate thet tempera-result and
Journal of Catalysis 223 (2004) 419–431www.elsevier.com/locate/jca
Catalytic oxidative dehydrogenation of propane over Mg–V/Mo oxid
Jason D. Pless,a Billy B. Bardin,b Hack-Sung Kim,a Donggeun Ko,a,c Matthew T. Smith,b
Robin R. Hammond,b Peter C. Stair,a and Kenneth R. Poeppelmeiera,∗
a Department of Chemistry, Institute for Environmental Catalysis, Northwestern University, 2145 Sheridan Road, Evanston, IL 60208-3113, USAb The Dow Chemical Company, 3200 Kanawha Turnpike, South Charleston, WV, 25303, USAc Research and Development Center, Rubicon Technology Inc., Bannockburn, IL 60015, USA
Received 13 October 2003; revised 15 January 2004; accepted 22 January 2004
Abstract
Fifteen distinct MgO–V2O5, MgO–MoO3, MgO–V2O5–MoO3, and V2O5–MoO3 compositions were prepared using sol–gel chemiand their selectivities and conversions for propane oxidative dehydrogenation (ODH) to propylene were measured. The vanadatesactive than the molybdates at lower temperatures; however, the molybdates exhibited higher selectivities at similar conversions. Ain both ODH conversion and selectivity with molybdenum substitution on vanadium sites was also observed. These results demoimportance of the bulk structure on the ODH reaction. In general, propylene selectivities increased with increasing conversions atures above 673 K when oxygen depletion in the reactant stream occurred. Visible and UV Raman spectroscopy corroborates thishelps focus attention on critical surface-specific information. A new Raman peak was observed for the partially reduced MgMoO4 and isassociated with a three-coordinate surface oxygen. 2004 Elsevier Inc. All rights reserved.
Keywords: Propane; Oxidative dehydrogenation; ODH; Magnesium, vanadium, and molybdenum oxides; Raman spectroscopy
y-nd–6].
eneide-ro-24],andiatedur-e thethe
con-9].the
tion
-
wn.neenthe
eity
n
n thes in
mo-m-–36].ove-
1. Introduction
The selective conversion of short chain alkanes (C3H8–C5H12) to useful intermediates via catalytic oxidative dehdrogenation (ODH) is of interest to the petrochemical aenergy industries and has been studied extensively [1The oxidative dehydrogenation of propane to propylhas been studied using vanadium- and molybdenum-oxbased catalysts [7–17]. The reaction is believed to pceed by a Mars–van Krevelen reaction mechanism [18–in which adsorbed propane reacts with lattice oxygenthe reduced metal oxide reacts with adsorbed, dissocO2 [25]. A fundamental understanding of the active sface(s) and the reaction mechanism is needed to improvselectivity and conversion of propane ODH and increaseyield of propylene.
Magnesium vanadium oxide catalysts have receivedsiderable attention for the ODH of propane [6–12,26–2It is generally accepted that the reaction proceeds byabstraction of a hydrogen from the alkane and reduc
* Corresponding author.E-mail address: [email protected] (K.R. Poeppelmeier).
0021-9517/$ – see front matter 2004 Elsevier Inc. All rights reserved.doi:10.1016/j.jcat.2004.01.023
of a tetrahedrally coordinated V5+ species [26]. Magnesium orthovanadate, Mg3(VO4)2, contains isolated VO43−anions [30], and the pyrovanadate, Mg2V2O7, is composedof corner-shared VO4 tetrahedra in the V2O7
4− units [31].However, the specific structure of the active site is unknoKung and co-workers attribute the selectivity for propyleto the Mg3(VO4)2 structure, and suggest that the oxygatoms in the V–O–Mg bonds are harder to reduce thanbridging oxygen in the V–O–V bonds in Mg2V2O7 [28,29].In contrast, Volta and co-workers report that Mg2V2O7 isthe selective phase and Mg3(VO4)2 leads to the completoxidation of the alkanes [8]. They relate the selectivwith the ability of the corner-shared VO4 tetrahedra in theV2O7
4− anion to stabilize V4+ associated with an oxygevacancy [27]. Conversely, Fang et al. state that Mg3(VO4)2exhibits a higher conversion, but Mg2V2O7 is more selec-tive at the same conversions [12]. These discrepancies icatalytic properties generally are attributed to differencepreparation methods [9,28,32].
Several authors have demonstrated that magnesiumlybdates exhibit higher selectivities but lower activities copared to those of the magnesium vanadates [14,15,33Interestingly, each of these reports describes an impr

420 J.D. Pless et al. / Journal of Catalysis 223 (2004) 419–431
lude
od-
ac-
ast,ion
DH
sts.ase-
na-
rys-re-by
eporum
a-ram
s
idepli-
Cata[8,9
atetallly,
tioncelt in]. In
the, thetheate
entsrage
derere
un-uch
re-eac-
ap-on-
theace.theec-pec-es ofi-and
-tricar),ndh)re-
aterlysisre-at
ere
ose
im-for
)
)pare
ndx-anolple
egaku
ys-ata
ment in the catalytic activity of MgMoO4 with a slight ex-cess of molybdenum oxide. Cadus and co-workers concthat a synergistic effect between MgMoO4 and MoO3 resultsin the enhanced activity [35]. They relate the effect to a mification of the active sites of the two phase MgMoO4–MoO3catalyst [35]. Similarly, Lee et al. attribute the improvedtivity to MoOx clusters on the surface of MgMoO4 [36].Their conclusion is based on studies of MoO3 supported on“inactive” MgMoO4 and treatments of MgMoO4 with acidand base solutions to modify their surfaces [36]. In contrMiller et al. assign the increased activity to the formatof MgMo2O7 [17], which forms from the reaction of MoO3and MgMoO4.
The three phases, Mg2V2O7, Mg3(VO4)2, and MgMoO4,have been shown to be active and selective for the Oof propane; therefore, the more complex MgO–V2O5–MoO3 system should contain interesting ODH catalyPreviously, Harding and co-workers investigated the phequilibria of MgO–V2O5–MoO3 and reported the discovery of two new features: a new compound Mg2.5VMoO8and molybdenum substitution into magnesium orthovadate, Mg3−x(V1−xMoxO4)2, ∼ 0.03 > x > 0 [37]. Theauthors state that molybdenum substitutes into both ctal lattices, such that the oxidation state of vanadiummains unchanged; electrical neutrality is maintainedthe presence of magnesium vacancies. Wang et al. rconsiderable substitution of vanadium and molybdeninto the Mg2.5VMoO8 structure, Mg2.5+xV1+2xMo1−2xO8(−0.05� x � 0.05) [38]. Zubkov and co-workers emphsize a third, interesting aspect in the ternary phase diagthe coexistence of the solid solution V2−2xMo2xO5+x ,∼ 0.15> x > 0 with MgMoO4 [39]. This result suggestthat MgMoO4 can serve as a support for V2−2xMo2xO5+x .
The mixing of the constituent oxides, competitive sreactions, and/or the presence of trace impurities can comcate the preparation of single-phase catalyst samples.lysts have been prepared by impregnation techniques15,26,34], or the reaction of metal solutions stabilizedcontrasting pH [14,16,17], which can lead one of the mspecies to preferentially precipitate from solution. Generasingle-phase mixed metal oxides form at high calcinatemperatures (> 973 K), but the samples have low surfaareas [8]. Calcinations at lower temperatures often resuincomplete reactions and a mixture of phases [8,9,14,17this study, a series of mixed metal oxides in the MgO–V2O5–MoO3 ternary system were prepared for the first time, tobest of our knowledge, by a sol–gel method. In generalsol–gel method allows single-phase samples to be synsized at lower temperatures (823 K) because of the intimand nearly homogeneous mixing of the constituent elemThe lower reaction temperatures result in a smaller aveparticle size and an increased surface area.
Catalyst structure may depend on the conditions unwhich the sample has been characterized [40–45], thfore it is important to study the structure of a catalystder conditions that replicate the reaction conditions. S
t
,
-,
-
.
-
in situ characterization might provide insight into theaction mechanism(s) that occur(s) during the applied rtion conditions. Raman spectroscopy recently has beenplied successfully to examine catalysts during reaction cditions [43,44,46–48].
The present work is directed toward understandingreaction pathway of propane ODH on the catalyst surfWe report the novel synthesis of compositions found inMgO–V2O5–MoO3 ternary system and compare their seltivities and conversions for the propane ODH. Raman stroscopy was used to characterize the (surface) structurMg3(VO4)2 and MgMoO4 during replicated reaction condtions. These results are related to the ODH selectivitiesconversions.
2. Experimental
Fifteen catalysts found in the MgO–V2O5, MgO–V2O5–MoO3, MgO–MoO3, and V2O5–MoO3 systems were prepared by a sol–gel technique (Table 1). Stoichiomeamounts of magnesium ethoxide (Mg 21–22%, Alfa Aesvanadium triisopropoxide oxide (95–99%, Alfa Aesar), abis(acetylacetonato)dioxomolybdenum(VI) (99%, Aldricwere dissolved in 2-methoxy ethanol (99%, Aldrich) andfluxed. An appropriate amount of a 5% by volume NH4OHaqueous solution was added so that four equivalents of wwere present for every –OR group. This ensured hydroof the alkoxide groups. Upon hydrolysis, the sample pcipitated from solution. After evaporation of the solvent383 K, the samples were calcined in a flow of O2 for 12 hat 823 K. Higher reaction temperatures (up to 1273 K) wrequired to synthesize the three Mg2.5+xV1+2xMo1−2xO8(x = −0.04, 0, and 0.04) compounds (respectively,E, F,andG). A 1:2 molar mixture of Mg3(VO4)2/MgMoO4 (H)was prepared to compare its catalytic properties with thof Mg2.5VMoO8 (F). The V2−2xMo2xO5+x (x = 0, 0.07,and 0.14)-supported catalysts (respectively,L, M, and N)were synthesized by first preparing the MgMoO4 support bythe above procedures. After calcination, the support waspregnated with stoichiometric amounts of the alkoxidesa 2% by molarity V2−2xMo2xO5+x (x = 0, 0.07, and 0.14and the samples were recalcined for 12 h at 823 K.
A reference sample of Mg2V2O7 (Table 1, footnote cwas prepared by a solid-state ceramic technique to comits particle size with the sol–gel prepared Mg2V2O7 (B).Stoichiometric amounts of MgO (99.95%, Alfa Aesar) aV2O5 (99.6+%, Aldrich) were combined and the metal oides were mixed using an agate mortar and pestle. Ethwas added to help achieve an intimate mixture. The samwas calcined in a flow of O2 for 12 h at 873 K.
X-ray diffraction (XRD) patterns of the polycrystallinsamples were recorded at room temperature on a Ridiffractometer (Cu-Kα radiation, Ni filter, 40 kV, 20 mA;2θ = 10–70◦, 0.05◦ step size, and 1-s count time). The crtalline phases were identified by comparison with the d

J.D. Pless et al. / Journal of Catalysis 223 (2004) 419–431 421
t
Table 1Physical properties of metal oxides in the MgVO, MgMoO, MgVMoO, and VMoO systems
Ref.a Targeted Calcination Structure of PDFb Surface area Physicallabel formulation temperature fresh catalyst Ref. (m2 g−1) appearance
(K) (by XRD) card of fresh catalys
A MgV2O6 (meta) 823 MgV2O6 45-1050 4.3 Light yellowB Mg2V2O7 (pyro)c 823 α-Mg2V2O7 31-0816 9.0 Off whiteC Mg3(VO4)2 (ortho) 823 Mg3(VO4)2 37-0351 29.3 Off whiteD Mg2.98(V0.98Mo0.02O4)2 823 Mg3(VO4)2 37-0351 26.5 Dull yellowE Mg2.54V1.08Mo0.92O8 1223 Mg2.5VMoO8 82-2074 0.91 WhiteF Mg2.5VMoO8 1173 Mg2.5VMoO8 82-2074 0.62 Dull yellowG Mg2.46V0.92Mo1.08O8 1323 Mg2.5VMoO8 82-2074 0.29 Dull yellowH 1:2 molar ratio 823 Mg3(VO4)2/ 37-0351 28.0 Off white
Mg3V2O8/MgMoO4 β-MgMoO4 72-2153I Mg0.992MoO3.992
d 823 β-MgMoO4 72-2153 4.2 Pale grayJ Mg1.015MoO4.015
e 823 β-MgMoO4 72-2153 11.1 WhiteK MgMo2O7 823 MgMo2O7 32-0622 2.4 WhiteL 2%V2O5/MgMoO4 823 β-MgMoO4/ 72-2153 4.0 Pale gray
V2O5 41-1426M 0.14%MoO3/ 823 β-MgMoO4/ 72-2153 3.8 Pale gray
1.86%V2O5/ V2O5 41-1426MgMoO4
N 0.28%MoO3/ 823 β-MgMoO4/ 72-2153 3.9 Pale gray1.72%V2O5/ V2O5 41-1426MgMoO4
O MoV2O8 823 MoV2O8/ 74-1510 2.2 BrownV2O5 41-1426
a A–D are MgVO,E–H are MgVMoO,J–K are MgMoO,L–N are VMoO supported on MgMoO, andO is VMoO.b Powder diffraction file reported in the JCPDS (Joint Committee of Powder Diffraction Standards) database.c A single-phase sample was prepared by the solid-state technique and had a surface area of 1.1 m2 g−1.d XRD indicates single-phase sample; however, the sample is likely to consist of a mixture of MgMoO4 and MoO3.e XRD indicates single-phase sample; however, the sample is likely to consist of a mixture of MgMoO4 and Mg(OH)2.
ac-
onour-tru-ting
atfor
ointd-
Ac-nt aface
ofnd
M.with
ho-el
e theles
ith
uc-
pre-
to aser-
er,CD
refer-an
i-
dnerereting
reported in the JCPDS (Joint Committee of Powder Diffrtion Standards) database.
Thermal gravimetric analysis (TGA) was performedthe Mg3(VO4)2 sol–gel precipitate in flowing oxygen tstudy the combustion of the residual alkoxide moieties ding calcination. Measurements were made on a TA Insments TGA 2950 thermogravimetric analyzer. The heaprofile was a linear ramp from room temperature to 723 K2 K min−1. The sample was held isothermally at 723 K12 h and then heated to 923 K at 2 K min−1.
Surface areas were measured by N2 adsorption at 77 Kusing an OMNISORP 360 and determined using a 5-pBrunauer, Emmet, and Teller (BET) method. Krypton asorption measurements, using a Micromeritics ASAP (celerated Surface Area and Porosimetry) 2405 Instrume77 K, were made for the accurate determination of surareas that were< 1 m2 g−1.
Scanning electron microscopy (SEM) micrographsMg2V2O7 prepared by the solid-state technique, aMg2V2O7 (B) and Mg3(VO4)2 (C) prepared by the sol–gel method, were obtained with a Hitachi S-4500 FE-SESamples were deposited on carbon tape and coated5 nm of gold to prevent charging.
Inductively coupled plasma-atomic emission spectroptometry (ICP-AES, Thermo Jarrell Ash Atomscan Mod25 Sequential ICP spectrometer) was used to determinMg/Mo atomic ratios in the magnesium molybdate samp
t
(I andJ). Approximately 0.1 g samples were dissolved w6 ml of 15.8 M HNO3 and diluted to∼ 20 µg ml−1 of so-lution. The samples were further diluted to∼ 1 µg ml−1 ofsolution to inspect for possible contaminants using indtively coupled plasma-mass spectroscopy (ICP-MS).
Visible Raman spectra were obtained for the sol–gelpared Mg2V2O7 (B), Mg3(VO4)2 (C), Mg2.98(V0.98Mo0.02-O4)2 (D), 1/2 molar mixture Mg3(VO4)2/MgMoO4 (H),Mg0.992MoO3.992 (I), and Mg1.015MoO4.015 (J). The metaloxides were sieved to 60/140 mesh particles and∼ 0.5 cm ofmaterial was packed and centered into a∼ 2-cm-long quartztube (i.d., 3.0 mm; o.d., 5.0 mm). Samples were loaded inhigh-pressure cell and translated laterally to minimize lainduced damage. The spectra were collected using∼ 60 mWof 514.5 nm radiation of a Lexel Model 95 Argon ion lasand a SPEX triplemate spectrograph equipped with a Cdetector. An acetaminophen standard was used as aence to calibrate the spectra. In addition, visible Ramspectroscopy characterized the structures of Mg3(VO4)2 (C)and Mg0.992MoO3.992 (I) during replicated reaction condtions. The samples were exposed to reaction gas (30% C3H8,10% O2, and 60% N2 by volume) flowing at 50 standarcm3 min−1 (sccm, ml min−1) while the spectra were takeat 303, 623, 673, 723, and 798 K. Then, the samples wreoxidized at 798 K with flowing air while the spectra wetaken. Spectra of fresh samples were collected while heaat 798 K in a 100 sccm flow of He.

422 J.D. Pless et al. / Journal of Catalysis 223 (2004) 419–431
ectivity
ed on
Table 2Oxidative dehydrogenation of propane over magnesium vanadates and molybdatesa
Ref. Targeted formulation Mass 5% conversionb 10% conversionb High conversionc
label tested Selectivity Temperature Selectivity Temperature Temperature Conversion Sel(g) (%) (K) (%) (K) (K) (%) (%)
A MgV2O6 (meta) 2.07 57.2 626 44.2 661 811 15.2 47.6B Mg2V2O7 (pyro) 1.67 54.5 638 47.4 671 807 15.6 53.1C Mg3V2O8 (ortho) 1.70 23.4 641 29.1 698 807 12.6 40.3D Mg2.98(V0.98Mo0.02O4)2 1.71 46.0 623 40.6 652 804 16.5 55.6E Mg2.54V1.08Mo0.92O8 2.28 – – – – 807 4.6 38.4F Mg2.5VMoO8 2.64 45.2 806 – – 808 5.4 40.2G Mg2.46V0.92Mo1.08O8 2.75 57.4 763 46.8 806 809 10.4 46.0H 1:2 Mg3V2O8/MgMoO4 1.56 29.7 702 30.8 738 806 13.2 40.5I Mg0.992MoO3.992 2.30 76.8 690 71.3 724 808 18.6 61.8J Mg1.015MoO4.015 2.01 46.0 731 44.6 742 806 15.4 49.2K MgMo2O7 2.53 70.7 678 61.3 714 798 17.3 58.8L 2%V2O5/ MgMoO4 2.34 59.6 678 54.1 718 813 16.8 59.3M 0.14%MoO3/1.86% 2.44 61.1 673 47.4 707 813 18.2 60.5
V2O5/ MgMoO4N 0.28%MoO3/1.72% 2.33 66.2 677 52.0 710 814 17.8 60.4
V2O5/MgMoO4O MoV2O8 2.82 35.2 620 17.1 676 811 12.9 35.5
Quartz chips – – – – – 808 3.3 51.1
a Test conditions: 30% C3H8, 10% O2 (50 psig, 4000 GHSV, total flow= 133 sccm 14/30 mesh catalyst). Conversion and selectivity computed basgas-phase components only.
b Interpolated from the observed data.c Highest conversion obtained.
li-col-r-r(les
le-ulit-tor
hylOneThegas,
th aa1 hKN
idal
ereane.n tohedver-
own
dor-e of
atedper-cteds re-ith aheld, the
wa-s andhro-tor.ole-ol-890nd aitiesd by
UV Raman spectroscopy characterized Mg3(VO4)2 (C)and Mg0.992MoO3.992 (I) after they were exposed to repcated reaction conditions. The UV Raman spectra werelected using∼ 5 mW of the 244 nm line, which was geneated by frequency doubling the 488 nm output of an A+ion laser to 244 nm using a temperature-tuned BBOβ-BaB2O4) crystal. The Raman scatterings from the sampwere collected using an ellipsoidal mirror, in an 180◦ back-scattering geometry, coated with Al:MgF2 to improve UVreflectivity. The photons were focused onto a Spex tripgrating spectrometer equipped with an imaging photomplier tube. The spectral resolution is limited by the detecto ∼ 20 cm−1. Standards of chloroform, cyclohexane, etacetate, and Teflon were used to calibrate the spectra.gram samples were placed into a fluidized bed cell [49].samples were exposed to a 30 sccm flow of reaction(75% C3H8 and 25% O2 by volume) for 1 h at 303, 623, 673723, and 798 K. Then, the samples were reoxidized wi7.5 sccm flow of O2 for 1 h at 798 K. In addition, spectrwere collected after heating fresh samples at 798 K forin a 25 sccm flow of He. All samples were cooled to 298before the UV Raman spectra were taken under flowing2for 1 h. This procedure was adopted to protect the ellipsomirror from heat damage.
The selectivities and conversions of the metal oxides wmeasured for the oxidative dehydrogenation of propCatalyst powders were pressed at 1020 atm for 15 miform a 3.18-cm-diameter tablet. The tablet was then crusand sieved to 14/30 mesh particles. Propane ODH consions and selectivities were tested in a packed bed, d
-
-
flow reactor using 2 cm3 of catalyst. The catalyst was dilutewith 2 cm3 of quartz chips (14/30 mesh) to prevent the fmation of temperature gradients. A reactant gas mixtur39.9 sccm C3H8, 13.3 sccm O2, and 79.8 sccm N2 was in-troduced into the reactor at 3.4 atm. The reactor was heto 573 K, data were collected after 3 h, and then the temature was increased by 25 K. Again, the data were colleafter the reaction proceeded for 3 h. This procedure wapeated until data had been collected every 25 to 773 K wfinal 35 K increase to 808 K, where the temperature wasfor 24 h and data were collected every 3 h. In all studiesreactor effluent passed through a condenser to removeter and liquid oxygenated products. Gas-phase reactantproducts were analyzed with an on-line HP 6890 gas cmatograph equipped with a thermal conductivity detecChromatograph separation was accomplished with a mcular sieve column, a Poroplot Q, and an alumina/KCl cumn. The condensate was analyzed offline with an HP5Series II chromatograph using a Supelcowax column aflame ionization detector. The conversions and selectivlisted in Table 2 are based on carbon and are calculatethe following equations:
Conversion= ((3∗ [C3H6] + [CO] + [CO2]
)
/(3∗ [C3H8]reactant
)) ∗ 100%,
Selectivity= ((3∗ [C3H6]
)
/(3∗ [C3H6] + [CO] + [CO2]
)) ∗ 100%.

J.D. Pless et al. / Journal of Catalysis 223 (2004) 419–431 423
gelD)nsith-ns.
-
ein-
hee
3].
be-topec
ides
dture
thedatasingingponliesthe
ma-and
entg/Vs of
rm
n-eThel–the
in
-
on-
ce,
a-
totran-yl
3. Results and discussion
3.1. Catalyst synthesis and characterization
Metal oxides were synthesized at 823 K by the sol–method and analyzed with powder X-ray diffraction (XR(Fig. 1). Examination of the powder diffraction patterreveals the formation of the targeted compositions wout the presence of trace impurities with a few exceptioThe MoV2O8 (O) and the three Mg2.5+xV1+2xMo1−2xO8compositions (E, F, and G) were not single-phase samples at 823 K. The diffraction pattern forO containspeaks indicative of V2O5. It has been reported that thpreparation method and the calcination temperaturefluence the composition of Mo–V oxides [50–52]. TMg2.5+xV1+2xMo1−2xO8 structure is located along thMg3(VO4)2–MgMoO4 tie line. A mixture of Mg3(VO4)2and MgMoO4 is present at 823 K because the Mg2.5VMoO8-type structure does not form appreciably below 1173 K [5A single phase of Mg2.5VMoO8 (F) was formed at 1173 K(Fig. 2). Temperatures of 1223 and 1323 K (which arelow its peritectic melting point, 1423 K) were neededincorporate the excess vanadium and molybdenum, restively, into the Mg2.5+xV1+2xMo1−2xO8 structure and formMg2.54V1.08Mo0.92O8 (E) and Mg2.46V0.92Mo1.08O8 (G).
Fig. 1. Powder diffraction patterns for the sol–gel-prepared metal oxcalcined at 823 K: (a) MgV2O6; (b) Mg2V2O7; (c) Mg3(VO4)2;(d) Mg2.98(V0.98Mo0.02O4)2; (e) 37.0% Mg3(VO4)2/MgMoO4;(f) 1:2 Mg3(VO4)2/MgMoO4; (g) 29.9% Mg3(VO4)2/MgMoO4;(h) Mg0.992MoO3.992; (i) Mg1.015MoO4.015; (j) MgMo2O7; (k) 2% V2O5on MgMoO4; (l) 1.86% V2O5, 0.14% MoO3 on MgMoO4; (m) 1.72%V2O5, 0.28% MoO3 on MgMoO4; (n) MoV2O8, impurity V2O5(∗).Diffraction patterns were taken at room temperature in air.
-
Fig. 2. Powder diffraction patterns of (a) Mg2.54V1.08Mo0.92O8;(b) Mg2.5VMoO8; (c) Mg2.46V0.92Mo1.08O8; calcined at 1173, 1223, an1323 K, respectively. Diffraction patterns were taken at room temperain air.
Combustion of the residual alkoxide moieties duringcalcination of the Mg3(VO4)2 precipitate was investigatewith thermogravimetric analysis. Inspection of the TGA dshowed a continuous weight loss of 25.2% upon increathe temperature from room temperature to 723 K in flowO2. However, no additional weight loss was observed uincreasing the temperature from 723 to 973 K. This impthat all of the organic compounds were combusted whensamples were calcined at 823 K for 12 h.
The physical properties of the metal oxides are sumrized in Table 1. Surface areas increased as the Mg/VMg/Mo atomic ratios increased. This, in turn, is consistwith increasing melting points for the samples as the Mand Mg/Mo atomic ratios increase. The low surface areathe Mg2.5+xV1+2xMo1−2xO8 samples (E, F, andG) are aresult of the high calcination temperatures required to fosingle-phase samples.
Scanning electron micrographs (Fig. 3) of Mg2V2O7prepared by the solid-state technique, and Mg2V2O7 (B)and Mg3(VO4)2 (C) prepared by the sol–gel method, cofirm the small (< 500 nm), uniform particle size of thesmetal oxides prepared by the sol–gel method at 823 K.smaller size of the Mg2V2O7 particles prepared by the sogel method compared with the sample synthesized bysolid-state technique is evident from the figures.
Raman spectra of select metal oxides are shownFig. 4. The spectra of Mg2V2O7 (B), Mg3(VO4)2 (C),and Mg0.992MoO3.992 (I) are consistent with previously reported spectra [54–56]. Minor shifts (� 1 cm−1) in thepeak positions betweenC and Mg2.98(V0.98Mo0.02O4)2 (D)were detected but no additional peaks were found, cfirming the absence of MgMoO4 (996 cm−1) and MoO3(826 cm−1) [57]. Large backgrounds, due to fluorescenwere seen in the spectra of the 1:2 molar Mg3(VO4)2/
MgMoO4 (H) and Mg1.015MoO4.015 (J). The backgroundin the spectrum ofJ is so intense that the vibrational fetures barely can be discerned.
The source of fluorescence is difficult to attributea specific origin, because organic phases [58], tracesition metal impurities [58] (e.g., iron), and/or hydrox

424 J.D. Pless et al. / Journal of Catalysis 223 (2004) 419–431
h-ded
shednot. Eles of
pledthat
conthewasd in
cencom
DHote
en isin-0%ap-artzdOod-ce-atedtivi-byofandwillV–
ates
at-fseK
aseanities
Fig. 3. SEM micrographs of (a) Mg2V2O7 prepared by the solid-state tecnique calcined at 873 K; (b) Mg2V2O7 prepared by a sol–gel methocalcined at 823 K; (c) Mg3(VO4)2 prepared by a sol–gel method calcinat 823 K.
groups [59] can cause fluorescence. It was establifrom the TGA experiments that an organic phase ispresent and therefore cannot cause the fluorescencemental analysis was used to analyze the compositionthe magnesium molybdate samples. Inductively couplasma-atomic emission spectrophotometry confirmedthe stoichiometries of the magnesium molybdates (I andJ)were Mg0.992MoO3.992 and Mg1.015MoO4.015, respectively.Inductively coupled plasma-mass spectroscopy showedtamination of boron, silicon, phosphorous, and zinc onparts per billion scale in the samples. The fluorescencenot attributed to these contaminants since they are founboth samples. These results suggests that the fluoresoriginates from hydroxyl groups that would be present frthe excess magnesium (as Mg(OH)2) in J.
-
-
e
Fig. 4. Raman spectra of (a) Mg2V2O7; (b) Mg3(VO4)2;(c) Mg2.98(V0.98Mo0.02O4)2; (d) 1:2 molar ratio of Mg3(VO4)2/
MgMoO4; (e) Mg0.992MoO3.992; (f) Mg1.015MoO4.015.
3.2. Reaction studies
A summary of the gas-phase data from the propane Oexperiments is presented in Table 2. It is important to nthat the reactant gas mixture is propane rich, and oxygthe limiting reagent [60]. Therefore, the maximum obtaable conversion is 66.7% for an ODH reaction that is 10selective with respect to the formation of propylene. Nopreciable conversion was observed from the reactor or quchips at temperatures� 808 K. The main products obtaineduring the catalytic testing were propylene, CO, and C2;occasionally, minor amounts of the liquid oxygenated pructs, acrolein, acrylic acid, acetic acid, propionic acid, atone, and unknowns, were detected. When the oxygencomponents are included in the calculations, the selecties decrease by< 1%, while the conversions increase< 2%. The carbon balance is within 95–105% for allthe reactions. Significant differences in the conversionsselectivities exist between the catalysts, so the resultsbe discussed in families of materials: the Mg–V–O, Mg–Mo–O, Mg–Mo–O, and the V–Mo–O-based catalysts.
The selectivity and conversion data of the vanad(A, B, and C) are plotted in Fig. 5. MgV2O6 (A) exhib-ited higher selectivities and conversions than Mg2V2O7 (B)and Mg3(VO4)2 (C) at temperatures below 598 K, whileBdisplayed the highest selectivities and conversions ofA, B,andC at temperatures above 698 K. For example,B had aselectivity of 53.1% and conversion of 15.6% at 808 K. CalystC showed the lowest selectivities and conversions oA,B, andC at all temperatures. Additionally, a slight decreain the conversion ofC was observed after 24 h at 807from the initial conversion of 12.6 to 12.2%. This decreis associated with coke formation detected with UV Ramspectroscopy. At temperatures above 698 K, the selectiv

J.D. Pless et al. / Journal of Catalysis 223 (2004) 419–431 425
sts.rre-
lec-
ta-
-nent
ndand
on-the
ons.f O
n obtionaebyUV
r-
ta
m-
d, andr,
n se-se-
%ely.rstion
. Ined,toof
hy-ea-
eenver-ift ofars
rva-ngle7).s the
e
ec-n
y-
n-ity
Fig. 5. Catalytic results for the ODH of propane with the Mg–V–O catalySolid symbols correspond to the conversion, and hollow symbols cospond to selectivity. Test conditions: 30% C3H8, 10% O2 (50 psig, 4000GHSV, total flow= 133 sccm 14/30 mesh catalyst). Conversion and setivity computed based on gas-phase components only.
Fig. 6. Total O2 and COx detected in the product stream of Mg–V–O calysts during the ODH of propane. Solid symbols correspond to the O2, andhollow symbols correspond to COx . Test conditions: 30% C3H8, 10% O2,and 60% N2 (50 psig, 4000 GHSV, total flow= 133 sccm 14/30 mesh catalyst). Conversion and selectivity computed based on gas-phase compoonly.
and conversions of the catalysts decreased as follows:B >
A > C. These results parallel the electrical conductivity aband-gap energy data reported by Volta and co-workersdescribed in the Introduction [27].
The initial selectivities decreased with increasing cversion, but, interestingly, at temperatures above 673 Kselectivities began to increase with increasing conversiThis phenomenon is related to the complete depletion o2in the reactant stream (Fig. 6). Upon depletion of O2 fromthe reactant stream, the increase in propane conversioserved as the temperature increases occurs with an addiconsumption of the lattice oxygen from the catalyst, therreducing the catalyst, as observed in the visible andRaman spectroscopy measurements of Mg3(VO4)2 (C) andMg0.992MoO3.992 (I). Note, however, that the selective fo
s
-l
Fig. 7. Conversion versus selectivity. Test conditions: 30% C3H8, 10% O2(50 psig, 4000 GHSV, total flow= 133 sccm 14/30 mesh catalyst). Dacomputed based on gas-phase components only.
mation of propylene after oxygen depletion is also accopanied by an unvarying production of COx . In general, theamount of CO produced increased while the CO2 decreasedas the temperature increased and the reaction proceedethis shift from CO2 to CO provides a quantitative markebased on the oxygen mass balance, for the increase ilective ODH. The calculated increase in the propylenelectivity and conversion for Mg2V2O7 (B) that results fromthe shift of CO2 to CO between 703 and 807 K is 5.2(46.4 to 51.6%) and 1.6% (13.6 to 15.2%), respectivThus, when depletion of O2 in the reactant stream occuand as the temperature increases, a more efficient utilizaof oxygen is realized leading to an increase in selectivityaddition, while the analysis of hydrogen was not performthe dehydrogenation reaction is also likely to contributethe selective conversion of propylene. The observationcoke formation, which typically accompanies catalytic dedrogenation, was detected by UV Raman spectroscopy msurements on the Mg3(VO4)2 (C) catalyst following reactionat 723 and 798 K. Based on the good agreement betwthe observed selectivity of propylene 53.1% (see Fig. 5)sus the percentage calculated or expected from the shCO2 to CO (51.6%), the dehydrogenation reaction appeto make a minor contribution. Consistent with these obsetions, the data acquired after oxygen depletion lie on a sicurve when conversion versus selectivity is plotted (Fig.This suggests that the surface structure(s), and perhapactive site(s), of the reduced magnesium vanadates (A, B,andC) and molybdates (I andJ) are similar, although thercould be other possible explanations.
A significant improvement in the conversion and seltivity of Mg3(VO4)2 (C) was observed with the substitutioof molybdenum into the structure. CatalystC reached 10%conversion at 698 K with a 29.1% selectivity for proplene. In contrast, Mg2.98(V0.98Mo0.02O4)2 (D) reached 10%conversion at 652 K with a selectivity of 40.6%. Additioally, D exhibited a higher conversion (16.5%) and selectiv(55.6%) thanA, B, and C at 808 K. A small increase in

426 J.D. Pless et al. / Journal of Catalysis 223 (2004) 419–431
rilyn.ith
va-
oreheich,ox-the
elecwithutena-].in-
theerstionase-
eeen
sted-%.ystsThe
the
t
–Obols
and
ofth
ithfor
n-ygenlow
d 5%olyb-
aseds ex-tical
thewn toeac-UV–cor-[69].fromac-mesH
tes
tiv-ucts2%ted.r
elec-
ta-bols
and
the liquid oxygenated products (0.37% vs 0.11%), primaacrolein, was observed with the molybdenum substitutio
The increase in conversion and selectivity seen wmolybdenum substitution is associated with Mg cationcancies formed from the substitution of Mo6+ for V5+. Thedata suggest that these cation vacancies allow for a mfacile diffusion of the lattice oxygen to the surface of tcatalyst. Furthermore, the cation vacancy is electron rrendering the oxide anions more basic. The more basicide anion can more easily abstract a hydrogen atom fromadsorbed propane. Similar increases in conversion and stivity associated with cation vacancies have been seenother oxidation catalysts [61–66]. Sleight and Linn attribthe increase in selectivity and activity to the more basicture of the oxide anions, promoting allyl formation [61Tsunoda et al. [63] and Fan et al. [62] suggest that thecrease in activity is due to the more facile diffusion ofoxide anions through the bulk structure. Li and co-workpropose that the cation vacancies allow for the formaof Mo=O and distorts the Mo(V)O4 tetrahedron creatingstronger Bi–O–V bond [64]. They suggest the enhancedlectivity results from the Mo=O double bond, and that thincreased conversion is due to a synergistic effect betwthe Mo=O and the Bi–O–V bonds [64].
The magnesium vanadium molybdates (E, F, and G)showed the lowest conversions of all the catalysts te(Fig. 8). The Mg2.5VMoO8 catalyst (F) reached a maximum conversion of only 5.4% with a selectivity of 40.2Again, the conversions and selectivities of the catalincreased with increasing molybdenum substitution.Mg2.54V1.08Mo0.92O8 sample (E) had a conversion of 4.6%and selectivity of 38.4% at 808 K, but an increase ofmolybdenum content to Mg2.46V0.92Mo1.08O8 (G) improvedthe conversion (10.4%) and selectivity (46.0%). CatalysG
Fig. 8. Catalytic results for the ODH of propane with the Mg–V–Mocatalysts. Solid symbols correspond to the conversion, and hollow symcorrespond to selectivity. Test conditions: 30% C3H8, 10% O2 (50 psig,4000 GHSV, total flow= 133 sccm 14/30 mesh catalyst). Conversionselectivity computed based on gas-phase components only.
-
had a comparable conversion and better selectivity thanC at808 K, which is similar to the results seen with the ODHn-butane [37]. In contrast to the previous results seen wiCandD, smaller amounts of oxygenated products formed wincreasing molybdenum concentration (0.39 and 0.95%G andE, respectively). An increase in selectivity with icreasing conversion was not observed because the oxwas not depleted in the reactant stream as a result of theconversions.
Magnesium molybdates (I, J, and K) exhibited lowerconversions than the vanadates (A, B, andC) at tempera-tures below 723 K. For example, the vanadates reacheconversion at temperatures near 630 K, whereas the mdates reached the 5% conversion at∼ 700 K. The rate ofpropane conversion over the molybdate catalysts increquickly, such that at higher temperatures the molybdatehibited higher conversions than the vanadates. At idenconversions, the molybdates were more selective thanvanadates. Weaker metal–oxygen bonds have been shoincrease the activity, but decrease the selectivity of the rtion [29,67,68]. Chen et al. show that a decrease in thevisible absorption-edge energy of metal oxide catalystsrelates to an increase in the propane ODH turnover rateThey state that the energy required to transfer electronsthe oxygen to the metal is an indication of the C–H bondtivation energy and that as the metal–oxygen bond becomore difficult to break, the turnover rate of propane ODdecreases [69].
The catalytic behavior of the magnesium molybda(I, J, and K) is shown in Fig. 9. The Mg0.992MoO3.992(I) exhibited the highest conversion (18.6%) and selecity (61.8%) and produced the most oxygenated prod(3.08 with 0.96% acetic acid, 0.82% acrylic acid, 0.3acrolein, and other oxygenates) of all the catalysts tesThe Mg1.015MoO4.015 (J) had a conversion curve similato I, but was less active at higher temperatures. The s
Fig. 9. Catalytic results for the ODH of propane with the Mg–Mo–O calysts. Solid symbols correspond to the conversion, and hollow symcorrespond to selectivity. Test conditions: 30% C3H8, 10% O2 (50 psig,4000 GHSV, total flow= 133 sccm 14/30 mesh catalyst). Conversionselectivity computed based on gas-phase components only.

J.D. Pless et al. / Journal of Catalysis 223 (2004) 419–431 427
rh
c-ad-wasc-
-ns
ted
.4%d forvi-fim-
s
ted,cataKvedce o
ne
iume
on
at-bols
nd
nt,
yststo-truc-etal
t in-ac-
hanata-
rside-
f thever-sly
tionoc-
facentalthe
,73]entk is
ch-
-
mken
tivity of J was lower thanI at all temperatures, but feweoxygenates formed (0.36%) withJ. These results agree witthose seen previously in other reports; that is, MgMoO4 witha slight excess of MoO3 shows a higher activity and seletivity than samples with an excess of MgO [13,34,70]. Indition, complete oxygen depletion from the feed streamobserved only at 808 K forI andJ; thus, an increase of seletivity with conversion was not observed. The MgMo2O7 (K)exhibited a lower selectivity thanI at all temperatures. Catalyst K exhibited higher selectivities and conversions thaJand higher conversions than sampleI at lower temperature(< 748 K).
The conversions and selectivities of the supporV2−2xMo2xO5+x catalysts (L, M, andN) are similar toI(Fig. 10). For example, selectivities of 59.3, 60.5, and 60and conversions of 16.8, 18.2, and 17.8% were observeL, M, andN, respectively, at 808 K. However, the selectities ofL, M, andN begin to increase at∼ 725 K, because ooxygen depletion from the reactant stream. These dataply that the surfaces ofL, M, andN were not as selective aI for the formation of propylene.
Molybdenum divanadium oxide, MoV2O8 (O), exhibitedthe highest conversion (1.8%) at 573 K of all catalysts tesbut the conversion did not increase as fast as the otherlysts. O displayed the lowest selectivity (15.6%) at 698before increasing to 35.5%, the lowest selectivity obserat 808 K. These results can be explained by the presenV2O5. Kung and co-workers report that V2O5 exhibits highconversions for alkane ODH but low selectivities for alkeformation [7,26].
The 1:2 molar mixture of Mg3(VO4)2/MgMoO4 (H) dis-played a higher conversion than the magnesium vanadmolybdates (E, F, andG), but at equivalent conversions thselectivity ofH was lower. The selectivity and conversiof H were similar to those of catalystC but were lower
Fig. 10. Catalytic results for the ODH of propane with the Mo–V–O calysts. Solid symbols correspond to the conversion, and hollow symcorrespond to selectivity. Test conditions: 30% C3H8, 10% O2 (50 psig,4000 GHSV, total flow= 133 sccm 14/30 mesh catalyst). Conversion aselectivity computed based on gas-phase components only.
-
f
than bothI andJ. A slight increase (0.04%) in the amouof liquid oxygenates produced by mixtureH was observedcompared toD.
As shown above, supported vanadium oxide catal(L, M, andN) have conversions and selectivities similarthose of the single-phase catalysts (J). The surfaces of supported catalysts can be described as two-dimensional stures of monomers or oligomers that are bonded to a moxide. However, Wachs and co-workers report data thadicate the bulk Fe–V and Al–V vanadates have specifictivities which are nearly an order of magnitude greater tthe respective monolayer vanadium oxide-supported clyst, while that of bulk Ni–V is approximately two ordeof magnitude greater than the monolayer vanadium oxsupported catalyst [71].
The results presented here show the importance obulk catalyst structure on the catalytic selectivity and consion. The bulk structure allows the catalysts to continuouundergo reduction and reoxidation cycles during reacconditions, at steady state. However, the ODH reactionscur at the catalyst surface. Therefore, the catalyst surstructure needs to be resolved to allow for a fundameunderstanding of the reaction pathway that occurs atcatalyst surface.
3.3. Raman studies
The visible Raman spectrum of Mg3(VO4)2 (C) at roomtemperature matches previously reported spectra [72(Fig. 11). The UV Raman spectrum is in good agreemwith the visible Raman spectrum, but an additional peaobserved in the UV Raman spectrum at 650 cm−1 (Fig. 12).This additional peak is assigned to the V–O–Mg streting mode because the V–O–In of InVO4 [74], the V–O–Feof FeVO4 [74], and the V–O–V of Mg2V2O7 [73] and rareearth orthovanadates [75] are centered near 650 cm−1. The
Fig. 11. Visible Raman spectra of Mg3(VO4)2. The spectra were taken under in situ conditions (30% C3H8, 10% O2, and 60% N2 flowing at 50sccm) at: (a) 303 K; (b) 623 K; (c) 673 K; (d) 723 K; (e) 798 K. Spectru(f) was taken after (e) under a flow of air at 798 K. Spectrum (g) was taof fresh catalyst under a flow of He at 798 K.
428 J.D. Pless et al. / Journal of Catalysis 223 (2004) 419–431
er
K;ccmto a
ture
the
he
romThesitupearetric
eallyat
ting
K.
K.(g)
c-onsandlor
blerature, forofmallisher
aken
pec-be-ratedm-
hifthe inRa-
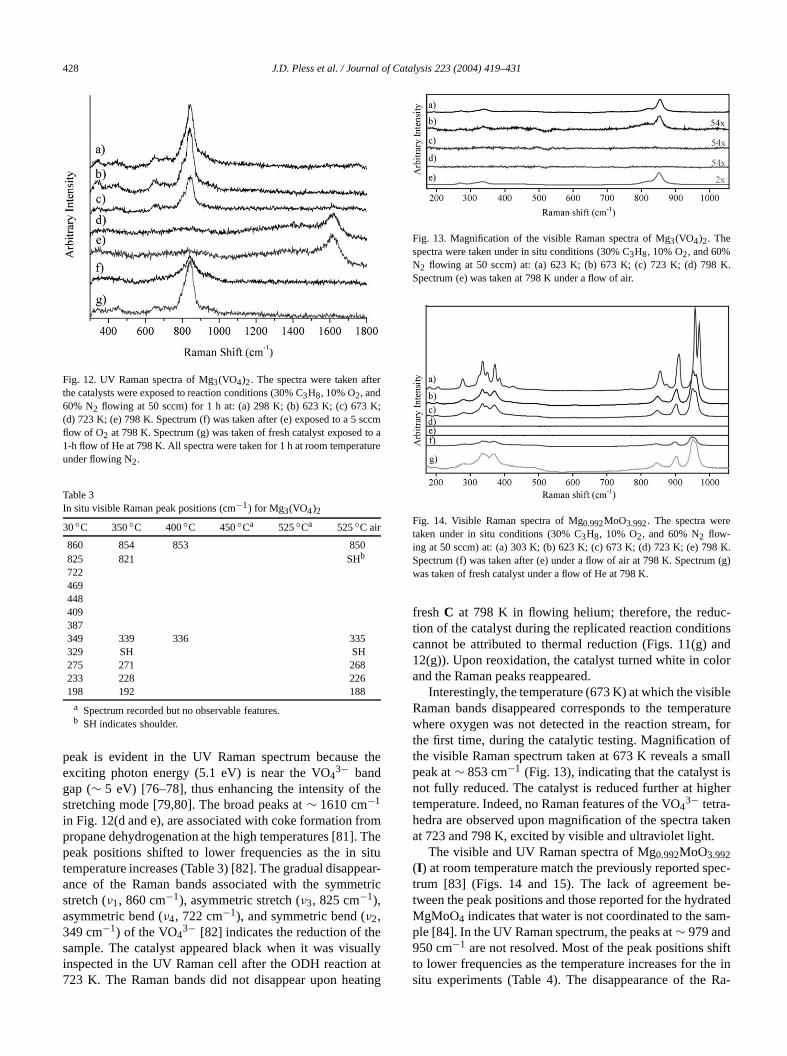
Fig. 12. UV Raman spectra of Mg3(VO4)2. The spectra were taken aftthe catalysts were exposed to reaction conditions (30% C3H8, 10% O2, and60% N2 flowing at 50 sccm) for 1 h at: (a) 298 K; (b) 623 K; (c) 673(d) 723 K; (e) 798 K. Spectrum (f) was taken after (e) exposed to a 5 sflow of O2 at 798 K. Spectrum (g) was taken of fresh catalyst exposed1-h flow of He at 798 K. All spectra were taken for 1 h at room temperaunder flowing N2.
Table 3In situ visible Raman peak positions (cm−1) for Mg3(VO4)2
30◦C 350◦C 400◦C 450◦Ca 525◦Ca 525◦C air
860 854 853 850825 821 SHb
722469448409387349 339 336 335329 SH SH275 271 268233 228 226198 192 188
a Spectrum recorded but no observable features.b SH indicates shoulder.
peak is evident in the UV Raman spectrum becauseexciting photon energy (5.1 eV) is near the VO4
3− bandgap (∼ 5 eV) [76–78], thus enhancing the intensity of tstretching mode [79,80]. The broad peaks at∼ 1610 cm−1
in Fig. 12(d and e), are associated with coke formation fpropane dehydrogenation at the high temperatures [81].peak positions shifted to lower frequencies as the intemperature increases (Table 3) [82]. The gradual disapance of the Raman bands associated with the symmstretch (ν1, 860 cm−1), asymmetric stretch (ν3, 825 cm−1),asymmetric bend (ν4, 722 cm−1), and symmetric bend (ν2,349 cm−1) of the VO4
3− [82] indicates the reduction of thsample. The catalyst appeared black when it was visuinspected in the UV Raman cell after the ODH reaction723 K. The Raman bands did not disappear upon hea
-
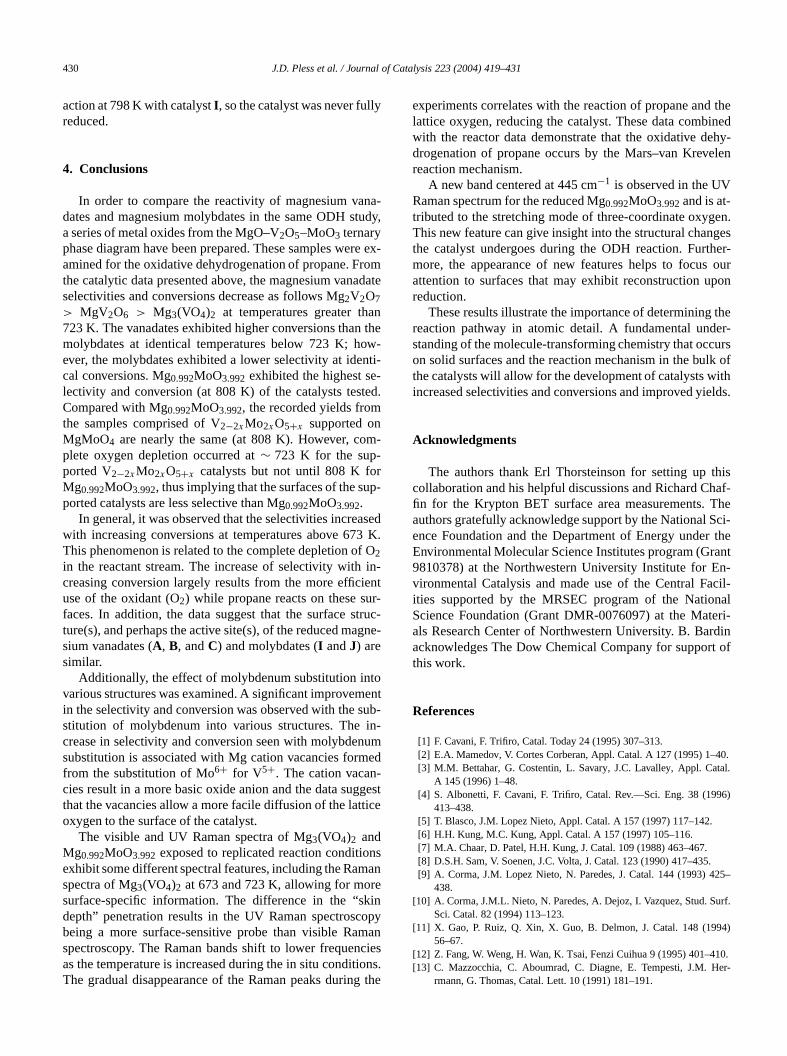
Fig. 13. Magnification of the visible Raman spectra of Mg3(VO4)2. Thespectra were taken under in situ conditions (30% C3H8, 10% O2, and 60%N2 flowing at 50 sccm) at: (a) 623 K; (b) 673 K; (c) 723 K; (d) 798Spectrum (e) was taken at 798 K under a flow of air.
Fig. 14. Visible Raman spectra of Mg0.992MoO3.992. The spectra weretaken under in situ conditions (30% C3H8, 10% O2, and 60% N2 flow-ing at 50 sccm) at: (a) 303 K; (b) 623 K; (c) 673 K; (d) 723 K; (e) 798Spectrum (f) was taken after (e) under a flow of air at 798 K. Spectrumwas taken of fresh catalyst under a flow of He at 798 K.
fresh C at 798 K in flowing helium; therefore, the redution of the catalyst during the replicated reaction conditicannot be attributed to thermal reduction (Figs. 11(g)12(g)). Upon reoxidation, the catalyst turned white in coand the Raman peaks reappeared.
Interestingly, the temperature (673 K) at which the visiRaman bands disappeared corresponds to the tempewhere oxygen was not detected in the reaction streamthe first time, during the catalytic testing. Magnificationthe visible Raman spectrum taken at 673 K reveals a speak at∼ 853 cm−1 (Fig. 13), indicating that the catalystnot fully reduced. The catalyst is reduced further at higtemperature. Indeed, no Raman features of the VO4
3− tetra-hedra are observed upon magnification of the spectra tat 723 and 798 K, excited by visible and ultraviolet light.
The visible and UV Raman spectra of Mg0.992MoO3.992(I) at room temperature match the previously reported strum [83] (Figs. 14 and 15). The lack of agreementtween the peak positions and those reported for the hydMgMoO4 indicates that water is not coordinated to the saple [84]. In the UV Raman spectrum, the peaks at∼ 979 and950 cm−1 are not resolved. Most of the peak positions sto lower frequencies as the temperature increases for tsitu experiments (Table 4). The disappearance of the

J.D. Pless et al. / Journal of Catalysis 223 (2004) 419–431 429
n
;sedystom
aredthe
bra-st ast-
n isxy-
eaksilar
tion
m
gen-erentxi-t
ared.oxy-
sityita-ver,ctra
trumin
th”h isby
6].in-
od-
halffaceiblef thela-
on-rs–
ten-s arehaseeac-and-
dst.re-
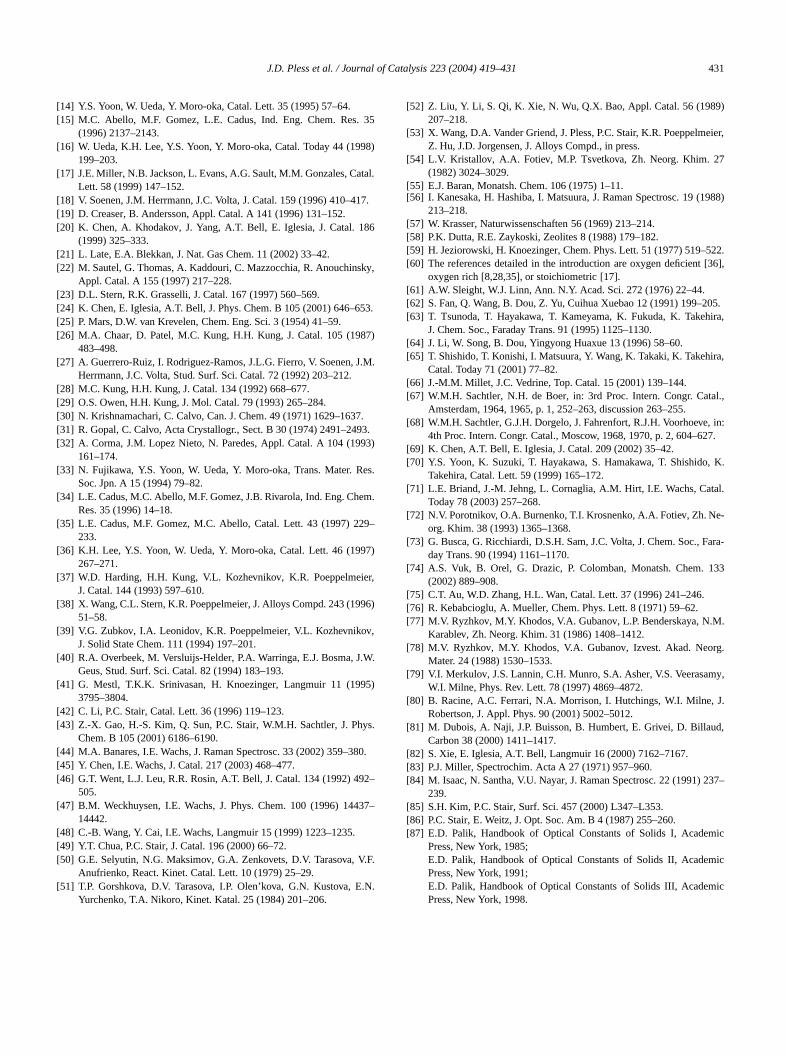
Fig. 15. UV Raman spectra of Mg0.992MoO3.992. The spectra were takeafter the catalysts were exposed to reaction conditions (30% C3H8, 10%O2, and 60% N2 flowing at 50 sccm) for 1 h at: (a) 298 K; (b) 623 K(c) 673 K; (d) 723 K; (e) 798 K. Spectrum (f) was taken after (e) expoto a 5 sccm flow of O2 at 798 K. Spectrum (g) was taken of fresh catalexposed to a 1-h flow of He at 798 K. All spectra were taken for 1 h at rotemperature under flowing N2.
Table 4In situ visible Raman peak positions (cm−1) for Mg0.992MoO3.992
30◦C 350◦C 400◦C 450◦C 525◦C 525◦C air/He
970 961 SH SHa
958 952 951 950 950 947910 904 902 900 900874855 848 848 843424385371 370 370 369349 347 347335 335 335 335 335 335277 280 280 282204 202 202 198180 177 177 176
a SH indicates shoulder.
man peaks corresponding to the symmetric stretch (ν1, 900and 958 cm−1), asymmetric stretch (ν3, 910 and 874 cm−1),asymmetric bend, and symmetric bend of the MoO4
2− [83]indicates the reduction of the sample. The catalyst appegray when it was visually inspected in the cells afterreaction at 798 K. The reduction ofI during in situ condi-tions cannot be attributed to thermal reduction as the vitional bands did not disappear upon heating fresh cataly798 K in flowing helium (Figs. 14(g) and 15(g)). Intereingly, a new band appears at∼ 445 cm−1 in the UV Ramanspectrum after the reaction at 798 K. The peak positioattributed to the stretching mode of three-coordinate ogen and not bridging oxygen, because no additional pat higher Raman shifts were observed. This peak is simto the three-coordinate vibration seen with high-resolu
t
Fig. 16. Magnification of the visible Raman spectra of Mg0.992MoO3.992.The spectra were taken under in situ conditions (30% C3H8, 10% O2, and60% N2 flowing at 50 sccm) at: (a) 673 K; (b) 723 K; (c) 798 K. Spectru(d) was taken at 798 K under a flow of air.
electron energy loss spectroscopy (HREELS) on an oxymodified Mo (100) surface [85]. The peak shift to a lowwavenumber than that observed in the HREELS experimis due to the weaker bond strength from the higher Mo odation state of the reducedI. Upon reoxidation, the catalysturned pale gray in color and the Raman peaks reappeThe Raman bands associated with the three-coordinategen of the reduced catalyst disappeared.
Again, a correlation exists between the peak intenand the catalyst reduction. Bands from the visible exction taken at 723 and 798 K seem to disappear. Howesmall peaks are apparent upon magnification of the spe(Fig. 16). No Raman features are observed for the spectaken at 798 K, even after magnification. The differencethe UV and visible Raman features is due to the “skin deppenetration, the minimum depth of material probed whicdetermined by the absorptivity of the sample and givenλ/(4πk), whereλ is the laser wavelength andk is the imagi-nary part of the complex refractive index of the sample [8To the best of the author’s knowledge there is no directformation on thek value of the Mg3(VO4)2 and MgMoO4,so the skin depth is estimated using similar solids as mels [87]. At 244 nm (514.5 nm), the skin depth of KNbO3is calculated to be 12.1 nm, that of BaTiO3 is 14.9 nm(28.4 nm), and that of SrTiO3 is 15.1 nm (27.6 nm). Theskin depths of the materials at 244 nm are approximatelythe skin depths at 514.5 nm. Therefore, the catalyst surcontributes more to the UV Raman signal than the visRaman signal. The Raman data imply that the surface ocatalyst is reduced but the bulk is still oxidized. This expnation is consistent with the reaction data.
The Raman data combined with the reaction data demstrate that the ODH of propane is consistent with the Mavan Krevelen reaction mechanism. Although the peak insities decrease during the reaction with propane, peakobserved in the in situ Raman spectra until the gas-pO2 in the reaction stream had been consumed in the rtion. At this point, further reaction reduces the catalystthe peaks associated with the VO4
3−/MoO42− cannot be de
tected. The reactor data show that the O2 (g) had completelyreacted by 673 K with catalystC. Propane further reactewith lattice oxygen resulting in the reduction of the catalyHowever, gas-phase oxygen was still present during the
430 J.D. Pless et al. / Journal of Catalysis 223 (2004) 419–431
ly
na-tudy
re eromada
anthe
ow-nti--ed.
m-
rp-
sed3 K.f Oin-
ientur-trucgne
toentub-in-num
ed-ges
tice
nsan
ekinopymancies
ionsg th
theinedehy-elen
en.gesher-
ourpon
theer-urs
lk ofith
elds.
thishaf-TheSci-r therantn-
acil-naleri-rdint of
40.tal.
6)
25–
urf.
94)
10.er-
action at 798 K with catalystI, so the catalyst was never fulreduced.
4. Conclusions
In order to compare the reactivity of magnesium vadates and magnesium molybdates in the same ODH sa series of metal oxides from the MgO–V2O5–MoO3 ternaryphase diagram have been prepared. These samples weamined for the oxidative dehydrogenation of propane. Fthe catalytic data presented above, the magnesium vanselectivities and conversions decrease as follows Mg2V2O7> MgV2O6 > Mg3(VO4)2 at temperatures greater th723 K. The vanadates exhibited higher conversions thanmolybdates at identical temperatures below 723 K; hever, the molybdates exhibited a lower selectivity at idecal conversions. Mg0.992MoO3.992 exhibited the highest selectivity and conversion (at 808 K) of the catalysts testCompared with Mg0.992MoO3.992, the recorded yields fromthe samples comprised of V2−2xMo2xO5+x supported onMgMoO4 are nearly the same (at 808 K). However, coplete oxygen depletion occurred at∼ 723 K for the sup-ported V2−2xMo2xO5+x catalysts but not until 808 K foMg0.992MoO3.992, thus implying that the surfaces of the suported catalysts are less selective than Mg0.992MoO3.992.
In general, it was observed that the selectivities increawith increasing conversions at temperatures above 67This phenomenon is related to the complete depletion o2in the reactant stream. The increase of selectivity withcreasing conversion largely results from the more efficuse of the oxidant (O2) while propane reacts on these sfaces. In addition, the data suggest that the surface sture(s), and perhaps the active site(s), of the reduced masium vanadates (A, B, andC) and molybdates (I andJ) aresimilar.
Additionally, the effect of molybdenum substitution invarious structures was examined. A significant improvemin the selectivity and conversion was observed with the sstitution of molybdenum into various structures. Thecrease in selectivity and conversion seen with molybdesubstitution is associated with Mg cation vacancies formfrom the substitution of Mo6+ for V5+. The cation vacancies result in a more basic oxide anion and the data sugthat the vacancies allow a more facile diffusion of the latoxygen to the surface of the catalyst.
The visible and UV Raman spectra of Mg3(VO4)2 andMg0.992MoO3.992 exposed to replicated reaction conditioexhibit some different spectral features, including the Ramspectra of Mg3(VO4)2 at 673 and 723 K, allowing for morsurface-specific information. The difference in the “sdepth” penetration results in the UV Raman spectroscbeing a more surface-sensitive probe than visible Raspectroscopy. The Raman bands shift to lower frequenas the temperature is increased during the in situ conditThe gradual disappearance of the Raman peaks durin
,
x-
te
--
t
.e
experiments correlates with the reaction of propane andlattice oxygen, reducing the catalyst. These data combwith the reactor data demonstrate that the oxidative ddrogenation of propane occurs by the Mars–van Krevreaction mechanism.
A new band centered at 445 cm−1 is observed in the UVRaman spectrum for the reduced Mg0.992MoO3.992and is at-tributed to the stretching mode of three-coordinate oxygThis new feature can give insight into the structural chanthe catalyst undergoes during the ODH reaction. Furtmore, the appearance of new features helps to focusattention to surfaces that may exhibit reconstruction ureduction.
These results illustrate the importance of determiningreaction pathway in atomic detail. A fundamental undstanding of the molecule-transforming chemistry that occon solid surfaces and the reaction mechanism in the buthe catalysts will allow for the development of catalysts wincreased selectivities and conversions and improved yi
Acknowledgments
The authors thank Erl Thorsteinson for setting upcollaboration and his helpful discussions and Richard Cfin for the Krypton BET surface area measurements.authors gratefully acknowledge support by the Nationalence Foundation and the Department of Energy undeEnvironmental Molecular Science Institutes program (G9810378) at the Northwestern University Institute for Evironmental Catalysis and made use of the Central Fities supported by the MRSEC program of the NatioScience Foundation (Grant DMR-0076097) at the Matals Research Center of Northwestern University. B. Baacknowledges The Dow Chemical Company for supporthis work.
References
[1] F. Cavani, F. Trifiro, Catal. Today 24 (1995) 307–313.[2] E.A. Mamedov, V. Cortes Corberan, Appl. Catal. A 127 (1995) 1–[3] M.M. Bettahar, G. Costentin, L. Savary, J.C. Lavalley, Appl. Ca
A 145 (1996) 1–48.[4] S. Albonetti, F. Cavani, F. Trifiro, Catal. Rev.—Sci. Eng. 38 (199
413–438.[5] T. Blasco, J.M. Lopez Nieto, Appl. Catal. A 157 (1997) 117–142.[6] H.H. Kung, M.C. Kung, Appl. Catal. A 157 (1997) 105–116.[7] M.A. Chaar, D. Patel, H.H. Kung, J. Catal. 109 (1988) 463–467.[8] D.S.H. Sam, V. Soenen, J.C. Volta, J. Catal. 123 (1990) 417–435.[9] A. Corma, J.M. Lopez Nieto, N. Paredes, J. Catal. 144 (1993) 4
438.[10] A. Corma, J.M.L. Nieto, N. Paredes, A. Dejoz, I. Vazquez, Stud. S
Sci. Catal. 82 (1994) 113–123.[11] X. Gao, P. Ruiz, Q. Xin, X. Guo, B. Delmon, J. Catal. 148 (19
56–67.[12] Z. Fang, W. Weng, H. Wan, K. Tsai, Fenzi Cuihua 9 (1995) 401–4[13] C. Mazzocchia, C. Aboumrad, C. Diagne, E. Tempesti, J.M. H
rmann, G. Thomas, Catal. Lett. 10 (1991) 181–191.
J.D. Pless et al. / Journal of Catalysis 223 (2004) 419–431 431
35
8)
tal.
17.
86
ky,
53.
7)
.M.
7.3.
93)
es.
m.
9–
7)
r,
96)
v,
.W.
5)
ys.
80.
2–
37–
.F.
.N.
)
eier,
7
988)
22.[36],
05.ira,
ra,
al.,
, in:7.
, K.
al.
e-
ara-
33
M.
g.
y,
J.
d,
237–
ic
ic
ic
[14] Y.S. Yoon, W. Ueda, Y. Moro-oka, Catal. Lett. 35 (1995) 57–64.[15] M.C. Abello, M.F. Gomez, L.E. Cadus, Ind. Eng. Chem. Res.
(1996) 2137–2143.[16] W. Ueda, K.H. Lee, Y.S. Yoon, Y. Moro-oka, Catal. Today 44 (199
199–203.[17] J.E. Miller, N.B. Jackson, L. Evans, A.G. Sault, M.M. Gonzales, Ca
Lett. 58 (1999) 147–152.[18] V. Soenen, J.M. Herrmann, J.C. Volta, J. Catal. 159 (1996) 410–4[19] D. Creaser, B. Andersson, Appl. Catal. A 141 (1996) 131–152.[20] K. Chen, A. Khodakov, J. Yang, A.T. Bell, E. Iglesia, J. Catal. 1
(1999) 325–333.[21] L. Late, E.A. Blekkan, J. Nat. Gas Chem. 11 (2002) 33–42.[22] M. Sautel, G. Thomas, A. Kaddouri, C. Mazzocchia, R. Anouchins
Appl. Catal. A 155 (1997) 217–228.[23] D.L. Stern, R.K. Grasselli, J. Catal. 167 (1997) 560–569.[24] K. Chen, E. Iglesia, A.T. Bell, J. Phys. Chem. B 105 (2001) 646–6[25] P. Mars, D.W. van Krevelen, Chem. Eng. Sci. 3 (1954) 41–59.[26] M.A. Chaar, D. Patel, M.C. Kung, H.H. Kung, J. Catal. 105 (198
483–498.[27] A. Guerrero-Ruiz, I. Rodriguez-Ramos, J.L.G. Fierro, V. Soenen, J
Herrmann, J.C. Volta, Stud. Surf. Sci. Catal. 72 (1992) 203–212.[28] M.C. Kung, H.H. Kung, J. Catal. 134 (1992) 668–677.[29] O.S. Owen, H.H. Kung, J. Mol. Catal. 79 (1993) 265–284.[30] N. Krishnamachari, C. Calvo, Can. J. Chem. 49 (1971) 1629–163[31] R. Gopal, C. Calvo, Acta Crystallogr., Sect. B 30 (1974) 2491–249[32] A. Corma, J.M. Lopez Nieto, N. Paredes, Appl. Catal. A 104 (19
161–174.[33] N. Fujikawa, Y.S. Yoon, W. Ueda, Y. Moro-oka, Trans. Mater. R
Soc. Jpn. A 15 (1994) 79–82.[34] L.E. Cadus, M.C. Abello, M.F. Gomez, J.B. Rivarola, Ind. Eng. Che
Res. 35 (1996) 14–18.[35] L.E. Cadus, M.F. Gomez, M.C. Abello, Catal. Lett. 43 (1997) 22
233.[36] K.H. Lee, Y.S. Yoon, W. Ueda, Y. Moro-oka, Catal. Lett. 46 (199
267–271.[37] W.D. Harding, H.H. Kung, V.L. Kozhevnikov, K.R. Poeppelmeie
J. Catal. 144 (1993) 597–610.[38] X. Wang, C.L. Stern, K.R. Poeppelmeier, J. Alloys Compd. 243 (19
51–58.[39] V.G. Zubkov, I.A. Leonidov, K.R. Poeppelmeier, V.L. Kozhevniko
J. Solid State Chem. 111 (1994) 197–201.[40] R.A. Overbeek, M. Versluijs-Helder, P.A. Warringa, E.J. Bosma, J
Geus, Stud. Surf. Sci. Catal. 82 (1994) 183–193.[41] G. Mestl, T.K.K. Srinivasan, H. Knoezinger, Langmuir 11 (199
3795–3804.[42] C. Li, P.C. Stair, Catal. Lett. 36 (1996) 119–123.[43] Z.-X. Gao, H.-S. Kim, Q. Sun, P.C. Stair, W.M.H. Sachtler, J. Ph
Chem. B 105 (2001) 6186–6190.[44] M.A. Banares, I.E. Wachs, J. Raman Spectrosc. 33 (2002) 359–3[45] Y. Chen, I.E. Wachs, J. Catal. 217 (2003) 468–477.[46] G.T. Went, L.J. Leu, R.R. Rosin, A.T. Bell, J. Catal. 134 (1992) 49
505.[47] B.M. Weckhuysen, I.E. Wachs, J. Phys. Chem. 100 (1996) 144
14442.[48] C.-B. Wang, Y. Cai, I.E. Wachs, Langmuir 15 (1999) 1223–1235.[49] Y.T. Chua, P.C. Stair, J. Catal. 196 (2000) 66–72.[50] G.E. Selyutin, N.G. Maksimov, G.A. Zenkovets, D.V. Tarasova, V
Anufrienko, React. Kinet. Catal. Lett. 10 (1979) 25–29.[51] T.P. Gorshkova, D.V. Tarasova, I.P. Olen’kova, G.N. Kustova, E
Yurchenko, T.A. Nikoro, Kinet. Katal. 25 (1984) 201–206.
[52] Z. Liu, Y. Li, S. Qi, K. Xie, N. Wu, Q.X. Bao, Appl. Catal. 56 (1989207–218.
[53] X. Wang, D.A. Vander Griend, J. Pless, P.C. Stair, K.R. PoeppelmZ. Hu, J.D. Jorgensen, J. Alloys Compd., in press.
[54] L.V. Kristallov, A.A. Fotiev, M.P. Tsvetkova, Zh. Neorg. Khim. 2(1982) 3024–3029.
[55] E.J. Baran, Monatsh. Chem. 106 (1975) 1–11.[56] I. Kanesaka, H. Hashiba, I. Matsuura, J. Raman Spectrosc. 19 (1
213–218.[57] W. Krasser, Naturwissenschaften 56 (1969) 213–214.[58] P.K. Dutta, R.E. Zaykoski, Zeolites 8 (1988) 179–182.[59] H. Jeziorowski, H. Knoezinger, Chem. Phys. Lett. 51 (1977) 519–5[60] The references detailed in the introduction are oxygen deficient
oxygen rich [8,28,35], or stoichiometric [17].[61] A.W. Sleight, W.J. Linn, Ann. N.Y. Acad. Sci. 272 (1976) 22–44.[62] S. Fan, Q. Wang, B. Dou, Z. Yu, Cuihua Xuebao 12 (1991) 199–2[63] T. Tsunoda, T. Hayakawa, T. Kameyama, K. Fukuda, K. Takeh
J. Chem. Soc., Faraday Trans. 91 (1995) 1125–1130.[64] J. Li, W. Song, B. Dou, Yingyong Huaxue 13 (1996) 58–60.[65] T. Shishido, T. Konishi, I. Matsuura, Y. Wang, K. Takaki, K. Takehi
Catal. Today 71 (2001) 77–82.[66] J.-M.M. Millet, J.C. Vedrine, Top. Catal. 15 (2001) 139–144.[67] W.M.H. Sachtler, N.H. de Boer, in: 3rd Proc. Intern. Congr. Cat
Amsterdam, 1964, 1965, p. 1, 252–263, discussion 263–255.[68] W.M.H. Sachtler, G.J.H. Dorgelo, J. Fahrenfort, R.J.H. Voorhoeve
4th Proc. Intern. Congr. Catal., Moscow, 1968, 1970, p. 2, 604–62[69] K. Chen, A.T. Bell, E. Iglesia, J. Catal. 209 (2002) 35–42.[70] Y.S. Yoon, K. Suzuki, T. Hayakawa, S. Hamakawa, T. Shishido
Takehira, Catal. Lett. 59 (1999) 165–172.[71] L.E. Briand, J.-M. Jehng, L. Cornaglia, A.M. Hirt, I.E. Wachs, Cat
Today 78 (2003) 257–268.[72] N.V. Porotnikov, O.A. Burnenko, T.I. Krosnenko, A.A. Fotiev, Zh. N
org. Khim. 38 (1993) 1365–1368.[73] G. Busca, G. Ricchiardi, D.S.H. Sam, J.C. Volta, J. Chem. Soc., F
day Trans. 90 (1994) 1161–1170.[74] A.S. Vuk, B. Orel, G. Drazic, P. Colomban, Monatsh. Chem. 1
(2002) 889–908.[75] C.T. Au, W.D. Zhang, H.L. Wan, Catal. Lett. 37 (1996) 241–246.[76] R. Kebabcioglu, A. Mueller, Chem. Phys. Lett. 8 (1971) 59–62.[77] M.V. Ryzhkov, M.Y. Khodos, V.A. Gubanov, L.P. Benderskaya, N.
Karablev, Zh. Neorg. Khim. 31 (1986) 1408–1412.[78] M.V. Ryzhkov, M.Y. Khodos, V.A. Gubanov, Izvest. Akad. Neor
Mater. 24 (1988) 1530–1533.[79] V.I. Merkulov, J.S. Lannin, C.H. Munro, S.A. Asher, V.S. Veerasam
W.I. Milne, Phys. Rev. Lett. 78 (1997) 4869–4872.[80] B. Racine, A.C. Ferrari, N.A. Morrison, I. Hutchings, W.I. Milne,
Robertson, J. Appl. Phys. 90 (2001) 5002–5012.[81] M. Dubois, A. Naji, J.P. Buisson, B. Humbert, E. Grivei, D. Billau
Carbon 38 (2000) 1411–1417.[82] S. Xie, E. Iglesia, A.T. Bell, Langmuir 16 (2000) 7162–7167.[83] P.J. Miller, Spectrochim. Acta A 27 (1971) 957–960.[84] M. Isaac, N. Santha, V.U. Nayar, J. Raman Spectrosc. 22 (1991)
239.[85] S.H. Kim, P.C. Stair, Surf. Sci. 457 (2000) L347–L353.[86] P.C. Stair, E. Weitz, J. Opt. Soc. Am. B 4 (1987) 255–260.[87] E.D. Palik, Handbook of Optical Constants of Solids I, Academ
Press, New York, 1985;E.D. Palik, Handbook of Optical Constants of Solids II, AcademPress, New York, 1991;E.D. Palik, Handbook of Optical Constants of Solids III, AcademPress, New York, 1998.