catalytic generation of hydrogen from the hydrolysis of
TRANSCRIPT

Louisiana State UniversityLSU Digital Commons
LSU Historical Dissertations and Theses Graduate School
1981
Catalytic Generation of Hydrogen From theHydrolysis of Sodium-Borohydride. Application ina Hydrogen/Oxygen Fuel Cell.Clifford Mark KaufmanLouisiana State University and Agricultural & Mechanical College
Follow this and additional works at: https://digitalcommons.lsu.edu/gradschool_disstheses
This Dissertation is brought to you for free and open access by the Graduate School at LSU Digital Commons. It has been accepted for inclusion inLSU Historical Dissertations and Theses by an authorized administrator of LSU Digital Commons. For more information, please [email protected].
Recommended CitationKaufman, Clifford Mark, "Catalytic Generation of Hydrogen From the Hydrolysis of Sodium-Borohydride. Application in aHydrogen/Oxygen Fuel Cell." (1981). LSU Historical Dissertations and Theses. 3689.https://digitalcommons.lsu.edu/gradschool_disstheses/3689

INFORMATION TO USERS
This was produced from a copy of a document sent to us for microfilming. While the most advanced technological means to photograph and reproduce this document have been used, the quality is heavily dependent upon the quality of the material submitted.
The following explanation of techniques is provided to help you understand markings or notations which may appear on this reproduction.
1. The sign or “target” for pages apparently lacking from the document photographed is “ Missing Page(s)” . If it was possible to obtain the missing page(s) or section, they are spliced into the film along with adjacent pages. This may have necessitated cutting through an image and duplicating adjacent pages to assure you of complete continuity.
2. When an image on the film is obliterated with a round black mark it is an indication that the film inspector noticed either blurred copy because of movement during exposure, or duplicate copy. Unless we meant to delete copyrighted materials that should not have been filmed, you will find a good image of the page in the adjacent frame. If copyrighted materials were deleted you will find a target note listing the pages in the adjacent frame.
3. When a map, drawing or chart, etc., is part of the material being photographed the photographer has followed a definite method in “sectioning” the material. It is customary to begin filming at the upper left hand corner of a large sheet and to continue from left to right in equal sections with small overlaps. If necessary, sectioning is continued again—beginning below the first row and continuing on until complete.
4. For any illustrations that cannot be reproduced satisfactorily by xerography, photographic prints can be purchased at additional cost and tipped into your xerographic copy. Requests can be made to our Dissertations Customer Services Department.
5. Some pages in any document may have indistinct print. In all cases we have filmed the best available copy.
UniversityMicrofilms
International300 N. ZEEB RD . A N N A R B O R . Ml 48106
Reproduced with permission of the copyright owner. Further reproduction prohibited without permission.

8207828
Kaufman, Clifford Mark
CATALYTIC GENERATION OF HYDROGEN FROM THE HYDROLYSIS OF SODIUM-BOROHYDRIDE. APPLICATION IN A HYDROGEN/OXYGEN FUEL CELL
The Louisiana State University and Agricultural and Mechanical Col. Ph.D. 1981
University Microfilms
International 300 N. Zeeb Road, Ann Arbor, MI 48106
Reproduced with permission of the copyright owner. Further reproduction prohibited without permission.

PLEASE NOTE:
In all cases this material has been filmed in the best possible way from the available copy. Problems encountered with this document have been identified here with a check mark V .
1. Glossy photographs or pages______
2. Colored illustrations, paper or print______
3. Photographs with dark background _
4. Illustrations are poor copy______
5. Pages with black marks, not original copy______
6. Print shows through as there is text on both sides of page______
7. Indistinct, broken or small print on several pages
8. Print exceeds margin requirements______
9. Tightly bound copy with print lost in spine______
10. Computer printout pages with indistinct print_____
11. Page(s)___________ lacking when material received, and not available from school orauthor.
12. Page(s)___________ seem to be missing in numbering only as text follows.
13. Two pages numbered___________ . Text follows.
14. Curling and wrinkled pages______
15. Other____________________________________________________________________
University Microfilms
International
Reproduced with permission of the copyright owner. Further reproduction prohibited without permission.

Reproduced with permission of the copyright owner. Further reproduction prohibited without permission.

CATALYTIC GENERATION OF HYDROGEN FROM THE HYDROLYSIS OF SODIUM
BOROHYDRIDE. APPLICATION IN A HYDROGEN/OXYGEN FUEL CELL.
A Dissertation
Submitted to the Graduate Faculty of the Louisiana State University and
Agricultural and Mechanical College in partia l fu lf illm e n t of the requirements fo r the degree of
Doctor of Philosophy
in
The Department of Chemistry
byC liffo rd Mark Kaufman
B .A ,, University of North Carolina, 1976 December 1981
Reproduced with permission of the copyright owner. Further reproduction prohibited without permission.

ACKNOWLEDGEMENT
The author would lik e to acknowledge the encouragement, a id ,
advice, and friendship that were provided by his major professor,
Dr. B. Sen. In addition, conversations with Dr. S. Watkins were
extremely useful in re la tion to the s ta tis t ic a l treatment of data.
A very special note o f thanks is due to my w ife , J i l l Harbin
Kaufman. Her years o f work, patience, understanding, and support
made th is project possible.
The Charles E. Coates Memorial Fund of the L.S.U. Foundation,
donated by Charles E. Coates is g ra te fu lly acknowledged for
financial support.
i i
Reproduced with permission of the copyright owner. Further reproduction prohibited without permission.

TABLE OF CONTENTS
PAGE
Acknowledgement...............................................................\ .............. i i
List Of Tables........................................................................................... vi
L is t Of Figures......................................................................................... ix
Abstract....................................................................................................... x i i
Chapter I Introduction....................................................................... 1
Chapter I I Acid Acceleration.......................................................... 6
Introduction........................................................................................ 7
Uncatalyzed Hydrolysis Of Sodium Borohydride................... 7
Schlesinger And Brown - Approach To Acid Acceleration. 10
Experimental....................................................................................... 15
Procedure For The Determination Of the Extent Of
BH Hydrolysis................................................................................... 16
Discussion And In terpretation Of Data................................. 33
Summary Of Kinetic And Mechanism Studies........................... 41
Chapter I I I Transition Metal Salt E ffects ...................................... 46
Introduction....................................................................................... 47
Experimental....................................................................................... 47
Discussion And In terpretation Of Data...................................... 56
Determination Of The Composition Of The
Black P rec ip ita te ................................ 58
Metal Borides Versus Atomic M etal................................. 60
Conclusions......................................................................................... 76
Chapter IV Transition Metal Catalysis............................................. 78
i i i
Reproduced with permission of the copyright owner. Further reproduction prohibited without permission.

PAGE
Introduction....................................................................................... 79
Experimental....................................................................................... 80
Discussion And In terpretation Of Data................................... 114
Conclusions......................................................................................... 123
Chapter V Fuel Cell Applications...................................................... 124
Introduction....................................................................................... 125
Hydrogen/Oxygen Fuel Cell Basics.............................................. 125
Fuel (Hydrogen) Electrode Process................................. 126
Oxidant (Oxygen) Electrode Process............................... 127
Function Of The E lectro lyte (KOH) And The Salt
Bridge (KCl/Agar).................................................................. 127
Overall Fuel Cell Process.................................................. 128
Equipment And Chemicals................................................................ 128
Experimental....................................................................................... 130
Discussion And In terpretation Of Data................................... 133
Conclusions....................................................................................... .. 138
Chapter VI Final Conclusions And Recommendations..................... 139
Appendix I Hydrogen Production.......................................................... 141
Introduction....................................................................................... 142
Electrolysis Of Water.................................................................... 142
Basics Of Water E lec tro lys is ............................................ 142
Thermochemical Decomposition Of Water................................... 148
Reformation Of Hydrocarbons........................................................ 150
Catalytic Decomposition Of Methane............................... 150
iv
Reproduced with permission of the copyright owner. Further reproduction prohibited without permission.
PAGE
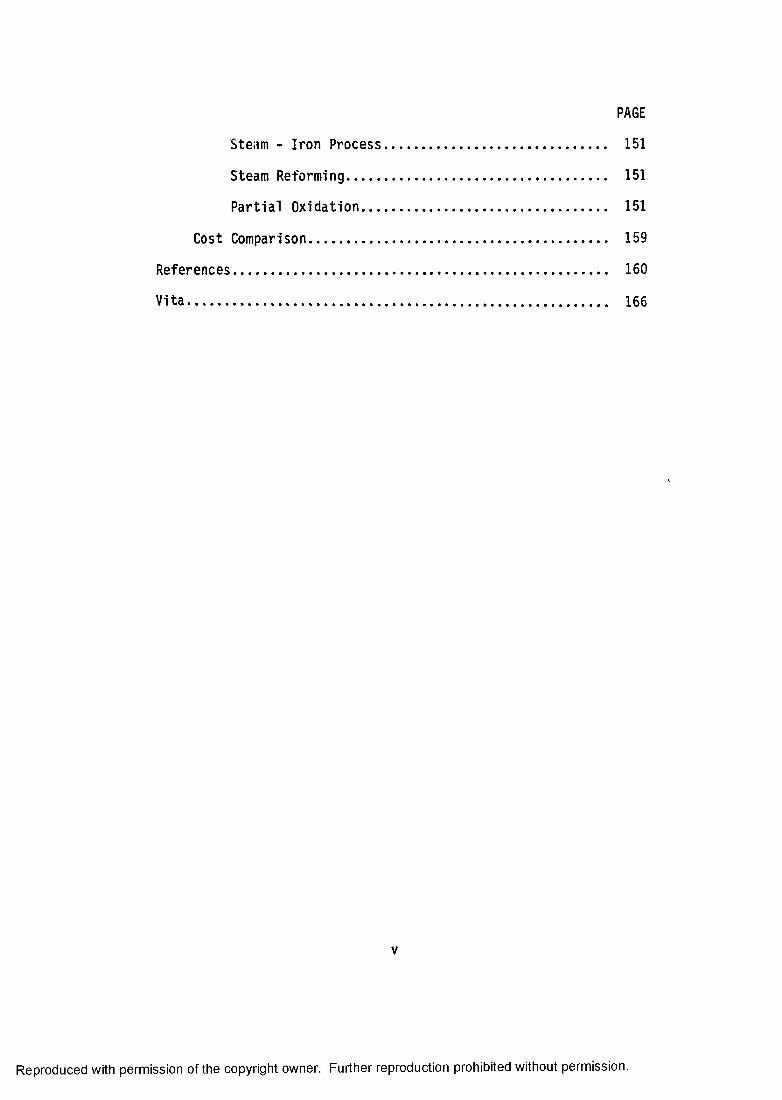
Steam - Iron Process............................................................ 151
Steam Reforming....................................................................... 151
P artia l Oxidation................................................................... 151
Cost Comparison.................................................................................. 159
References...................................................................................................... 160
V ita .................................................................................................................. 166
v
Reproduced with permission of the copyright owner. Further reproduction prohibited without permission.
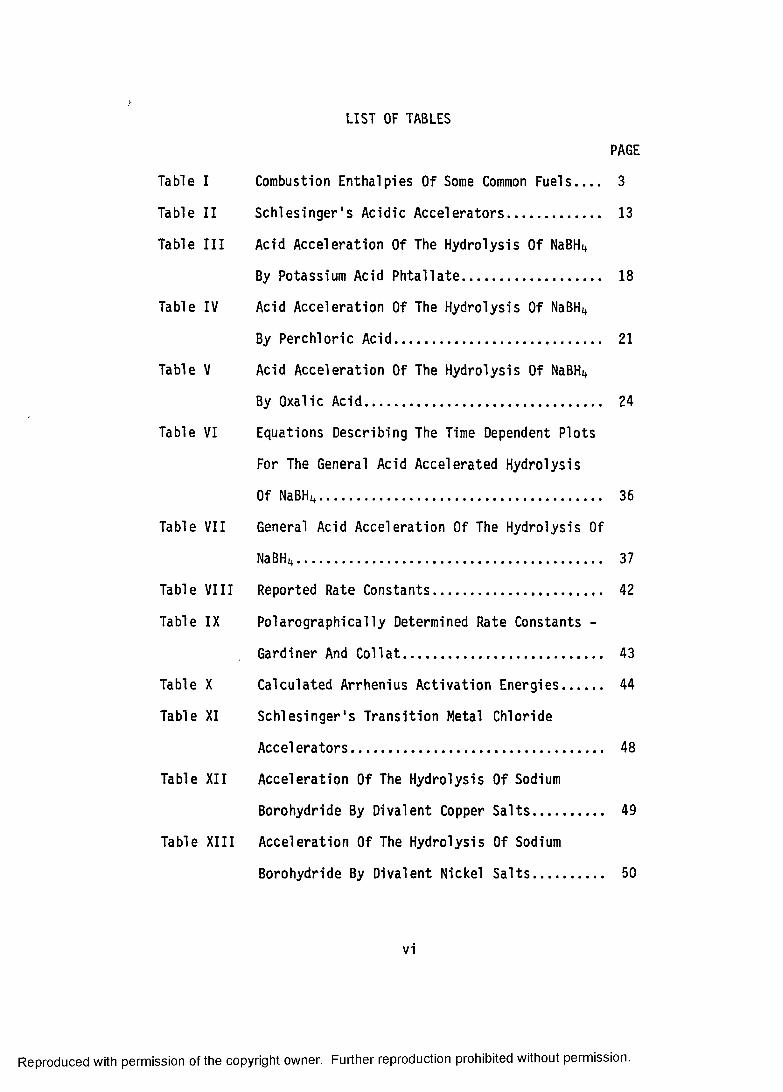
LIST OF TABLES
PAGE
Table I Combustion Enthalpies Of Some Common Fuels 3
Table I I Schlesinger's Acidic Accelerators.......................... 13
Table I I I Acid Acceleration Of The Hydrolysis Of NaBHi*
By Potassium Acid P h ta lla te ...................................... 18
Table IV Acid Acceleration Of The Hydrolysis Of NaBHi*
By Perchloric Acid........................................................ 21
Table V Acid Acceleration Of The Hydrolysis Of NaBHi*
By Oxalic Acid................................................................ 24
Table VI Equations Describing The Time Dependent Plots
For The General Acid Accelerated Hydrolysis
Of NaBHi*............................................................................. 36
Table V II General Acid Acceleration Of The Hydrolysis Of
NaBHi*................................................................................... 37
Table V I I I Reported Rate Constants............................................... 42
Table IX Polarographically Determined Rate Constants -
Gardiner And Coll a t ...................................................... 43
Table X Calculated Arrhenius Activation Energies 44
Table XI Schlesinger's Transition Metal Chloride
Accelerators.................................................................... 48
Table X II Acceleration Of The Hydrolysis Of Sodium
Borohydride By Divalent Copper S a lts ................... 49
Table X I I I Acceleration Of The Hydrolysis Of Sodium
Borohydride By Divalent Nickel S a lts ................... 50
vi
Reproduced with permission of the copyright owner. Further reproduction prohibited without permission.

PAGE
Table XIV Acceleration Of The Hydrolysis Of Sodium
Borohydride By Divalent Cobalt S a lts ................... 51
Table XV Metal Boride Preparations And Compositions 61
Table XVI Standard Reduction Poten tia ls .................................. 64
Table XVII CuX2 As An Acid Accelerator....................................... 65
Table XV III Effect Of Cobalt Metal Catalysis On The
Hydrolysis Of NaBHi*...................................................... 67
Table XIX Effect Of Nickel Metal Catalysis On The
Hydrolysis Of NaBHt*...................................................... 71
Table XX Summary Of Calculated Kinetic Rate Constants Of
Metal Catalysis Observed In MX2 Acceleration.. 75
Table XXI Cobalt Catalysis Of The Hydrolysis Of NaBHi*... 82
Table XXII Raney Nickel Catalysis Of The Hydrolysis Of
NaBHi*.................................................................................. 94
Table XX III Carbonate Buffer Kinetics Of The Hydrolysis
Of NaBHi,............................................................................ 106
Table XXIV Nickel Metal In Carbonate Buffer - Effect On
The Hydrolysis Of NaBHi*.............................................. 109
Table XXV Calculated Nickel Metal Catalysis Of The
Hydrolysis Of NaBH4 ...................................................... 110
Table XXVI Summary Of Kinetics - Cobalt Catalysis Of The
Hydrolysis Of NaBHt*...................................................... 115
Table XXVII Summary Of Kinetics - Raney Nickel Catalysis
Of The Hydrolysis Of NaBH4 ....................................... 116
v ii
Reproduced with permission of the copyright owner. Further reproduction prohibited without permission.
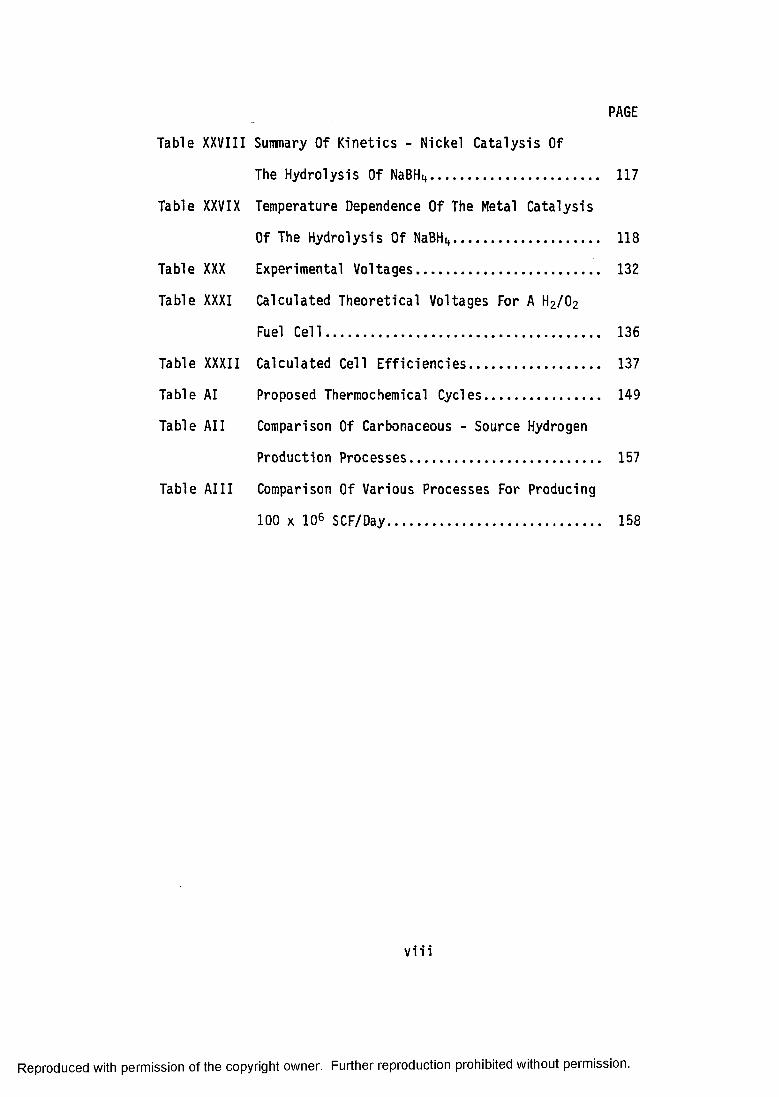
PAGE
Table XXVIII Summary Of Kinetics - Nickel Catalysis Of
The Hydrolysis Of NaBH4 .............................................. 117
Table XXVIX Temperature Dependence Of The Metal Catalysis
Of The Hydrolysis Of NaBHi*....................................... 118
Table XXX Experimental Voltages................................................. 132
Table XXXI Calculated Theoretical Voltages For A H2 /O2
Fuel C e ll.......................................................................... 136
Table XXXII Calculated Cell E ffic ien c ies ................................... 137
Table AI Proposed Thermochemical Cycles............................... 149
Table A ll Comparison Of Carbonaceous - Source Hydrogen
Production Processes.................................................... 157
Table A II I Comparison Of Various Processes For Producing
100 x 106 SCF/Day.......................................................... 158
v i i i
Reproduced with permission of the copyright owner. Further reproduction prohibited without permission.
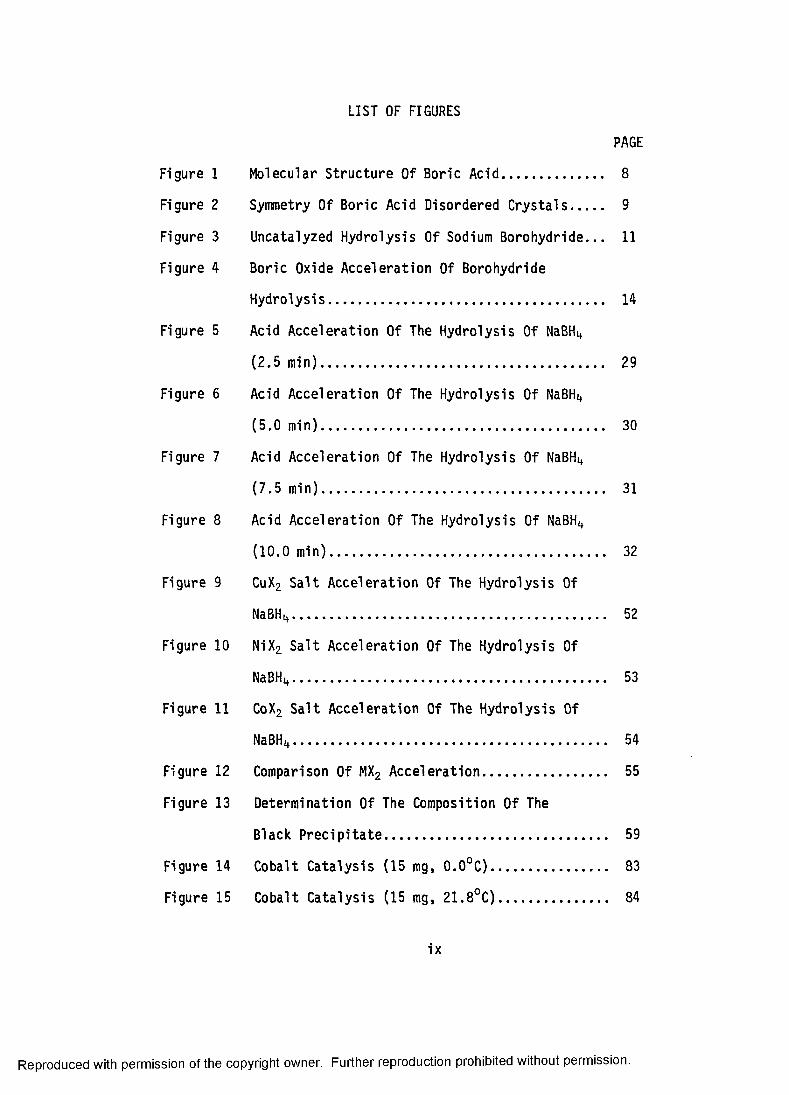
LIST OF FIGURES
PAGE
Figure 1 Molecular Structure Of Boric Acid............................ 8
Figure 2 Symmetry Of Boric Acid Disordered Crystals 9
Figure 3 Uncatalyzed Hydrolysis Of Sodium Borohydride... 11
Figure 4 Boric Oxide Acceleration Of Borohydride
Hydrolysis........................................................................... 14
Figure 5 Acid Acceleration Of The Hydrolysis Of NaBHi*
(2 .5 rain)............................................................................. 29
Figure 6 Acid Acceleration Of The Hydrolysis Of NaBHi*
(5 .0 m in)............................................................................. 30
Figure 7 Acid Acceleration Of The Hydrolysis Of NaBHi*
(7 .5 m in)............................................................................. 31
Figure 8 Acid Acceleration Of The Hydrolysis Of NaBH
(10.0 m in)................................................... 32
Figure 9 CuX2 Salt Acceleration Of The Hydrolysis Of
NaBHi*.................................................................................................... 52
Figure 10 NiX2 Salt Acceleration Of The Hydrolysis Of
NaBHi*.................................................................................................... 53
Figure 11 CoX2 Sa lt Acceleration Of The Hydrolysis Of
NaBHi*.................................................................................................... 54
Figure 12 Comparison Of MX2 Acceleration................................... 55
Figure 13 Determination Of The Composition Of The
Black P rec ip ita te ............................................................ 59
Figure 14 Cobalt Catalysis (15 mg, 0 .0 °C )................................. 83
Figure 15 Cobalt Catalysis (15 mg, 21 .8°C )................................ 84
ix
Reproduced with permission of the copyright owner. Further reproduction prohibited without permission.

PAGE
Figure 16 Cobalt Catalysis (15 mg, 35.0°C ).............................. 85
Figure 17 Cobalt Catalysis (20 mg, 0 .0 °C )................................ 87
Figure 18 Cobalt Catalysis (20 mg, 22 .1°C ).............................. 8 8
Figure 19 Cobalt Catalysis (20 mg, 35.0°C ).............................. 89
Figure 20 Cobalt Catalysis (25 mg, 0 .0 °C )................................ 91
Figure 21 Cobalt Catalysis (25 mg, 22 .0°C ).............................. 92
Figure 22 Cobalt Catalysis (25 mg, 35.0°C ).............................. 93
Figure 23 Raney Nickel Catalysis (20 mg, 0 .0 °C )................... 95
Figure 24 Raney Nickel Catalysis (20 mg, 21 .0°C )................. 96
Figure 25 Raney Nickel Catalysis (20 mg, 35.0°C )................. 97
Figure 26 Raney Nickel Catalysis (25 mg, 0 .0 °C )................... 99
Figure 27 Raney Nickel Catalysis (25 mg, 21 .0°C )................. 100
Figure 28 Raney Nickel Catalysis (25 mg, 35 .0°C )................. 101
Figure 29 Raney Nickel Catalysis (30 mg, 0 .0 °C ).................... 103
Figure 30 Raney Nickel Catalysis (30 mg, 21 .0°C ).................. 104
Figure 31 Raney Nickel Catalysis (30 mg, 35.0°C ).................. 105
Figure 32 Calculated Nickel Catalysis (15 mg, 0 .0 °C ).......... I l l
Figure 33 Calculated Nickel Catalysis (15 mg, 21 .6°C )____ 112
Figure 34 Calculated Nickel Catalysis (15 mg, 35 .0°C )____ 113
Figure 35 Temperature Dependence Of kj,Q..................................... 119
Figure 36 Temperature Dependence Of k^_^^................................. 120
Figure 37 Temperature Dependence Of k ^ ...................................... 121
Figure 38 Simple H2 /O2 Fuel Cell Schematic.............................. 129
Figure 39 Calculated And Experimental Voltages....................... 135
Figure AI Acid And A lkaline E lec tro ly tic Processes 144
x
Reproduced with permission of the copyright owner. Further reproduction prohibited without permission.

PAGE
Figure A2 Present And Future Polarization Parameters 146
Figure A3 E lec tro ly tic Hydrogen P lant......................................... 147
Figure A4 Steam - Hydrogen Production........................................ 153
Figure A5 Steam Reformation Of Methane - Hydrogen
Production........................................................................... 154
Figure A6 Partia l Oxidation - Hydrogen Production................ 155
Figure A7 Carbonaceous - Source Hydrogen Production 156
xi
Reproduced with permission of the copyright owner. Further reproduction prohibited without permission.

ABSTRACT
Hydrogen has been promoted as the energy a lte rn ative o f the
future. Fuel ce ll u t iliz a tio n of hydrogen minimizes pollution while
optimizing energy conversion e ffic ien c ies . Sodium borohydride has
been investigated as a possible hydrogen storage and transport medium.
Within the proper ca ta ly tic environment, one gram of sodium borohydride
liberates almost 2 .4 l i t e r s o f hydrogen at a controllable ra te .
The effects o f acids, transition metal sa lts , and transition
metals on the hydrolysis of sodium borohydride have been mathematically
quantified. Least squares analyses have reduced the data to simple
combinations of algebraic expressions. S p ec ifica lly , acid acceleration
is subject to pseudo-first-order kinetics; equivalent acid
concentrations are logarithm ically related to the extent o f hydrolysis.
Transition metal catalysis obeys zero-order-kinetics (lin ea r
relationship between borohydride concentration and reaction tim e).
Dual functionality (acid acceleration plus surface catalysis)
characterizes the effects of trans ition metal salts on the borohydride
hydrolytic rate .
A highly e ff ic ie n t hydrogen/oxygen fuel cell powered by sodium
borohydride has been designed and operated. The ultim ate u tiliz a tio n
of sodium borohydride as a fuel ce ll source is related to the cost of
hydrogen; therefore, modern hydrogen technologies have been reviewed
and compared on a cost basis.
xi i
Reproduced with permission of the copyright owner. Further reproduction prohibited without permission.

CHAPTER I INTRODUCTION
1
Reproduced with permission of the copyright owner. Further reproduction prohibited without permission.
2
Developed countries are presently confronted with an
imbalance of energy demand and consumption versus fossil fuel
energy supply and production1. Avoidance of further
manipulations by petroleum producing nations is a p o lit ic a l (and
societa l) necessity. Major e ffo rts have been directed toward
increasing domestic energy production from both renewable and
non-renewable resources while simultaneoulsy decreasing energy
consumption and encouraging conservation.
Short term (25 year) needs w ill probably be met out of
necessity by increased usage of coal and nuclear power despite
s ig n ifican t environmental concerns. These resources are
essentia lly stop-gap measures before the imperative employment
of renewable means in the long term. Many of these
replenishable resources (so lar, ocean thermal gradient, biomass,
and geothermal) exh ib it diffuse energy density p ro file s 1.
Furthermore, energy is released from these sources, as from
coal and fiss io n , in the form of heat. Deployment of a
concentrated energy (e le c tr ic ity ) ca rrie r is of paramount
in te res t and p r io r ity . Hydrogen (H2) may serve as an
intermediate through which a primary energy source (so lar) can
be e ffe c tiv e ly transmitted and consumed.
Table I compiles combustion enthalpies fo r some common
fue ls . In addition to possessing the highest energy content per
kilogram, hydrogen fuel offers a number of a ttra c tiv e advantages
Reproduced with permission of the copyright owner. Further reproduction prohibited without permission.

Reproduced
with perm
ission of the
copyright ow
ner. Further
reproduction prohibited
without
permission.
TABLE I COMBUSTION ENTHALPIES FOR SOME COMMON FUELS 2
FUEL COMPOSITION REACTION ENERGY/MOLE ENERGY/KG
ETHANOL c2 h5oh c2 h5oh + 302 - 2C02 + 3H20 1367 KJ 2.97 x 10*
COAL C c + 0 2 -* CO 2 393 KJ 3.27 x 10*
PETROLEUM CeHie9 2 CsHi8 + 2502 -v I 6 CO2 + 18H20 5452 KJ 4.77 x 10*
NATURAL GAS CH4b CH 4 + 2 0 2 -*■ C02 + 2H20 883 KJ 5.50 x 10*
HYDROGEN h2 2H2 + ° 2 ^ 2H20 247 KJ 12.24 x 10*
These enthalpic values re fle c t ideal (100%) combustion at 25°C.
a - Octane is only one of the many hydrocarbons in petroleum,
b - Methane is the primary constituent (>90%) of natural gas.
4
including:
1 ) Mininimal pollution characteristics,
2) Mass transportab ility comparable to that of petroleum,
3) Combustibility in internal combustion engines (Carnot
cycle devices),
4) Feas ib ility of electrochemica1 combination with an
oxidant in fuel ce lls (free energy type devices).
Despite the already demonstrated v ia b ility of hydrogen
combustion, fuel cell u tiliz a tio n of hydrogen is potentially
even more a ttrac tive . Fuel cells maximize the e ffective work
output while s ign ifican tly reducing the thermal pollution
associated with heat-based chemical energy converters.
Additionally, fuel cells are noiseless and have no moving parts.
S ir William Grove developed the f ir s t workable fuel cell in
1839; hydrogen and oxygen were combined on platinium
electrocatalysts to produce water and a voltage3. In the
succeeding century-and-a-half, substantial technical
improvements have established the fe a s ib ility of H2 /O2 fuel
cells as long l i f e , high efficiency energy options. When
coupled with the tremendous advances in the s ta te -o f-th e -a rt
technology of e lec tric motors, fuel cells can provide an
economical, high torque system of mechanical power3. Energy
analysts foresee the eventual integration of H2 /O2 fuel cells
into the transportation sector (e lec tric vehicles)1*, existing
and future public u t i l i t y power grids (peak load leve lers )5, and
remote e lec trica l power generating sites6 .
Reproduced with permission of the copyright owner. Further reproduction prohibited without permission.

5
Hydrocarbon cracking7, liq u id hydrogen7, and in te rs t it ia l
transition metal hydrides0 have been previously promoted as
possible sources of hydrogen. The thrust of th is author's
research at Louisiana State University is to o ffe r an
a lte rn ative to a fossil fu e l- or metal a lloy (low H2
density)-based hydrogen delivery system. Inorganic hydride
s a lts , sp ec ifica lly sodium borohydride (NaBH^), may be u tilize d
as a primary hydrogen storage medium. In contrast to
pressurized cylinder hydrogen storage, sodium borohydride, as a
solid or in a lkaline solution, may be safely stored and
transported. The inherent capacity for on-site hydrogen
generation further enhances the prospects for NaBH .
Methodologies for liberating hydrogen from sodium
borohydride at useable rates have been developed. In
p artic u la r, the following pathways which increase the rate of
hydrolysis of NaBH were investigated and quantified:
1) General acid acceleration
2) Specific transition metal sa lt enhancement
3) Specific transition metal surface catalysis .
Lastly, the fe a s ib ility of borohydride source hydrogen in an
operational fuel cell has been demonstrated.
Reproduced with permission of the copyright owner. Further reproduction prohibited without permission.

CHAPTER I I ACID ACCELERATION
6
Reproduced with permission of the copyright owner. Further reproduction prohibited without permission.

7
INTRODUCTION
Synthesis of new v o lt ile compounds of uranium was under
taken in 1941 under the auspices of the National Defense
Research Committee at the University of Chicago directed by H .I.
Schlesinger and H.C. Brown9 . Based on the known v o la t i l i ty of
the aluminum and beryllium borohydrides, preparation of the
uranium analog was attempted. Previous borohydride preparatory
techniques involved the reaction of diborane with a metal a lky l.
Since no uranium alkyls were known, new synthetic approaches
were a contingent necessity. Uranium (IV ) borohydride, U(BH^)
successfully produced by the combination of uranium (IV )
flouride (UFH) and aluminum borohydride (A I(BH ) 3), exhibited
greater v o la t i l i ty than a ll other known uranium compounds with
the exception of the hexaflouride (UF6 ) 9. As a consequence of
the atomic bomb related e ffo rts a t the University of Chicago,
many novel compounds containing boron and hydrogen, including
sodium borohydride, were concurrently synthesized10.
Schlesinger and Brown subsequently q u a lita tive ly investigated
the potential usefulness of sodium borohydride as a hydrogen
generator n .
UNCATALYZED HYDROLYSIS OF SODIUM BOROHYDRIDE
Schlesinger and Brown reported the hydrolysis of sodium
borohydride as:
NaBH4 + 2H20 + NaB02 + 4H2t (1)
Reproduced with permission of the copyright owner. Further reproduction prohibited without permission.
8
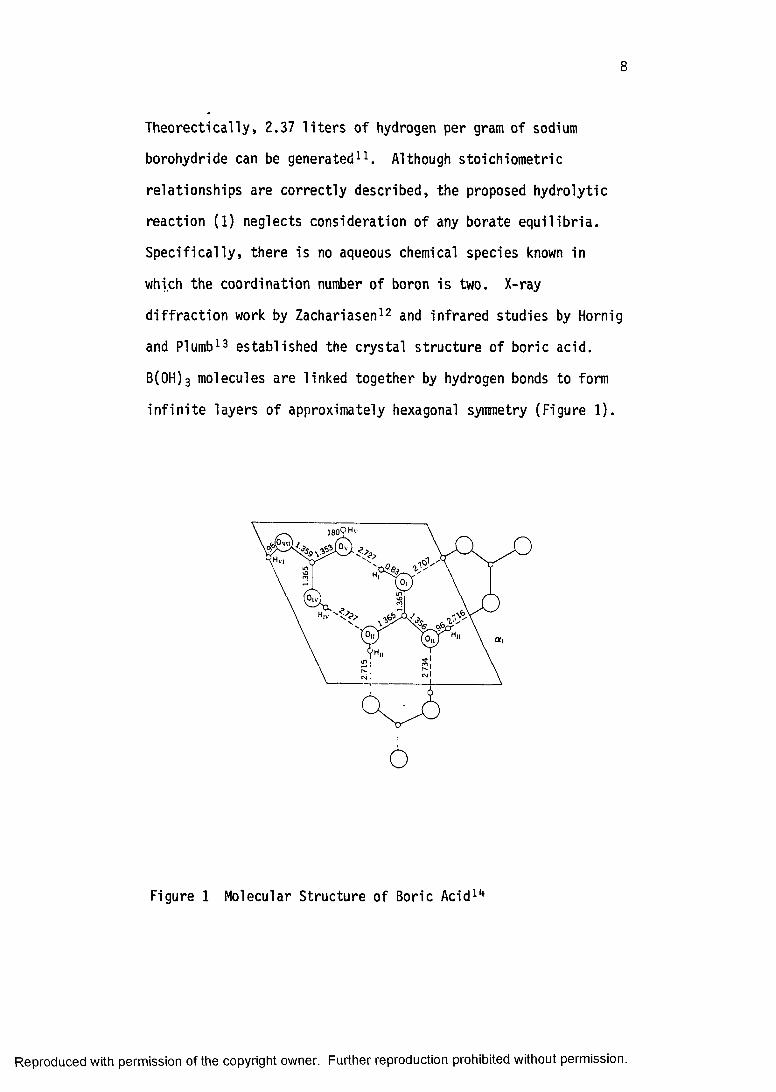
Theorectically, 2.37 l ite rs of hydrogen per gram of sodium
borohydride can be generated11. Although stoichiometric
relationships are correctly described, the proposed hydrolytic
reaction ( 1 ) neglects consideration of any borate e q u ilib ria .
S p ec ifica lly , there is no aqueous chemical species known in
which the coordination number of boron is two. X-ray
d iffrac tio n work by Zachariasen12 and infrared studies by Hornig
and Plumb13 established the crystal structure of boric acid.
B(0H) 3 molecules are linked together by hydrogen bonds to form
in f in ite layers of approximately hexagonal symmetry (Figure 1).
Figure 1 Molecular Structure of Boric Acid14
Reproduced with permission of the copyright owner. Further reproduction prohibited without permission.

9
Analysis of the IR spectrum of disordered crystals confirm two
B(OH) 3 units of d iffe ren t symmetries (Figure 2 ) .
H H\ \0 x 0I
0
H
B B
. / \ 0— „ « / N\ H
C3h Cs
Figure 2 Symmetry of Boric Acid Disordered Crystals
Using Raman Spectroscopy, Hibben noted the identical structural
nature of boric acid in solution and in the crys ta lline s ta te is.
From infrared spectra of boric acid, Edwards inferred that the
only species in aqueous solution are B(0H) 3 and B(0H)^ 16. There
is , therefore, no evidence of B02 in solution. The hydrolytic
reaction, confirmed by Mochalov and Gil'manshin may be
formulated a s i7:
NaBHu + 4H20 -*■ Na+ + B(0H) 3 + OH" + 4H2 (2)
However, in alkaline solution, formation of the tetrahydroxyborate
ion predominates:
B{0H) 3 + OH" -v B(0H)" (3)
Furthermore, i f boric acid and tetrahydroxyborate are both present in
solution, the following equilibrium ex is ts18:
2B( OH) 3 + B(OH) t B303 (0H)~ + 3H20 K = 110 (4)
Reproduced with permission of the copyright owner. Further reproduction prohibited without permission.

10
For s im plic ity , borates in a lkaline solution w ill be
subsequently denoted as B(OH) .
Schlesigner and Brown observed that at ordinary
temperatures, only a small percentage of the theoretica lly
available hydrogen can be liberated at an appreciable ra te11.
Our experiments show that in ten minutes, less than 15% of
available hydrogen can be produced (Figure 3 ). As the reaction
proceeds, concentration of tetrahydroxyborate ions and
consequently, solution a lk a lin ity increase rapidly, thereby
inh ib itin g further hydrolysis. Hence, in aqueous media, pH is a
lim itin g parameter. I f either the pH is controlled, or i f a
su ffic ien t amount of acid is added in i t ia l ly , the theoretical
y ie ld of hydrogen may be obtained in a re la tive ly short time.
SCHLESINGER AND BROVIN - APPROACH TO ACID ACCELERATION
Schlesinger, Brown, and coworkers investigated the effects
of various acid accelerators on the rate of hydrolysis of sodium
borohydriden . The hydrolytic reaction in acidic media may be
w ritten as:
NaBH + H+ + 3H 20 -*■ Na+ + B(0H) 3 + 4H2+ (5)
Pellets containing equal weights of borohydride and an
accelerator were dropped into a known volume of water. The
extent of hydrolysis was determined by the amount of hydrogen
collected. Accelerator capacity was em pirically related to acid
strength. Among the most e ffec tive accelerators were oxalic
acid, succinic acid, phosphorous pentoxide, aluminum chloride,
Reproduced with permission of the copyright owner. Further reproduction prohibited without permission.

p Na
B
H4
11
1. 0 8 -
I .06 -
0.1 M Na BH 2 2 . 0 ° C
. 0 4 -
1. 0 2 -
1.000 2.5 5.0 7.5 10.0
T I M E ( M i n )
Figure 3 Uncatalyzed Hydrolysis of Sodium Borohydride
Reproduced with permission of the copyright owner. Further reproduction prohibited without permission.
12
and boric oxide. Particu lar problems were associated with oxalic
acid and aluminum chloride which caught f ir e in the
p e lle tiza tio n process. In small volumes of water, Schlesinger
and Brown observed the heating of borohydride/oxalic acid
pelle ts to incandescence1! .
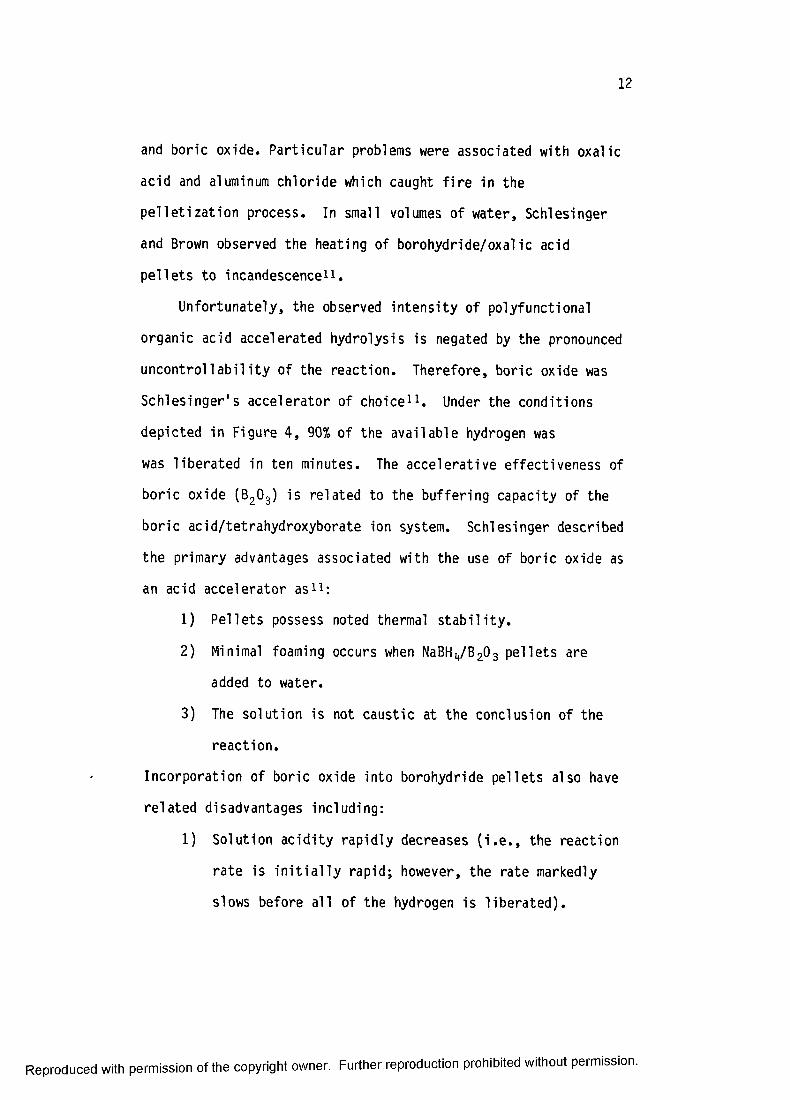
Unfortunately, the observed in tensity of polyfunctional
organic acid accelerated hydrolysis is negated by the pronounced
u n co n tro llab ility of the reaction. Therefore, boric oxide was
Schlesinger's accelerator of choice11. Under the conditions
depicted in Figure 4 , 90% of the available hydrogen was
was liberated in ten minutes. The accelerative effectiveness of
boric oxide (B2 03) is related to the buffering capacity of the
boric acid/tetrahydroxyborate ion system. Schlesinger described
the primary advantages associated with the use of boric oxide as
an acid accelerator as11:
1) Pellets possess noted thermal s ta b ility .
2) Minimal foaming occurs when NaBHIf/B 20 3 pellets are
added to water.
3) The solution is not caustic at the conclusion of the
reaction.
Incorporation of boric oxide into borohydride pellets also have
related disadvantages including:
1) Solution ac id ity rapidly decreases ( i . e . , the reaction
rate is in i t ia l ly rapid; however, the rate markedly
slows before a ll of the hydrogen is lib e ra ted ).
Reproduced with permission of the copyright owner. Further reproduction prohibited without permission.

Reproduced
with perm
ission of the
copyright ow
ner. Further
reproduction prohibited
without
permission.
TABLE I I SCHLESINGER'S ACIDIC ACCELERATORS11
ACCELERATORWT. OF ACCELERATOR „ in n" " " WT7~0F~Na5ir"
% HYDROGEN LIBERATED 3 MIN 6 MIN 10 MIN
95%Oxalic Acid 60% 90% 93%
75% Violent reaction
1 0 0 % Violent reaction
Succinic Acid 60% 8 6 % 92%
75% 95.5% 98%
1 0 0 % Very fast
Boric Oxide 75%
**00V*
1 0 0 % 8 6 % 95% !
95%
99%
89%
97.5%
[BH“ ] = 1.32M; In i t ia l water temperature = 25°C (Temperature allowed to r is e , f in a l
temperatures = 47-50°C).

14
oUiJ 100O>l±J
z 75-LUOO
* 50-O> -X Wt of NoBH
o 25-Water ratio = 20 : 1
p
0 2 4 6 8 10T I ME (Mia. )
Figure 4 Boric Oxide Acceleration of Borohydride Hydrolysis
Reproduced with permission of the copyright owner. Further reproduction prohibited without permission.

15
2) Relatively large amounts (50% of p e lle t weight of B2O3
are needed which e ffe c tive ly decreases the hydrogen
y ie ld per p e lle t) .
Q uantitative buffer studies were concurrently undertaken.
The rate of hydrolysis was found to depend solely on pH and was
independent of the specific acids and salts comprising the
buffer. Increasing in i t ia l water temperature, borohydride
concentration, and re la tiv e acid concentration produced a
corresponding increase in the acid accelerated rate of
hydrolysis.
ACID ACCELERATION - EXPERIMENTAL
Compounds of known or suspected accelerative effectiveness
on the hydrolysis of sodium borohydride were investigated.
Quantification of acid acceleration on a molar rather than on a
weight basis was the primary objective. Employing conditions
sim ilar to those used by Schlesinger, solution pH was allowed to
vary. An extensive study was carried out under ambient
conditions; however, supplemental data were collected at two
other temperatures. In contrast to the technique of Schlesinger
and Brown, the accelerator and borohydride were part of a
homogeneous solution. This a lte ra tion in reaction conditions
eliminated the problems associated with p e lle t preparation and
p e lle t surface e ffec ts . Instead of collecting the generated
hydrogen, the extent of hydrolysis was measured by the easier,
Reproduced with permission of the copyright owner. Further reproduction prohibited without permission.

16
more reproducible iodim etric method19. Experimental results are
summarized in Tables I I I - V and graphically presented in
Figures 5-8 .
PROCEDURE FOR THE DETERMINATION OF THE EXTENT OF Bfy HYDROLYSIS
50-ml of d is t il le d , de-ionized water containing a known
molar amount of an acid accelerator was added to a 189.2-mg (5.0
m illim oles) sample of sodium borohydride powder ( 1 0 0 mM) in an
open Erlenmeyer flask . For the supporting investigations at 0°C
and 35°C, the accelerator solution, the solid borohydride, and
subsequently the reaction vessel, were thermostatted using a
Sargeant Welch (Model ST) thermonitor (±0.05°C). After a measured
time t , the percent hydrolysis was determined by the following
process:
1. All unreacted borohydride was quantita tive ly consumed with
an excess of potassium idoate.
3NaBH4 + 4KI03 + 41“ + 4K+ + 3Na+ + 3B(0H)U (6 )
2. Immediately, a ll unreacted iodate was reacted with
potassium iodide and sulfuric acid.
KI03 + 5KI + 3H2 SO + 3K2 S0lt + 3H20 + 3 I2 (7)
3. The reaction vessel was stoppered and stored in the dark.
The iodine solution was subsequently t it ra te d with sodium
th io su lfa te in the presence of starch.
2Na2 S2 03 + I 2 + Na2 S0it05 + 2NaI ( 8 )
(b lue/black) (colorless)
Reproduced with permission of the copyright owner. Further reproduction prohibited without permission.
17
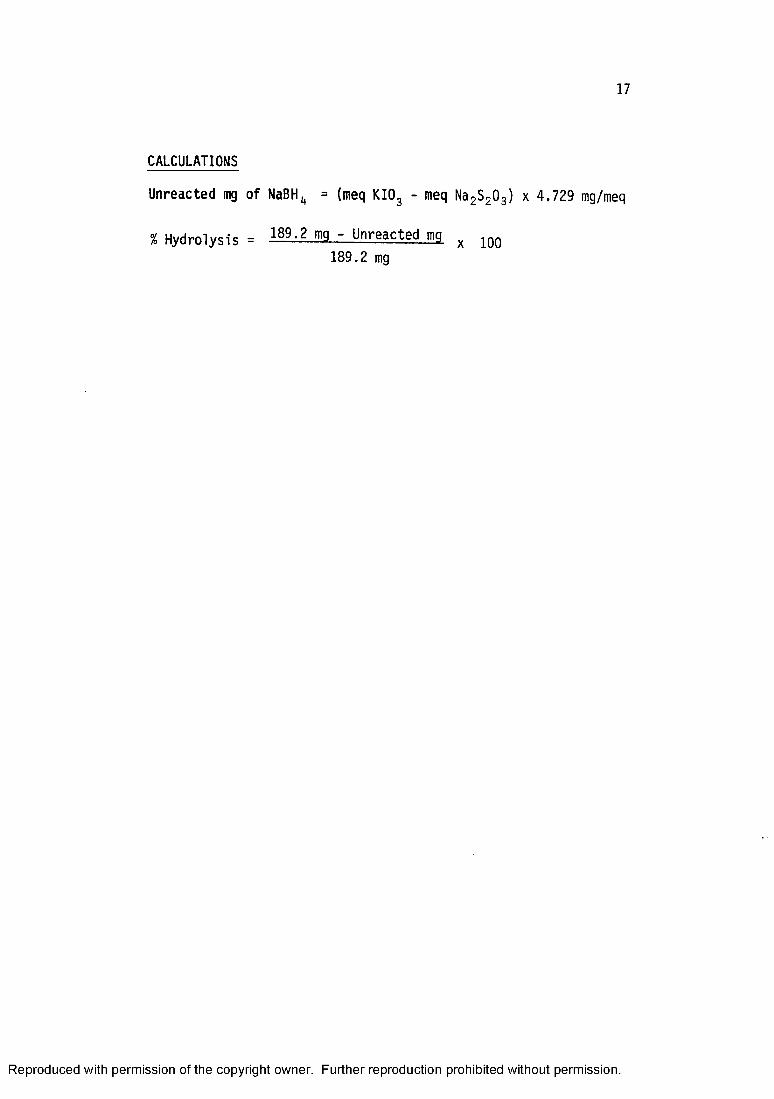
CALCULATIONS
Unreacted mg of NaBHu = (meq KI03 - meq Na2 S2 03) x 4.729 mg/meq
% Hydrolysis = nig - Unreacted mg x189.2 mg
Reproduced with permission of the copyright owner. Further reproduction prohibited without permission.

Reproduced
with perm
ission of the
copyright ow
ner. Further
reproduction prohibited
without
permission.
TABLE I I I ACID ACCELERATION OF THE HYDROLYSIS OF NaBHu BY POTASSIUM ACID PHTHALATE
MQLES.KHP x 10Q 2.5 MIN 5.0 MIN 7.5 MIN 10.0 MINMOLES NaBHu______ % HYDROLYSIS % HYDROLYSIS % HYDROLYSIS % HYDROLYSIS
0% 12.9% 13.6% 14.3% 14.8%1% 15.7% 17.3% 18.4% 19.0%2% 18.3% 20.3% 21.5% 22.3%3% 20.4% 22.5% 24.2% 25.5%4% 22.5% 24.7% 26.6% 28.1%5% 24.2% 26.6% 28.2% 29.8%
10% 33.4% 37.3% 39.3% 40.9%20% 48.2% 52.2% 54.8% 57.2%30% 59.9% 63.7% 66.9% 70.0%40% 69.8% 73.8% 77.5% 80.6%50% 78.6% 83.0% 85.8% 88.5%
100 mM NaBH^; 21.7°C
oo
Reproduced
with perm
ission of the
copyright ow
ner. Further
reproduction prohibited
without
permission.
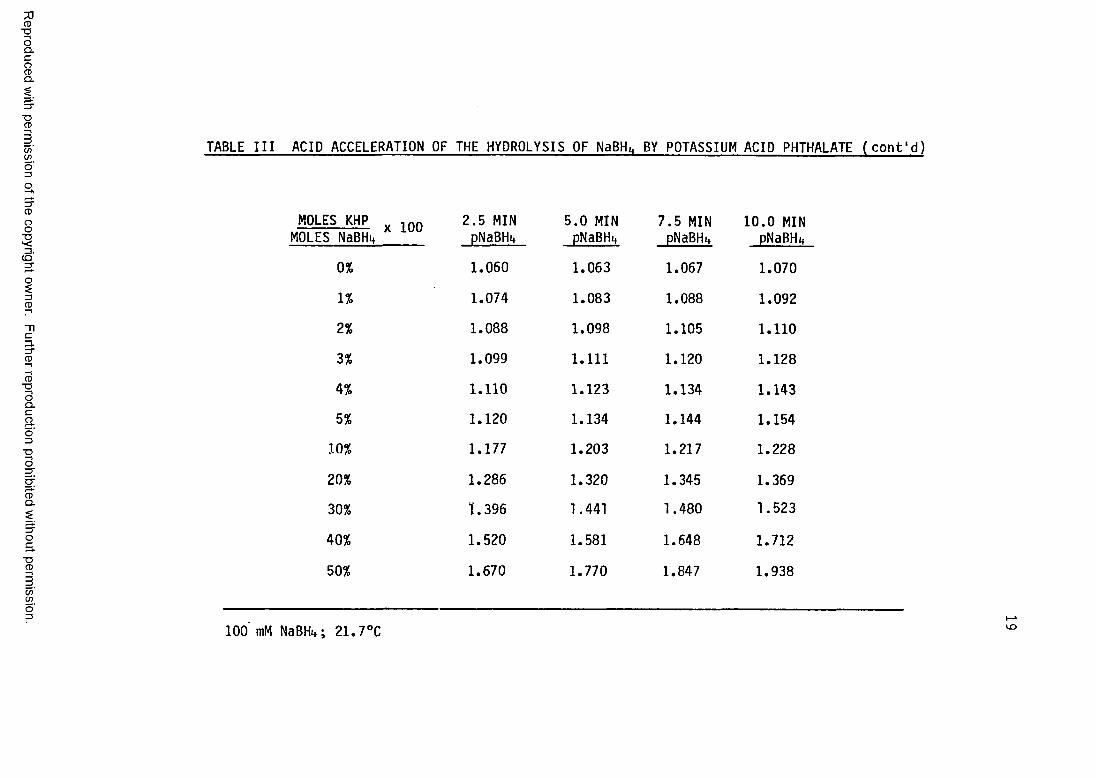
TABLE I I I ACID ACCELERATION OF THE HYDROLYSIS OF NaBHu BY POTASSIUM ACID PHTHALATE (c o n t'd )
MOLES KHP 1 0 0 2.5 MIN 5 .0 MIN 7.5 MIN 10.0 MINMOLES NaBHit pNaBHu pNaBHtf pNaBHi» pNaBHit
0 % 1.060 1.063 1.067 1.070
1 % 1.074 1.083 1.088 1.092
2 % 1.088 1.098 1.105 1 . 1 1 0
3% 1.099 1 . 1 1 1 1 . 1 2 0 1.128
4% 1 . 1 1 0 1.123 1.134 1.143
5% 1 . 1 2 0 1.134 1.144 1.154
1 0 % 1.177 1.203 1.217 1.228
2 0 % 1.286 1.320 1.345 1.369
30% t . 396 1.441 1.480 1.523
40% 1.520 1.581 1.648 1.712
50% 1.670 1.770 1.847 1.938
100 mM NaBHit; 21.7°C

Reproduced
with perm
ission of the
copyright ow
ner. Further
reproduction prohibited
without
permission.
TABLE I I I ACID ACCELERATION OF THE HYDROLYSIS OF NaBHu BY POTASSIUM ACID PHTHALLATE (cont'd )
MOLES KHP 10Q 2.5 MIN 5.0 MIN 7.5 MIN 10.0 MINMOLES NaBHu pH pH pH pH_
0% 10.24 10.30 10.34 10.36
1% 9.55 9.72 9.80 9.89
2% 9.49 9.66 9.74 9.823% 9.43 9.60 9.69 9.75
4% 9.40 9.56 9.65 9.715% 9.38 9.52 9.61 9.67
10% 9.27 9.39 9.48 9.5720% 9.10 9.24 9.31 9.3730% 8.98 9.12 9.18 9.2340% 8.87 9.00 9.05 9.09
50% 8.76 8.88 8.92 8.96
100 mM NaBHi,; 21.7°Croo

Reproduced
with perm
ission of the
copyright ow
ner. Further
reproduction prohibited
without
permission.
TABLE IV ACID ACCELERATION OF THE HYDROLYSIS OF NaBHu BY PERCHLORIC ACID
10.0 MIN % HYDROLYSIS
0 % 12.9% 13.6% 14.3% 14.8%
1 % 15.2% 16.5% 17.6% 18.3%
2 % 17.6% 19.0% 20.4% 21.5%
3% 19.9% 2 1 . 6 % 23.1% 24.6%
4% 2 2 . 2 % 24.3% 26.0% 27.5%
5% 24.5% 26.6% 28.4% 30.1%
10% 34.7% 37.4% 39.9% 42.1%
2 0 % 51.0% 54.5% 58.0% 60.5%
30% 63.2% 67.0% 70.6% 73.0%
40% 72.4% 76.0% 79.3% 81.4%
50% 79.2% 82.4% 85.4% 87.2%
100 mM NaBH4; 21.7°C
MOLES HClOu 2.5 MIN 5.0 MIN 7.5 MINMOLFS' 'NaBHlI x 1UU % HYDROLYSIS % HYDROLYSIS % HYDROLYSIS

Reproduced
with perm
ission of the
copyright ow
ner. Further
reproduction prohibited
without
permission.
TABLE IV ACID ACCELERATION OF THE HYDROLYSIS OF NaBfj BY PERCHLORIC ACID (cont'd )
MOLES HClOu 2 .5 MIN 5.0 MIN 7.5 MIN 10.0 MINMOLES NaBhtt x pNaBfo pNaBH»t pNaBH** pNaBHt
0 % 1.060 1.063 1.067 1.070
1 % 1.072 1.078 1.084 1.088
2 % 1.084 1.092 1.099 1.105
3% 1.096 1.106 1.114 1 . 1 2 2
4% 1.109 1 . 1 2 1 1.130 1.139
5% 1 . 1 2 2 1.134 1.145 1.155
1 0 % 1.185 1.203 1 . 2 2 1 1.238
2 0 % 1.310 1.342 1.376 1.403
30% 1.434 1.481 1.531 1.568
40% 1.558 1.619 1.684 1.732
50% 1.681 1.755 1.836 1.894
100 mM NaBH ; 21.7°Croro

Reproduced
with perm
ission of the
copyright ow
ner. Further
reproduction prohibited
without
permission.
TABLE IV ACID ACCELERATION OF THE HYDROLYSIS OF NaBH„ BY PERCHLORIC ACID (cont'd )
MOLES HClOu .. in « 2.5 MIN 5.0 MIN 7 .5 MIN 10.0 MIN MOLES NaBHg X 1UU pH pH pH pH
0 % 10.24 10.30 10.34 10.36
1 % 9.70 9.84 9.90 9.93
2 % 9.60 9.75 9.82 9.85
3% 9.54 9.69 9.76 9.80
4% 9.49 9.63 9.70 9.75
5% 9.44 9.58 9.66 9.71
1 0 % 9.34 9.47 9.54 9.58
2 0 % 9.15 9.25 9.32 9.37
30% 9.01 9.09 9.16 9.21
40% 8.89 8.96 9.01 9.05
50% 8.77 8.83 8 . 8 8 8.91
100 mM NaBH„; 21.7°C roco

Reproduced
with perm
ission of the
copyright ow
ner. Further
reproduction prohibited
without
permission.
TABLE V ACID ACCELERATION OF THE HYDROLYSIS OF NaBH^t BY OXALIC ACID
MOLES H2C2O4 j g g
MOLES NaBHit2 .5 MIN
% HYDROLYSIS5 .0 MIN
% HYDROLYSIS7 .5 MIN
% HYDROLYSIS1 0 .0 MIN
% HYDROLYSIS
0% 12.9% 13.6% 14.3% 14.8%
1% 18.7% 20.3% 21. 6% 22.9%
2% 23.8% 26.0% 27.8% 29.6%
3% 28.5% 30.9% 32.9% 34.7%
4% 32.7% 35.2% 37.4% 39.1%
5% 36.9% 39.7% 42.1% 44.0%
10% 54.1% 57.6% 60.7% 62.5%
20% 75.1% 78.4% 81.6% 82.8%
30% 86 . 6% 89.2% 91.3% 92.2%
100 mM NaBHit; 2 1 .7 °C
ro-P»

Reproduced
with perm
ission of the
copyright ow
ner. Further
reproduction prohibited
without
permission.
TABLE V ACID ACCELERATION OF THE HYDROLYSIS OF NaBHit BY OXALIC ACID (cont'd )
MOLES H9C?0u 1 Q 0 2.5 MIN 5.0 MIN 7.5 MIN 10.0 MINMOLES NaBHtt X pNaBHu pNaBHu pNaBhU pNaBHi»
0 % 1.060 1.063 1.067 1.070
1 % 1.090 1.098 1.106 1.113
2 % 1 . 1 1 2 1.130 1.142 1.152
3% 1.146 1.160 1.173 1.185
4% 1.172 1.188 1.204 1.216
5% 1 . 2 0 0 1.219 1.238 1.251
1 0 % 1.338 1.373 1.406 1.425
2 0 % 1.604 1.665 1.735 1.766
30% 1.872 1.964 2.062 2 . 1 1 0
100 mM NaBH 21.7°C
rocn

Reproduced
with perm
ission of the
copyright ow
ner. Further
reproduction prohibited
without
permission.
ACID ACCELERATION OF THE HYDROLYSIS OF NaBHu BY OXALIC ACID (cont
MOLES H2 C2 0u .. lnn MOLES NaBHi, x 1UU
2.5 MIN pH
5.0 MIN pH
7.5 MIN pH
10.0 MI! pH
0 % 10.24 10.30 10.34 10.36
1 % 9.50 9.66 9.75 9.81
2 % 9.42 9.57 9.66 9.71
3% 9.35 9.51 9.59 9.65
4% 9.33 9.47 9.54 9.59
5% 9.30 9.44 9.50 9.53
1 0 % 9.17 9.29 9.34 9.38
2 0 % 8.91 9.00 9.04 9.07
30% 8.64 8.72 8.74 8.75
100 mM NaBHi,; 21.7°C
ro

Reproduced
with perm
ission of the
copyright ow
ner. Further
reproduction prohibited
without
permission.
TABLE V ACID ACCELERATION OF THE HYDROLYSIS OF NaBHg BY OXALIC ACID ( c o n t 'd )
MOLES H2 C20 u 1 qq MOLES NaBHit * 1UU
5%
10%30%
2 .5 MIN % HYDROLYSIS
24.8%
40.8%
77.8%
5 .0 MIN
% HYDROLYSIS
25.5%
42.2%
78.9%
7 .5 MIN
HYDROLYSIS
26.3%
43.4%
80.1%
1 0 .0 MIN
% HYDROLYSIS
26.9%
44.3%
80.6%
MOLES HgCgOu 10Q MOLES NaBHn
5%
10%30%
2 .5 MIN
pNaBHtt
1 .1 2 4
1 .2 2 7
1 .6 5 3
5 .0 MIN
pNaBHi»
1 .1 2 8
1 .2 3 8
1 .6 7 5
7 .5 MIN
pNaBHij
1 .1 3 2
1 .2 4 7
1 .7 0 2
1 0 .0 MIN
pNaBHit
1 .1 3 6
1 .2 5 4
1 .7 1 3
100 mM NaBHit; 0 .0 °C
ro

Reproduced
with perm
ission of the
copyright ow
ner. Further
reproduction prohibited
without
permission.
TABLE V ACID ACCELERATION OF THE HYDROLYSIS OF NaBHi* BY OXALIC ACID (cont'd )
MOLES HpCpOi* inn MULLS NaBlW x 1 0 0
1%2%4%
2.5 MIN % HYDROLYSIS
19.7%
24.8%
34.7%
5.0 MIN % HYDROLYSIS
21.5%
27.9%
38.0%
7.5 MIN % HYDROLYSIS
23.2%
30.2%
41.3%
10.0 MIN % HYDROLYSIS
24.7%
32.3%
44.3%
MOLES H2 C2 O1* 10QMOLES NaBHi*
1%
2%
4%
2.5 MINpNaBHi*
1.095
1.124
1.185
5.0 MINpNaBHi*
1.105
1.142
1.208
7.5 MINpNaBHi*
1.115
1.156
1.231
10.0 MINpNaBHi*
1.123
1.169
1.254
100 mM NaBH 35.0°C
ro00

29
2.0
xmoza.
□ HCIO,
0 1 0 20 30 40 50
M O L A R % A C C E L E R A T O R
( mmoles ACC \ i x ' 0 0mmoles Na 8 H 4 /
Figure 5 Acid Acceleration Of The Hydrolysis Of NaBHi, (2 .5 min)
Reproduced with permission of the copyright owner. Further reproduction prohibited without permission.

30
2.0
<rxmoZa.
o KHP □ HCIO,
0.1 M Na BH
0 10 20 30 40 50M O L A R % A C C E L E R A T O R
( mmoles ACC \---------------------------------] X 100mmoles Na BH
Figure 6 Acid Acceleration Of The Hydrolysis Of NaBHi, (5 .0 min)
Reproduced with permission of the copyright owner. Further reproduction prohibited without permission.

31
2.1
2.0
1.9
1.8
1.7
1.6
1.5
1.4
1.3 n HCIO,
1.20.1 M NoBH
21.7 °C 7.5 Min
> . l
1.00 1 0 20 30 4 0 50
M O L A R % A C C E L E R A T O R
/ mmoles AC C \
\ mmoles N a B H ^ / *
Figure 7 Acid Acceleration Of The Hydrolysis Of NaBH, '7.5 min)
Reproduced with permission of the copyright owner. Further reproduction prohibited without permission.

32
2 . 0 -
xCDoZQ.
o HCIO,
0.1 M Na BH
10.0 Min
0 1 0 20 30 40 50M O L A R % A C C E L E R A T O R
/ mmoles ACC \I --------------------------- J X 100\ mmoles Na BH 4 /
Figure 8 Acid Acceleration Of The Hydrolysis Of NaBH* (10.0 min)
Reproduced with permission of the copyright owner. Further reproduction prohibited without permission.

33
DISCUSSION AND INTERPRETATION OF DATA
The logarithm of unreacted sodium borohydride is lin e a rly
proportional to the molar amount o f acid in i t ia l l y present in solution
at constant reaction time. Monoprotic potassium acid phthallate and
perchloric acid y ie ld v ir tu a lly identical acid acceleration plots. On
a molar basis, d ip ro tic oxalic acid is a more e ffec tive hydrolytic
accelerator. Conversion o f molar accelerator concentrations into
proton equivalent concentrations normalizes (converges) a l l of the log
plots (a t constant tim e). Averaging the KHP, HClOi,, and H2C20i, pNaBH„
values (a t specific in i t ia l equivalent acid concentrations) generates
time dependent data for a general acid.
Independent measurements o f solution a lk a lin ity during the
hydrolyses exh ib it an in i t ia l rapid increase followed by a much slower
increase in pH. The pH data para lle l the pattern of sodium borohydride
hydrolysis versus time. pH and pNaBH* are related by a complex set of
e q u ilib r ia ; however, for s im p lic ity , the sum, pH + pNaBH„ = 10.7 - 0 .2 .
Within the range of experimentation (a t constant time and
temperature), acid acceleration can be described by the following
equation:
pNaBHi, = A + B(meq H+) , (9)
where A is the intercept and B is the slope. Parameters for A and B
are lis ted in Table V I. The data in Table VI describe the general acid
plots as a function of in i t ia l proton equivalents added and represent
only p artia l solutions to a least square f i t o f the data. The A and B
parameters lis te d do not account for the large change in pH and extent
of hydrolysis from time 0 to 2.5 minutes.
A dditionally , the time dependence o f the slope, pNaBHu/meq H+ , at
Reproduced with permission of the copyright owner. Further reproduction prohibited without permission.

34
constant temperature, can be described by a sim ilar set o f equations:
pNaBH„/meq H+ = C + D(time) (10)
A model for general acid acceleration (w ithin the experimental
parameters investigated), in non-buffered media, was generated by
combining the previous two equations (9 and 10):
pNaBHi = E + (F + G(time))meq H+ (11)
Expansion o f equation (11) y ie lds:
pNaBFU = E + F(meq H+) + G(meq H+)(tim e) (11a)
Linear regression o f the en tire general acid (21.7°C) data set (non
weighted) yields the following values:
E = 1.065 - 0.003
F = 2.26 ± 0.05 x 10_1
G = 1.18 t 0.06 x 10‘ a
Comparisons between average experimental values and least square f it te d
(LSF) calculated values are presented in Table V I I . Mathematical
manipulation of equation (11a) (an integrated rate law) gives:
-(NaBH.) = eE' + F' (lnei' H+) eG' (meq H+)(tim e) (n b )
(where (E1,F 'G ') = 2.303(E,F,G ))
Therefore, the time dependent portion o f the rate law has the general
form:
= k(BH„")meq H+ , (11c)
where the rate constant, k, and G' are logarithm ically re lated . A
suitable bimolecular mechanism (presented in the next section) has been
proposed by many previous authors. The unimolecular (time independent)
segment of the proposed rate law w ill be le f t unexplained. The
preceeding model mathematically quantifies the acid acceleration of the
Reproduced with permission of the copyright owner. Further reproduction prohibited without permission.

35
unbuffered hydrolysis of sodium borohydride in terms o f the re la tive
normal acid concentration and reaction time (21.7°C; time > 2.5 min).
Reproduced with permission of the copyright owner. Further reproduction prohibited without permission.

36
TABLE VI EQUATIONS DESCRIBING THE TIME DEPENDENT PLOTS FOR THE GENERAL
ACID ACCELERATED HYDROLYSIS OF NaBHu
TIME 0.0°C 21.7°C 35.0°C
2.5 A 1.017 1.058 1.064
MIN B 0.212(0) 0.257(6) 0.300(3)
5.0 A 1.019 1.064 1.074
MIN B 0.219(0) 0.287(6) 0.338(9)
7.5 A 1.019 1.067 1.077
MIN B 0.228(0) 0.317(7) 0.387(4)
10.0 A 1.022 1.071 1.081
MIN B 0.230(0) 0.338(5) 0.435(4)
100 mM NaBHu; Numbers in parentheses indicate the uncertainty in the
la s t d ig it . Uncertainties in the slopes (b terms) o f the time
dependent ( pNaBHu vs. meq H+) plots were computed from the non-weighted
least square calculations, (x = meq H+ ; y = pNaBHi*; y 1 = pNaBHi^calc);
Sy = C£(y' - y )2/n ) * 5; %E = avg. re la tiv e % unc. in the pNaBHi* values)
Uncertainty in slope = AB = (S /range in x) + (%E)(B)
In general, S^/range in x > > (%E)(B),
Reproduced with permission of the copyright owner. Further reproduction prohibited without permission.

37
TABLE V II GENERAL ACID ACCELERATION OF THE HYDROLYSIS OF NaBHu
(REACTION TIME = 2.5 MIN)
pNaBH* pNaBHi, % HYDROLYSIS % HYDR0LYSmeq H (expt) (calc) (expt) (calc)
0.00 1.060 1.065 12.9% 13.9%
0.05 1.073 1.078 15.5% 16.4%
0.10 1.087 1.091 18.2% 18.8%
0.15 1.098 1.103 20.2% 21.2%
0.20 1.112 1.116 22.8% 23.5%
0.25 1.121 1.128 24.3% 25.7%
0.30 1.146 1.142 28.5% 27.8%
0.40 1.172 1.167 32.7% 32.0%
0.50 1.187 1.193 35.0% 35.8%
1.00 1.311 1.320 51.1% 52.2%
1.50 1.415 1.448 61.5% 64.3%
2.00 1.559 1.576 72.4% 73.4%
2.50 1.675 1.703 78.9% 80.2%
3.00 1.872 1.831 86.6% 85.2%
100 mM NaBH*; 21.7°C
Reproduced with permission of the copyright owner. Further reproduction prohibited without permission.

38
TABLE V II GENERAL ACID ACCELERATION OF THE HYDROLYSIS OF NaBHjcont'd)
(REACTION TIME = 5.0 MIN)
meq H+pNaBHu(expt)
pNaBHu(calc)
% HYDROLYSIS (expt)
% HY0R0LY! (calc!
0.00 1.063 1.065 13.6% 13.9%
0.05 1.080 1.079 16.9% 16.7%
0.10 1.096 1.094 19.9% 19.4%
0.15 1.108 1.108 22.0% 22.0%
0.20 1.125 1.122 25.0% 24.5%
0.25 1.134 1.136 26.6% 26.9%
0.30 1.151 1.150 30.9% 29.3%
0.40 1.188 1.179 35.2% 33.8%
0.50 1.208 1.208 38.1% 38.0%
1.00 1.345 1.350 54.8% 55.3%
1.50 1.460 1.492 65.4% 67.8%
2.00 1.620 1.635 76.0% 76.8%
2.50 1.762 1.777 82.7% 83.3%
3.00 1.964 1.919 89.2% 88.0%
100 mM NaBH„; 21.7°C
Reproduced with permission of the copyright owner. Further reproduction prohibited without permission.
39
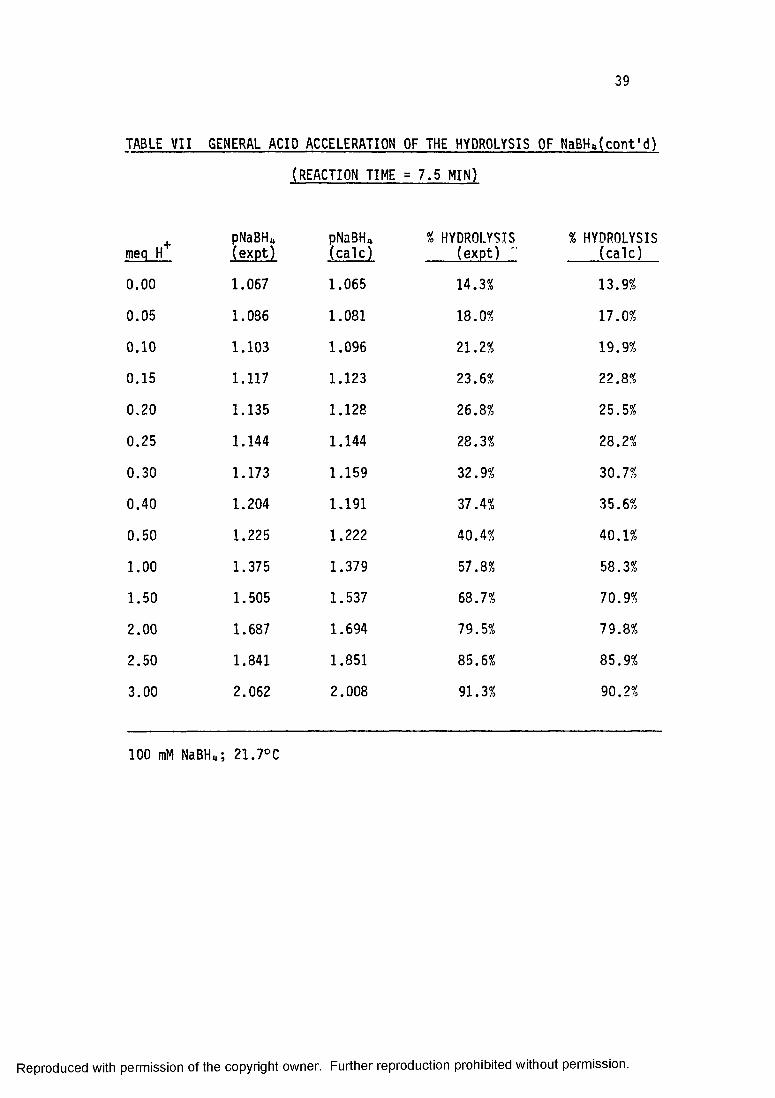
TABLE V II GENERAL ACID ACCELERATION OF THE HYDROLYSIS OF NaBH»(cont'd)
(REACTION TIME = 7 . 5 MIN)
meq H+pNaBHu(expt)
pNaBHi*(calc)
7 HYDROLYSIS (expt)
7 HYDR0LYS (calc)
0.00 1.067 1.065 14.37 13.97
0.05 1.086 1.081 18.07, 17.07
0.10 1.103 1.096 21.27, 19.97
0.15 1.117 1.123 23.67, 22.87
0.20 1.135 1.128 26.87, 25.57
0.25 1.144 1.144 28.37 28.27
0.30 1.173 1.159 32.97, 30.77
0.40 1.204 1.191 37.47, 35.67,
0.50 1.225 1.222 40.47, 40.17,
1.00 1.375 1.379 57.87, 58.37
1.50 1.505 1.537 68.77, 70.97
2.00 1.687 1.694 79.57, 79.87,
2.50 1.841 1.851 85.67, 85.97
3.00 2.062 2.008 91.37 90.27
100 mM NaBH„; 21.7°C
Reproduced with permission of the copyright owner. Further reproduction prohibited without permission.
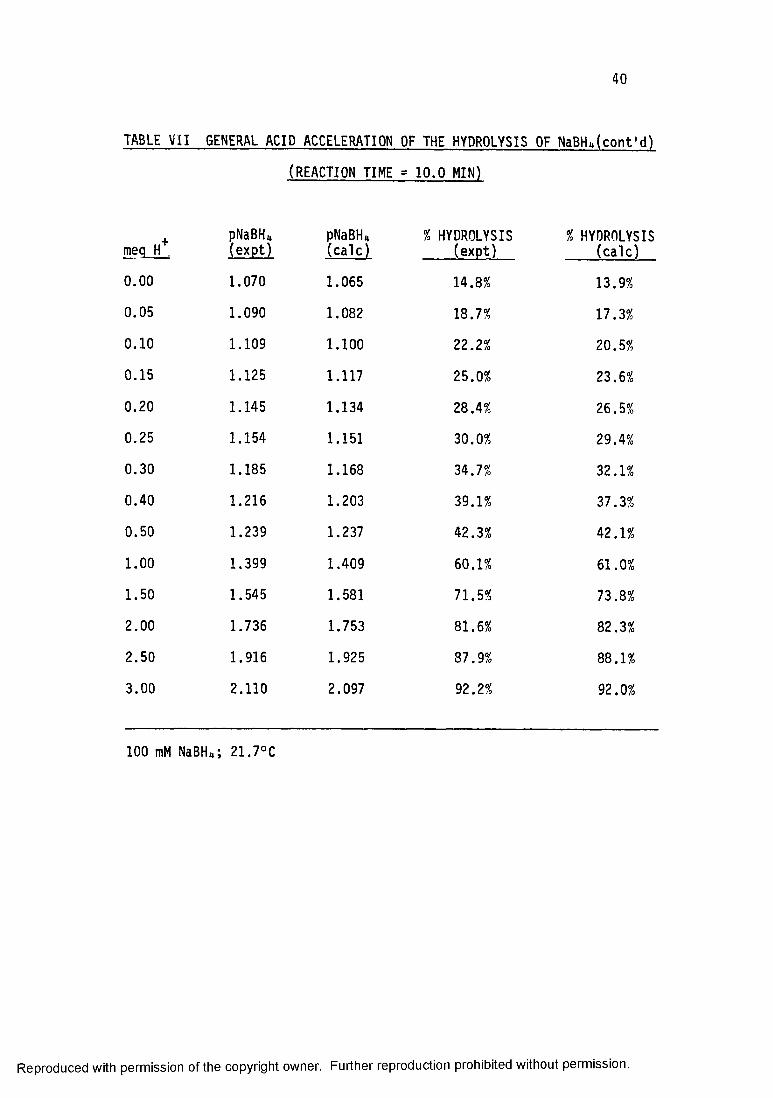
TABLE V II GENERAL ACID ACCELERATION OF THE HYDROLYSIS
(REACTION TIME = 10.0 MIN)
meq H*pNaBHu(expt)
pNaBH*(calc)
% HYDR0LYS (expt)
0.00 1.070 1.065 14.8%
0.05 1.090 1.082 18.7%
0.10 1.109 1.100 22.2%
0.15 1.125 1.117 25.0%
0.20 1.145 1.134 28.4%
0.25 1.154 1.151 30.0%
0.30 1.185 1.168 34.7%
0.40 1.216 1.203 39.1%
0.50 1.239 1.237 42.3%
1.00 1.399 1.409 60.1%
1.50 1.545 1.581 71.5%
2.00 1.736 1.753 81.6%
2.50 1.916 1.925 87.9%
3.00 2.110 2.097 92.2%
100 mM NaBH„; 21.7°C
40
NaBHu(cont'd)
% HYDROLYSIS (calc)
13.9%
17.3%
20.5%
23.6%
26.5%
29.4%
32.1%
37.3%
42.1%
61.0%
73.8%
82.3%
88 . 1%
92.0%
Reproduced with permission of the copyright owner. Further reproduction prohibited without permission.

41
SUMMARY OF KINETICS AND MECHANISM IN BUFFERED MEDIA BY PREVIOUS
AUTHORS
Kinetic and mechanistic studies of the hydrolysis of sodium
borohydride in buffered media comprise the bulk of investigations
by other researchers2 O”1*3. The reaction of NaBH4 with water is
characterized by general acid catalysis . Proposed rate laws are
of varying sophistication.
Rate = k[BH^], k dependent of pH (12)
Rate = kCBHT][H30+] (13)
Q u a lita tive ly , in buffered media, the rate constants for the
reaction of borohydride with strong acids are many orders of
magnitude greater than for the corresponding reaction with either
weak acids or water. Gardiner and Collat subsequently further
refined the kinetics by including the presence and reac tiv ity of an
interm ediate26. Instead of the iodimetric method of analysis used
by most researchers, Gardiner used polarography to distinguish the
individual hydrolytic steps. The proposed rate law was26:
k i 1 ko1BH ---------- * intermediate — =------> products (15)
Rate = 1 Q+ [BH^][H30+] + k ^ [BH^[HA]
+ kn Q [ bh^ [ h 2o] (14)
Rate = = k j' = 2 k lHA> [HAi J and (16)
Reproduced with permission of the copyright owner. Further reproduction prohibited without permission.

42
TABLE V I I I REPORTED RATED CONSTANTS (Rate = I k
HA REPORTED k m -iit*sec TEMP°C u
kH30+ 2.0 + 0.2 x 10⁵ 039 0.16
1.45 x 10⁵ 1528 0.10
5.7 + 0.2 x 10⁵ 151*0 ------
2.50 x 10⁵ 2528 0.10
1.00 + 0.04 x 10⁶ 2532 0.10
8 + 1 x 10⁵ 2539 0.16
1.0 x 10⁶ 2541 0.16
2.30 + 0.07 x iO6 2532 ------
1.6 x 10⁶ 2542 1.0
1.22 + 0.03 x 10⁶ 25^° ------
4.00 x 10⁵ 3528 0.10
2.62 + 0.05 x 10⁶ 25^° 0.10
HCOg 1.4 + 0.8 x io " 5 oa 0.31
6.3 + 0.3 x 10"5 22a 0.31
9 + 4 x io " 5 25 3 0.10
2.5 + 0.1 x 10_lt 35a 0.31
k +knhJ 1.5 + 0.4 x io “ 3 2539 0.16
2 x io ' 9 2532 0.10kH20
1.2 x io " 9 25^2 0.10
kH2P0" 1 + 4 x io " 2 251*3 0.10
2.3 + 0.2 x 10"^ 2539 0.16
kB(OH 3 2.0 + 0.3 x io " 3 2539 0.16
8 + 4 x 10% 2532 0.20
1 ± 5 x 1 0 k 2532 0.50
I = Iodiinetry P = Pol a
METHOD
I
P
ography a = CMK
Reproduced with permission of the copyright owner. Further reproduction prohibited without permission.

Reproduced
with perm
ission of the
copyright ow
ner. Further
reproduction prohibited
without
permission.
TABLE IX POLARGRAPHICALLY DETERMINED RATE CONSTANTS - GARDINER AND COLLAT25
kHA. 25°C, u = 0 .2 15°C, u ■= 0.5 25°C , u *= 0 .5 35°C, u = 0.5 25°C, U := 1.0kl _
HC03t.1.1 X 10"3 6 x 10 _1* 1.3 x 1 0 ‘ 3 2.6 x 10"3 1.4 x 10 "3
kl +nh£
l.5 X 1 0 8 x 10 ~5 2.9 x 1 0 1.1 x 10"3 2.4 x io " 1*
k i +h30+\m
7.2 X 10 5 3.3 x 10 5 6.0 x 10 5 1.1 x 10⁵ 4.9 x 1 0 5
klh2o 6 X IO -8 3 x IO -8 1 X 10 ~7 Negati ve 4 x io ’ 9
k2hco3 2.4 X IO " 1 1.3 x IO -1 2.2 x 10 _1 3.5 x 10⁻¹ 2.3 x io ' 1
k2 + NH* 8.7 X 10 " 2 1.6 x 10 " 2 4.7 x 10 "2 1.0 x 1 0 '1 4.1 x io ' 2
k2 + h30+
k2h2o
6 X 10 6 5 x 10 6 8 x 10 6 2.8 x 10⁷ 4 x 1 0 6
2 X 1 0 - 5 5 x 10 "6 8 x 1 0 - 6 Negati ve 4 x 1 0 - 5
-P*CO

44
TABLE X CALCULATED ARRHENIUS ACTIVATION ENERGIES
REACTION
BH + HCO3
bh; + nhJ
BH + H30+
Interm + HCO3
Interm + NH*
Interm + H 30+
a = Gardiner, b = CMK, c = Stockmayer, d = Pecsok, e = Freund
Reproduced with permission of the copyright owner. Further reproduction prohibited without permission.
E (kcal/mole)
13 + 3a
14 + l b
23 + 2a
20 c
11 + la 7 .7C
9 + l a
16 + 4a
12 + 8a

45
d [intermediat ed _ k , j-gg-j _ [interm ediate] q 7
where k2' = ? CHAT3
Table IX is a compilation of the extensive polargraphic kinetic
data collected by Gardiner and Coll a t . A collection of activation
energies are presented in Table X. Ea for strong acids is less by
approximately a factor of 2 compared to weak acids.
The mechanism consistent with the k inetic data and isolated
intermediates by previous researchers can be characterized as
follows:
1) Slow formation of an acid coordinated borohydride species
[Interm ediate] t H3B0H2 B(0H)3 + 3H2 (19)
bh; + h 3o+\
( 18)
H H
2) Loss of a hydrogen molecule followed by the rapid
hydrolysis of the aquated borane.
Overall reaction of acid accelerated hydrolysis:
BHlj + H30 + + 2H20 > B(0H)3 + 4H2 + (20)
Reproduced with permission of the copyright owner. Further reproduction prohibited without permission.

CHAPTER I I I TRANSITION METAL SALT EFFECTS
46
Reproduced with permission of the copyright owner. Further reproduction prohibited without permission.

47
INTRODUCTION
Acid acceleration comprised the majority of the research on
the hydrolytic reaction of NaBH by H. I . Schlesinger and
H. C. Brown. The reac tiv ity of sodium borohydride and water was
increased with some of the more common catalytic agents, including:
colloidal platinum, platinized asbestos, platinum oxidation
catalysts, copper-chromic oxide, activated charcoal, and Raney
n ic k e l11. A search for more practical catalysts led to
investigations of some f i r s t row transition metal chlorides.
Borohydride pellets containing the divalent chloride salts of
manganese, iron, cobalt, nickel, and copper reacted quickly with
water to produce hydrogen and dark suspensions or precipitates.
Some of these precipitates, which were postulated to be metal
borides (M2B), also demonstrated cata lytic a c t iv ity . Schlesinger
and Brown proposed that the metal chlorides were the precursors to
the actual catalysts, the black metal boride precipitates11.
Schlesinger's results are presented in Table XI.
EXPERIMENTAL
The discrepancy between the catalytic ac t iv ity of the black
precipitates and the metal chlorides was le f t unexplained by
Schlesinger and Brown. An investigation of various transition
metal salts as hydrolytic accelerators provided the missing
i nformation.
Reproduced with permission of the copyright owner. Further reproduction prohibited without permission.

48
TABLE XI SCHLESINGER'S TRANSITION METAL CHLORIDE ACCELERATORS11
% HYDROGEN LIBERATED
ACCELERATOR 5 MIN 10 MIN 15 MIN
MnCl2 Slower than CuCl2
FeCl2 38% 53% 65%
CoCl2 46% 97% —
Ni Cl 2 42% 74% 99%
CuCl2 32% 43% 49%
g of MCI2 per g of NaBH ; In i t ia l temp. = 25°C
Using the same general procedure as employed with the acidic
accelerators, solutions of known concentration of the metal salts,
MX2 (M = Cu2+, Co2+, Ni2+; X = Cl", NO3, OAc"), were prepared. All
reactions were performed under ambient conditions; solution pH was
allowed to vary. For a given metal, the extent of increased
hydrolytic reactiv ity was independent of counter ion. Accelerator
effectiveness was determined on a molar rather than on a weight
basis. Experimental results are summarized in Tables X II - XIV and
Figures 9 - 11.
Reproduced with permission of the copyright owner. Further reproduction prohibited without permission.

Reproduced
with perm
ission of the
copyright ow
ner. Further
reproduction prohibited
without
permission.
TABLE X II ACCELERATION OF THE HYDROLYSIS OF SODIUM BOROHYDRIDE BY DIVALENT COPPER SALTS
MOLES CuX2 MOLES NaSfr* x 100
2.5 MIN % HYDROLYSIS
5.0 MIN % HYDROLYSIS
7.5 MIN % HYDROLYSIS
10.0 MIN % HYDROLYS]
0% 12.9% 13.6% 14.3% 14.8%
1% 16.2% 17.9% 19.5% 20.5%
2% 20.7% 23.7% 25.4% 27.0%
3% 24.8% 28.4% 31.0% 33.3%
4% 29.1% 32.7% 34.8% 36.9%
MOLES CuX9x 100
2 .5 MIN 5.0 MIN 7.5 MIN 10.0 MINMOLES NaBHt* pNaBHu pNaBHu pNaBHu oNaBHu
0% 1.060 1.063 1.067 1.070
1% 1.077 1.085 1.094 1.100
2% 1.101 1.118 1.127 1.137
3% 1.124 1.145 1.161 1.176
4% 1.149 1.172 1.186 1.200
100 mM NaBH^; 21 .6°C
Reproduced
with perm
ission of the
copyright ow
ner. Further
reproduction prohibited
without
permission.
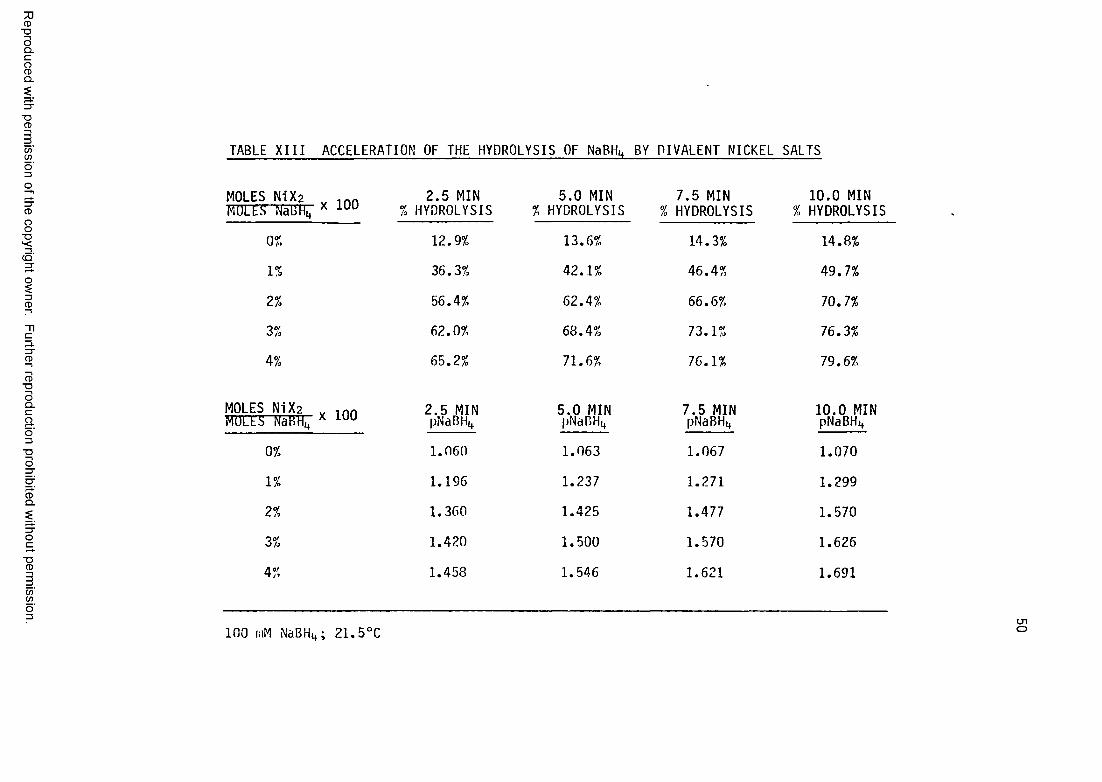
TABLE X I I I ACCELERATION OF THE HYDROLYSIS OF NaBHu BY DIVALENT NICKEL SALTS
MOLES NiX2 MOLESnfatJHi, x 100
or.1%
2%3%
4%
2.5 MIN% HYDROLYSIS
12.9%
36.3%
56.4%
62.0%
65.2%
5.0 MIN% HYDROLYSIS
13.6%
42.1%
62.4%
68.4%
71.6%
7.5 MIN % HYDROLYSIS
14.3%
46.4%
66.6%73.1%
76.1%
10.0 MIN % HYDROLYSIS
14.8%
49.7%
70.7%
76.3%
79.6%
MOLES NiXa .. inn MOLE'S TfaBH; x 100
0%1%
2%3%
4%
2.5 MINpNaBHt,
1.060
1.196
1.360
1.420
1.458
5.0 MINpNaBHi*
1.063
1.237
1.425
1.500
1.546
7.5 MINpNaBHit
1.067
1.271
1.477
1.570
1.621
10.0 MINpNaBHtf
1.070
1.299
1.570
1.626
1.691
100 (iiM NaBHi*; 21 .5°Ccno

Reproduced with
permission
of the copyright owner.
Further reproduction prohibited
without permission.
TABLE XIV ACCELERATION OF THE HYDROLYSIS OF NaBHu BY DIVALENT COBALT SALTS
MOLES CjLfe . . . x 1Q0MOLES NaBH
0%
1%2%3%
4%
2.5 MIN % HYDROLYSIS
12.9%
16.5%
22. 8%
27.5%
31.2%
5.0 MIN % HYDROLYSIS
13.6%
18.4%
26.5%
33.6%
38.8%
7.5 MIN % HYDROLYSIS
14.3%
20. 2%
30.2%
39.6%
48.7%
10.0 MIN % HYDROLYSIS
14.8%
21.7%
34.0%
45.6%
57.7%
MOLES CoX2 x 100
0%1%
2%
3%
4%
2.5 MIN pNaBH n
1.060
1.078
1.112
1.140
1.163
5.0 MINpNaBH
1.063
1.088
1.134
1.178
1.213
7.5 MINpNaBHit
1.067
1.098
1.156
1.218
1.290
10.0 MIN pNaBHit
1.070
1.106
1.180
1.264
1.374
100 mM NaBHu ; 2 I.6 °C
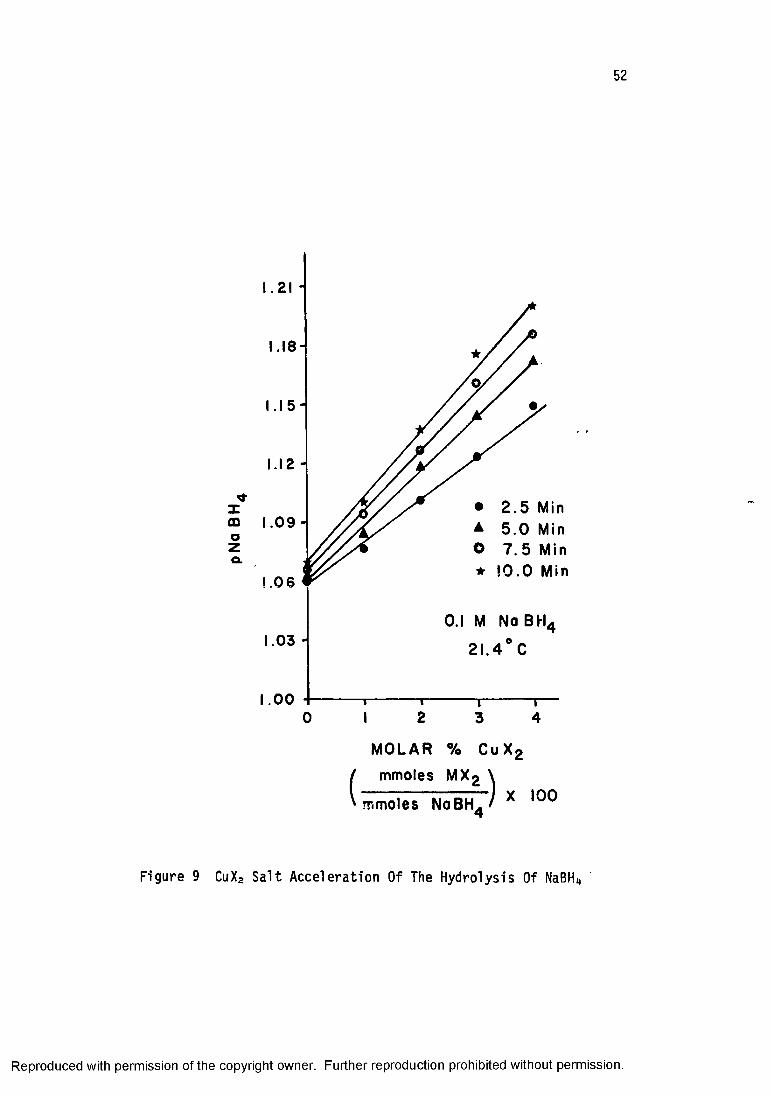
52
1.18-
XCD 1 . 0 9 - oza ,
.0 6
.03 -
1 .0 020 43
MOLAR % C u X 2
( mmoles M X 2 \
mmoles NaBH. / X 100 4
Figure 9 CuX2 Salt Acceleration Of The Hydrolysis Of NaBHi,
Reproduced with permission of the copyright owner. Further reproduction prohibited without permission.

53
.7
.6
.5
1.4
.3
. 2
I .1
1.00 2 3 4
M O LAR % Ni X 2
mmoles Ni X 2 \ i — ) x 100mmoles N o B H . /4
Figure 10 NiX2 Salt Acceleration Of The Hydrolysis Of NaBH«
Reproduced with permission of the copyright owner. Further reproduction prohibited without permission.

54
Figure 1
. 4 0 '
.30 -
xmozQ.
.05 -
1.000 2 3 4
MOLAR % Co Xg
f mmoles Co X2
k mmoles No BH^
CoX2 Salt Acceleration Of The Hydrolysis Of
X 100
NaBHu
Reproduced with permission of the copyright owner. Further reproduction prohibited without permission.

10 M in .
t -------------- 1------------r-2 3 4
MOLAR % ACCELERATOR
mmoles M X 2
mmoles NaBH - ) 4 'X 1 0 0
Figure 12 Comparison Of MXa Acceleration
Reproduced with permission of the copyright owner. Further reproduction prohibited without permission.

56
DISCUSSION AND INTERPRETATION OF DATA
Q u a lita tive ly , at identical metal sa lt concentrations, nickel
is the most e ffec tive accelerator of the hydrolysis of sodium
borohydride. Divalent copper and cobalt salts influence the
hydrolytic reaction by approximately the same magnitude. On a
molar basis of comparison, trans ition metal salts demonstrate
greater hydrolytic accelerative capacity than monoprotic acids.
Unfortunately, a corresponding consistency in the metal salt data
is not immediately apparent. Plots of the log of the unreacted
concentration of sodium borohydride versus the molar amount of
metal sa lt added demonstrate the extreme divergence of the three
metals (Figure 12).
1) Copper salts appear to behave lik e acid accelerators and
exhib it a linear dependence between pNaBH and copper sa lt
concentration (zero deviation).
2) The hydrolytic rate in i t ia l ly increases quite rapidly but
then levels o ff with increasing nickel sa lt concentration
(negative dev iation).
3) Increases in re la tiv e cobalt sa lt concentration cause an
accelerated increase in the hydrolytic rate (positive
d ev ia tio n ).
Consideration of the following reaction helps to explain the
d is s im ila r itie s in the re a c tiv it ie s of metal salts as hydrolytic
accelerators:
NaBHt, + 4MX2 + 3H20 -> Na+ + B(0H) 3 + 8X~ + 4M° + 7H* (21)
Reproduced with permission of the copyright owner. Further reproduction prohibited without permission.

57
One mole of a divalent copper, n ickel, or cobalt sa lt is reduced in
borohydride solutions to yie ld one mole of metal atoms and 1.75
moles of protons. Therefore, the effects of metal salts may
conceivably be characterized by a bifunctional mode of a c tiv ity :
1) Acid acceleration by protons produced i n s itu
2) Surface catalysis by fin e ly divided, probably colloidal
metal.
Despite an immediate observed increase in solution ac id ity ,
proposed reaction (21) was d if f ic u lt to quantify by pH or
t it r im e tr ic methods due to the following associated problems:
1) The metal sa lt reduction (formation of black precipitate)
is not instantaneous; the reaction time decreases with
increasing metal sa lt concentration.
2) Existence of competing e q u ilib ria .
a) Metal sa lt reduction (21) -> pH decreases
b) Acid hydrolysis from protons produced by reaction (21)
-v pH increases
c) Acid hydrolysis from slight acid ity of MX2 solution
pH increases
d) Surface catalyzed hydrolysis ->■ pH increases
e) Uncatalyzed hydrolysis -*• pH increases
The proposed metal sa lt reduction was eventually verified by a
combination of the in it ia l decrease in pH and a classical
gravimetric analysis of the black precip ita te .
Reproduced with permission of the copyright owner. Further reproduction prohibited without permission.

58
Determination of the Composition of the Black Precipitate
50 ml of a 0.196M (9.82 millim oles) solution of nickel chloride
hexahydrate 93.0 mg (2.45 millim oles) sample of sodium borohydride.
The black product was immediately f ilte re d o ff through a previously
weighed Gooch f i l t e r crucible; the decantate was saved. The black
material was repeatedly washed with hot water and subsequently
dried at 110°C until a constant weight was obtained.
The black residue was then dissolved in warm 6M hydrochloric
acid and diluted to 100 ml. 25 ml of a 1% ethanolic solution of
dirnethylglyoxime (DMG), 5 ml of 6M hydrochloric acid, and d ilu te
anmonium hydroxide were added to a 50 ml aliquot of the dissolved
product. The resulting red prec ip ita te , bis(dimethylglyoximato)
n ic k e l( I I ) (Ni(DMG)2 ), was washed with hot water and subsequently
dried at 110°C to obtain a constant weight.
The green f i l t r a t e (decantate from the in it ia l reaction) was
diluted to 500 ml. A 50 ml aliquot was analyzed using the same DMG
procedure. The amount of nickel in the f i l t r a t e and in the black
residue were calculated from the re la tive weights of the DMG
precip ita tes1 . A schematic of the procedure is summarized in
Figure 13.
The sum of f i l t r a t e (unreacted) nickel and precipitated
(reacted) nickel should add up to the original amount of nickel
present in solution (576.5 mg).
Reproduced with permission of the copyright owner. Further reproduction prohibited without permission.

59
Ni Cl 2(9.82 mmoles, 576.5 mg Ni)
<5Ni>+
( green)
NaBHi*(93.0 mg, 2.46 mmoles)
Unreacted Ni Reacted Ni
*f
Black ppt (126.8 mg)
D ilute to 500 ml
Take 50 ml aliquot
O
Ni( OMG) 2 (218.5 mg) (red)
Dissolve in HC1
Dilute to 100 ml
Take 50 ml aliquot 0
HC1, DMG, NH^OH.A HC1, DMG, NH OH, A
N i( DMG)2 (310.3 mg) (red)
20.32% Ni
in Ni (DMG)2
44.0 mg Ni in 50 ml
v444.0 mg Ni in 500 ml
63.05 mg Ni in 50 ml
126.1 mg Ni in 100 ml
Figure 13 Determination of the Composition of the Black Precipitate
Reproduced with permission of the copyright owner. Further reproduction prohibited without permission.

60
F ilt ra te Ni + Ppt Ni = 440.0 mg + 126.1 mg = 570.1 mg
Experimental Ni 1QQ = 570.1 mg inn _ qqo.Theoretical Ni x iUU 576.5 mg x 1UU "
By means of a mass balance experiment, a l l of the nickel chloride
o rig in a lly present was accounted fo r as e ither unreacted or
precip itated as the metal. Furthermore, the weight of the black
residue (126.8 mg) was v ir tu a lly identical to the amount of nickel
in the precipitated bis(dimethylglyoximato) n ic k e l( I I ) complex
(126.1 mg). S im ilar gravimetric determinations of the cobalt
derivative with a nitroso — $-napthol yielded equivalent
conclusions. Borohydride reduction of metal salts produces black
suspensions of fin e ly divided atomic metal.
Metal Borides Versus Atomic Metal
Nickel and cobalt borides, based on the synthetic technique of
of Schlesinger and Brown, have been u tiliz e d as c a ta ly tic agents.
S p ec ifica lly , these metal borides have approximately the same
re a c tiv ity as Raney nickel towards the following types of
reactions:
1) General hydrogenation reactions1*5
2) Reforming isomerizations46
3) Desulphurization of d ith ioacetals and thiophens in the
synthesis of triterpene 2-enes47
4) Methanation of carbon monoxide1*8
5) Decomposition of formats1*6
6) Oxidation of methanol49.
Reproduced with permission of the copyright owner. Further reproduction prohibited without permission.

Reproduced
with perm
ission of the
copyright ow
ner. Further
reproduction prohibited
without
permission.
TABLE XV METAL BORIDE PREPARATIONS AND COMPOSITIONS
SALT THERMAL TREATMENT WASH SOLUTION ANALYSIS
NiCl2 None 25 °C h2o50 Amorphous
None None 11 Ni2B Amorphous
None EtOH51 Ni2 B + B2 03
250°C a 25°C h2o51 Ni b , Ni3 BC
500°C 3 25 °C h2o50 w b . Ni3 BC
750°C 3 25 °C h2o50 m b . Ni3 BC
None 3 90 °C h2o50 N1b , Amorphous
250°C 3 90 °C h2o50 Nfb , Ni3 BC
Ni (0Ac )2 None 25 °C h2o 50 Amorphous
100°C a 25 °C h2o 50 Amorphous
200°C 3 25 °C h2o 50 Amorphous
260°C 3 25°C h2o 50 Nib , n i3 bc
350°C 3 25°C h2o 50 Nib , n i3 bc

Reproduced
with perm
ission of the
copyright ow
ner. Further
reproduction prohibited
without
permission.
TABLE XV METAL BORIDE PREPARATIONS AND COMPOSITIONS Ico n t'd )
SALT THERMAL TREATMENT WASH :SOLUTION ANALYSIS
Ni ( 0 Ac)2 None 25°C EtOH 5 2 Ni2 B Amorphous
250°Cd 25°C EtOH 4 6 Ni2 B Amorphous
Ni(NO )' 3 2
300°C 25 °C EtOH Ni2 B, Ni
N iX 2 None 25°C EtOH 53 (Ni2 B)2- H3 Amorphous
CoX2
None 25 °C EtOH 53 (Co2 B)5-H 3 Amorphous
Co(N0 3 ) 2 300 °C 25 °C EtOH 4 8 Co2 B, Co
C0 Cl2 None None11 Ni 2B Amorphous
a - 18 hours .under helium stream at indicated temperature
b - Face centered cubic nickel (0
c - Isomorphous with cementite (D2 ^)
d - D irect heat
e - Liberates H2 over 100°Ccr»no

63
Investigations aimed at the structure elucidation of these metal
borides yielded contradictory data (Table XV). The analyses of
these metal-boron alloys range from to ta l ly amorphous to highly
defined crystal structures dependent on the mode of preparation.
The various research efforts have two major characteristics in
common:
1) High temperature treatment and/or
2) Washing the precipitate with either cold water or ethanol.
Furthermore, gravimetric analysis (prior to thermal treatment) of
these prepared precipitates accounted for only approximately eighty
percent of sample weight. Washing these amorphous substances with
cold water or ethanol fa i ls to remove borate ions (or boric acid)
adsorbed onto the surface of the metal. Subsequent heating at
temperatures as high as 750°C apparently yields some boron-metal
alloy . Determinations of the products of borohydride reduction of
cobalt and nickel salts under milder thermal treatment and washing
with hot water agree with the hypothetical formation of only the
metal. In fairness and deference to previous researchers,
incorporation of boron into the metal la t t ic e was their primary
objective. Boron impurities enhance the cata lytic ac tiv ity and
decrease the sintering aspects of the pure metals. Description of
these compounds as metal borides was unfortunate. Borides are
generally prepared by the combination of the elements under
refractory conditions and are unstable in acidic or aqueous media.
Reproduced with permission of the copyright owner. Further reproduction prohibited without permission.

64
Additional evidence supports the borohydride reduction of nickel
and cobalt salts to the atomic metals:
1) Sodium borohydride reduces platinum, palladium, gold,
s i lv e r , mercury, and bismuth salts to the metallic
state 5 4 > 55
2) Calculations based on standard electrode potentials (Table
XVI) y ie ld equilbrium constant values for the proposed
metal salt reduction of high orders of magnitude: 10130
for cobalt and nickel and 1 0 2 0 0 for copper.
TABLE XVI STANDARD REDUCTION POTENTIALS56
Half Reaction E°
Cu2+ + 2e -* Cu° +0.337V
Ni2+ + 2e Ni° -0.250v
Co2+ + 2e + Co0 -0.277v
B(0H)‘ + 4H„0 + 8 e“ ■+ BH," + 80H' -1.240v
For the 8 e_ transfer reaction:
4MX2 + BH" + 3H20 + B(0H) 3 + 8 X" + 4M° + 7H+
METAL ION E° Keq
Cu2+ +1.577v 10 213
N i2+ +0.990v 1QUk
Co2+ -K).963v io 1 3 0
zFE° = 2.303 RT log Keq at STP
Reproduced with permission of the copyright owner. Further reproduction prohibited without permission.

65
Proof that the black precipitate formed in s i tu is atomic
metal s t i l l f a i ls to explain the divergent reactiv ity patterns of
the respective metal salts. Comparison of copper salt acceleration
with the calculated acceleration due to the qua lita tive proton
production from metal salt reduction i l lustra tes the negligible
surface catalysis by copper metal (Table XV II) .
TABLE XVII CuX2 AS AN ACID ACCELERATOR
MOLES CuX2 „ inn QUANTITATIVE pNaBH pNaBH4
MOLES NaBHltX 1 0 0 H+ PRODUCTION (expt) (calc)
1 % 0.0875 meq 1.082 1.088
2 % 0.1750 meq 1.104 1.109
%) />> 0.2625 meq 1.127 1.132
A c t 0.3500 meq 1.149 1.155
100 mM NaBH ; 21.6°C; Reaction time = 2.5 MIN.
Conversely, nickel and cobalt salts exhibit d iffer ing degrees
of an additive effect of acid acceleration and rnetal surface
catalysis. The contribution of nickel and cobalt catalysis can be
calculated by subtracting the theoretical effect of acid
acceleration.
"Hydrolysis (M) = % Hydrolysis (MX2) = 1> Hydrolysis (H+ ) (22)
Reproduced with permission of the copyright owner. Further reproduction prohibited without permission.

66
Plots of unreacted molar borohydride concentration due to metal
catalysis versus time (zero order kinetics) should y ie ld a
straight l in e . The extent of hydrolysis due solely to acid
acceleration can be computed using the uncatalyzed path as a base
line (at specific time). Values are obtained from equation 9.
Unreacted [Bl-Quncat - Unreacted [BI-QH+ = a[BHIJ]h+ (23)
Treatment of data in this manner corresponds to the graphical
subtraction of two curves ([BH^] v s . time). This quantity
(a[BH;]h+) is added to the experimentally measured unreacted
borohydride concentration due to the presence of the metal sa lt .
The sum of these two terms equals the concentration of unreacted
borohydride due solely to metal catalysis.
Unreacted + a[BH^]h+ = Unreacted [BH^]^
Calculated metal catalysis data are l is ted in Tables XVIII and XIX.
Comparisons between experimental MX2 acceleration values and a
least square model (presented in the chapter conclusion) are also
summarized.
Reproduced with permission of the copyright owner. Further reproduction prohibited without permission.

Reproduced
with perm
ission of the
copyright ow
ner. Further
reproduction prohibited
without
permission.
TABLE XV III EFFECT OF COBALT METAL CATALYSIS ON THE HYDROLYSIS OF NaBHu
TIMECoX2
(expt)H
(calc)
[BH„"]Co
(calc)
Co% HYDROLYSIS
(ca lc)
2.5 min 83.5 mM 4.4 mM 87.9 mM 1 2 . 1 %
5.0 min 81.6 mM 4.7 mM 86.4 mM 13.6%
7.5 min 79.9 mM 5.3 mM 85.1 mM 14.9%
1 0 . 0 min 78.3 mM 5.6 mM 83.9 mM 16.1%
Slope F i t Of Co Catalysis: [BH«~] = 0.0891 - (5 .3 x 1 0 'u)time MOLES Co MOLES NaBHu x 1 0 0 = 1 %
TIME
[3H„"]CoX2
(expt)
[BH„']CoX2
(calc)
CoX2 % HYDROLYSIS
(expt)
CoX2 % HYDROLYSIS
(ca lc)
2.5 min 83.5 mM 83.1 mM 16.5% 16.9%
5.0 min 81.6 mM 80.9 mM 18.4% 19.1%
7.5 min 79.9 mM 78.6 mM 2 0 . 2 % 21.4%
LO.O min 78.3 mM 76.3 mM 21.7% 23.7%
100 mM NaBH„; 21.6°C
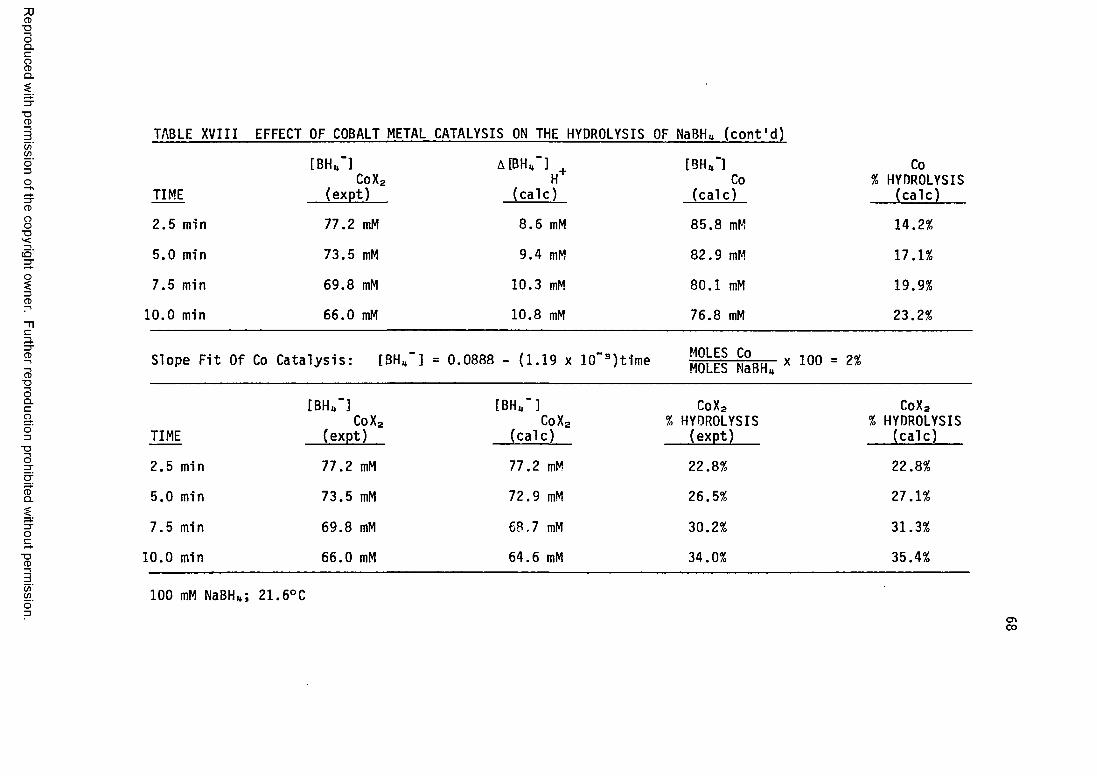
Reproduced
with perm
ission of the
copyright ow
ner. Further
reproduction prohibited
without
permission.
TABLE XVIII EFFECT OF COBALT METAL CATALYSIS ON THE HYDROLYSIS OF NaBHu (cont'd)
TIME
[BHu' lCoX2
(expt)
A [BHU~] . H
(calc)
[BH„"1Co
(calc)
Co% HYDROLYSIS
(calc)
2.5 min 77.2 mM 8 . 6 mM 85.8 mM 14.2%
5.0 min 73.5 mM 9.4 mM 82.9 mM 17.1%
7.5 min 69.8 mM 10.3 mM 80.1 mM 19.9%
1 0 . 0 min 66.0 mM 10.8 mM 76.8 mM 23.2%
Slope F it Of Co Catalysis: [BH,,"] = 0.0888 - (1 .19 x 10"9)time MOLES Co j Q MOLES NaBH« x 1UU = 2 %
TIME
[BH„~]CoX2
(expt)
[BH„~ ]CoX2 %
(calc)
CoX2
HYDROLYSIS(expt)
CoX2 % HYDROLYSIS
(calc)
2.5 min 77.2 mM 77.2 mM 22.8% 2 2 . 8 %
5.0 min 73.5 mM 72.9 mM 26.5% 27.1%
7.5 min 69.8 mM 68.7 mM 30.2% 31.3%
1 0 . 0 min 66.0 mM 64.6 mM 34.0% 35.4%
100 mM NaBHu; 21.6°CC00

Reproduced
with perm
ission of the
copyright ow
ner. Further
reproduction prohibited
without
permission.
TABLE XVIII EFFECT OF COBALT CATALYSIS ON THE HYDROLYSIS OF NaBHu (cont'd)
TIME
[B H /]CoX2
(expt)
A[BH„~] . H
(calc)
[B H /]Co
(calc)
Co% HYDROLYSIS
(calc)
2.5 min 72.5 mM 12.6 mM 85.1 mM 14.9%
5.0 min 6 6 . 6 mM 13.7 mM 80.2 mM 19.8%
7.5 min 60.4 mM 15.0 mM 75.4 mM 24.6%
1 0 . 0 min 54.4 mM 15.7 mM 70.1 mM 29.9%
Slope F it Of Co Catalysis: [ BHU” ] = 0.0902 - (2 .00 x 10"3)time MOLES Co MOLES NaBHu x 100 = 3%
TIME
[ B H / ]CoX2
(expt)
[ B H / ]CoX2
(calc)
CoX2 % HYDROLYSIS
(expt)
CoX2 % HYDROLYSIS
(calc)
2.5 min 72.5 mM 71.9 mM 27.5% 28.1%
5.0 min 6 6 . 6 mM 65.8 mM 33.4% 34.2%
7.5 min 60.4 mM 59.9 mM 39.6% 40.1%
1 0 . 0 min 54.4 mM 54.2 mM 45.6% 45.8%
100 mM NaBHu; 21.6°C

Reproduced
with perm
ission of the
copyright ow
ner. Further
reproduction prohibited
without
permission.
TABLE XV III EFFECT OF COBALT METAL CATALYSIS ON THE HYDROLYSIS OF NaBH* (cont'd)
TIME
[BH*']CoXa
(expt)
A [BHi*— ]‘ H
(ca lc )
[BH*- ]Co
(calc)
Co% HYDROLYSIS
(calc)
2.5 min 6 8 . 8 mM 16.4 mM 85.1 mM 14.9%
5.0 min 61.2 mM 17.8 mM 79.0 mM 2 1 . 0 %
7.5 min 51.3 mM 19.3 mM 70.6 mM 29.4%
1 0 . 0 min 42.3 mM 20.2 mM 62.5 mM 37.5%
Slope F it Of Co Catalysis: [BH„- ] = 0.0934 - (3.05 x 10~3)time MOLES. Co. , . 1 Q 0 MOLES NaBH* * AUU = 4%
TIME
[BH*']CoX2
(expt)
[BH*- ]CoX2 %
(calc)
CoXaHYDROLYSIS
(expt)
CoXa% HYDROLYSIS
(ca lc )
2.5 min 6 8 . 8 mM 6 6 . 6 mM 31.2% 33.4%
5.0 min 61.2 mM 58.9 mM 38.8% 41.1%
7.5 min 51.3 mM 51.6 mM 48.7% 48.4%
1 0 . 0 min 42.3 mM 44.6 mM 57.7% 55.4%
100 mM NaBHu; 21.6°Co

Reproduced
with perm
ission of the
copyright ow
ner. Further
reproduction prohibited
without
permission.
TABLE XIX EFFECT OF NICKEL METAL CATALYSIS ON THE HYDROLYSIS OF NaBH*
TIME
[BH*"]NiX2
(expt)
A[BH„"] . H
(calc)
[BHu~]Ni
(ca lc )
Ni% HYDROLYSIS
(calc)
2.5 min 64.0 mM 4.4 mM 68.4 mM 31.1%
5.0 min 57.9 mM 4.8 mM 62.7 mM 37.3%
7.5 min 53.6 mM 5.3 mM 58.9 mM 41.1%
1 0 . 0 min 50.3 mM 5.6 mM 55.9 mM 44.1%
Slope F it Of Ni Catalysis: [BHU~ ] = 0.0718 - (1 .7 x 10"3)time MOLES Ni x = MOLES NaBHu 1 %
TIME
[ BHi*~]NiXa
(expt)
[BH*"]NiXa
(calc)
NiXa % HYDROLYSIS
(expt)
NiXa % HYDROLYSIS
(calc)
2.5 min 64.0 mM 56.8 mM 36.0% 43.2%
5.0 min 57.9 mM 54.0 mM 42.1% 46.0%
7.5 min 53.6 mM 51.2 mM 46.4% 48.8%
1 0 . 0 min 50.3 mM 48.4 mM 49.7% 51.6%
100 mM NaBH«; 21.5°C

Reproduced
with perm
ission of the
copyright ow
ner. Further
reproduction prohibited
without
permission.
TABLE XIX EFFECT OF NICKEL METAL CATALYSIS ON THE HYDROLYSIS OF N a B H u (cont'd)
TIME
[BH*"]NiX2
(expt)
A[BHu~] . H
(calc)
[BH*’ ]Ni
(calc)
Ni% HYDROLYSIS
(calc)
2.5 min 43.6 mM 8 . 6 mM 52.2 mM 47.8%
5.0 min 37.6 mM 9.4 mM 47.0 mM 53.0%
7.5 min 33.3 mM 10.3 mM 43.6 mM 56.4%
1 0 . 0 min 29.3 mM 10.8 mM 40.1 mM 59.9%
Slope F it Of Ni Catalysis: [3HU"] = 0.0557 - (1 .59 x 10"3)time MOLES Ni MOLES NaBH* x 1 0 0 = 2 %
TIME
[ B H u ‘lNiXg
(expt)
[BH*"]Ni X 2
(calc)
NiXa % HYDROLYSIS
(expt)
N i X a% HYDROLYSIS
(ca lc)
2.5 min 43.6 mM 51.6 mM 56.4% 48.4%
5.0 min 37.6 mM 46.2 mM 62.4% 53.8%
7.5 min 33.3 mM 41.0 mM 66.7% 59.0%
1 0 . 0 min 29.3 mM 35.9 mM 70.7% 64.1%
1 00 m M N a B H u ; 2 1 . 5 ° C
ro

Reproduced
with perm
ission of the
copyright ow
ner. Further
reproduction prohibited
without
permission.
TABLE XIX EFFECT OF NICKEL METAL CATALYSIS ON THE HYDROLYSIS OF NaBH* (cont'd)
TIME
[BH*"]NiXa
(expt)
A [ B H u ~ ] .
H(calc)
[BH*"]Ni
(ca lc)
Ni% HYDROLYSIS
(calc)
2.5 min 38.0 mM 12.6 mM 50.6 mM 49.4%
5.0 min 31.6 mM 13.7 mM 45.4 mM 54.6%
7.5 min 26.9 mM 15.0 mM 41.9 mM 58.1%
1 0 . 0 min 23.7 mM 15.7 mM 39.4 mM 60.6%
Slope F it Of Ni Catalysis: [BHU~ ] = 0.0536 - (1 .5 x 10"3) time MOLES Ni MOLES NaBHu x 100 = 3%
TIME
[BH*"]N i X a
(expt)
[BH*"]N i X a
(calc)
N i X a
% HYDROLYSIS (expt)
N i X a
% HYDROLYSIS (calc)
2.5 min 38.0 mM 46.7 mM 62.0% 53.3%
5.0 min 31.6 mM 39.2 mM 68.4% 60.8%
7.5 min 26.9 mM 31.9 mM 73.1% 6 8 . 1 %
1 0 . 0 min 23.7 mM 24.9 mM 76.3% 75.1%
100 mM NaBHu; 21.5°CCO

Reproduced
with perm
ission of the
copyright ow
ner. Further
reproduction prohibited
without
permission.
TABLE XIX EFFECT OF NICKEL METAL CATALYSIS ON THE HYDROLYSIS OF NaBHu (cont'd)
TIME
[BHu'lNiX2
(expt) _
A[BH*“] . H
(calc)
[BHu'lNi
(ca lc)
Ni% HYDROLYSIS
(calc)
2.5 min 34.8 mM 16.4 mM 51.2 mM 48.8%
5.0 min 28.4 mM 17.8 mM 46.2 mM 52.8%
7.5 min 23.9 mM 19.3 mM 43.3 mM 56.7%
1 0 . 0 min 20.4 mM 20.2 mM 40.6 mM 59.4%
Slope F it Of Ni Catalysis: [ BHU- ] = 0.0540 - (1.39 x 10_3)time MOLES Ni MOLES NaBHu x 100 = 4%
TIME
[ B H / ]NiX2
(expt)
[BHu'lNi X2
(calc)
Ni X2 % HYDROLYSIS
(expt)
Ni X2 % HYDROLYSIS
(calc)
2.5 min 34.8 mM 40.3 mM 65.2% 59.7%
5.0 min 28.4 mM 32.8 mM 71.6% 67.2%
7.5 min 23.9 mM 23.8 mM 76.1% 76.2%
1 0 . 0 min 20.4 mM 15.2 mM 79.6% 84.8%
100 mM NaBHi,; 21.5°C

75
TABLE XX SUMMARY OF CALCULATED KINETIC RATE CONSTANTS OF METAL
CATALYSIS OBSERVED IN MX2 ACCELERATION
kM MOLESLITER- MIN
MOLES MMOLES NaBTL' x 1 0 0 COBALT NICKEL
U 5.3 + 0.1 x 10_lt 1.7 + 0.1 x 10‘ 3
Z% 1.19 + 0.02 x 10' 3 1.59 + 0.09 x 10" 3
3% 2.00 + 0.03 x 10" 3 1.5 + 0.1 x 10" 3
Wo 3.05 + 0.09 x 10" 3 1.39 + 0.09 x 10‘ 3
21.6°C
A summary of calculated zero order metal rate constants
(Table XX) reveals the extent of surface catalysis calculated as a
partia l contribution to metal salt acceleration. Catalysis of the
hydrolysis by nickel metal may at best be considered constant with
increasing amounts of nickel. The large in i t ia l increases in the
hydrolytic rate due to the presence of nickel salts is primarily
caused by:
1) Acid acceleration (from nickel salt reduction)
2) Pronounced acidity of the orginial nickel salt solution
(pka of Ni(H2 0 ) 6 2 ;5 )
In contrast, cobalt metal catalysis of the hydrolysis of sodium
borohydride increases at a regular rate with increasing metal
concentration.
Reproduced with permission of the copyright owner. Further reproduction prohibited without permission.

76
CONCLUSIONS
The total effect of metal salts on the hydrolysis of sodium
borohydride can be described as an additive combination of acid
acceleration and metal surface catalysis. The kinetics of the
metal salt accelerated path can be approximated by the following
rate law:
d^time = kH+ ^H30 + kMIn unbuffered media, the effects of cobalt and nickel salts can be
mathematically characterized as the combination of two least square
f i t te d equations:
pNaBH = E' + [F + G(time)]meq H+
+ p[ [BH ] INIT - I ( time)(MX2) ] - pN aB H ^ ^ (26)
Substituting the known values for F and G (from the acid acceleration
ion model) and the conversion stoichiometry of proton production
from the reduction of metals salts ( 5 * 0 0 moles MX yields the
following model:
H + ( .2 2 6 )(8 .7 5 ) [MX2](tim e) + ( .01 18 )(8 .75 )[MX2](time)
-log [ .1 - I(time)[MX2] ] - 1 (27)
pNaBH = H + 1.9775[MX2] + .10325[MX2](time)
- log [ . 1 - I(time)[MX2] ] - 1 (27a)
H is some new intercept based on the pKa and concentration of the
metal sa lt solution; I is a function of metal surface catalysis;
[MX2] is the ra tio ( . Since copper metal exhibits a
minimum of surface ca ta ly t ic a b i l i t y , Iqu = 0 and the model
simplifies to the equation depicting acid acceleration. Linear
Reproduced with permission of the copyright owner. Further reproduction prohibited without permission.

77
regression of the entire data set fo r each metal yields the
following values:
HCq = 1.048 + 0.004
! Co = 8 , 5 - ° ' 2 x 1 0 " 2
HNi = 1 . 2 0 + 0.03
I Ni = 1.70 + 0.07 x 10" 1
Further investigation of metal surface catalysis in the next
chapter w il l y ie ld the corresponding data necessary to predict
metal sa lt effects at d iffe ren t temperatures.
Reproduced with permission of the copyright owner. Further reproduction prohibited without permission.

CHAPTER IV TRANSITION METAL CATALYSIS
78
Reproduced with permission of the copyright owner. Further reproduction prohibited without permission.

79
INTRODUCTION
Noble metal catalysis of the hydrolysis of sodium borohydride
was i n i t ia l l y noted by H . I . Schlesinger and H.C. Brown11. The
extent of hydrolytic rate acceleration however was unspecified.
The noble metals were rejected on a cost basis in favor of metal
salts and the proposed metal borides. Heterogeneous metal catalysis
offers the following advantages over the homogeneous acid
acceleration:
1) Hydrolytic rate is smooth and unaffected by changes in
solution a lka l in ity
2) Minimal foaming of solutions
3) Possible recovery and reuse of catalysts.
Effects of transition metal salts on the hydrolysis of sodium
borohydride have already been described as a combination of acid
acceleration and surface metal catalysis. Acid acceleration of the
hydrolytic reaction has been mathematically characterized in terms
of equivalent acid concentrations and reaction time. Analogous
quantification of surface catalysis in terms of inetal
concentration, kinetics, and temperature was the primary objective
of this section of research. As a comparison to the hydrolytic
catalysis by borohydride reduced cobalt and nickel, kinetic
investigations of Raney nickel catalysis were also concurrently
undertaken. Catalytic experiments were conducted in strongly
alkaline media (either a concentrated sodium hydroxide or a
carbonate buffer solution) to inh ib it or control the contribution
from acid acceleration.
Reproduced with permission of the copyright owner. Further reproduction prohibited without permission.
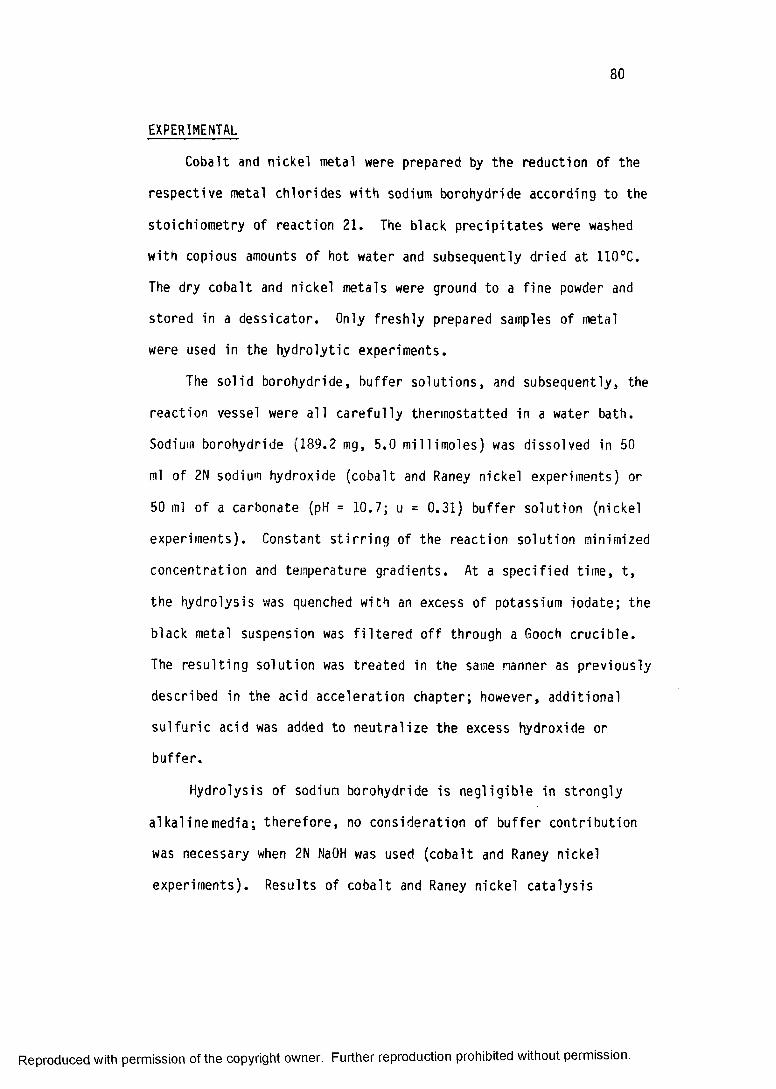
80
EXPERIMENTAL
Cobalt and nickel metal were prepared by the reduction of the
respective metal chlorides with sodium borohydride according to the
stoichiometry of reaction 21. The black precipitates were washed
with copious amounts of hot water and subsequently dried at 110°C.
The dry cobalt and nickel metals were ground to a fine powder and
stored in a dessicator. Only freshly prepared samples of metal
were used in the hydrolytic experiments.
The solid borohydride, buffer solutions, and subsequently, the
reaction vessel were a ll carefully thermostatted in a water bath.
Sodium borohydride (189.2 mg, 5.0 millimoles) was dissolved in 50
ml of 2N sodium hydroxide (cobalt and Raney nickel experiments) or
50 ml of a carbonate (pH = 10.7; u = 0.31) buffer solution (nickel
experiments). Constant s t irr ing of the reaction solution minimized
concentration and temperature gradients. At a specified time, t ,
the hydrolysis was quenched with an excess of potassium iodate; the
black metal suspension was f i l te re d off through a Gooch crucible.
The resulting solution was treated in the same manner as previously
described in the acid acceleration chapter; however, additional
sulfuric acid was added to neutralize the excess hydroxide or
buffer.
Hydrolysis of sodium borohydride is negligible in strongly
alkalinemedia; therefore, no consideration of buffer contribution
was necessary when 2N NaOH was used (cobalt and Raney nickel
experiments). Results of cobalt and Raney nickel catalysis
Reproduced with permission of the copyright owner. Further reproduction prohibited without permission.

81
along with slope f i t te d equations and graphs are presented in
Tables XXI - XXII and Figures 14-31.
An attempt was made to determine nickel catalysis in 2N NaOH;
however, the catalyst was inactiviated in this highly alkaline
media. Therefore, nickel catalysis of the hydrolysis of sodium
borohydride was conducted in a carbonate buffer. Extent of nickel
catalysis was analyzed by the same procedure employed to determine
the metal catalysis contribution to metal salt acceleration.
UNR [B H 4] Ni = UNR / Buf f e r + A [B H iJ B u f f e r (29 )
Results of carbonate buffer kinetics are presented in Table X X II I;
calculated nickel catalysis and slope f i t te d equations are
summarized in Tables XXIV - XXV and Figures 32-34.
Reproduced with permission of the copyright owner. Further reproduction prohibited without permission.

Reproduced
with perm
ission of the
copyright ow
ner. Further
reproduction prohibited
without
permission.
TABLE XXI COBALT CATALYSIS OF THE HYDROLYSIS OF NaBHu
TIME0.0°C [BHJ- ] % HYD TIME
21.8°C [BHu ] % HYD TIME
35.0°C
[BHu" ] % HYD
15 min 94.3 mM cn • CO <s* 2.5 min 87.1 mM 12.9% 1 min 89.6 mM 10.4%
30 min 93.6 mM 6.4% 5.0 min 79.0 mM 20.1% 2 min 75.1 mM 25.0%
45 rain 90.0 mM 10.1% 7.5 min 64.7 mM 35.3% 3 min 69.7 mM 30.3%
60 min 82.7 mM 17.3% 10.C1 min 54.2 mM 45.8% 4 min 60.1 mM 40.0%
75 min 81.9 mM 18.1% 12.5 min 48.9 mM 51.1% 5 min 42.0 mM 58.0%
90 min 75.6 mM 24.4% 15.0 min 37.9 mM 62.1% 6 min 31.6 mM 68.4%
105 min 71.9 mM 28.1% 17.5 min 21.5 mM 78.5% 7 min 25.2 mM 74.8%
120 min 70.5 mM 29.5% 20.0 min 12.6 inM 87.4% 8 min 18.6 mM 81.4%
100 mM NaBH,,; Buffer = 2N NaOH; 15 mg Cobalt; MOLE~S'~NaBHtt X 100 = 5,09%
Time Dependent Equations: 0.0°C [BH^] - 0.0996 = (2.5 x 10—u)time
21.8°C [BHC] - 0.0987 = (4.3 x l O ^ t im e
35 .0°C CBHiTj - 0.0986 = (1.05 x 10"lt)time

% H
YDRO
LYSI
S
83
100
-4 0
■1000 15 30 45 60 75 90 105 120
TIME (MIN)
Figure 14 Cobalt Catalysis (15 mg, 0.0°C)
Reproduced with permission of the copyright owner. Further reproduction prohibited without permission.
UNREACTED [NaBH„]
x 10

% H
YDRO
LYSI
S
84
100
- 2 0
60 -
-6040-
-80
400
TIME (MIN)
Figure 15 Cobalt Catalysis (15 mg,21.8°C)
Reproduced with permission of the copyright owner. Further reproduction prohibited without permission.
UNREACTED [NaBH„]
x 10

% H
YDRO
LYSI
S
85
100
60“
-60
-80
*100
TIME (MIN)
Figure 16 Cobalt Catalysis (15 mg, 35.0°C)
Reproduced with permission of the copyright owner. Further reproduction prohibited without permission.
UNREACTED [NaBH„]
x 10

Reproduced
with perm
ission of the
copyright ow
ner. Further
reproduction prohibited
without
permission.
TABLE XXI COBALT CATALYSIS OF THE HYDROLYSIS OF NaBH (cont'd)
TIME0.0°C
[BHU- ] % HYD TIME2 2 .1°Cm u ] % HYD TIME
3 5 .01 [BHiT
°C
] % HYD
15 min 96.0 mM 4.1% 2.0 min 87.8 mM 12.2% 0.5 min 89.1 mM 10.9%
30 min 86.7 mM 13.3% 4.0 min 78.3 mM 21.8% 1.0 min 85.3 mM 14.7%
45 min 82.2 mM 17.7% 6.0 min 59.4 mM 40.6% 1.5 min 69.4 mM 30.6%
60 min 81.5 mM 18.5% 8.0 min 48.0 mM 52.0% 2.0 min 67.9 mM 32.1%
75 min 78.1 mM 21.9% 10.0 min 43.0 mM 52.0% 2.5 min 59.7 mM 40.3%
90 min 74.0 mM 26.0% 12.0 min 25.2 mM 74.8% 3.0 min 45.5 mM 54.6%
105 min 63.7 mM 36.3% 14.0 min 20.4 mM 79.6% 3.5 min 38.9 mM 61.1%
120 min 59.1 mM 41.0% 16.0 min 4.5 mM 95.5% 4.0 min 36.6 mM 63.4%
100 mM NaBH\k ; Buffer = 2N NaOH; 20 mg Cobalt; MOLES Co MOLES NaBH x 100 = 6.79%
Time Dependent Equations: 0.0 °C [BH^J = 0.0992 - (3.2 x 10 ' ^Jtime
22.1 °C [BH^J = 0.0983 - (5.8 x 10" 3)time
35.0 °C [BHU] = 0.0980 - (1.6 x 10" 2)time

% H
YDRO
LYSI
S
87
100'
60“
400
0 15 30 45 60 75 90 105 120TIME (MIN)
Figure 17 Cobalt Catalysis (20 mg, 0.0°C)
Reproduced with permission of the copyright owner. Further reproduction prohibited without permission.
UNREACTED [NaBH„]
x 10
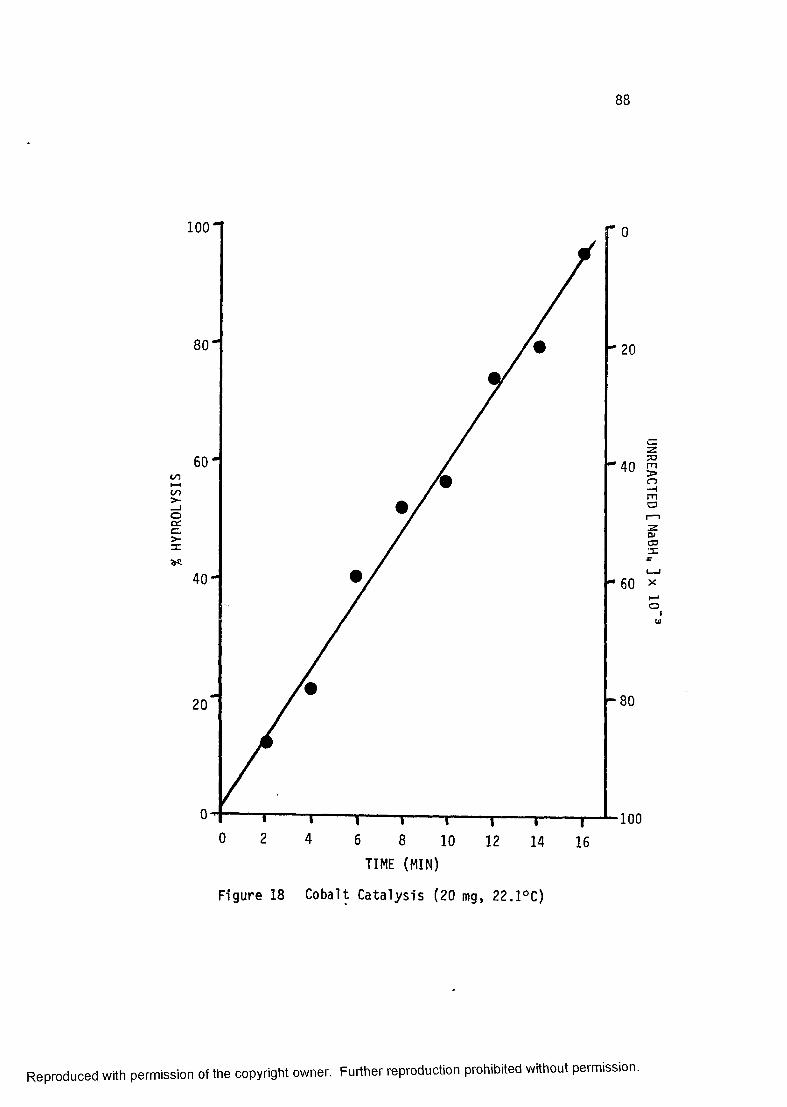
88
1001
tn
oC£
4 0 -
- 8 0
1000 2 4 6 8 10 12 14 16
TIME (MIN)
Figure 18 Cobalt Catalysis (20 mg, 22.1°C)
Reproduced with permission of the copyright owner. Further reproduction prohibited without permission.
UNREACTED [N
aBH
u ]
x 10"

% H
YDRO
LYSI
S
89
100
“80
•1000 0.5 1.0 1.5 2.0 2.5 3.0 3.5 4.0
TIME (MIN)
Figure 19 Cobalt Catalysis (20 mg, 35.0°C)
Reproduced with permission of the copyright owner. Further reproduction prohibited without permission.
UNREACTED [N
aBH
u] x
10

Reproduced
with perm
ission of the
copyright ow
ner. Further
reproduction prohibited
without
permission.
TABLE XXI COBALT CATALYSIS OF THE HYDROLYSIS OF NaBHi»(cont *d)
TIME0.0°Cm z i % HYD TIME
2 2 .1°C[BHu] % HYD TIME
35.0°C[BHu] % HYD
1 0 min 92.9 inM 7.2% 1 .5 min 88.9 mM 1 1 . 2 % 0.5 min 8 6 . 1 mM 13.9%
2 0 min 88.3 mM 11.7% 3.0 min 74.0 mM 26.0% 1 . 0 min 74.9 mM 25.2%
30 min 78.6 mM 21.5% (4.5 min 61.7 mM 38.3% 1.5 min 70.5 mM 29.6%
40 min 76.9 mM 23.1% 6 . 0 min 50.3 mM 49.7% 2 . 0 min 59.2 mM 40.8%
50 min 66.1 mM 33.9% |7.5 min 38.7 mM 61.3% 2.5 min 43.7 mM 56.3%
60 min 61.2 mM 38.7% jj.O min 30.7 mM 69.3% 3.0 min 39.2 mM 60.8%
70 min 58.8 mM 41.2% 12.5 min 15.1 mM 84.9% 3.5 min 2 2 . 8 mM 77.2%
80 min 50.7 mM 49.3% 1 2 . 0 min 7.0 mM 93.0% 4.0 min 17.5mM 82.5%
100 mM NaBHl4; Buffer = 2N NaOH; 25 mg Cobalt; MOLES Co MOLES NaBHt* x 1 0 0 = 8.48%
Time Dependent Equations: 0.0°C [BH"j = 0.0987 - ( 6 . 0 x 10“*+) t i me
2 2 .0°C [BH‘ J = 0.0979 - (7.7 x 10"3 )time
35.0°C [BH 4] = 0.0972 - ( 2 . 0 2 x 1 0"2) time

% H
YDRO
LYSI
S
91
100
80
60
40
20
0 ■1000 10 20 30 40 50 60 70 80
TIME (MIN)
Figure 20 Cobalt Catalysis (25 mg, 0.0°C)
Reproduced with permission of the copyright owner. Further reproduction prohibited without permission.
UNREACTED [NaBHu]
x 10"

% H
YDRO
LYSI
S
92
100
-40
-60
-80
1001.5 3.0 4.5 6.0 7.5 9.0 10.5 12.00
TIME (MIN)
Figure 21 Cobalt Catalysis (25 mg, 22.0°C)
Reproduced with permission of the copyright owner. Further reproduction prohibited without permission.
UNREACTED [NaBH*]
x 10

% H
YDRO
LYSI
S
93
100
80
60
40
20
0 4000 0.5 1.0 1.5 2.0 2.5 3.0 3.5 4.0
TIME (MIN)
Figure 22 Cobalt Catalysis (25 mg, 35.0°C)
Reproduced with permission of the copyright owner. Further reproduction prohibited without permission.
UNREACTER [MaBH«]
x 10
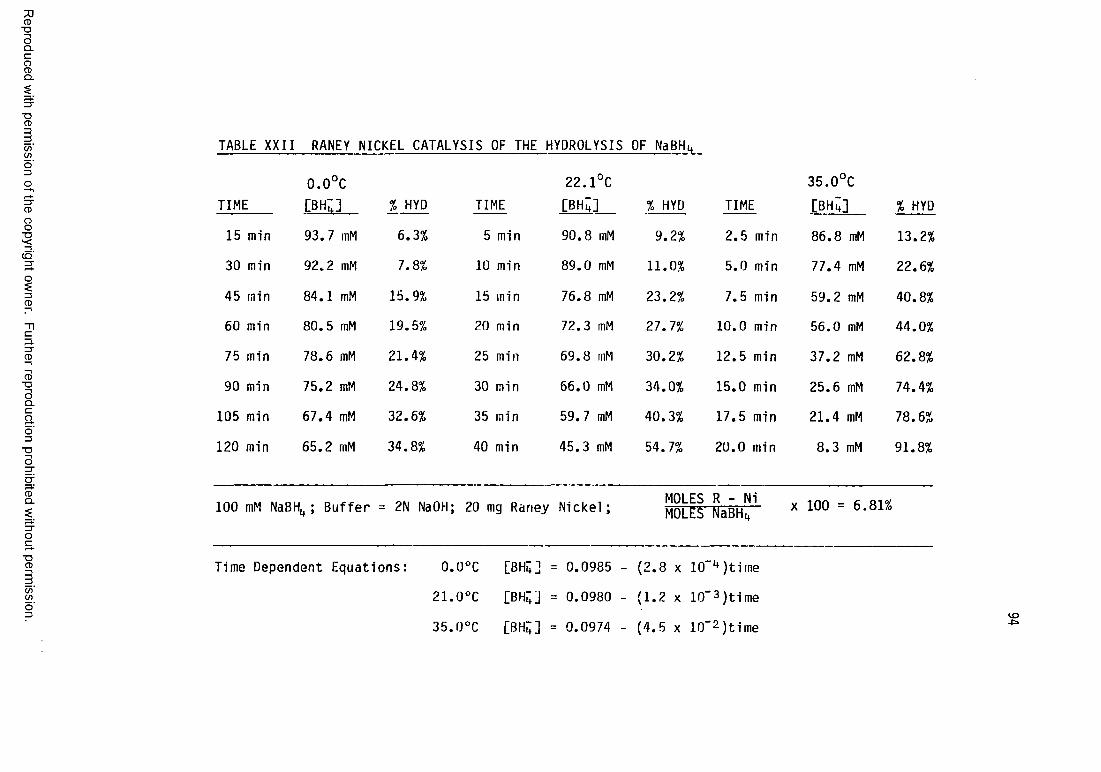
Reproduced
with perm
ission of the
copyright ow
ner. Further
reproduction prohibited
without
permission.
TABLE XXII RANEY NICKEL CATALYSIS OF THE HYDROLYSIS OF NaBH„
TIME0.0°C[BHu] % HYD TIME
2 2 .1°C
[BH^] % HYD TIME35.0°C
[BH^ % HYD
15 min 93.7 mM 6.3% 5 min 90.8 mM 9.2% 2.5 min 86.8 mM 13.2%
30 min 92.2 mM 7.8% 10 min 89.0 mM 11.0% 5.0 min 77.4 mM 22.6%
45 min 84.1 mM 15.9% 15 min 76.8 mM 23.2% 7.5 min 59.2 mM 40.8%
60 min 80.5 mM 19.5% 20 min 72.3 mM 27. 7% 10.0 min 56.0 mM 44.0%
75 min 78.6 mM 21.4% 25 min 69.8 rnM 30.2% 12.5 min 37.2 mM 62.8%
90 min 75.2 mM 24.8% 30 min 66.0 mM 34.0% 15.0 min 25.6 mM 74.4%
105 min 67.4 mM 32.6% 35 min 59.7 mM 40.3% 17.5 min 21.4 mM 78.6%
120 min 65.2 mM 34.8% 40 min 45.3 mM 54.7% 20.0 min 8.3 mM 91.8%
100 mM NaBH1 ; Buffer = 2N NaOH; 20 mg Rariey Nickel; MOLES R - Ni MOLES NaBH,* x 100 = 6. 81%
Time Dependent Equations: 0.0°C [BHi;] = 0.0985 - (2 .8 x lO'^Jtime
21.0°C [BH^j = 0.0980 - (1.2 x 10‘ 3)time
35.0°C [BHIJ] = 0.0974 - (4 .5 x 10 '2 )time ^

% H
YDRO
LYSI
S
95
100H
80-
60-
2(T
100
0 15 30 45 60 75 90 105 120
TIME (MIN)
Figure 23 Raney Nickel Catalysis (20 mg, 0.0°C)
Reproduced with permission of the copyright owner. Further reproduction prohibited without permission.
UNREACTEO [NaBH„]
x 10
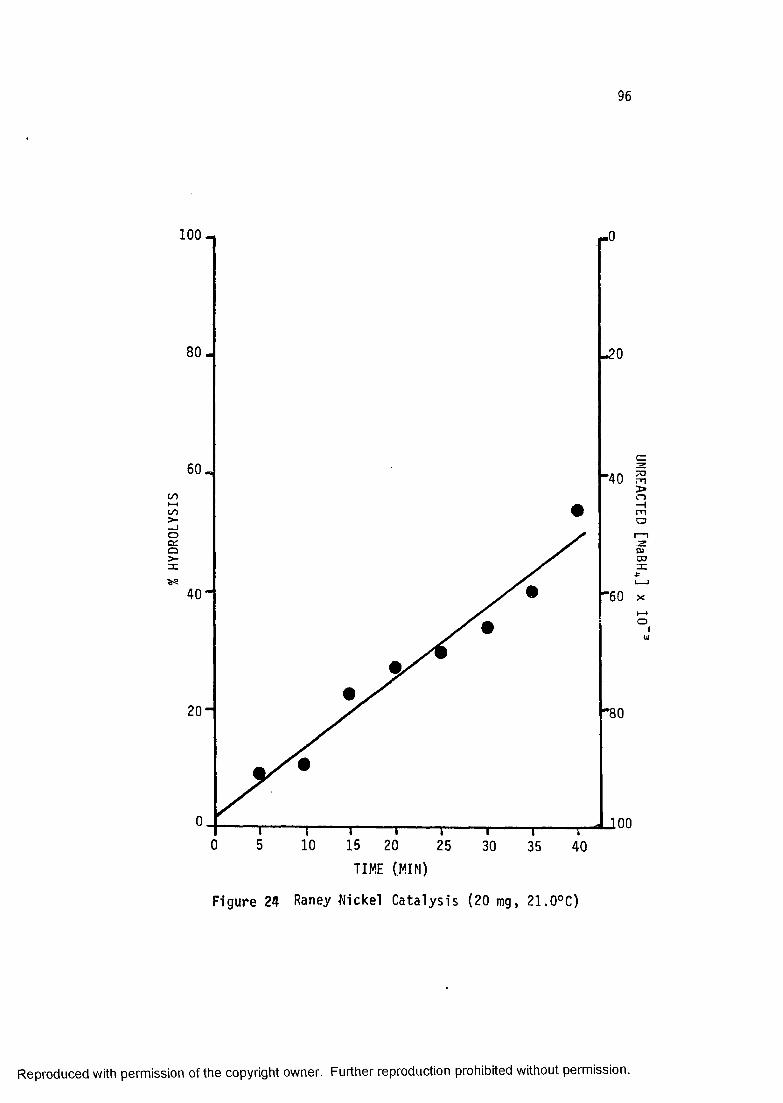
96
100 —
8 0 - -20
60 -
I— I
_Joa:o>-m
4 0 - "60
2 0 “ *80
10050 10 15 20 25 30 35 40
TIME (MIN)
Figure 24 Raney -Nickel Catalysis (20 mg, 21.0°C)
Reproduced with permission of the copyright owner. Further reproduction prohibited without permission.
UNREACTED [NaBHj
x 10

% H
YDRO
LYSI
S
97
100
80 -20
60 -40
40 -60
20 -80
0 •100
TIME (MIN)
Figure 25 Raney Nickel Catalysis (20 mg, 35.0°C)
Reproduced with permission of the copyright owner. Further reproduction prohibited without permission.
UNREACTED [NaBH„]
x 10

Reproduced
with perm
ission of the
copyright ow
ner. Further
reproduction prohibited
without
permission.
TABLE XXII RANEY NICKEL CATALYSIS OF THE HYDROLYSIS OF NaBHt* (cont'd)
TIME0.0°C[BHu] % HYD TIME
21.0°C [BHu] % HYD TIME
35.0°C[BH^] % HYD
15 min 91.4 mM 8.6% 3 min 91.3 mM 8.7% 1 min 84.9 mM 15.1%
30 min 86.6 mM 13.4% 6 min 82.1 mM 17.9% 2 min 74.0 mM 26.1%
45 min 81.6 mM 18.4% 9 min 80.0 mM 20.0% 3 min 70.7 mM 29.3%
60 min 80.8 mM 19.2 12 min 74.6 mM 25.4% 4 min 61.3 mM 38.7%
75 min 76.0 mM 24.0% 15 min 63.6 mM 36.4% 5 min 43.9 mM 56.1%
90 min 65.7 mM 34.3% 18 min 57.4 mM 42.6% 6 min 40.8 mM 59.2%
105 min 64.8 mM 35.3% 21 min 51.7 mM 48.3% 7 min 25.9 mM 74.1%
120 min 53.8 mM 46.2% 24 min 47.5 mM 52.5% 8 min 17.0 mM 83.0%
100 mM NaBH Buffer = 2N NaOH; 25 mg Raney Nickel; MOLESMOLES
R - Ni NaBHij x 100 = 8.52%
Time Dependent Equations: 0.0°C [BH^] = 0.0979 - (3.4 x 10 -lt)time
21.0°C [BH^J = 0.0973 - (2.1 x 10 “ 3)time
35.0°C [BH^j = 0.0964 - (9.8 x 10 “ 3) t i me

0 15 30 45 60 75 90 105 120
TIME (MIN)
Figure 26 Raney Nickel Catalysis (25 mg, 0.0°C)
Reproduced with permission of the copyright owner. Further reproduction prohibited without permission.

SISAIOdUAH %
100
100 r o
- 20
4 0 -
2 0 -
1000 3 6 9 12 15 18 21 24
TIME (MIN)
Figure 27 Raney Nickel Catalysis (25 mg, 21.0°C)
Reproduced with permission of the copyright owner. Further reproduction prohibited without permission.
UNREACTED [NaBH„]
x 10
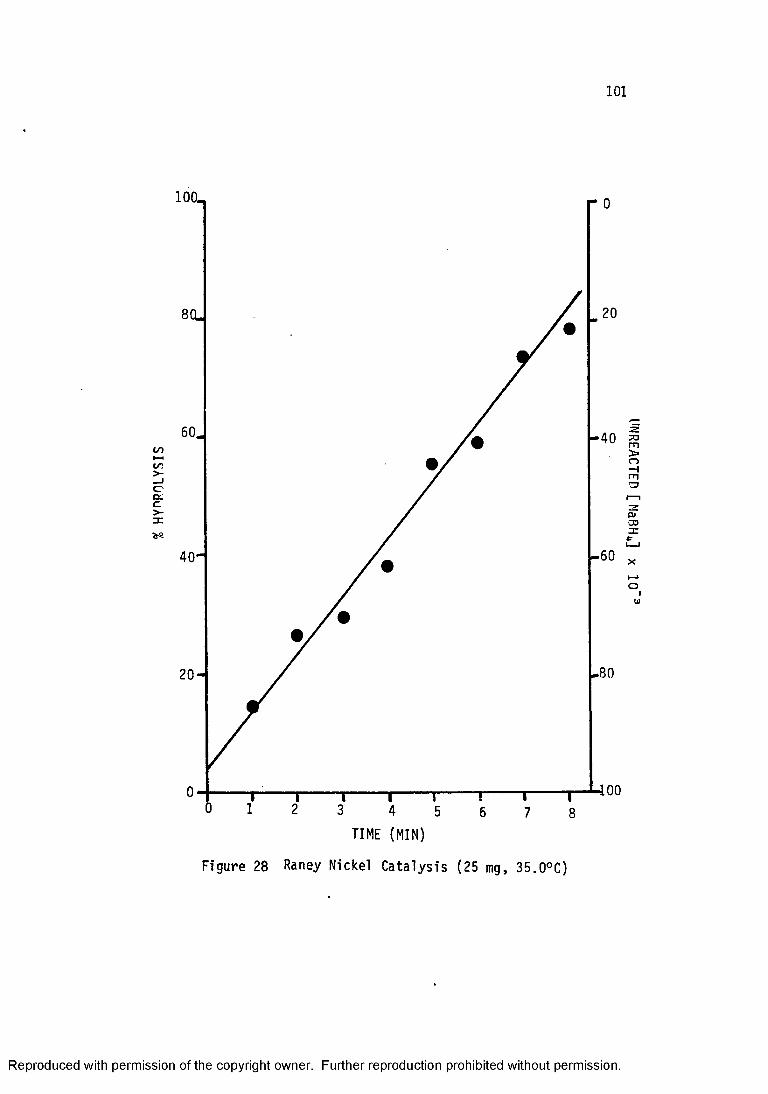
101
1O0L
8CL
to
400
TIME (MIN)
Figure 28 Raney Nickel Catalysis (25 mg, 35.0°C)
Reproduced with permission of the copyright owner. Further reproduction prohibited without permission.
UNREACTED [
NaBH„] x
10"

Reproduced
with perm
ission of the
copyright ow
ner. Further
reproduction prohibited
without
permission.
TABLE XXII RANEY NICKEL CATALYSIS OF THE HYDROLYSIS OF NaBHi (cont'd)
TIME0.0°Cm u % HYD TIME
21.0°CCBHuJ % HYD TIME '
35.0°C[BHu] % HYD
15 min 83.7 mM 16.4% 2.5 min 84.1 rnM 16.0% 0.5 min 84.2 mM 15.8%
30 min 80.5 mM 19.5% 5.0 min 79.3 mM 20.7% 1.0 min 72.5 mM 27.5%
45 min 61.5 mM 38.5% 7.5 min 62.6 mM 37.4% 1.5 min 69.5 mM 30.6%
60 min 59.4 mM 40.6 10.C min 58.9 mM 41.1% 2.0 min 59.8 mM 40.2%
75 min 40.0 mM 60.0% 12.5 min 49.7 mM 50.4% 2.5 min 43.6 mM 56.4%
90 min 37.8 mM 62.2% 15.0 min 34.9 mM 65.1% 3.0 min 35.0 mM 65.0%
105 min 27.2 mM 72.8% 17.5 min 30.5 mM 69.5% 3.5 min 30.1 mM 69.9%
120 min 10.9 mM 89.1% 20.0 min 15.2 mM 84.8% 4.0 min 14.3 mM 85.7%
100 mM NaBH\h ; Buffer = 2N NaOH; 30 mg Raney Nickel; MOLES R - Ni MOLES NaBhit X 100 = 10.
CMCM
Time Dependent Equations: 0.0°C [BH^j = 0.0965 - (6 .9 x 10_t+) time
2 1 .0°C [OH^j = 0.0957 - (3 .9 x 10_3)time
35 .0°C [B H j = 0.0951 - (1.95 x 10_2)time °

% H
YPRO
LYSI
S
103
lOO-i
■80
4000 15 30 45 60 75 90 105 120
TIME (MIN)
Figure 29 Raney Nickel Catalysis (30 mg, 0.0°C)
Reproduced with permission of the copyright owner. Further reproduction prohibited without permission.
UNREACTED [
NaBHJ

104
100
80 -
HH
40 -
1000 2.5 5.0 7.5 10.0 12.5 15.0 17.5 20.0
TIME (MIN)
Figure 30 Raney .Nickel Catalysis (30 mg, 21.0°C)
Reproduced with permission of the copyright owner. Further reproduction prohibited without permission.
UNREACTED [NaBHu]
x 10

105
100 _
60 _
*—*00
.60
200
TIME (MIN)
Figure 31 Raney Nickel Catalysis (30 mg, 35.0°C)
Reproduced with permission of the copyright owner. Further reproduction prohibited without permission.
UNREACTED [NaBH„]
x 10

Reproduced
with perm
ission of the
copyright ow
ner. Further
reproduction prohibited
without
permission.
TABLE X X II I CARBONATE BUFFER KINETICS OF THE HYDROLYSIS OF NaBHu
TIME0.0°C
pNaBHit % HYD TIME21.0°CpNaBHi* % HYD TIME
35.0°CpNaBHu % HYD
10 min 1.008 2 . 0% 2.5 min 1.009 2 . 0% 1 min 1 .0 2 2 5.0%
20 min 1.017 3.8% 5.0 min 1.026 5.7% 2 min 1.032 7.1%
30 min 1.033 7.3% 7.5 min 1.036 7.9% 3 min 1.058 12.5%
40 min 1.038 8.4% 1 0 .0 min 1.044 9.5% 4 min 1.072 15.2%
50 min 1.041 9.0% 12 .5 min 1.054 11 . 8% 5 min 1.085 17.8%
60 min 1.056 1 2 . 0% 15.0 min 1.065 13.9% 6 min 1.092 19.2%
70 min 1.061 13.2% 17.5 min 1.069 14.7% 7 min 1.111 22.5%
80 min 1.064 13.7% 2 0 .0 min 1.077 16.2% 8 min 1.127 25.4%
LOO mM NaBHi*; Buffer = HCO3 /C03~(pH = 10.7, u = 0.31) ; Used for calc, of Ni catalysis
fime Dependent Equations: 0.0°C pNaBH = 1.003 + ( 8 .1 x 10 - , , )time
2 1 .0°C pNaBHt* = 1.005 + (3.8 x 10 - -')time
35.0°C pNaBH = 1.008 + (1.48 x 10_2)time

Reproduced
with perm
ission of the
copyright ow
ner. Further
reproduction prohibited
without
permission.
E XXIV NICKEL METAL IN CARBONATE BUFFER - EFFECT ON THE HYDROLYSIS OF NaBHu
TIME
[BHlj]N i/Buffer
(expt)
ACBH ]Buffer
(calc)
[BH4 ]Ni
(calc)
Ni% HYDROLYSIS
(calc)
1 0 min 94.7 mM 1.8 mM 96.6 mM 3.4%
2 0 min 91.9 mM 3.6 mM 95.6 mM 4.4%
30 min 89.9 mM 5.4 mM 95.3 mM 4.7%
40 min 8 6 . 8 mM 7.2 mM 94.0 mM 6 . 0 %
50 min 83.2 mM 8.9 mM 92.1 mM 7.9%
60 min 81.3 mM 10.5 mM 91.8 mM 8 . 2 %
70 min 77.2 mM 12.2 mM 89.4 mM 1 0 . 6 %
80 min 74.4 mM 13.8 mM 88.2 mM 1 1 . 8 %
100 mM NaBH^; 0.0°C; Buffer = HC03" /C03 (pH = 10.7, u = 0.31)
15 mg Nickel; {JolII NaBHu X 1 0 0 " 5,11%
O

Reproduced
with perm
ission of the
copyright ow
ner. Further
reproduction prohibited
without
permission.
TABLE XXIV NICKEL METAL IN CARBONATE BUFFER - EFFECT ON THE HYDROLYSIS OF NaBH^cont'd)
_ _ — “jEBHt N i /B u ffe r A^BHl+ Buffer £BH N i % HYDROLYSIS
TIME (expt) (ca lc) (ca lc) (calc)
2.5 min 89.9 mM 2 . 1 mM 92.0 mM 8 . 0 %
5.0 min 86.4 mM 4.2 mM 90.6 mM 9.4%
7.5 min 80.8 mM 6 . 2 mM 87.0 mM 13.0%
1 0 . 0 min 73.8 mM 8 . 2 mM 82.0 mM 18.0%
12.5 min 67.9 mM 1 0 . 2 mM 78.1 mM 21.9%
15.0 min 64.5 mM 1 2 . 1 mM 76.6 mM 23.4%
17.5 min 59.3 mM 14.0 mM 73.3 mM 26.7%
2 0 . 0 min 51.4 mM 15.8 mM 67.2 mM 32.8%
1 NaBH^; 21.0°C; Buffer = HCO3 /CO3 '’ (pH = 10.7, u = 0.31)
N icke l; MOLESMOLES N i XNaBHt* 100 = 5.11%
O00

Reproduced
with perm
ission of the
copyright ow
ner. Further
reproduction prohibited
without
permission.
TABLE XXIV NICKEL METAL IN CARBONATE BUFFER - EFFECT ON THE HYDROLYSIS OF NaBHjcont'd)
TIMEt ^ N i / B u f f e r
(expt)A^BM B u f f e r
(calc)c“ O ni
(calc)
Ni% HYDROLYSIS
(calc)
1 min 88.1 mM 3.3 mM 91.4 mM 8 . 6 %
2 min 81.5 mM 6.5 mM 88.0 mM 1 2 . 0 %
3 min 70.8 mM 9.5 mM 80.3 mM 19.7%
4 min 64.8 mM 12.5 mM 77.3 mM 22.7%
5 min 58.8 mM 15.4 mM 74.2 mM 25.8%
6 min 54.6 mM 18.2 mM 72.8 mM 27.2%
7 min 46.8 mM 20.8 mM 67.6 mM 32.4%
8 min 43.4 mM 23.5 mM 6 6 . 8 mM 33.2%
100 mM NaBHi+i 35.0°C; Buffer = HCO3 /CO3 "(pH = 10.7, u = 0.31)
15 mg Nickel; MOLES NaBHi* x 1 0 0 = 5-11%
OVO
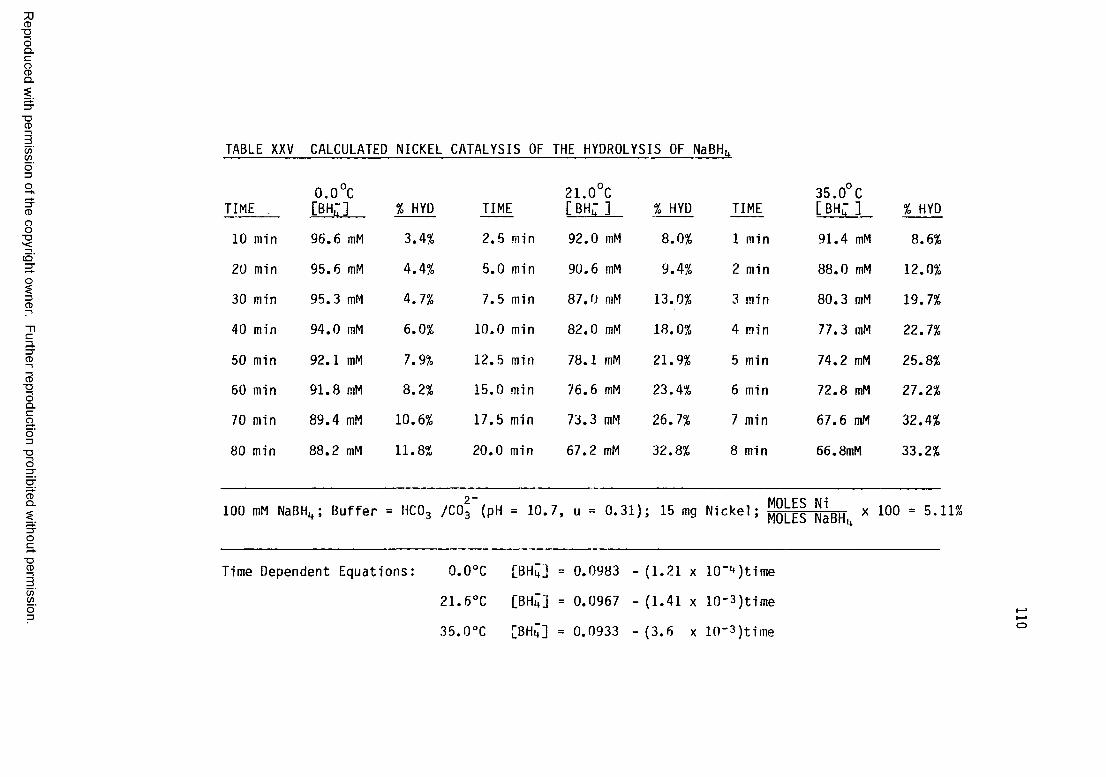
Reproduced
with perm
ission of the
copyright ow
ner. Further
reproduction prohibited
without
permission.
TABLE XXV CALCULATED NICKEL CATALYSIS OF THE HYDROLYSIS OF NaBHu
TIME .0.0°C[ bh: ] % HYD TIME
21.0°C [ bh: ] % HYD TIME
35.0°C [ bh: ] % HYD
1 0 min 96.6 mM 3.4% 2.5 min 92.0 mM 8 . 0 % 1 min 91.4 mM 8 . 6 %
2 0 min 95.6 mM 4.4% 5.0 min 90.6 mM 9.4% 2 min 88.0 mM 1 2 . 0 %
30 min 95.3 mM 4.7% 7.5 min 87.0 mM 13.0% 3 min 80.3 mM 19.7%
40 min 94.0 mM 6 . 0 % 1 0 . 0 min 82.0 mM 18.0% 4 min 77.3 mM 22.7%
50 min 92.1 mM 7.9% 12.5 min 78.1 mM 21.9% 5 min 74.2 mM 25.8%
60 min 91.8 mM 8 . 2 % 15.0 min 76.6 mM 23.4% 6 min 72.8 mM 27.2%
70 min 89.4 mM 1 0 . 6 % 17.5 min 73.3 mM 26. 7% 7 min 67.6 mM 32.4%
80 min 88.2 mM 1 1 . 8 % 2 0 . 0 min 67.2 mM 32.8% 8 min 6 6 . 8 mM 33.2%
100 mM NaBHIt,; Buffer = HC03 /C03 (pH = 1 0 . 7, u = 0.31) ; 15 mg Nickel- M0LES ’ MOLES N i XNaBHi, * 100 = 5.1
Time Dependent Equations: 0.0°C [BH4 ] = 0.0983 - ( 1 . 2 1 x 1 0 -1*)time
2 1 . 6 °C [B H 4 ] = 0.0967 - (1.41 x 10"3)time
35 .0°C [BH4 ] = 0.0933 - (3.6 x 1 0 _3)time

% H
YDRO
LYSI
S
111
100,
- 2 0
-60
“80
JOO
TIME (MIN)
Figure 32 Calculated Nickel Catalysis (15 mg, 0.0°C)
Reproduced with permission of the copyright owner. Further reproduction prohibited without permission.
UNREACTED [NaBHu]
x 10
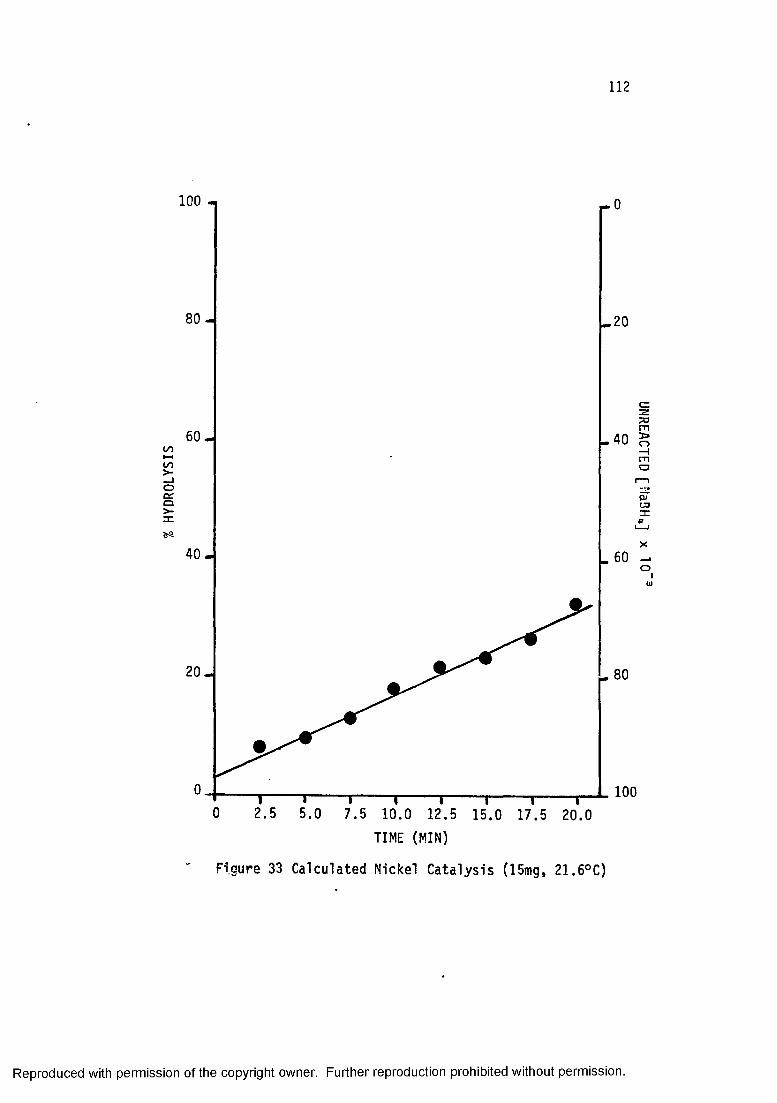
% HY
DROL
YSIS
112
100
80
60
40 - 60
20
0 1000 2.5 5.0 7.5 10.0 12.5 15.0 17.5 20.0
TIME (MIN)
Figure 33 Calculated Nickel Catalysis (15mg, 21.6°C)
Reproduced with permission of the copyright owner. Further reproduction prohibited without permission.
UNREACTED [Na3H„]
x 10

HYDR
OLYS
IS
113
lOOn
80-
60-
40 -
-8020-
0 1 2 3 4 5 6 7 8TIME (MIN)
Figure 34 Calculated Nickel Catalysis (15 mg, 35.0°C)
Reproduced with permission of the copyright owner. Further reproduction prohibited without permission.
UNREACTED [NaBH„]
x 10

114
DISCUSSION AND INTERPRETATION OF DATA
Surface catalysis of the hydrolysis of sodium borohydride is
described by zero order kinetics:
i!I!F L = kM <3C»
Calculated values for the zero order rate constants for each metal
are summarized in Tables XXVI - XXVIII. Cobalt and Raney nickel
catalysis increases at a regular rate dependent on metal
concentration. The calculated value at 21.6°C for nickel catalysis
is consistent with computed values from nickel salt data. Nickel
catalysis appears to be re la t ive ly constant with increasing metal
concentration; however, cata ly tic ac tiv ity decreases with
increasing solution pH.
Activation energies were calculated for the metal catalyzed
hydrolytic path by computing the average slopes of log k versus
the inverse temperature at constant ineta1 concentrations
(Table XXIX, Figures 35-37). Q ualitative ly , activation energies
of the heterogeneous catalyzed hydrolysis are approximately twice
the activation energy of the homogeneous acid accelerated
hydrolysis. Overall, the activation energy of the uncatalyzed
hydrolytic reaction is lowered by approximately five kilocalories
by the addition of a suitable metal.
Reproduced with permission of the copyright owner. Further reproduction prohibited without permission.

Reproduced
with perm
ission of the
copyright ow
ner. Further
reproduction prohibited
without
permission.
TABLE XXVI SUMMARY OF KINETICS - COBALT CATALYSIS OF THE HYDROLYSIS OF NaBHu
WEIGHTMOLES Co „ 1 nn MOLES NaBHu TEMPERATURE kCo- moles
1i t e r ‘mi nlo 9k
Co
15 mg 5.09% a 0.0°C 2.5 + 0.2 X lCT4 -3.60 + 0.04
20 mg 6.79% 3 0.0°C 3.2 + 0.3 X HT1* -3 .49 + 0.03
25 mg 8.48%3 0.0°C 6.0 + 0.3 X lCT4 -3.22 + 0.02
l% b 21.6°C 5.3 + 0.1 X 1CT4 -3 .28 + 0.01
2% b 21.6°C 1.19 + 0.02 X 10" 3 -2 .92 + 0.01
3% b 21.6°C 2.00 + 0.03 X 10" 3 -2 .70 + 0.01
4% b 21.6°C 3.05 + 0.09 X 10" 3 -2 .52 + 0.02
15 mg 5.09%3 21.8°C 4.3 + 0.2 X 10" 3 -2 .37 + 0.02
20 mg 6.79%3 2 2 .1°C 5.8 + 0.3 X 10" 3 -2 .24 + 0.02
25 mg 8.48% 3 22.0°C 7.7 + 0.2 X 10" 3 -2.11 + 0.01
15 mg 5.09%a 35.0°C 1.05 + 0.05 X 10" 2 -1 .98 + 0.02
20 mg 6.79%a 35.0°C 1.6 + 0.1 X 10"2 -1 .80 + 0.03
25 mg 8.48%a 35.0°C 2.02 + 0.09 X 10" 2 -1 .69 + 0.02
a - Buffer = 2N NaOH b - Calculated form CoX2 data
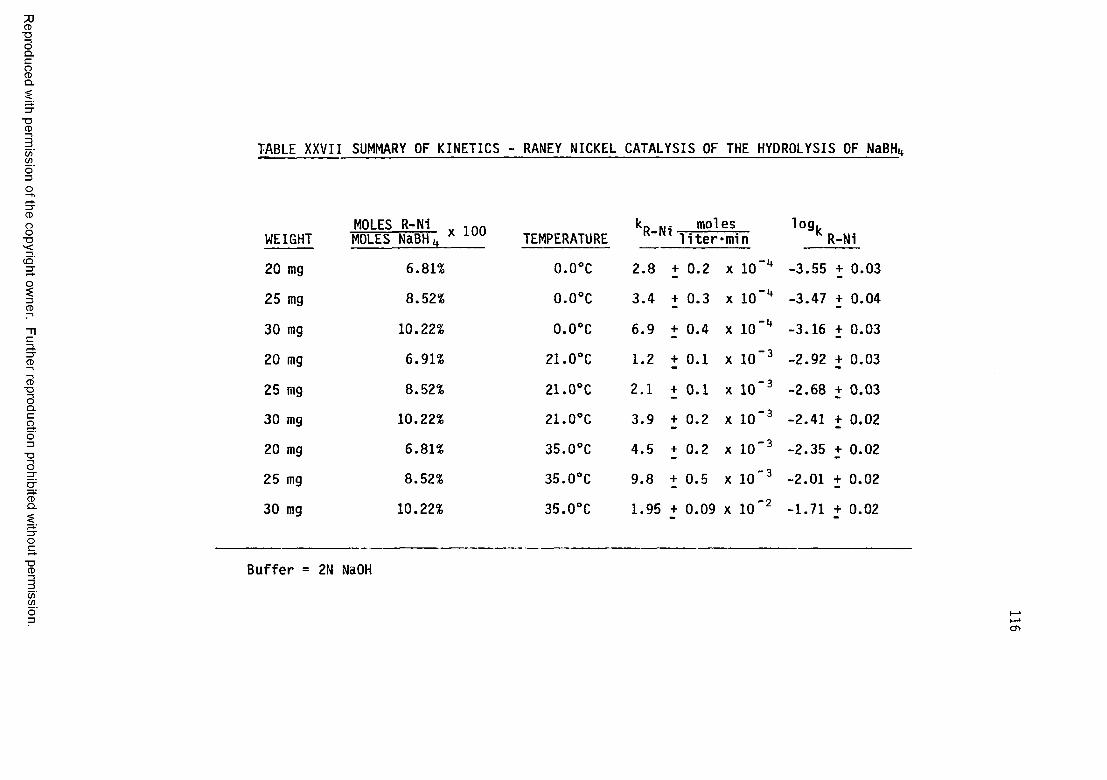
Reproduced
with perm
ission of the
copyright ow
ner. Further
reproduction prohibited
without
permission.
TABLE XXVII SUMMARY OF KINETICS - RANEY NICKEL CATALYSIS OF THE HYDROLYSIS OF NaBHu
MOLES R-Ni , nn moles i° g k K iWEIGHT MOLES NaBH u x 1UU TEMPERATURE l i t e r •min R-Ni
20 mg 6.81% 0.0°C 2.8 + 0.2 X 10“4 -3.55 + 0.03
25 mg 8.52% 0.0°C 3.4 + 0.3 X 10- l* -3 .47 + 0.04
30 mg 10.22% 0.0°C 6.9 + 0.4 X i o _lt -3 .16 + 0.03
20 mg 6.91% 21.0°C 1.2 + 0.1 X 1 0"3 -2 .92 + 0.03
25 mg 8.52% 21.0°C 2.1 + 0.1 X 10"3 -2 .68 + 0.03
30 mg 10.22% 21.0°C 3.9 + 0.2 X 10⁻³ -2.41 + 0.02
20 mg 6.81% 35.0°C 4.5 + 0.2 X 1 0"3 -2.35 + 0.02
25 mg 8.52% 35.0°C 9.8 + 0.5 X 1 0 '3 -2.01 + 0.02
30 mg 10.22% 35.0°C 1.95 + 0.09 X 1 0 '2 -1.71 + 0.02
Buffer = 2N MaOH
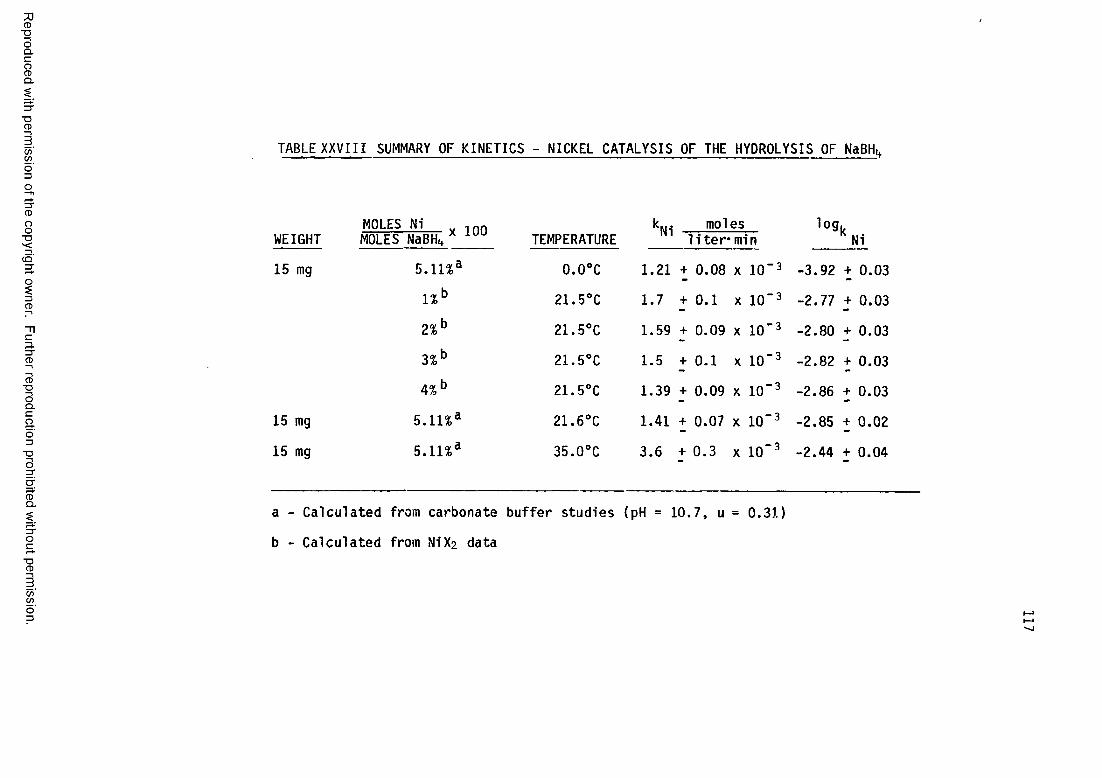
Reproduced
with perm
ission of the
copyright ow
ner. Further
reproduction prohibited
without
permission.
TABLE XXVIII SUMMARY OF KINETICS - NICKEL CATALYSIS OF THE HYDROLYSIS OF NaBHu
MOLES Ni y 1nn kN. moles log.WEIGHT MOLES NaBHi* TEMPERATURE m lite r -m in Ni
15 mg 5.11%a 0.0°C 1.21 + 0.08 X 1 0 "3 -3 .92 + 0.03
l%b 2 1 .5°C 1.7 + 0.1 X 1 0 '3 -2.77 + 0.03
2%b 2 1 .5°C 1.59 + 0.09 X 10"3 -2 .80 + 0.03
3%b 2 1 .5°C 1.5 + 0.1 X 1 0"3 -2.82 + 0.03
4%b 2 1 .5°C 1.39 + 0.09 X 10⁻³ -2.86 + 0.03
15 mg 5.11% a 21.6°C 1.41 + 0.07 X 10"3 -2.85 + 0.02
15 mg 5. ll% a 35.0°C 3.6 + 0.3 X 10"3 -2 .44 + 0.04
a -■ Calculated from carbonate buffer studies (pH = :LO. 7, u — 0.31)
b - Calculated from NiX2 data

118
TABLE XXIX TEMPERATURE DEPENDENCE OF THE METAL CATALYSIS OF THE
HYDROLYSIS OF SODIUM BOROHYDRIDE
CATALYST Ea (kcal)
Co 1 8 + 1
Ni 1 7 + 2
Raney Ni 1 5 + 2
Uncatalyzed Path ~ 21
109 kM = " 2.3033 (R) (T) + 1og A
where A = 1.0 + 0.3 x 10¹¹for cobalt
4 .8 + 0.2 x 10⁹ for nickel
4 + 2 x 10⁸ for Raney nickel
Reproduced with permission of the copyright owner. Further reproduction prohibited without permission.

119
in © in«-H CM CM
■ o •
to CM CO o
Reproduced with permission of the copyright owner. Further reproduction prohibited without permission.
Figu
re
35 Te
mpe
ratu
re
Depe
nden
ce
Of k

120
Reproduced with permission of the copyright owner. Further reproduction prohibited without permission.
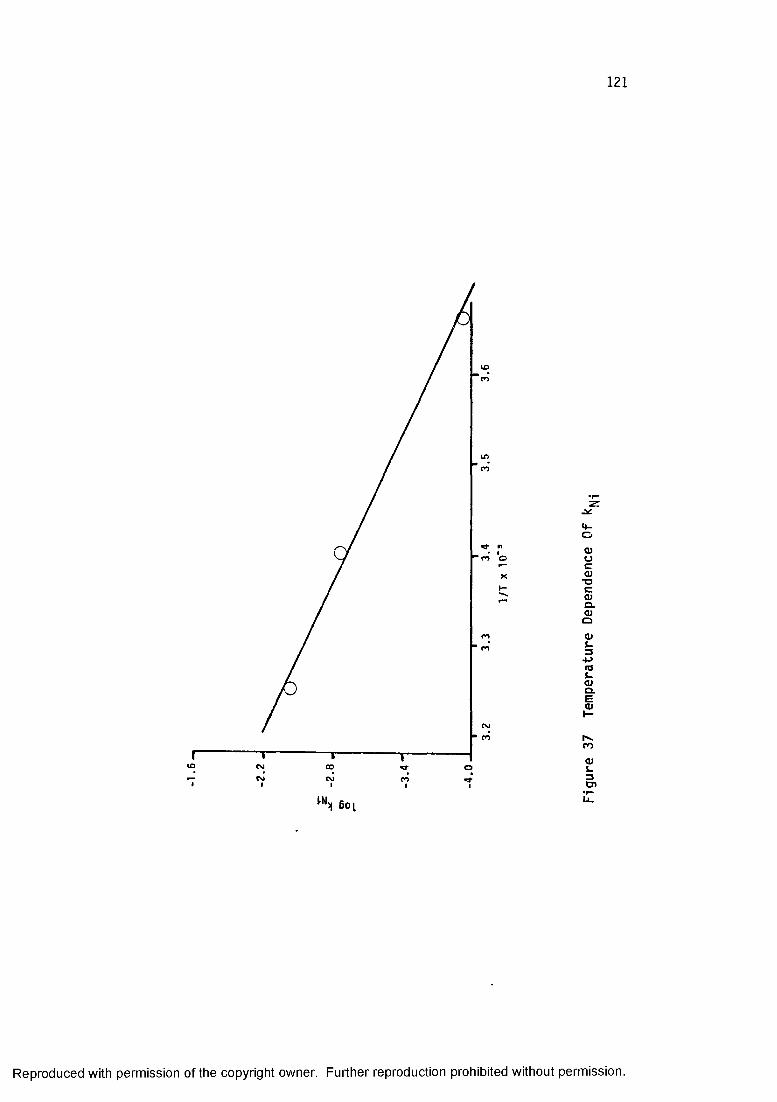
121
CO
CVJ CO o
*4-Oooc0)*oc<DCL0JO0)s-34-><0S.CJQ .E0J
r .co0)&-3cn
IN.H 6oi
Reproduced with permission of the copyright owner. Further reproduction prohibited without permission.

122
K.A. Holbrook and P.J. Twist studied the cobalt- and
nickel-boron a lloy catalyzed solvolysis of sodium borohydride by
measurement of hydrogen gas evolved57. When the reactions were
carried out in deuterium oxide, 50% of the gas produced originated
from the borohydride and the other 50% from the solvent. Deuterium
content of the generated gas increased with the extent of
solvolysis. Preferential hydrogen evolution occurred in mixed
H20/D20 experiments; 8.5 fo r the nickel-boron a llo y and 9.2 fo r the
cobalt-boron a llo y were the calculated isotope spearation
fac to rs57. Holbrook and Twist proposed the following mechanism for
alkaline D20 media that accounted for the observed zero order
kinetics and deuterium effects (M represents a surface s ite on the
cata lyst):
HI
2M + BH + H - B - H" + H (31)M M
MbH3 2 B H 3 + M + ej (32)
b h3 + od + bh3od (33)
M + ejj + D20 -*■ M - D + OD- (34)
M - H + M - D -* 2M + HD (35)
Reproduced with permission of the copyright owner. Further reproduction prohibited without permission.
123
The negatively charged borohydride species undergoes reversible
dissociative chemisorption (Reaction 33). Borane is subsequently
rapid ly hydrolyzed in the analogous fashion proposed for the acid
accelerated mechanism (formation of deuteroxyborane intermediate).
This hypothetical mechanism can be used to account for the
reduction of M2+ to M° by sodium borohydride. The presence of an
intermediate containing boron, such as MBH3 , may explain the
presence of boron in the precipitated m etal57.
CONCLUSIONS
N ickel, cobalt, and Raney nickel enhance the rate of sodium
borohydride hydrolysis by means of zero order surface catalysis .
Ranges of metal catalysis have been determined. Furthermore,
activation energies have been calculated for the heterogeneous path
and compared to the activation energy of the homogeneous path.
Metal surface catalysis has been quantified in terms of k inetics,
metal concentration, and temperature. Metal sa lt effects on the
hydrolysis of sodium borohydride can be calculated from the
corresponding metal catalysis and acid acceleration data.
Reproduced with permission of the copyright owner. Further reproduction prohibited without permission.

CHAPTER V FUEL CELL APPLICATIONS
124
Reproduced with permission of the copyright owner. Further reproduction prohibited without permission.

125
INTRODUCTION
Quantification of the hydrolytic rate of sodium borohydride
with various accelerators and catalysts has been mathematically
characterized in the previous chapters. The preceding data,
calculations, and discussions verify the fe a s ib ility of generating
borohydride-source hydrogen at a controllable, useable rate .
Operation of a hydrogen/oxygen fuel cell u t il iz in g sodium
borohydride as an ind irect fuel was a secondary objective of th is
research. A re la tiv e ly simple glass device was designed and
subsequently operated with:
1) Either cylinder hydrogen/cylinder oxygen or
borohydride-source hydrogen/cylinder oxygen as fuels ,
2) A potassium hydroxide e lec tro ly tic solution,
3) Platinum black electroplated electrodes.
Relative cell efficiences were establised versus theoretical
voltages over a sixty degree range in temperature.
HYDROGEN/OXYGEN FUEL CELL BASICS
A fuel cell may be conveniently described as a type of
sophisticated battery. Both fuel cells and batteries convert
chemical energy into d irect current e lectrica l voltage. Chemical
batteries may be c lassified into two catagories3 :
Reproduced with permission of the copyright owner. Further reproduction prohibited without permission.

126
1) Primary batteries ( i . e . , flash lig h t batteries) consume a
specific amount of fuel as current is produced. When the
fuel is completely expended, the battery is 'dead' and is
usually discarded.
2) Secondary batteries ( i . e . , lead-acid storage batteries in
automobiles) also consume a fixed quantity of fu e l.
However, the chemical constituents of the fuel can be
regenerated with the application of an e le c tr ic current.
Ineffic iency (less than 100%) of regeneration coupled with
plate (electrode) deterioration lim its the number of
successive recharge cycles.
In contrast, fuel ce lls w ill convert chemical energy into
e le c tric a l energy without intermission; there is a continuous
external fuel source supply. Basic processes in an alkaline fuel
cell are summarized in the succeeding sections.
Fuel (Hydrogen) Electrode Process3
Hydrogen gas is passed into the ce ll and adsorbed onto the
surface of the platinum electrode (anode). P rior to
electrochemical combination, adsorbed molecular hydrogen is s p lit
into atomic hydrogen.
H2 (externally supplied) -+ H2 (adsorbed) (36)
H2 (adsorbed) -+ 2H (adsorbed) (37)
Hydroxyl ions from the a lka line e le c tro ly tic solution are
transported onto the e lectrocata lyst and combine with hydrogen to
Reproduced with permission of the copyright owner. Further reproduction prohibited without permission.

127
produce water and two electrons.
2H (adsorbed) + 2 OH" -*■ H20 + 2e" (38)
The net fuel electrode process can be summarized as:
H2 + 2 OH- 2HZ0 + 2e" (39)
Oxidant (Oxygen) Electrode Process3
Oxygen gas is passed into the cell and adsorbed onto the
surface of the platinum electrode (cathode).
0 2 (externally supplied) -> 02 (adsorbed) (40)
Water and electrons (from the fuel electrode) combine with the
chemisorbed oxygen to produce peroxide and hydroxide ions.
0 2 (adsorbed) + H20 + 2e" -> 00H" + OH" (41)
The peroxide anion is c a ta ly tic a lly decomposed on the electrode
surface to give hydroxide and free oxygen.
00H" -+ OH" + 1 /202 (42)
The net oxidant electrode process is summarized as:
1 /202 + H20 + 2e" + 2 OH" (43)
Function of the E lectro lyte (KOH) and the Salt Bridge (KCl/Agar)
Potassium hydroxide, as the e le c tro ly tic solution, acts as a
hydroxide ion and water storage medium. The potassium
chloride/agar sa lt bridge is an ion transporter and prevents
hydrogen and oxygen from d ire c tly mixing.
Reproduced with permission of the copyright owner. Further reproduction prohibited without permission.

128
Overall Fuel Cell Process
Hydrogen and oxygen are supplied to a fuel ce ll to produce
water and a voltage. Conducting the electron flow through an
external e lec trica l c irc u it allows the cell to perform useful
work.
Hydrogen Electrode: H2 + 2 OH- -+ 2 H2 O + 2e (44)
Oxygen Electrode: I / 2 O2 + H2 O + 2e" -»■ 2 OH (45)
Net Reaction: H2 + l /2 0 2 H20 (46)
A schematic of a simple hydrogen/oxygen fuel cell is presented in
Figure 38.
EQUIPMENT AND CHEMICALS
Constant Voltage Supply - Heathkit Model IP-27 Regulated Low
Voltage Power Supply
Thermostat - Sargent Welch Model ST Thermonitor (±0.05°C)
Potentiometric Set-Up - Leeds and Northrup Model K-3
Potentiometric Bridge
-Two Mallory 1.5 volt Batteries
-Eppley Standard Cadmium Cell
-Rubicon Null Detector
Cylinder H 2 and 0 2 - Ultrapure Grade; Extremely Dry (<1 ppm H20)
Sodium Borohydride - 98+% (Aldrich Chemical Company)
E lectro lyte Solution - IN Potassium Hydroxide
Reproduced with permission of the copyright owner. Further reproduction prohibited without permission.

HY
DR
OG
EM
G
AS
129
e l e c t r i c a lLOAD
UJ VO LTM ETER
OH - OH'OH
4rO,OH + i o —OH OH
OH
FUELELECTRODE
POTASSIUM HYDROXIDE
E L E C T R O L Y T EOXYGEN
ELECTRODE
Figure 38 Simple H2/0 2 Fuel Cell Schematic
Reproduced with permission of the copyright owner. Further reproduction prohibited without permission.
OX
YG
EN
G
AS

130
Salt Bridge - Potassium chloride/Agar
EXPERIMENTAL
Platinum black was electrodeposited on the cell electrodes
using the constant voltage source (15 vo lts , 100 milliamperes) and
a 1% solution of te trach lo rp la tin ic acid (H2PtCl1+). The fuel cell
was purposely designed as an open system; therefore, a ll cell
measurements were carried out under atmospheric pressure. The
following procedure was employed to obtain a cell voltage reading:
1) Both reaction vessels were evacuated
2) Cylinder hydrogen and oxygen were bubbled through the cell
saturating the e lectro ly te
3) The cell was thermostatted for a minimum of th ir ty minutes
with the gases streaming.
4) The potentiometric bridge was standardized
5) Cylinder H2 and 02 were electrochemically combined to
establish a baseline of fuel cell performance. Actual
cell voltages were recorded when the applied voltage
varied by less than 0.05% (five places in the fourth
decimal place).
In a second set of experiments a fte r the cell was saturated
and thermostatted, borohydride-source hydrogen was substituted for
the cylinder hydrogen. Sodium borohydride was dissolved in IN
potassium hydroxide. With the cylinder hydrogen streaming, the
reaction vessel was opened. Sulfuric acid was quickly added to
Reproduced with permission of the copyright owner. Further reproduction prohibited without permission.
131
libe ra te hydrogen from the borohydride solution. With the reaction
vessel restoppered and external hydrogen disenaged, the fuel cell
was operative on borohydride-source H2. Experiments results are
presented in Table XXX.
Reproduced with permission of the copyright owner. Further reproduction prohibited without permission.

132
TABLE XXX EXPERIMENTAL VOLTAGES
VOLTAGETEMP (PURE H?/09) TEMP
0°C 1.0631 v
5°C 1.0883 v 6°C
10°C 1.0978 v 9°C
15°C 1.1064 v 12°C
20°C 1.1070 v 20 °C
25°C 1.1056 v 25°C
30 °C 1.1041 v 30 °C
35°C 1.1012 v 35°C
40°C 1.0962 v 40°C
45°C 1.0912 v 45 °C
50°C 1.0845 v 50°C
54°C 1.0811 v
57°C 1.0741 v
Pressure = 767.5 mm Hg
VOLTAGE
(BHu * H2 /O2 )
1.0089 v
1.0304 v
1.0571 v
1.0604 v
1.0575 v
1.0502 v
1.0467 v
1.0418 v
1.0362 v
1.0316 v
Reproduced with permission of the copyright owner. Further reproduction prohibited without permission.

133
DISCUSSION AND INTERPRETATION OF DATA
The re la tiv e effic iencies of the experimental fuel cell were
computed by comparison to the theoretical voltages calculated from
the following thermodynamic re lationships56:
dG = VdP - SdT (47)
The relationship of free energy to temperature at constant pressure
is equal to the entropy.
/ dG \ _ c f dAG°\ _ , r o( dT>P - - s --------- * l ' d r ,p - ' 4S
Substituting the relationship between free energy and electromotive
force yields the slope of a plot between EMF and temperature.
AG° = nFE° (49)
dE aS°dT p = nF w*1ere n e9ual s the number of electrons (50)
transferred in the reaction, and F equals
Faraday's Constant.
Integrating equation 50 between two temperatures, y ie lds ,
I f° = w f h ° d T < 5 1 >*1 ' l
Substituting the known theoretical voltage at 298K, and taking into
account the variance in enthalpy with a change in temperature,
E°t = 1.2290v + 4 J C 1’ U s° + dT) dT (52)" *298 298 ^
( ^ ■ ) p sim plifies to ACp°/T (53)
Reproduced with permission of the copyright owner. Further reproduction prohibited without permission.

134
Combining the preceding equations yields
E* . 1.2290V t l U S ' ( T 2 - 298) t / T2/ T2f ^ dT dT] (54)298 298 T
where aS° = S°(H20 )£ - AS°(H2)g - l/2AS°(02)g (55a)
and ACp° = Cp°(H20 )i - Cp°(H2)g - l/2C p° (0 2)g (55b)
where C o(H20 )5 = 18.04 c a l/ mole (55c)
Cp°(H2)g = 6.52 + 0.78 x lCf 3T + 0.12 x 10 T '2 (55d)
Cp° (0 2)g = 7.16 + 1.00 x 10"3T + 0.40 x 10 T"2 (55e)
Values of ACp° varied by less than 1% w ithin the temperature
range investigated. Therefore, ACp° was considered constant and
equation 54 sim plifies to the following equation a fte r integration:
ET2= l2290v + HF aS°(T2 * 298) + aCp°^9 ln Jiff - Jiff) + ^Theoretical voltages are presented in Table XXXI. Experimental
and theoretical voltages are graphically depicted in Figure 39.
Calculated cell e ffic ienc ies are summarized in Table XXXII
(Borohydride-source hydrogen is compared to both theoretical
calculations and cylinder hydrogen experiments).
Reproduced with permission of the copyright owner. Further reproduction prohibited without permission.
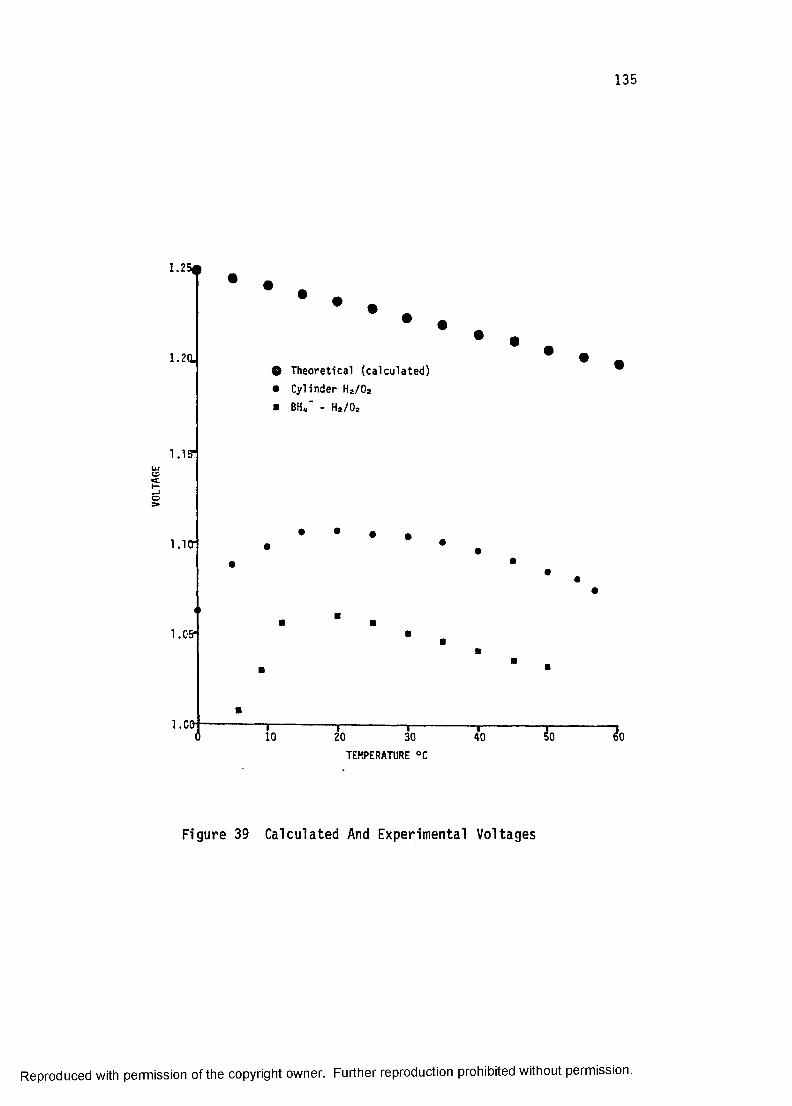
VOLT
AGE
135
1 .2 5 #
* • .• •
1.2QJ • -# Theoretical (ca lcu la ted)
• Cylinder H2/0 *
■ BHU - H2 /O2
1.13-
1.05"
1 .0(H |----------------------|----------------------j----------------------,---------------------3----------------------j10 20 30 40 50 60
TEMPERATURE °C
Figure 39 Calculated And Experimental Voltages
Reproduced with permission of the copyright owner. Further reproduction prohibited without permission.
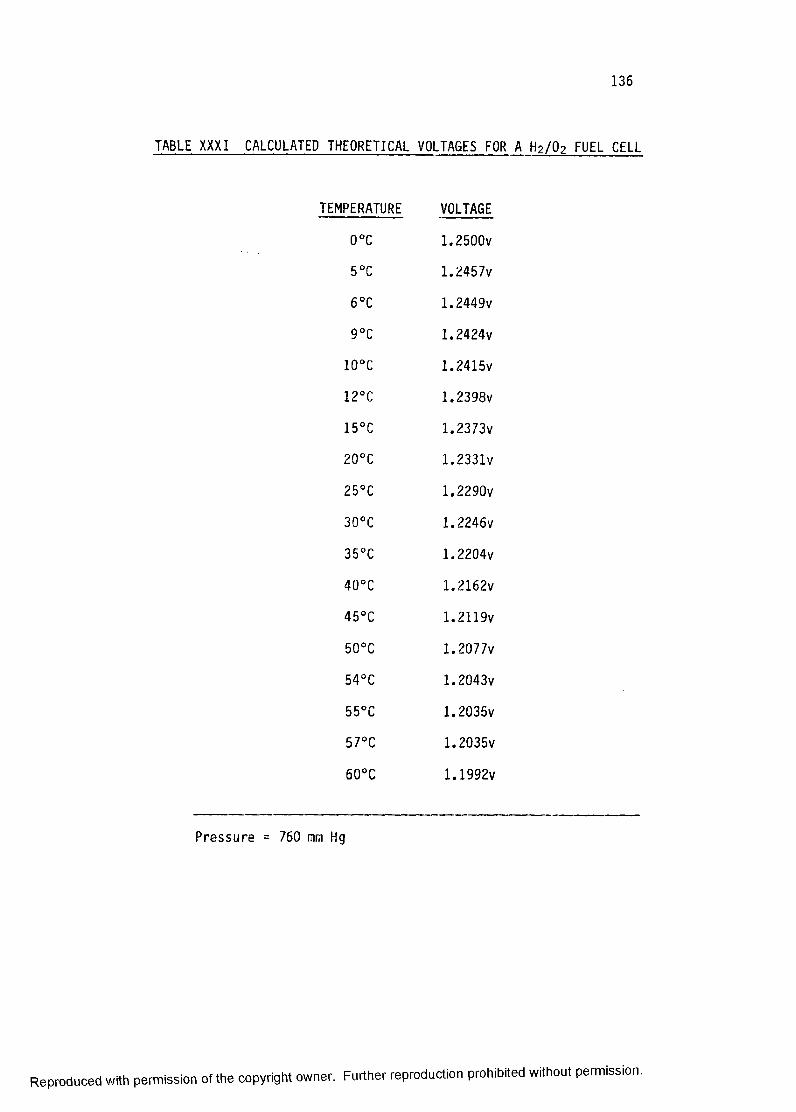
136
TABLE XXXI CALCULATED THEORETICAL VOLTAGES FOR A H2/0 2 FUEL CELL
PERATURE VOLTAGE
0°C 1.2500v
5°C 1.2457V
6°C 1.2449V
9°C 1.2424v
10°C 1.2415V
12°C 1.2398V
15°C 1.2373V
20°C 1.2331V
25°C 1.2290V
30°C 1.2246V
35°C 1.2204V
40°C 1.2162V
45°C 1.2119v
50°C 1.2077V
54°C 1.2043v
55°C 1.2035V
57°C 1.2035V
60°C 1.1992V
Pressure = 760 inm Hg
Reproduced with permission of the copyright owner. Further reproduction prohibited without permission.

137
TABLE XXXII CALCULATED CELL EFFICIENCIES
Cylinder H2/02 -»• H2/ 0 2TEMP vs. Theoretical vs. Theoretical vs. Cylinder H2/0 2
o°c 85.05%
5°C 87.36%
6°C 81.04% 92.54%
9°C 82.93% 94.02%
10°C 88.42%
12°C 85.26% 95.99%
15°C 89.42%
20°C 89.78% 86.00% 95.99%
25°C 89.96% 86.05% 95.65%
30°C 90.16% 85.76% 95.12%
35°C 90.23% 85.77% 95.05%
40°C 90.14% 85.66% 95.03%
45°C 90.04% 85.50% 94.96%
50°C 89.80% 85.42% 95.12%
54°C 89.69%
57°C 89.37%
AVG % EFFIC 89 ±1% 85 ±2% 95 ±1%
Atmospheric pressure
Reproduced with permission of the copyright owner. Further reproduction prohibited without permission.

138
Theoretical calculations demonstrate a constant decrease in
voltage with increasing temperature (entropy is decreasing).
Actual experimental data exhibit an increase in voltage up to 25°C
followed by a steady decrease. Conductivity of platinum increases
while gas s o lu b ility decreases with increasing temperaure. The two
effects are counterbalancing at temperatures greater than 25°C,
although the dissolution of the gases predominates. At lower
temperatures, the increase in conductivity (decrease in
re s is t iv ity ) is the controlling parameter.
CONCLUSION
Sodium borohydride has been demonstrated to be a viable source
fo r fuel cell hydrogen. A rather unsophisticated device has
exhibited effic iencies of greater than 85%. Engineering advances
in fuel cell technology coupled with the controlled generation of
hydrogen from sodium borohydride offers a highly e ffic ie n t chemical
energy to e lec trica l energy conversion a lte rn ative . Basic
economic considerations concerning the cost of hydrogen production
are discussed in Appendix I .
Reproduced with permission of the copyright owner. Further reproduction prohibited without permission.

CHAPTER VI FINAL CONCLUSIONS AND RECOMMENDATIONS
139
Reproduced with permission of the copyright owner. Further reproduction prohibited without permission.

140
Hydrogen has been generated from sodium borohydride at safe,
useable, controlled rates. The effects of various acids and
trans ition metals (and th e ir salts) on the hydrolysis of sodium
borohydride have been mathematically characterized and quantified.
An operational fuel cell was designed and operated (>85% e ffic iency )
with borohydride - source hydrogen.
Costs of producing sodium borohydride are d irec tly associated
with the price structure of fossil fuels and e le c tr ic ity .
Inexpensive solar e le c tr ic ity would enhance the v ia b ili ty of using
sodium borohydride as a hydrogen transport. Additional
considerations for the prospects of sodium borohydride as a fuel
ce ll source include:
1) Use of recoverable heterogeneous hydrogen generation
cata lysts , sp ec ifica lly ,
a) Regenerative organic polysulfate resins, and/or
b) Low or zero valent transition metal complexes on
supports ( i . e . , compounds that can successively undergo
oxidative addition followed by reductive elim ination ).
2) Recycling of waste boric acid back to borohydride. ( i . e . , a
lower energy and cost intensive process than the high
temperature reduction of borates). Conceivably, borates
could be reduced in non-aqueous or molten sa lt media with a
large hydrogen overvoltage.
Further experimentation in these aforementioned directions w ill
hopefully establish sodium borohydride as a viable source of fuel
cell hydrogen.
Reproduced with permission of the copyright owner. Further reproduction prohibited without permission.

APPENDIX I HYDROGEN PRODUCTION
141
Reproduced with permission of the copyright owner. Further reproduction prohibited without permission.

142
INTRODUCTION
Sodium borohydride is presently produced from high temperature
and pressure reduction of boric acid with sodium hydride. The
economic v ia b ility of sodium borohydride as a fuel ce ll source is
d irec tly proportional to the manufacturing cost of hydrogen.
Hydrogen is presently prepared by three basically d ifferen t
techniques:
1) Electrochemical s p litt in g of water
2) Thermal decomposition of water
3) Hydrocarbon reformation
These three processes are subsequently reviewed and the re la tive
economics of hydrogen production b rie fly compared.
ELECTROLYSIS OF MATER
H is to rica lly , electro lysis of water was u tilize d to produce
hydrogen by Nicholson and C arlis le in 180057. Oerlikon Engineering
Company installed the f i r s t commerical water electro lyzer at the
turn of the twentieth century57. Eighty years of s ignificant
improvements have advanced the technology of the electrochemical
decomposition of water into its constituent elements.
Basics of Water Electrolysis5 7
Water is electrolyzed when a direct current is conducted
between two electrodes immersed in an aqueous e lec tro ly tic
Reproduced with permission of the copyright owner. Further reproduction prohibited without permission.
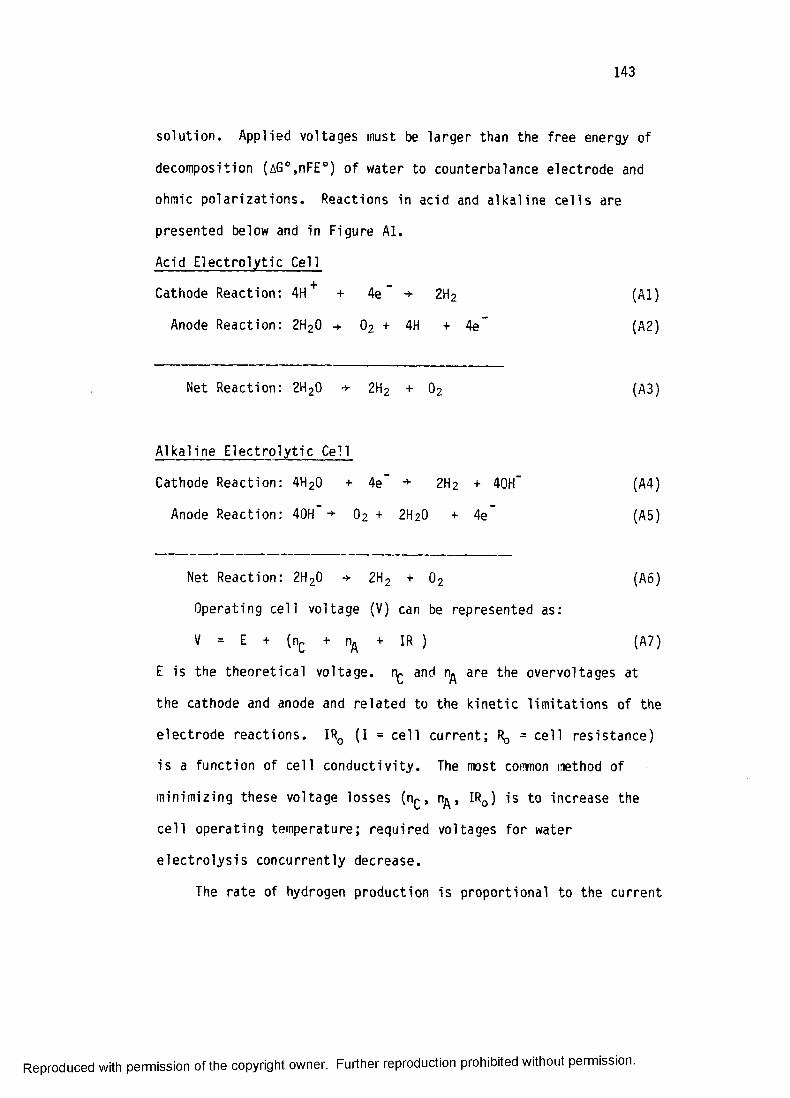
143
solution. Applied voltages must be larger than the free energy of
decomposition (AG°,nFE°) of water to counterbalance electrode and
ohmic polarizations. Reactions in acid and alkaline ce lls are
presented below and in Figure Al.
Acid E lec tro ly tic Cell
Cathode Reaction: 4H+ + 4e " ZH2 (Al)
Anode Reaction: 2H20 -► 02 + 4H + 4e” (A2)
Net Reaction: 2H20 -* 2H2 + 02 (A3)
Alkaline E lectro ly tic Cell
Cathode Reaction: 4H20 + 4e + 2 H2 + 40H" (A4)
Anode Reaction: 40H -»■ O2 + 2 H2O + 4e (A5)
Net Reaction: 2H20 -> 2H2 + 02 (A6 )
Operating cell voltage (V) can be represented as:
V = E + (nc + nA + IR ) (A7)
E is the theoretical voltage, r . and nA are the overvoltages at
the cathode and anode and related to the kinetic lim itations of the
electrode reactions. IR0 ( I = ce ll current; Rq = cell resistance)
is a function of cell conductivity. The most common method of
minimizing these voltage losses (nc , nft , IR0 ) is to increase the
ce ll operating temperature; required voltages for water
elec tro lys is concurrently decrease.
The rate of hydrogen production is proportional to the current
Reproduced with permission of the copyright owner. Further reproduction prohibited without permission.

144
(O H ')j
Cathode 4e + 2 H ,0 - 2H_ + 40H "
Diaphragm Alkaline Electrolyte Anode4 0 H * 2
(a) A LK A LIN E ELECTROLYTE
Cathode
4e + 4H + - 2 H .Anode
2 H ,0 - 0 , + 4H + + 4eDiaphragm Acid Electrolyte
lb) A C ID ELECTROLYTE
Figure Al Acid and Alkaline E lectro lyte Processes57
Reproduced with permission of the copyright owner. Further reproduction prohibited without permission.

145
passing through the e lec tro ly tic c e ll.
H2 Rate a I (A8 )
Therefore, the rate of hydrogen production per unit of cell area is
proportional to the current density (J ).
H2 Rate j , .Cell Area 0
Costs of electro lysis modules are d irectly proportional to the
capital investment per unit cell and ind irectly proportional to the
H2 Rate/cell area ra tio .
Cost a l / c e ] l (A10)
Increasing the current density of an e lec tro ly tic cell decreases
the e ffective costs. Plots of current density versus voltage
(polarization curves) are an important consideration in the
economics of water e lec tro lys is . Current density increases with
voltage (decreases with temperature) and effects the overall cost
structure to a greater degree than voltage losses. Therefore,
maximization of current density is a major objective of a ll
electro lyzer methodologies. Present and projected polarization
parameters are p ic to r ia lly depicted in Figure A2.
Many commercial water electrolyzers are currently available.
A simple schematic of a basic industrial e lec tro ly tic hydrogen
plant is illu s tra te d in Figure A3. Hydrogen production by the
electro lysis of water is simple, non-polluting, and yields an
extremely pure product. H is to ric a lly , the electrochemical
decomposition of water has been lim ited by the re la tiv e ly high
costs of e le c tr ic ity versus natural gas (steam reformation of
Reproduced with permission of the copyright owner. Further reproduction prohibited without permission.

146
Current Density (A /m 2)
2000 3nnn
Commercial Technology
Siate of ihe Ari (Commercial i n n e a r t e r m )
2 1.8
Projected for 1980-85
\k M* '7
200 300Current Density (ASF)
- 400 500
Figure A2 Present And Future Polarization Parameters57
Reproduced with permission of the copyright owner. Further reproduction prohibited without permission.
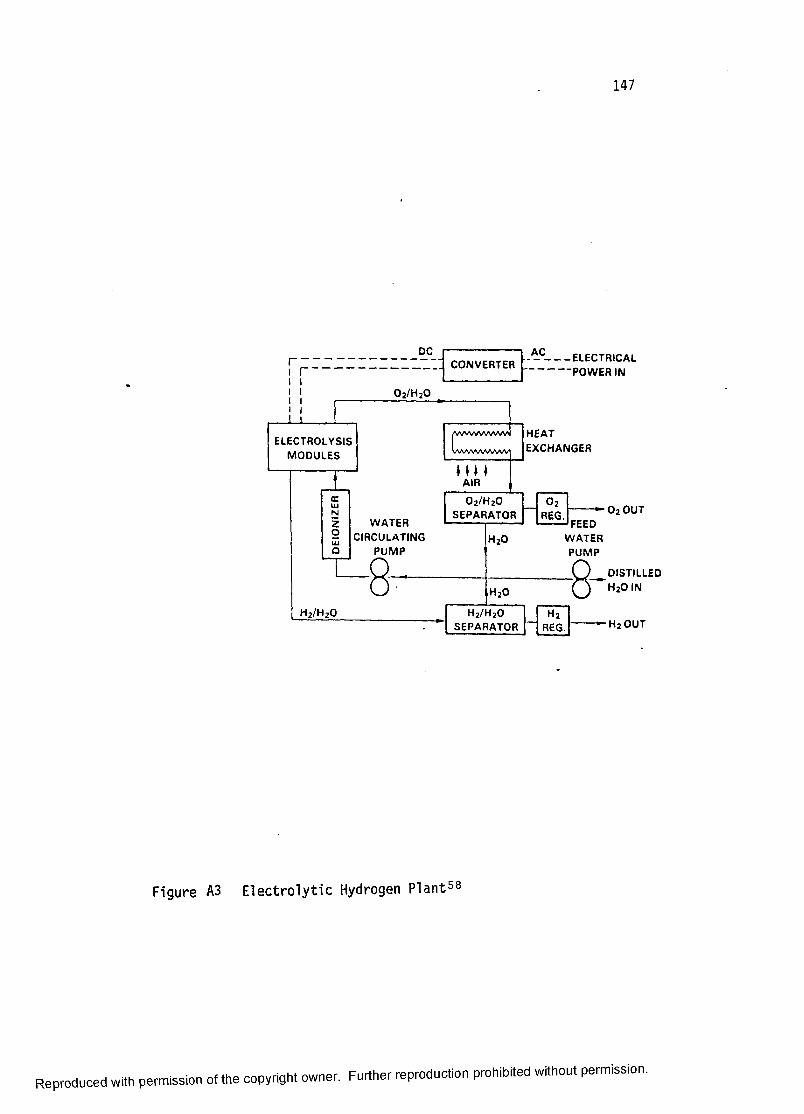
147
DC AC ELECTRICAL PO W ER IN
CONVERTER
HEATEXCHANGER
ELECTROLYSISM O D U LES
AIR
0 2/H 20SEPARATOR REG.
W A TE RC IR CU LATIN G
P U M P
J FEEDW A TE RP U M P
DISTILLEDH 2O INH 20
h 2/ h 2o
SEPARATOR REG.
Figure A3 E lec tro ly tic Hydrogen P lant5 8
Reproduced with permission of the copyright owner. Further reproduction prohibited without permission.
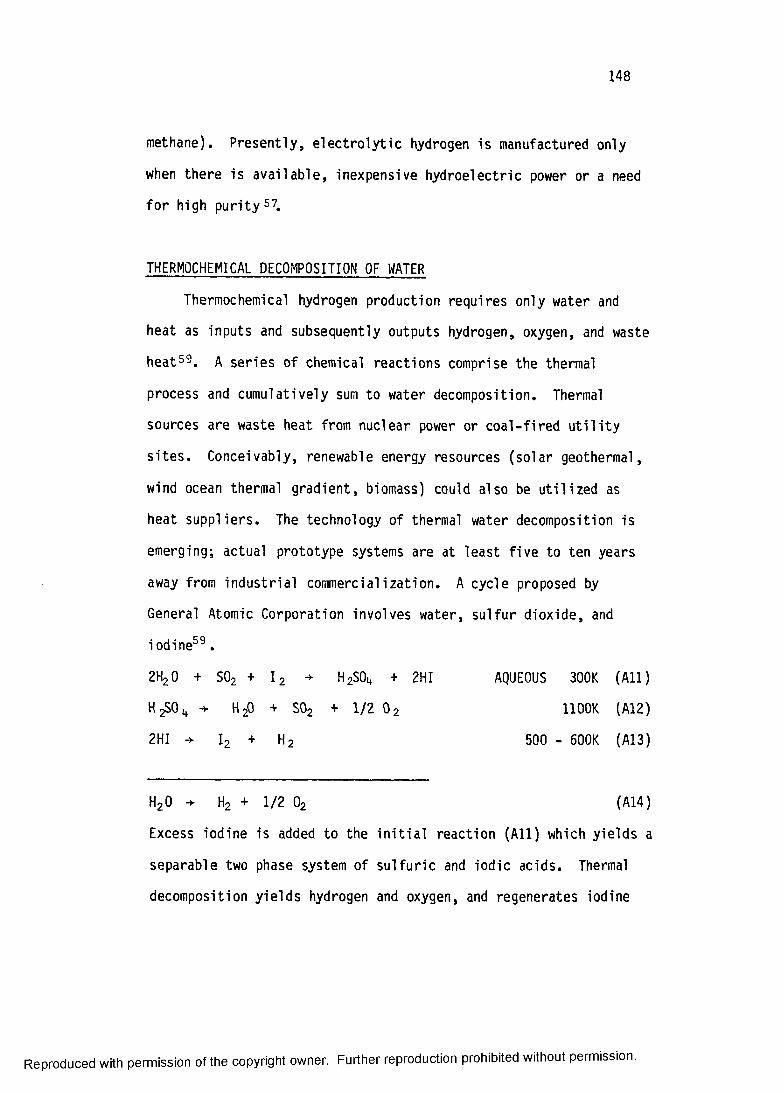
148
methane). Presently, e le c tro ly tic hydrogen is manufactured only
when there is ava ilab le , inexpensive hydroelectric power or a need
fo r high p u r ity 57.
THERMOCHEMICAL DECOMPOSITION OF WATER
Thermochemical hydrogen production requires only water and
heat as inputs and subsequently outputs hydrogen, oxygen, and waste
heat59. A series of chemical reactions comprise the thermal
process and cumulatively sum to water decomposition. Thermal
sources are waste heat from nuclear power or coa l-fired u t i l i t y
s ite s . Conceivably, renewable energy resources (solar geothermal,
wind ocean thermal gradient, biomass) could also be u tiliz e d as
heat suppliers. The technology of thermal water decomposition is
emerging; actual prototype systems are at least five to ten years
away from industrial commercialization. A cycle proposed by
General Atomic Corporation involves water, sulfur dioxide, and
i odine59.
2H2 0 + S02 + 12 ■* H^Oi* + 2HI AQUEOUS 300K (A ll)
-v H20 + S02 + 1/2 0 2 HOOK (A12)
2HI -v I 2 + H2 500 - 600K (A13)
H20 H2 + 1/2 02 (A14)
Excess iodine is added to the in it ia l reaction (A ll) which yields a
separable two phase system of su lfuric and iodic acids. Thermal
decomposition yields hydrogen and oxygen, and regenerates iodine
Reproduced with permission of the copyright owner. Further reproduction prohibited without permission.

149
TABLE Al PROPOSED THERMOCHEMICAL CYCLES5 9
Hg + 2HBr ■+■ HgBr2 + H 2
HgBr2 + SrO -*■ SrBr2 + Hg + 1/2 02
SrBr2 + H20 -*■ SrO + 2HBr
3FeCl2 + 4H2Q -> F63 0,* + 6HC1 + H2
Fe30 4 + 8HC1 + 3FeCl 2 + Cl2 + 4H20
H20 + Cl 2 + 2HC1 + 1/2 02
CH + H20 CO + 3H2
CO + 2H2 + CHgOH
ch3oh + so2 + h2o + h2so4 + ch4
H2 S01+ H20 + S02 + 1/2 02
1.5SC + H20 -> H2S04 = 0.5S
H2 SO4 + H20 + S02 + 1/2 02
1.5S + H20 -*■ H2S + 0.5S02
H2S -*■ H2 + S
0.25BaS + H20 -► O^BaSO^ + H2
0.258850^ + 0.5S + 0.25BaS + 0.5S02
2.5S02 + ^e2 0 3 **■ 2FeS0lt + 0.5S
2FeS0lt -> Fe2 03 + 2S02 + 1/2 02
All cycles sum to the decomposition of water H20 H2 + 1/2 02
Reproduced with permission of the copyright owner. Further reproduction prohibited without permission.

150
and sulfur dioxide for recycle. Westinghouse proposed a modified
two stage hybrid e lectro lytic /therm al process using sulfur
dioxide 58.
2H2 0 + S02 + H2S04 + H2 ELECTROLYSIS 300K (A15)
H2 S0i4 + H20 + S04 + 1 /2 02 1100K (A16)
H20 -*■ H2 + 1/2 02 (A17)
A representative selection of other postulated multistage processes
(net reaction = decomposition of H2 O) is compiled in Table Al.
•The chemistry and thermodynamics of these cycles are sound; however,
in d u stria liza tio n is purely speculative. Thermochemical s p littin g
of water has received much attention due to the 'fre e ' use of waste
heat from existing power generating s ites . Cogeneration of
hydrogen (storage of e le c tr ic ity ) e ffe c tive ly reduces power costs.
REFORMATION OF HYDROCARBONS
Thermal reformations of hydrocarbons u t il iz e the reaction of
fossil fuels (or residuals) with oxygen and/or steam to produce
hydrogen. Table A ll compares four basic commerical processes of
carbonaceous-source hydrogen production.
C atalytic Decomposition of Methane
Within the proper thermal and ca ta ly tic environment, methane
can be converted d ire c tly to hydrogen and carbon.
CH4 -> C + 2H2 (A18)
In addition to lowering the activation energy of reaction A18, the
catalyst removes the carbon residue from the reactor. Subsequent
Reproduced with permission of the copyright owner. Further reproduction prohibited without permission.

151
de-coking simultaneously cleans and reheats the catalyst to the
reaction temperature. C atalytic decomposition of methane into its
elements produces 95% pure hydrogen^o.
Steam - Iron Process (Figure A4)
Passing high temperature steam over a low-stoichiometric iron
oxide (wustite) y ie lds a mixture of high purity (98%) hydrogen,
unreacted steam, and oxidized iron. Carbon monoxide reductively
regenerates the iron ca ta lys t60.
3.168Fe0>9470 + 0.832H20 t Fe304 + 0.832H2 (A19)
0.947Fe3( \ + 0.788C0 -* 3Fe0. 9„70 + 0.788C02 (A20)
Steam Reforming (Figure A5)
Hydrocarbons are reacted with steam to produce hydrogen and
carbon monoxide. Part of the hydrocarbon source material is
externa lly combusted to generate the thermal requirements.
Subsequent u t il iz a tio n of the water gas s h ift reaction produces
even more hydrogen. Although th is method is generally used with
methane and naptha feedstocks, the reaction can be generalized:
P artia l Oxidation (Figure A6)
High temperature steam or oxygen and fuel are
stoich iom etrically combined such that partia l oxidation of the
hydrocarbon to carbon monoxide is the main product. Lower
temperature partia l oxidations are possible with catalyst addition.
Hydrogen production is subsidized by the water gas s h ift reaction60.
CnH2 n+2 + nH2° nCO + (2n + 1)H2
"CO ♦ nHjO - nC02 ♦ „h 2
(A21)
(A22)
Reproduced with permission of the copyright owner. Further reproduction prohibited without permission.

152
nCnHm + H2° * CO + (1 + 2 r> ) H2 (A23)
CnH» * 7 ° 2 * "C0 * ? H2 (A24)
The Koppers-Totzek Process is a specific modification of partia l
oxidation. Pulverized coal is oxidized by a combination of steam
and oxygen at atmospheric pressure to y ie ld 97.5% pure hydrogen60.
Figure A7 summarizes the basic processing steps and feed stock
materials for each of the carbonaceous-source methods of hydrogen
production.
Reproduced with permission of the copyright owner. Further reproduction prohibited without permission.

153
1620*F
STEAM IRON SYSTEM y
RE-DUCTOR
COAL GASTURBINE
STEAMH YDRO '
AIR GENAIRO X I
DIZER
1 565 'FASH
STEAM
PRODUCTH2 325 psig
C O M BUSTOR
ASH
DISPOSAL
DUSTREMOVAL
STEAMTURBINE
CYCLE
WASTE-HEAT
RECOVERY
Figure A4 Steam - Iron Hydrogen Production58
BYPRODUCT• -A N D
PLANT POWER
Reproduced with permission of the copyright owner. Further reproduction prohibited without permission.

154
STEAM
PRODUCTHa
6 370psig
METHANEFEEO
AIR
CO}RECOVERY
j SHIFT CONVERSION1 Im e t h a n a t io n
DESULFUR-I2ATION
REFORMERl
SULFUR
Figure A5 Steam Reformation Of Methane - Hydrogen Production90
Reproduced with permission of the copyright owner. Further reproduction prohibited without permission.

Reproduced
with perm
ission of the
copyright ow
ner. Further
reproduction prohibited
without
permission.
BY PRODUCT
SULFUR
RESIDUAL FUEL OIL
STEAM
OXYGEN
ACID GAS REMOVAL
SHIFTCONVERSION
METHANATIONCAS COOLING
AND SOOT REMOVAL
GASIFICATION
Figure A6 P artia l Oxidation - Hydrogen Production 96
cn<j i

156
D esu 'tunzedDesu'fumed ReS'duONoonto C o o tTVQtutQI
\jpom ' i U">AJL_ 1
; P o f t i c ' | * S t e oO itd o i ic r * f *— • " i f u f.
G»yqenS t e a m
cO'O'y’ iC : ‘_cioPortia0 * i d d » - c
ueco^posi!>onforming
L c * B T u
1 >e"'D6fc'uter e t o ’ u r e ■ ■ - c . d G a sA ' o r *?f G o s r - l A o s c . p t W o t e r G a sAo ot sf'O Shi* 1S h ' f t I _I ^gqttQr
C o t D o n O i o n a e
Reactor
s t e a mSulfurProcess
Hydrogen
Figure A7 Carbonaceous - Source Hydrogen Production60
Reproduced with permission of the copyright owner. Further reproduction prohibited without permission.

Reproduced
with perm
ission of the
copyright ow
ner. Further
reproduction prohibited
without
permission.
TABLE A ll COMPARISON OF CARBONACEOUS-SOURCE HYDROGEN PRODUCTION PROCESSES60
PROCESS
C a ta ly tic decomposition of methane0
C a ta ly tic steam reformation3
C a ta ly tic p a rtia l oxidation*5
Non - c a ta ly t ic p a r ita l oxidation*3
Steam - iro n3
OPERATING TEMPERATURES
1500 - 1600°F
1400 - 1600°F
1500 - 1700°F
2000 - 2700°F
1400 - 1700°F
% h2 from water
0%
50% fo r CHi*
64.5% fo r naptha
81% fo r coal
100%
a - Ind irec t source of heat
b - D irect source of heat

Reproduced
with perm
ission of the
copyright ow
ner. Further
reproduction prohibited
without
permission.
TABLE A l l I COMPARISON OF VARIOUS PROCESSES FOR PRODUCING 108 SCF/DAY HYDROGEN
(90% Stream Factor, Annual Costs)
Process Steam Reforminq P a rtia l Oxidation Koppers-Totzek Steam-Iron E tectro lvs i:
PowerRaw Material Natural Gas Residual O il Wyoming Coal Montana Coal
Raw Material Unit Cost $2.00/10® Btu $t5/bbl $20/ton $17.70/ton 3^/kWhr
Raw M aterial Unit Cost, $/10® Btu $2.00/10® Btu 2.35 1.17 1.00 8.79
Overall Thermal E ffic ie n cy , X 74 82.7 59.4 62.6b 75.7
F a c il it ie s Investment, $10® 51 146.2 246.4 197 270.6
Capita l Required, S106 66 178.3 298.8 237 343.0
Gross Revenue, $10* 56.39 88.75 120.79 109.39 232.22
By-Product C redits , $106 3. f (0.10) (0.06) 24.96c (6.96)d
Net Revenue, $10® 53.08 88.65 120.73 83.43 225.26
H2 Production, 106 SCF/year 33,000
Hj P rice , $/10® SCF 1.61 2.69 3.66 2.56 6.83
Hj P rice . $/106 Btu 4.76 8.23 11.20 7.94 20.90
8 Steam at $3.00/1000 lb .
b Hydrogen plus heat equivalent o f e le c tr ic power.
c E le c t r ic ity at 2c/kWhr.
d Oxygen at tlO /to n .
cnoo
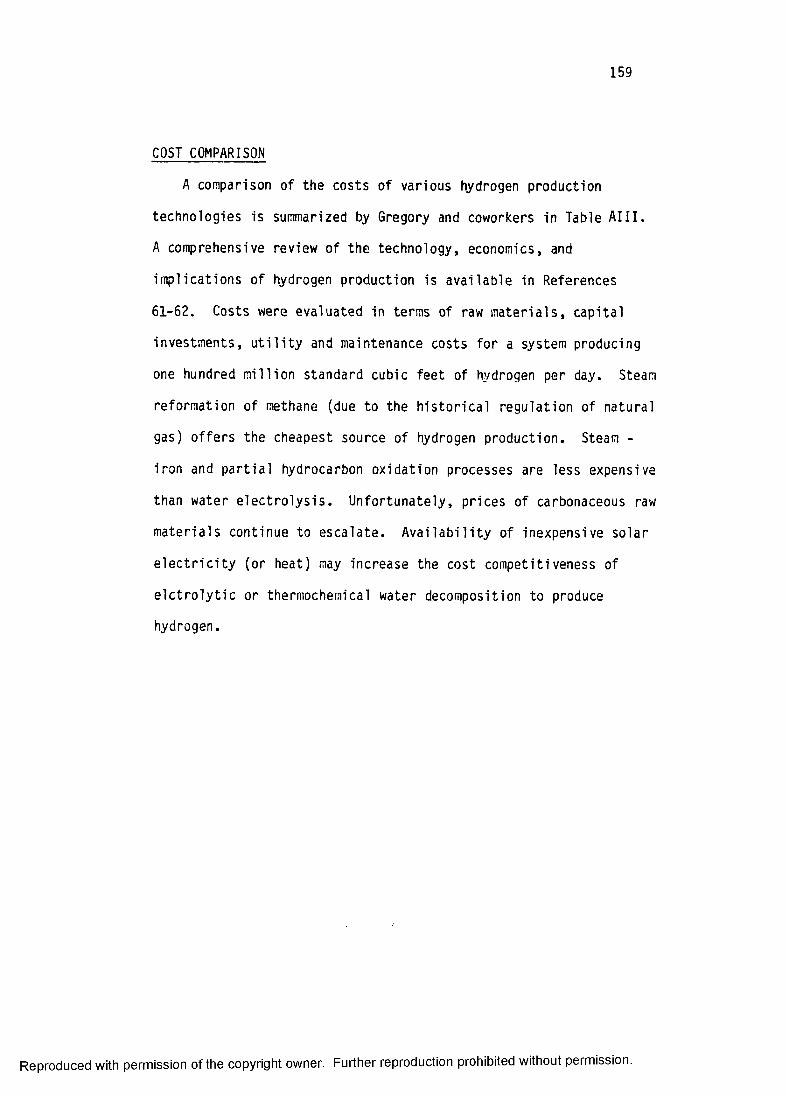
159
COST COMPARISON
A comparison of the costs of various hydrogen production
technologies is summarized by Gregory and coworkers in Table A l I I .
A comprehensive review of the technology, economics, and
implications of hydrogen production is available in References
61-62. Costs were evaluated in terms of raw m aterials, capital
investments, u t i l i t y and maintenance costs for a system producing
one hundred m illion standard cubic feet of hydrogen per day. Steam
reformation of methane (due to the h istorica l regulation of natural
gas) offers the cheapest source of hydrogen production. Steam -
iron and partia l hydrocarbon oxidation processes are less expensive
than water e lec tro lys is . Unfortunately, prices of carbonaceous raw
materials continue to escalate. A v a ila b ility of inexpensive solar
e le c tr ic ity (or heat) may increase the cost competitiveness of
e lc tro ly tic or thermochemical water decomposition to produce
hydrogen.
Reproduced with permission of the copyright owner. Further reproduction prohibited without permission.
REFERENCES
1. Cox, K.E. and Williamson, K.D. J r. in "Hydrogen: Its
Technology and Im plications. Vol. IV. U tiliz a tio n of
Hydrogen"; CRC: Boca Raton, 1979.
2. Stoker, H .S.; Seager, S .L .; Capener, R.L. in "Energy From
Source To Use"; Scott, Foresman: Glenview, 1975, p. 57.
3. Adams, D.R.; Cathou, P.Y.; Gaynor, R .E.; Jackson, R .D .Jr.;
Kirsch, J .H .; Leonard, L .L .; Lockwood, G .S .Jr.; Warnock,
W.P.; Wilcox, R.E. J r . in "Fuel Cells Power For the
Future"; Fuel Cell Research Assoicates: Cambridge, 1960,
pp 9-18.
4. McCormick, B; Huff, J .; Srinivasen, S.; Bobbett, R. in
"Application Sceanario For Fuel Cells In Transportation";
U.S. Department of Energy: Los Alamos, 1979.
5. "National Fuel Cell Seminar - Programs And Abstract";
Bethesda, 1979.
6. United Technologies Corporation, Power Systems Division in
"National Benefits Associated With Commercial Application
Of Fuel Cell Power Plants"; ERDA: Washington, 1978.
7. Cox, K.E. and Williamson, K.D. J r . in "Hydrogen: Its
Technology And Im plications. Vol. I I . Transmission And
Storage Of Hydrogen"; CRC: Boca Raton, 1979.
8. Andresen, A.F. and Macland, A.J. in "Hydrides For Energy
Storage"; Pergammon Press: New York, 1978.
160
Reproduced with permission of the copyright owner. Further reproduction prohibited without permission.

161
9. Schlesinger, H . I . and Brown, H.C. J . Am. Chem. Soc.. 1953.
75, 219.
10. Schlesinger, H .I . and Brown, H.C. J . Am. Chem. Soc. . 1953.
7_5, 186.
11. Schlesinger, H . I . ; Brown, H.C.; F inho lt, A .E .; G ilbreath,
J .R .; Hoekstra, H.R.; Hyde, E.K. J . Am. Chem. Soc. . 1953.
75, 215.
12. Zachariasen, W.H. Acta. Crys. . 1954. 7_, 215.
13. Hornig, D.F. and'Plumb, R.C. J. Chem. Phys. , 1957. 26, 637.
14. Ross, V.F. and Edwards, J.O. in "Chemistry of Boron And Its
Compounds", M ettueties, E .L .; Ed. John Wiley: New York,
1967, Chapter 3, p 165.
15. Hibben, J.H. Am. J . S c i. , 1938. 35A, 113.
16. Edwards, J .O .; Morrison, G.C.; Ross, V .F .; Schultz, J.W.
J . Am. Chem. Soc. , 1955. 77, 266.
17. Mochalov, K.N. and Gil'manshin, G.G. Russ J . Phys. Chem. ,
1962. 36, 578.
18. Cotton, F.A. and Wilkinson, G. in "Advanced Inorganic
Chemistry;" Interscience: New York, 1972, p 230.
19. L y tt le , D .A .; Jensen, E.H.; Struck, W.A. Anal. Chem. , 1952.
24, 1843.
20. Briggs, T.S. and J o lly , W.L. Inorg. Chem. , 1975. 14, 2267.
21. J o lly , W.L. and Mesmer, R.E. J . Am. Chem. Soc., 1961. 4470..
22. Goubeau, J. and K allfass, H. Z. anorg. a ll gem. Chem. , 1959.
299. 160.
23. K e lly , H.C. and M arrio tt, V.B. Inorg. Chem. , 1979. 18, 2875
Reproduced with permission of the copyright owner. Further reproduction prohibited without permission.
162
24. K ilp a tric k , M. and McKinney, C.D. J r. J. Am. Chem. Soc..
1950. 72, 5474.
25. Mesmer, R.E. and J o lly , W.L. Inorg. Chem. , 1962, 1_, 608.
26. Gardiner, J.A. and C o lla t, J.W. J. Am. Chem. Soc. , 1965,
87, 1692.
27. Kreevoy, M.M. and Hutchins, J.E.C. J. Am. Chem. Soc. , 1972,
94, 6371.
28. Pecsok, R.L. J. Am. Chem. Soc. , 1953, 75, 2862.
29. Davis, R.E. J . Am. Chem. Soc. , 1962, 84, 892.
30. Gardiner, J.A. and C o lla t, J.W. J. Am. Chem. Soc. , 1964,
85, 3165.
31. Gardiner, J.A. and C o lla t, J.W. Inorg. Chem. , 1965, 4_,
1208.
32. Davis, R.E.; Bromels, E .; and Kibby, C.L. J. Am Chem. Soc. ,
1962, 84, 885,
33. Marshall, E.D. and Widing, R.A. in "Some Properties Of
Sodium Borohydride Solutions"; U. S. Atomic Energy
Commission Techn. In fo . Service: Washington, 1950.
34. Levy, A.; Brown, J .B .; Lyons, C.J. Ind. Eng. Chem. , 1960,
52, 211.
35. Wang, F.T. and J o lly , W.L. Inorg. Chem. , 1972, 11, 1933.
36. Modler, R.F. and Kreevoy, M.M. J. Am. Chem. Soc. , 1977, 99,
2271.
37. Davis, R.E. and Gottbrath, J.A. J . Am. Chem. Soc. , 1962,
84, 895.
Reproduced with permission of the copyright owner. Further reproduction prohibited without permission.

163
38. Kadlec, V. and Hanzlik, J. C o ll. Czech. Chem. Comm., 1974.
39, 3200.
39. Stockmayer, W.H.; M eller, R.R.; Zero, R.J. J . Phys. Chem. ,
1961, 65, 1076.
40. Mochalov, K .N .; S h ifr in , K .L.V.; Boganostev, A.S. Russ J.
Phys. Chem. , 1963, 37, 1302
41. Freund, T. J . Inorg. Nucl. Chem. , 1959, 9_, 246.
42. J o lly , W.L. and Mesmer, R.E. Inorg. Chem. , 1962, 1_, 608.
43. Davis, R.E. and Swain, C.G. J. Am. Chem. Soc. , 1960, 82,
5949.
44. Vogel, A .I , in "A Textbook Of Quantitative Inorganic
Analysis. Theory And Practice"; Longmans: London, 1944,
pp 497-498.
45. Paul, R.; Buisson, P.; Joseph, N ., Ind. Eng. Chem. , 1952,
44, 1006.
46. Wade, R.C.; Holah, D.G.; Hughes, A.N.; Hui, B.C. Cat. Rev. ,
1976, 14, 211.
47. Boar, R.B.; Hawkins, D.W.; McGhie, J .F .; Barton, D.H.R.
J .C .S ., Perkins Trans. I . , 1973, 654.
48. Uken, A.H. and Bartholomew, C.H. J . C a t.. , 1980, 65, 402.
49. Marosi, V .L .; Benczur-Urmossy, G .; Becher, H.J. Z. anorg.
a ll gem. Chem. , 1971, 386, 47.
50. Hofer, L .J .E .; Shultz, J .F .; Panson, R .D .; Anderson, R.B.
Inorg. Chem. , 1964, 3 , 1783.
Reproduced with permission of the copyright owner. Further reproduction prohibited without permission.

164
51. Schriefe ls , J .A .; Maybury, P.C.; Swartz, W.E.Jr. J. Cat. ,
1980. 65, 195.
52. Brown, C.A. and Brown, H.C. J.Am. Chem. Soc. , 1963, 85,
1003.
53. Maybury, P.C.; M itch e ll, P.W.; Hawthrone, M.F. J .C .S .,
Chem. Com. , 1974, 534.
54. Okinaka, Y. J. Electrochemical Soc. , 1973, 120, 739.
55. Okinaka, Y .; Sard, R.; Wolowodivk, C.; C ra ft, W.H.;
Retajczyk, T.F. J . Electrochemical Soc. , 1974. 121, 56.
56. Lewis, G.N. and Randall, M. in "Thermodynamics"; Brewer,
K.S. and Brewer, L .; Eds.; McGraw H il l : New York, 1961.
57. F icket, A.P. and Kalhammer, F.R. in "Hydrogen: Its
Technology And Im plications. Vol I . Production
Technology"; Cox, K.E. and Williamson, K.D. O r.; Eds.;
CRC: Boca Raton, 1979, Chapter 1, pp 3-41.
58. Gregory, D.P.; Tsaros, C .L .; Aroa, J .L .; Nevrekas, P. in
"Hydrogen: Production And Marketing"; Smith, W.N. and
Santangelo, J .G .; Eds. ACS: Washington, 1980, Chapter 1,
pp 3-26.
59. Funk, J .E . in "Hydrogen: Its Technology And Implications.
Vol I . Production Technology"; Cox, K.E. and Williamson,
K.D. J r . ; Eds,; CRC: Boca Raton, 1979, Chapter 2 , pp 45-47.
Reproduced with permission of the copyright owner. Further reproduction prohibited without permission.

165
60. Kermode, R .I . in "Hydrogen: Its Technology And
Im plications. Vol. I . Production Technology"; Cox, K.E.
and Williamson, K.D. J r . ; Eds.; CRC: Boca Raton, 1979,
Chapter 3, pp 61-115.
61. Cox, K.E. and Williamson, K.D. J r. in "Hydrogen: Its
Technology And Implications"; 5 Volumes; CRC: Boca Raton,
1979.
62. Smith, W.N. and Santagelo, J.G. in Hydrogen: Production and
Marketing", ACS: Washingtin, 1980.
Reproduced with permission of the copyright owner. Further reproduction prohibited without permission.

VITA
t
C liffo rd Mark Kaufman was born on December 21, 1954 in
Washington, D.C. At the age o f four, his family moved to S ilver
Spring, Maryland, where he la te r graduated from Northwood High
School. After spending two years at Emory University and The
University of Maryland, he transferred to The University o f
North Carolina, Chapel H i l l , North Carolina. In 1976, he graduated
with a B.A. in chemistry. Immediately following graduation, he
entered Louisiana State University as a fu ll time graduate student
in chemistry. Shortly th erea fte r, he married J i l l Harbin, a
computer science graduate from North Carolina State University.
Through his research and studies, he became a candidate for the
Doctor of Philosophy Degree in chemistry. One paper on his
research a t L.S.U. was presented a t a National American Chemical
Society meeting (A tlan ta, 1981). Two other papers are being
submitted to the Journal Of The Chemical Society-Dalton.
166
Reproduced with permission of the copyright owner. Further reproduction prohibited without permission.

EXAMINATION AND THESIS REPORT
Candidate: Clifford Mark Kaufman
Major Field: Inorganic Chemistry
Title of Thesis: Catalytic Generation Of Hydrogen From The Hydrolysis OfSodium Borohydride. Application In A Hydrogen/Oxygen Fuel Cell.
Approved:
Major Professor and Chairman
— £ p /h icDean of the School
EXAMINING COMMITTEE:
(Xj v f l -
Date of Examination:
November 24, 1981
Reproduced with permission of the copyright owner. Further reproduction prohibited without permission.