catalytic dehydrogenation of aromatic hydrocarbons · pdf filecatalytic dehydrogenation of...
TRANSCRIPT
Catalytic Dehydrogenation of Aromatic Hydrocarbons
A Major Qualifying Project Report
Submitted to the faculty of
Worcester Polytechnic Institute
for requirements to achieve the
Degree of Bachelor of Science
in Chemical Engineering
By:
___________________
Jake Brown
Advisor: Prof. N. Aaron Deskins
2
Abstract
The purpose of this paper is to investigate the decomposition of several aromatic, tar compounds
over a Pt (111) surface. Density functional theory is used for the modeling. Atomic adsorption
energies are found and used to find reaction energies in agreement with other works. A favorable
reaction pathway for the dehydrogenation reaction of benzene to dehydrobenzyne is calculated,
as well as the dehydrogenation reaction pathway for naphthalene.

3
Table of Contents Abstract ......................................................................................................................................................... 2
Table of Contents .......................................................................................................................................... 3
Background ................................................................................................................................................... 4
Tar removal ............................................................................................................................................... 4
Catalysts .................................................................................................................................................... 5
Molecular Modeling .................................................................................................................................. 5
UBI-QEP ................................................................................................................................................... 5
DFT ........................................................................................................................................................... 7
Molecules Considered in this Work .......................................................................................................... 8
Methodology ............................................................................................................................................... 12
Results ......................................................................................................................................................... 12
Atomic Adsorption .................................................................................................................................. 13
Adsorption Results .................................................................................................................................. 21
Reactions ................................................................................................................................................. 22
Dehydrogenation of organic compounds ................................................................................................ 22
Mechanisms of Benzene Dehydrogenations ........................................................................................... 29
Dehydrogenation of Naphthalene ........................................................................................................... 30
Mechanisms of Naphthalene Dehydrogenation ...................................................................................... 35
Conclusion .................................................................................................................................................. 35
Sources ........................................................................................................................................................ 36
Appendices .................................................................................................................................................. 37
Energies .................................................................................................................................................. 37
Sample Input File .................................................................................................................................... 41

4
Background
Tar removal
Gasification is expected to be a major factor in the expansion of biomass as a renewable energy
source. Solid feedstock is converted to a gaseous feed of carbon monoxide and hydrogen through
a reaction with a controlled amount of oxygen or steam. This improves its potential as a fuel
because the gasified feed can be combusted at higher temperatures. Gasification is not without its
faults, and as such, the gasified feed needs to be cleaned to remove unwanted compounds that
may cause problems downstream.1
Many biomass gasifiers suffer from tar buildup in the flue gas. Typically this is removed through
the process of hot gas cleaning methods, using either calcined dolomites such as CaO-MgO or
steam reforming (nickel-based) catalysts that contain CaO or MgO. The latter group catalyzes
several tar elimination reactions using similar mechanisms as the former method. Tar is removed
through the simultaneous reactions of steam, dry, hydro and thermal reforming and cracking.
Research2 indicates that there may be two kinds of tar present: one that is easily removed using
current methods, and one that is not. For a single order reaction consisting of only one tar type
the rate should vary with bed temperature and gas composition. For an isothermal catalytic
reactor and a given catalyst, tests have shown that the reaction rate of tar removal is high at the
reactor inlet and decreases with reactor length2. This led to the conclusion that there are less
reactive species that only react after longer residence times.
The rate of tar removal can be written as follows:
where kapp is the rate constant for the sum of the rates for the first order removal of tar. For an
isothermal catalytic reactor with plug flow, kapp can be calculated by:
Here is the residence time in the reactor and Xtar is the total tar conversion. Thus, kapp is an
easily found parameter that is directly related to the catalyst activity2.
The activation energies for the first order kinetic approach to catalyzed tar elimination have been
calculated and properly adjusted to account for catalyst activity, with activation energies as low
as 40 kJ/mol found.2 This is a rather low number considering that compounds such as benzene,

5
toluene and naphthalene, possessing activation energies for catalytic tar removal in the flue gas
ranging from 170 to 320 kJ/mol, are present in tar. The disparities in activation energies was
previously accounted for by Juntgen and van Heek, who theoretically demonstrated that “when a
set of overlapping, independent first-order reactions are approximated by a single first-order
expression, the activation energy tends to converge on the lower value in the set.”2 If the tar
removal reaction does not hold true to being able to be calculated similarly then calculated
energies will be incorrect.
A platinum catalyst will theoretically remove tar more effectively than a nickel-based catalyst
because kapp is a function of catalyst activity and platinum is more active than nickel. Platinum
may also react more favorably with the harder to remove form of tar.
Catalysts
Catalysts are useful because they help along reactions that otherwise would not take place or
would take too long to react to be useful. Activation energy is defined as the energy that must be
overcome in order for a chemical reaction to occur. Once this barrier has been overcome the
reaction can proceed without further input of energy. Catalysts lower the activation energy
needed for a reaction to occur, resulting in a faster reaction, and are not consumed by the
process. They do this by having a lower rate-limiting free energy of activation than the
corresponding uncatalyzed reaction, resulting in a higher reaction rate at the same temperature.
Not all catalysts are used to increase reaction rates, however. Catalytic reactions frequently
depend on the amount of contact between the catalyst and the reactants and the molecular
configurations present during catalyzation. Catalysts act as an intermediate reactant and are
regenerated. Catalysts can be reduced or destroyed as a result of secondary reactions or coking.
Molecular Modeling
In order to better understand how reactions occur on a large scale, models of the interactions
between individual atoms can be used. There are several different approaches to this, each with
varying difficulty and accuracy. A mesh is created that represents the first few layers of the
surface being modeled. The configuration of the mesh depends on the crystalline structure of the
solid. An atom or molecule is then positioned adjoining the surface. Only a portion of the
surface is modeled, with a wide enough space around the molecule to ensure that the system‟s
full energetic potential is modeled without any cutoff. The energy of the system can then be
modeled. For diatomic molecules only one atom will generally bond to a surface.
UBI-QEP
One such method is the unity bond index- quadratic exponential potential (UBI-QEP). The UBI-
QEP method uses energetic and structural parameters to predict the adsorption and activation
energy of a molecule over a catalyst. The energetic parameters are the atomic heats of adsorption
and the total bond energies of gas-phase molecules from experimental results or quantum
6
mechanical calculations. The structural parameters are related to the size of the surface unit
mesh, to the number of metal atoms and the metal-metal distance. The rest is pure algebra
providing an analytical formulism that allows one to calculate the reaction energetic (heats of
adsorption, the enthalpies of elementary reactions, and their activation barriers) at various
coverages. The surface processes/reactions amenable to uniform UBI-QEP treatment are
adsorption, dissociation, diffusion, recombination, disproportionation and desorption3. Surfaces
where all the distances between surface atoms are equal to the lattice constant, especially close-
packed fcc(111) and fcc(100) surfaces are most appropriate for UBI-QEP. UBI-QEP formulism
relies on „geometric blindness‟ as it does not factor in bond lengths or valence angles. This gives
it a large computational advantage.
To obtain the binding energies of various molecules a number of steps were taken. The
molecules were modeled in a gaseous state as well as in various configurations on the Platinum
surface. The xyz configuration of the molecules is inserted into a CP2K input file and run
accordingly. CP2K calculates the Hartree energy of the input and manipulates the position of the
atoms slightly until the minimum energy state can be reached. Taking the energy of the bare
platinum surface and the energy of the gaseous molecules and subtracting them from the bonded
surface energy will yield the binding energy, QA, for the atom.
This energy can be used to calculate the energies for various reactions by using the following
formulas3.
An estimate of the intrinsic activation barrier for the forward reaction ABads Aads + Bads is
Equation 1
is the intrinsic activation barrier. QAB is the adsorbed energy of the molecule AB on
the platinum surface. DAB is the bond energy of the molecule consisting of its constituent parts,
A and B. It can be calculated by finding the energies of AB, A and B, and subtracting the
energies of A and B from AB. This represents the change in the system‟s energy from the
bonding.
For the recombination reaction Aads + Bads ABads the intrinsic activation barrier is determined
by the conservation of energy:
Equation 2
where is the enthalpy of dissociation. , the activation barrier for the
recombination reaction, is the same as the barrier for dissociation reaction minus the enthalpy of
dissociation.

7
The enthalpy of dissociation can be calculated using the following formula:
Equation 3
The upper limit for the intrinsic activation barrier for a recombination reaction is as follows:
Equation 4
DFT
Density functional theory is a method of approximating the base state energy of a system using
various concepts from quantum chemistry. Since electrons are much lighter than protons or
neutrons, they respond much quicker to changes in the atomic environment. This allows us to
essentially treat the nuclei as having fixed positions, splitting the problem into two parts: the
positions of the nuclei and the position of the nuclei. The Born-Oppenheimer approximation
states that we can express the ground state energy as a function of the nuclei. This function is
known as the adiabatic potential energy surface of the atoms. We can then apply the time
independent, non-relativistic version of the Schrodinger equation:
Time independency is present because the energy of the system stays constant. Here H is a
Hamiltonian operator where ψ is a set of solutions, or eigenstates, of the Hamiltonian. Each of
the solutions ψ has an associated eigenvalue E that satisfies the eigenvalue equation. The detailed
form of the Hamiltonian is as follows:
Where m is the mass of the electron and terms inside the brackets correspond to the kinetic
energy of each electron, the interaction energy between each electron and the collection of
atomic nuclei and the interaction energy between different electrons, respectively. ψ is the
electronic wave function, which is a function of each of the spatial coordinates of each of the N
electrons as well as their spin.
Approximating ψ as the product of the individual wave functions is known as the Hartree
product. This is done to avoid having to calculate the full wave function for each atom, resulting
in a 3 dimensional wave function in lieu of a many dimensional function. The term in the
Hamiltonian defining electron-electron interactions acts in such a way so that the individual
electron wave function cannot be found without simultaneously considering the individual

8
electron wave functions associated with all the other electrons4. The wave function for any
specific set of coordinates cannot be directly observed but the probability that an electron is at a
set of coordinates can be measured. The probability is closely related to the density of electrons
at a particular position in space.
The ground work for density functional theory was laid by Hohenberg and Kohn. They stated
that the “ground-state energy from Schrodinger‟s equation is a unique functional of the electron
density.”4 A functional is similar to a function, but instead of using x to find y it uses f(x) to find
y. They also theorized that “the electron density that minimizes the energy of the overall
functional is the true electron density corresponding to the full solution of the Schrodinger
equation”. Density functional theorem is based on the observation that all ground state properties
of a system are fully determined by the total ground state electron density. DFT approximates
ground state properties fairly accurately but it lacks accuracy when electronically excited states
are introduced5. A local density approximation, LDA, tends to provide poor results for molecules
while a generalized gradient approximation, GGA, is usually more accurate. There are multiple
ways that information from the gradient can be used in a GGA functional so there are multiple
methods used to determine it. A fully accurate functional has yet to be found.
Molecules Considered in this Work
-Hydrogen
Hydrogen is the simplest atom, consisting of one proton and one electron. It is most commonly
found as a gas in its diatomic form, H2.
-Oxygen
Oxygen, atomic number 8, is highly reactive due to its electron configuration. Under standard
conditions it is found as a diatomic gas, O2.
-Hydroxyl
Hydroxyl is comprised of an oxygen atom covalently bond with a hydrogen atom.
-Water
Water, H2O, is a polar molecule containing one oxygen with two hydrogen covalently bond to it.
Water is a polar molecule because of the configuration of its bonding. The oxygen side has a
slight negative charge while the hydrogen side is slightly positive.
9
Figure 1 Water
-Carbon Monoxide
Carbon monoxide consists of a carbon atom and an oxygen atom connected by a triple bond.
-Carbon Dioxide
Carbon dioxide contains two oxygen bonded to a central carbon atom. Unlike H2O, CO2 is a
linear molecule.
Figure 2 Carbon Dioxide
-Methyl Group
The methyl group, CH3, is a highly reactive molecule where three hydrogen are bonded to a
central carbon.

10
Figure 3 Methyl Group
-Methane
Methane, CH4, forms a tetrahedral atom with a central carbon. It is the simplest alkane and is
extremely flammable.
Figure 4 Methane
-Nitrogen
Nitrogen, atomic number 7, is colorless, odorless and mostly inert at standard conditions. It
forms a diatomic gas, N2.
-Nitric Oxide
Nitric oxide, NO, consists of a nitrogen atom and an oxygen atom bonded together.
-Benzene
Benzene has the molecular formula C6H6. It is colorless, highly flammable and is a known
carcinogen. It is one of the simplest aromatic molecules, simply consisting of a carbon ring.

11
Figure 5 Benzene
-Naphthalene
Naphthalene has the molecular formula C10H8. It is volatile and forms a flammable vapor. It
possesses the structure of two conjoined benzene rings. It is a poly-aromatic hydrocarbon.
Figure 6 Naphthalene
-Platinum
Platinum is the 78th
element. Platinum is generally unreactive and exhibits resilience to
corrosion. Platinum is used as a catalyst in numerous reactions in differing forms. The surface
that will be used for these calculations is known as Pt (111).
Figure 7 Platinum(111) mesh

12
-Tar overview
Tar composition depends on multiple factors such as reaction temperature and fuel composition.
Tar compounds can be broken down into 5 main classes: “Class 1 tars are compounds that cannot
be detected with a gas chromatograph and include tar compounds heavier than coronene. Class 2
tars are aromatic compounds with hetero atoms (e.g. oxygen and nitrogen), and are compounds
with a high water solubility. Class 3 tars are light compounds with 1 aromatic ring… Class 4 tars
are compounds with 2 or 3 aromatic rings and class 5 tars are compounds with 4 to 7 aromatic
rings.”1
As the temperature in the gasifier increases, the composition of tar changes. Water soluble tars
are produced at lower temperatures while tars containing heavy poly-aromatic hydrocarbons
such as naphthalene, are produced at higher temperatures.
Methodology
The DFT modeling was done using a program called CP2K. CP2K is a freely available program
written in FORTRAN 95 that is used to perform atomistic and molecular simulations of solid
state, liquid, molecular and biological systems12
.
Results
To account for any differences that may be caused due to a difference in modeling methods
between other research and my own, several simple reactions were modeled to ensure accuracy.
An example of the calculations done to calculate the barrier for one of the reactions follows.
To calculate the intrinsic activation barrier of the forward reaction H + O OH, the molecules
are first modeled in both their gaseous state and their adsorbed state. A clean Platinum slab is
also modeled. To obtain QAB the energies of the clean platinum slab and the gaseous molecule
are subtracted from the energy of the adsorbed molecule. This difference is the adsorption
energy. The values obtained are :
QAB Species Hartree kcal/mol
H -0.105 66.1
Ofcc -0.142 89.2
OH -0.075 47.3 Table 1 Adsorption Energies

13
The bond energy, DAB, is obtained by subtracting the gaseous energies for oxygen and hydrogen
from the gaseous energy for hydroxyl to get 105.96 kcal/mol. The adsorption energies and the
bond energies are used to find the enthalpy of dissociation, 10.7 kcal/mol. All of the adsorption
energies, the bond energy and the dissociation enthalpy are used to find the reaction energy, 13.6
kcal/mol. Comparatively, a result of 13 kcal/mol was obtained by Shustorovich and Zeigarnik2.
Atomic Adsorption
There are a number of places on the surface where an atom can bond, as seen in Figure 8. The
top site refers to the position directly above an atom in the surface. The bridge, or saddle, site is
directly between two surface atoms. HCP, or hexagonal close packed, is the site in the center of
three surface atoms without another Pt atom beneath it. FCC, or face centered cubic, is the site
between three surface atoms directly above another Pt atom.
Figure 8- Bonding site diagram

14
Platinum
For all of the models run a Platinum surface consisting of 19 atoms in the surface layer and 12
atoms in the second layer was used. The seven central atoms on the surface layer were allowed to
relax.
Hydrogen
Hydrogen will bond on the top site. However, hydrogen is the least strongly bonded atomic
molecule and results in similar adsorption energies for the bridge, fcc and hcp sites. The
miniscule difference between adsorption energies for different sites results in hydrogen having a
very small barrier for diffusion across the surface. When modeling the adsorption of a single
hydrogen atom on the Pt surface a value of -2.86 eV is obtained for the adsorption energy.
However, studies have shown that the adsorption energy of hydrogen decreases significantly
with increasing coverage due to repulsive interactions6. For a monolayer coverage, hydrogen
adsorption enthalpies as low as -40 kJ/mol have been reported11
. At low coverage hydrogen has
been found to have an enthalpy in the range of -60 to -906. As a result of this an intermediate
value of -60 kJ/mol was used in estimating the dehydrogenation energies of aromatic
compounds, which will be discussed later.
Figure 9 Adsorbed Hydrogen
Oxygen
Oxygen bonds more strongly than Hydrogen, and as such bonds to the fcc site. Oxygen has two
unpaired electrons making it a triplet. This denotes that oxygen has a multiplicity of 3.
Multiplicity is the quantification of the amount of unpaired electron spin and is used in the
modeling process.

15
Figure 10 Adsorbed Oxygen, Top site
Figure 11 Adsorbed Oxygen, FCC site
Hydroxyl
When a diatomic molecule adsorbs onto a surface it will typically orient itself normal to the
surface. As a result of this the atom that comes into close contact with the surface contributes the
majority of the adsorption energy. Hydroxl binds on the top site with the oxygen atom. The
hydrogen tilts, as seen below in Figure 12.

16
Figure 12- Platinum-Hydroxyl surface
Water
Since H2O is already a stable molecule, it bonds very weakly to the platinum surface.
Figure 13 Adsorbed Water

17
Carbon Monoxide
Carbon monoxide bonds with carbon closest to the surface. It bonds at the hcp site most strongly.
Figure 14 Adsorbed CO, top site
Figure 15 Adsorbed CO, HCP site

18
Carbon Dioxide
Carbon dioxide is another stable molecule that forms a weak bond to the surface on top.
Figure 16 Adsorbed CO2
Methyl Group (CH3)
The methyl group bonds to the top site.

19
Figure 17 Adsorbed Methyl Group
Methane
Methane forms a weak bond to the surface at the top site.
Nitrogen
Nitrogen forms a strong bond to the fcc site. The multiplicity used for modeling nitrogen was 4.
Figure 18 Adsorbed Nitrogen, Top site
20
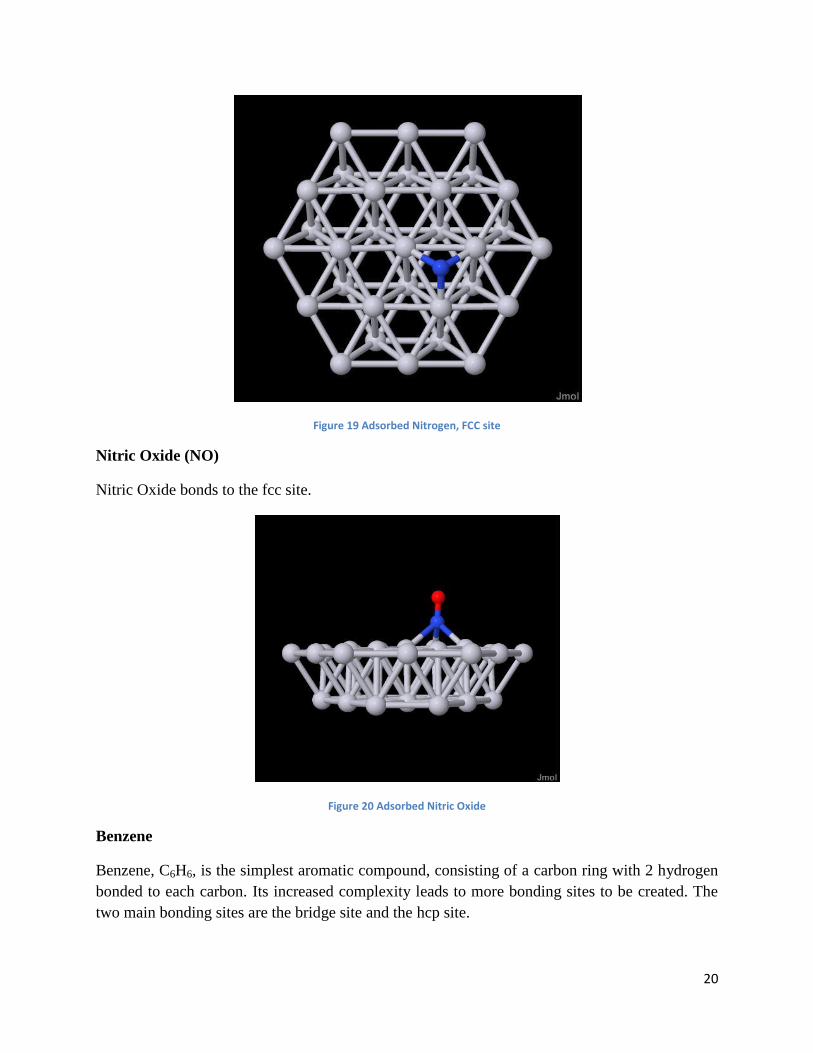
Figure 19 Adsorbed Nitrogen, FCC site
Nitric Oxide (NO)
Nitric Oxide bonds to the fcc site.
Figure 20 Adsorbed Nitric Oxide
Benzene
Benzene, C6H6, is the simplest aromatic compound, consisting of a carbon ring with 2 hydrogen
bonded to each carbon. Its increased complexity leads to more bonding sites to be created. The
two main bonding sites are the bridge site and the hcp site.

21
Naphthalene
Naphthalene, C10H8, consists of two fused benzene rings. The preferred bonding site for
naphthalene is known as N7, referring to the fact that naphthalene is in contact with seven
surface atoms7.
Adsorption Results
Species Hartree kcal/mol eV eV from Research 6,7,9
H -0.105 -66.1 -2.86 -2.7
O, fcc -0.142 -89.2 -3.86 -3.87
O, top -0.095 -59.3 -2.57 -2.46
OH -0.075 -47.3 -2.05 -2.19
H2O -0.012 -7.31 -0.32 -0.3
CO, top -0.067 -41.8 -1.81
CO, hcp -0.076 -47.4 -2.05 -1.92
CO2 -0.001 -0.64 -0.03
CH3 -0.079 -49.3 -2.14 -2.04
CH4 -0.047 -29.5 -1.28
NO -0.064 -40.1 -1.74 -1.85
Benzene, hcp -0.032 -20.0 -0.87 -0.85 to -0.89
Benzene, bridge -0.052 -32.3 -1.4 -1.21 to -1.34
N, top -0.083 -51.9 -2.25 -2.01
N, fcc -0.161 -101 -4.37 -4.35
Naphthalene -0.092 -58.0 -2.51 -2.60 Table 2 Adsorption Energies
The majority of the results are within agreement with other research. There are no significant outliers and
all values fall within 0.2 eV of other work. These results verify that the modeling process is correct.

22
Reactions
Using adsorption energies and bond energies it is possible to calculate the energy of reactions on
the catalyst surface. The energies used for comparison are from The UBI-QEP Method by
Shustorovich and Zeigarnik3. All energies are in kcal per mol.
Reaction Bond Energy Delta H Delta E Delta E Comparison
H+OH=H2O 121 1.78 14.8 16 +/- 5
H+O=OH 106 10.7 13.6 13
H2O+O=2OH -40.0 -16.5 11.7 11
CH4=CH3+H 20.7 18
CO+O=CO2 26.3 25
NO+N=N2O 22.6 20 Table 3 Reaction Energies
The first three reactions use the formula for the recombination reaction, listed in the
methodology section as equation 2, to find the intrinsic activation barrier, delta E. The methane
dissociation reaction uses the formula for dissociation, labeled equation 1. The final two
reactions use equation 4.
All energies are in rough agreement. The reactions H+OH= H2O, H+O=OH, and H2O+O=2OH
all fall within one kcal/mol of other work. The remaining reactions fall within three kcal/mol of
other work.
Dehydrogenation of organic compounds
Dehydrogenation is the process of removing hydrogen from an aromatic compound. The two
main mechanisms for dehydrogenation of aromatic molecules are thermal and catalytic. There
have been a considerable amount of studies done on the dehydrogenation of benzene since it is
the simplest aromatic hydrocarbon7. I investigated the dehydrogenation of benzene while it
remains parallel to the platinum surface.
In the previous models low surface coverage has been implied. This means that the adsorbed
atom is not affected by or interacting with anything other than the surface. During the process of
dehydrogenation there is a point when the hydrogen has been removed from the main aromatic
molecule but has yet to desorb from the platinum surface. This affects the adsorption energy of
the hydrogen because hydrogen has to compete with the aromatic compound for an adsorption
site and as such, adjustments have to be made to the adsorption energy of the hydrogen atom.10
It
has been found that with increasing coverage, adsorption enthalpy for hydrogen decreases
significantly due to repulsive interactions5.

23
Figure 21 Benzene adsorbed in the bridge configuration
Figure 22 Benzene adsorbed in the hcp position

24
Figure 23 Pt-Phenyl
Figure 24 Pt-Phenyl, front view

25
Figure 25 Pt-Meta-benzyne
Figure 26 Pt-Meta-benzyne, front view

26
Figure 27: Pt-Ortho-benzyne
Figure 28: Pt-Ortho-benzyne, front view

27
Figure 29: Pt-Para-benzyne
Figure 30: Pt-Para-benzyne, front view

28
Figure 31:Pt-Dehydrobenzyne
Figure 32:Pt-Dehydrobenzyne, top view

29
Table 4 Energetic Evaluation of Benzene Dehydrogenation
Mechanisms of Benzene Dehydrogenations
The typical pathway for benzene dehydrogenation involves the tilting of the molecule. Benzene
can also dehydrogenate from either the hcp site, centered over a hollow, or the bridge site,
centered over a bridge. I used the bridge site as my initial state. I was interested in which of the
ortho, meta, or para configurations were preferred in a planar dehydrogenation. The barrier
energy is obtained by subtracting the adsorption energies of the dehydrogenated state and
hydrogen from the initial state.
The removal of the first hydrogen results in C6H5, the phenyl group. The energy barrier for this
step is 1.70 eV, meaning that is the amount of energy needed to dehydrogenate benzene to
phenyl.
The removal of the second hydrogen can result in one of three configurations depending on
where it is removed from. If the hydrogen removed is adjacent to the dehydrogenated carbon,
ortho-benzyne is formed. If the hydrogen removed is across the ring from the dehydrogenated
carbon para-benzyne is formed. If there is only one hydrogen between the removed hydrogen
and the bare carbon, meta-benzyne is formed.
The meta configuration was preferred over the para configuration by 0.02 eV. Both of these were
approximately 0.76 eV higher than the ortho configuration. The dehydrogenation process will
follow the energetically favorable route, meaning that ortho-benzyne is formed with an
activation barrier of 0.75 eV.
The removal of the third hydrogen from a site adjacent to the dehydrogenated carbons creates
dehydrobenzyne. Dehydrobenzyne is tilted approximately 45 degrees in relation to the surface
plane. The removal of the third hydrogen has an activation barrier of 1.89 eV.
Species Hartree kJ/mol Eads (eV) eV from literature8
H -0.105 -60 -0.63 Benzene, hcp -0.032 -83 -0.87 -0.85 to -0.89
Benzene, bridge -0.055 -15 -1.50 -1.21 to -1.34
Phenyl -0.094 -246 -2.58 -2.60
Ortho-benzyne -0.099 -258 -2.70 Meta-benzyne -0.127 -332 -3.47 Para-benzyne -0.126 -329 -3.45 Dehydrobenzyne -0.146 -379 -3.97 -3.91
Barrier (eV) eV from lit8 eV from lit6
First H removal 1.70 1.72 1.75 Second 0.75 0.75
Third 1.89 2.54

30
The paper, Dehydrogenation of benzene on Pt(111) surface by Gao, Zheng and Jiang8 produced
similar results to mine. Our adsorbed energies for benzene on the hcp site, phenyl and
dehydrobenzyne correspond. I found an adsorption energy for benzene on the bridge site 0.16 to
0.29 eV higher than theirs. This explains some of the discrepancy between our results for the
barrier for the removal of the third hydrogen. Since my dehydrogenation pathway started off
lower and our first two hydrogen removals had similar barriers, the third dehydrogenation barrier
was lower.
Dehydrogenation of Naphthalene
There has not been much, if any, research done on the dehydrogenation of naphthalene, though
its adsorption on a pt (111) surface has been studied. Due to its similarity to benzene I assume
similar trends in dehydrogenation will occur. Both planar and tilted configurations are modeled,
as seen below.
Figure 33 Naphthalene in the N7 configuration

31
Figure 34 Pt-N7H, side
Figure 35 Pt-N7H, end

32
Figure 36 Pt-N6H, side
Figure 37 Pt-N6H, end
33
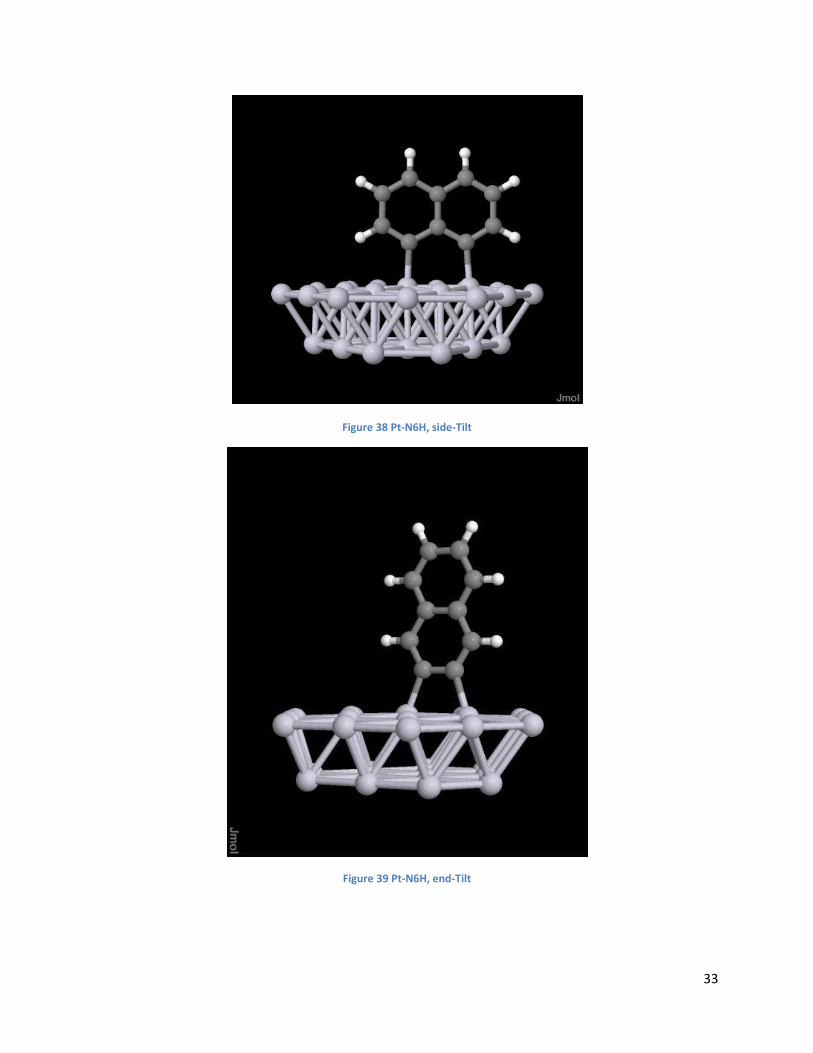
Figure 38 Pt-N6H, side-Tilt
Figure 39 Pt-N6H, end-Tilt
34
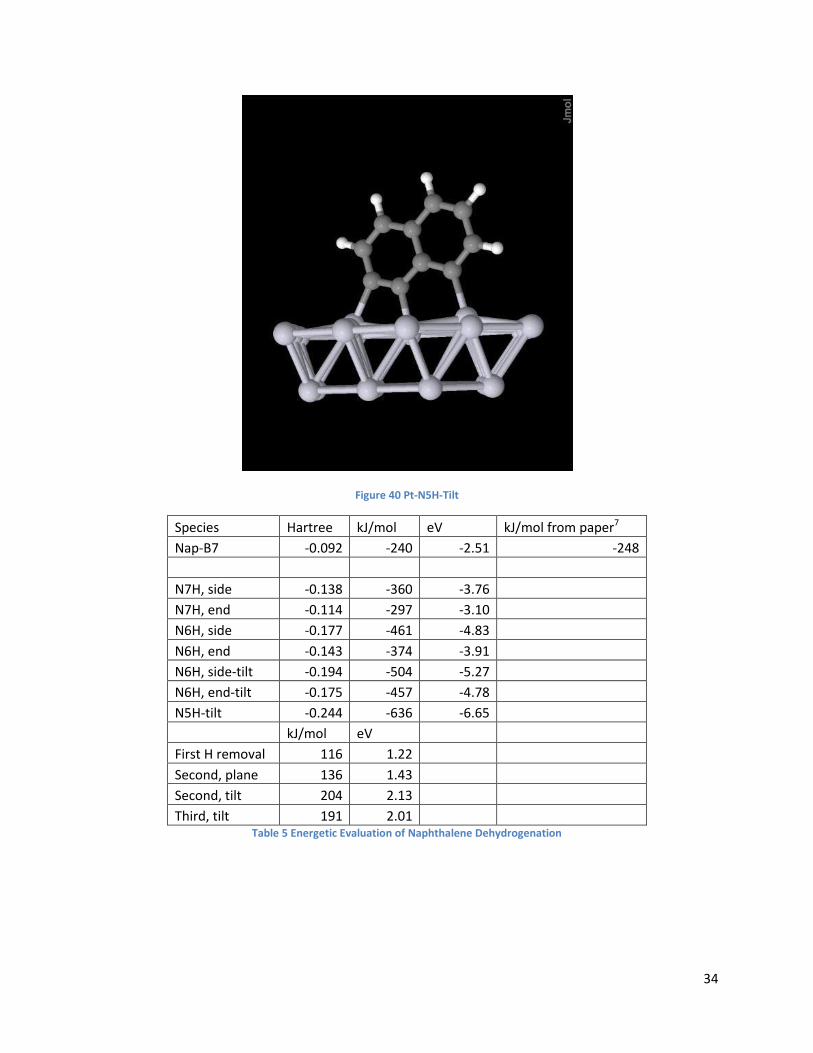
Figure 40 Pt-N5H-Tilt
Species Hartree kJ/mol eV kJ/mol from paper7
Nap-B7 -0.092 -240 -2.51 -248
N7H, side -0.138 -360 -3.76 N7H, end -0.114 -297 -3.10 N6H, side -0.177 -461 -4.83 N6H, end -0.143 -374 -3.91 N6H, side-tilt -0.194 -504 -5.27 N6H, end-tilt -0.175 -457 -4.78 N5H-tilt -0.244 -636 -6.65
kJ/mol eV
First H removal 116 1.22 Second, plane 136 1.43 Second, tilt 204 2.13 Third, tilt 191 2.01 Table 5 Energetic Evaluation of Naphthalene Dehydrogenation

35
Mechanisms of Naphthalene Dehydrogenation
The dehydrogenation of naphthalene is endothermic. The removal of the first hydrogen has a
lower energetic barrier than the removal of benzene‟s first hydrogen. The data indicates that
naphthalene dehydrogenates more readily than benzene for the first few hydrogen because the
structure of naphthalene allows for more hydrogen to be removed before the molecule becomes
unstable.
The initial dehydrogenation can take place in one of two places due to naphthalene‟s symmetry:
the narrow end, which I refer to as N7H, end, or the wide side, referred to as N7H, side. The
preferable site for dehydrogenation is the end, with a barrier of 1.22 eV.
The removal of the other hydrogen on the same end as the first while remaining planar has a
barrier of 1.43 eV. It is not energetically favorable to enter a tilted state at such low coverage.
The energetically favorable dehydrogenation pathway is planar dehydrogenation. I believe that at
higher surface coverage the tilted configuration will become favorable due to intermolecular
interactions. This is because higher coverage will force naphthalene to compete for binding sites,
lowering adsorption enthalpy. With this lowered enthalpy the tilted dehydrogenation pathway
may become viable.
Conclusion
Using molecular modeling I was able to get accurate results for adsorption energies for various
atomic compounds. I then used these adsorption energies to calculate bond energies, the enthalpy
of dissociation where appropriate, and the intrinsic activation barrier for recombination and
dissociation reactions. Using similar methods I was able to determine the adsorption energies for
benzene and its various dehydrogenates. Using these energies I was able to calculate the
dehydrogenation pathway for planar dehydrogenation from the bridge site. The data
corresponded with previous research except a lower activation barrier was found for the step
from ortho-benzyne to dehydrobenzyne. The mechanism for the dehydrogenation of the first two
hydrogen atoms of naphthalene at low coverage was found to be planar.
From these calculations it is clear that platinum is a viable catalyst for use in flue gas cleaning
for gasifiers. Platinum does not encounter any problems for the dehydrogenation of simple
aromatic hydrocarbons and should be able to effectively handle tar buildup in flue gas.

36
Sources
1. Corella, J., Toledo, J., & Aznar, M.-P. (2002). Improving the Modeling of the Kinetics of the Catalytic
Tar Elimination in Biomass Gasification. American Chemical Society , 3351-3356.
2. Kiel, J., & Paasen, S. v. (2004). Tar Formation in Fluidised-Bed Gasification-Impact of Gasifier
Operation Conditions. ECN .
3. Shustorovich, E. M., & Zeigarnik, A. V. (2006). The UBI-QEP Method: Basic Formalism and Applications
to Chemisorption Phenomena on Transition Metal Surfaces. Russian Journal of Physical Chemistry , 4-30.
4. Sholl, D., & Steckel, J. (2009). Density Functional Theory: A Practical Introduction. Hoboken: John
Wiley & Sons, Inc.
5. Jenkins, S. J. (2009). Aromatic adsorption on metals via first-principles density functional theory. The
Royal Society , 2949-2976.
6. Saeys, M., Reyniers, M.-F., Neurock, M., & Marin, G. B. (2003). Density Functional Theory Analysis of
Benzene (De)hydrogenation on Pt(111): Addition and Removal of the First Two H-Atoms. The Journal of
Physical Chemistry , 3844-3855.
7. Santarossa, G., Iannuzzi, M., Vargas, A., & Baiker, A. (2008). Adsorption of Naphthalene and Quinoline
on Pt, Pd and Rh: A DFT Study. ChemPhysChem , 401-413.
8. Gao, W., Zheng, W. T., & Jiang, Q. (2008). Dehydrogenation of benzene on Pt(111) surface. The
Journal of Chemical Physics , 129-137.
9. Ford, D. C., Xu, Y., & Mavrikakis, M. (2005). Atomic and molecular adsorption on Pt(111). Surface
Science , 159-174.
10. Saeys, M., Reyniers, M.-F., Thybaut, J. W., Neurock, M., & Marin, G. B. (2005). First-principles based
kinetic model for the hydrogenation of toluene. Journal of Catalysis , 129-138.
11. Podkolzin, S., Watwe, R., Yan, Q., Pablo, J. d., & Dumesic, J. (2001). DFT Calculations and Monte Carlo
Simulations of the co-Adsorption of Hydrogen Atoms and Ethylidyne Species on Pt(111). Journal of
Physical Chemistry , 8550-8562.
12. CP2K. (n.d.). Retrieved from CP2K project homepage: http://cp2k.berlios.de/

37
Appendices
Energies
Material Energy
Pt -3724.1798
H -0.49913133
O -15.8630308
-15.83738108
OH -16.53102637
H2O -17.22227428
CO -21.67816155
-21.67816155
CO2 -37.7672779
CH3 -7.404678294
CH4 -7.244384476
NO -25.8839218
N -9.663836667
N2O -35.74765
Pt-H -3724.784245
Pt-Ofcc -3740.173063
Pt-Otop -3740.13735
Pt-OH -3740.786128
Pt-H2O -3741.413724
Pt-COtop -3745.924641
Pt-COhcp -3745.933469
Pt-CO2 -3761.948106
Pt-CH3 -3731.663051
Pt-CH4 -3732.250463
Pt-NO -3750.112526
Pt-N -3734.036573
Pt-N2O -3760.024562 Table 6 Raw Energies
Table 7 Adsorption energies
Eads

38
Species Hartree kcal/mol eV eV from Research
H -0.10531 66.08544 -2.8645 -2.7
Ofcc -0.14209 89.16497 -3.8649 -3.87
Otop -0.09452 59.3119 -2.5709 -2.46
OH -0.0753 47.25254 -2.0482 -2.19
H2O -0.01165 7.310596 -0.3169 -0.3
COtop -0.06668 41.84174 -1.8137
COhcp -0.07551 47.38196 -2.0538 -1.92
CO2 -0.00103 0.644986 -0.028
CH3 -0.07857 49.30501 -2.1372 -2.04
CH4 -0.04706 29.52988 -1.28
NO -0.06397 40.13918 -1.7399 -1.85
Benzene fcc -0.03186 19.99375 -0.8666 -0.85 to -0.89
Benzene bri -0.05153 32.33763 -1.4017 -1.21 to -1.34
N -0.08269 51.88943 -2.2492
Nfcc -0.16076 100.8814 -4.3728 -4.35
Table 8 Bond Energies
Bond Energies hartree kcal/mol
H+OH=H2O -0.19212 120.5550715
H+O=OH -0.16886 105.9640021
H2O+O=2OH 0.063881 -
40.08598529
Table 9 Reaction Energies
Reaction Bond Energy Delta H Delta E Delta E Comparison
H+OH=H2O 120.5550715 1.780223 14.83385537 16 +/- 5
H+O=OH 105.9640021 10.71359 13.62063013 13
H2O+O=2OH -
40.08598529 -16.5615 11.65908495 11
CH4=CH3+H 20.68848881 18
CO+O=CO2 26.33997785 25
NO+N=N2O 22.63208371 20
39
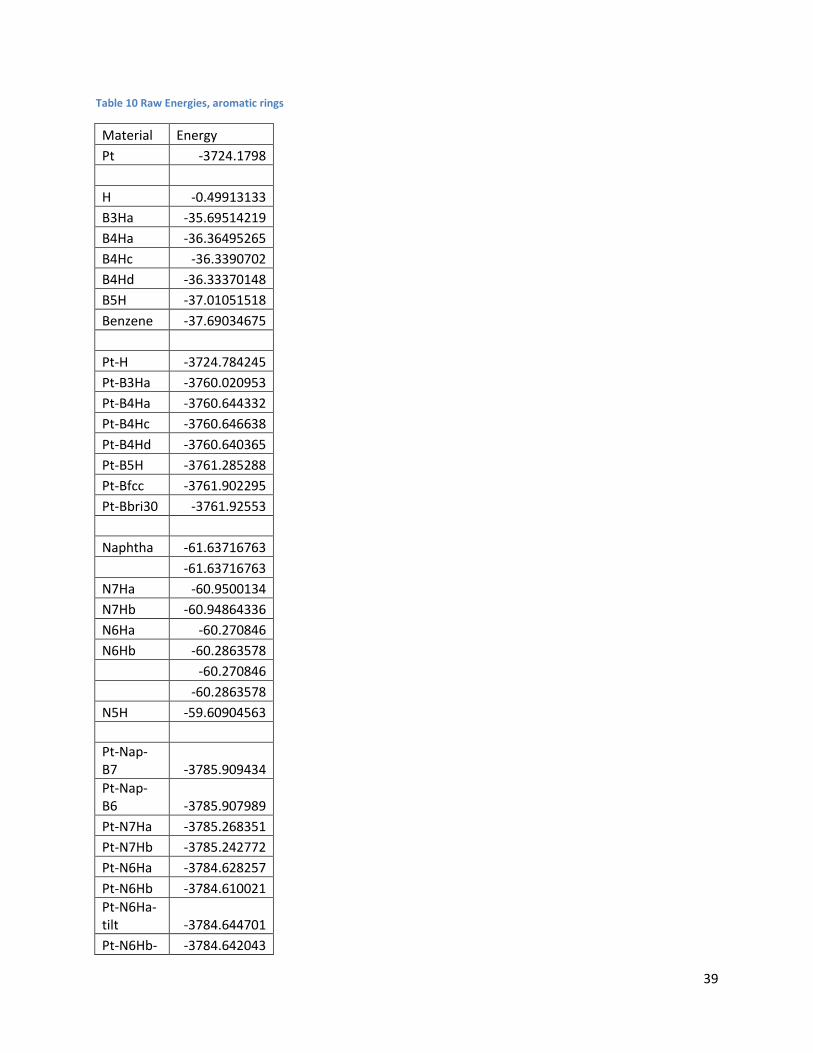
Table 10 Raw Energies, aromatic rings
Material Energy
Pt -3724.1798
H -0.49913133
B3Ha -35.69514219
B4Ha -36.36495265
B4Hc -36.3390702
B4Hd -36.33370148
B5H -37.01051518
Benzene -37.69034675
Pt-H -3724.784245
Pt-B3Ha -3760.020953
Pt-B4Ha -3760.644332
Pt-B4Hc -3760.646638
Pt-B4Hd -3760.640365
Pt-B5H -3761.285288
Pt-Bfcc -3761.902295
Pt-Bbri30 -3761.92553
Naphtha -61.63716763
-61.63716763
N7Ha -60.9500134
N7Hb -60.94864336
N6Ha -60.270846
N6Hb -60.2863578
-60.270846
-60.2863578
N5H -59.60904563
Pt-Nap-B7 -3785.909434
Pt-Nap-B6 -3785.907989
Pt-N7Ha -3785.268351
Pt-N7Hb -3785.242772
Pt-N6Ha -3784.628257
Pt-N6Hb -3784.610021
Pt-N6Ha-tilt -3784.644701
Pt-N6Hb- -3784.642043
40
tilt
Pt-N5-tilt -3784.033581
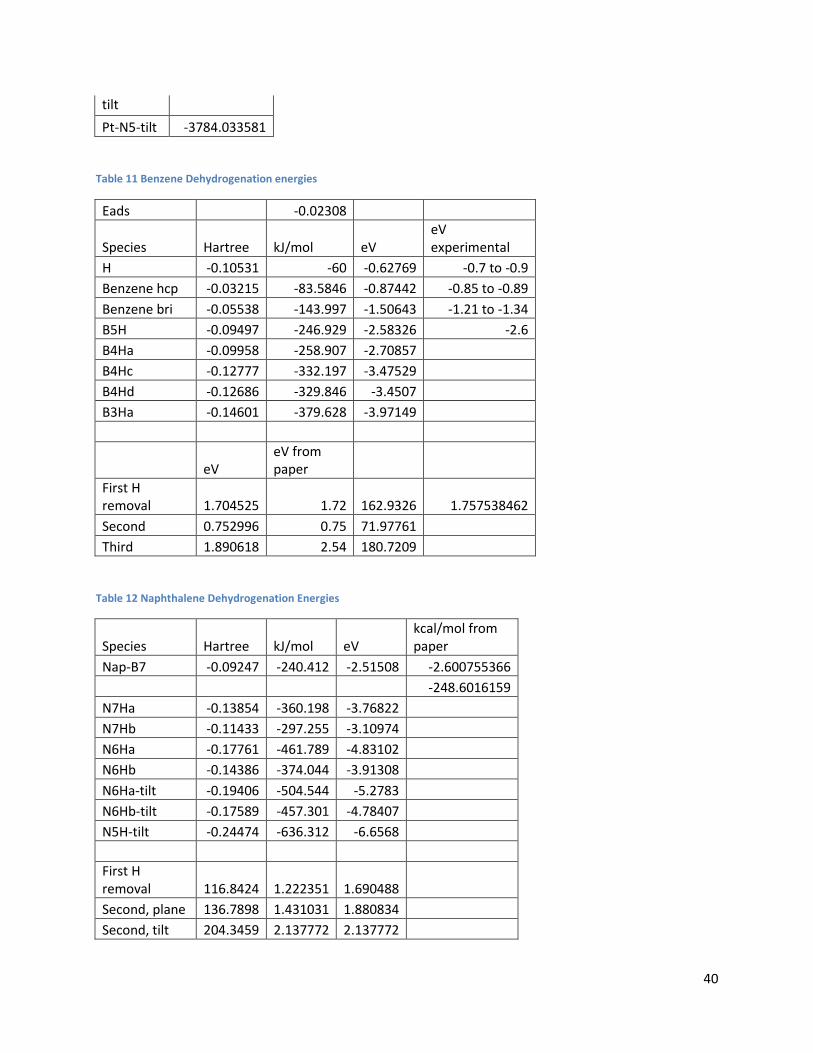
Table 11 Benzene Dehydrogenation energies
Eads -0.02308
Species Hartree kJ/mol eV eV experimental
H -0.10531 -60 -0.62769 -0.7 to -0.9
Benzene hcp -0.03215 -83.5846 -0.87442 -0.85 to -0.89
Benzene bri -0.05538 -143.997 -1.50643 -1.21 to -1.34
B5H -0.09497 -246.929 -2.58326 -2.6
B4Ha -0.09958 -258.907 -2.70857
B4Hc -0.12777 -332.197 -3.47529
B4Hd -0.12686 -329.846 -3.4507
B3Ha -0.14601 -379.628 -3.97149
eV eV from paper
First H removal 1.704525 1.72 162.9326 1.757538462
Second 0.752996 0.75 71.97761
Third 1.890618 2.54 180.7209
Table 12 Naphthalene Dehydrogenation Energies
Species Hartree kJ/mol eV kcal/mol from paper
Nap-B7 -0.09247 -240.412 -2.51508 -2.600755366
-248.6016159
N7Ha -0.13854 -360.198 -3.76822
N7Hb -0.11433 -297.255 -3.10974
N6Ha -0.17761 -461.789 -4.83102
N6Hb -0.14386 -374.044 -3.91308
N6Ha-tilt -0.19406 -504.544 -5.2783
N6Hb-tilt -0.17589 -457.301 -4.78407
N5H-tilt -0.24474 -636.312 -6.6568
First H removal 116.8424 1.222351 1.690488
Second, plane 136.7898 1.431031 1.880834
Second, tilt 204.3459 2.137772 2.137772

41
Third, tilt 191.768 2.006188 2.006188
Sample Input File
&FORCE_EVAL
METHOD Quickstep
&DFT
UKS
# MULTIPLICITY 1
BASIS_SET_FILE_NAME ./GTH_BASIS_SETS_5-12-10
POTENTIAL_FILE_NAME ./GTH_POTENTIALS_5-12-10
WFN_RESTART_FILE_NAME x.wfn
&MGRID
CUTOFF 300
NGRIDS 5
&END MGRID
&QS
WF_INTERPOLATION ASPC
# WF_INTERPOLATION PS
EXTRAPOLATION_ORDER 3
&END QS
&SCF
EPS_SCF 1.E-6
SCF_GUESS RESTART
MAX_SCF 5000
&OT T
PRECONDITIONER FULL_SINGLE_INVERSE
MINIMIZER DIIS
LINESEARCH 3PNT
&END OT
42
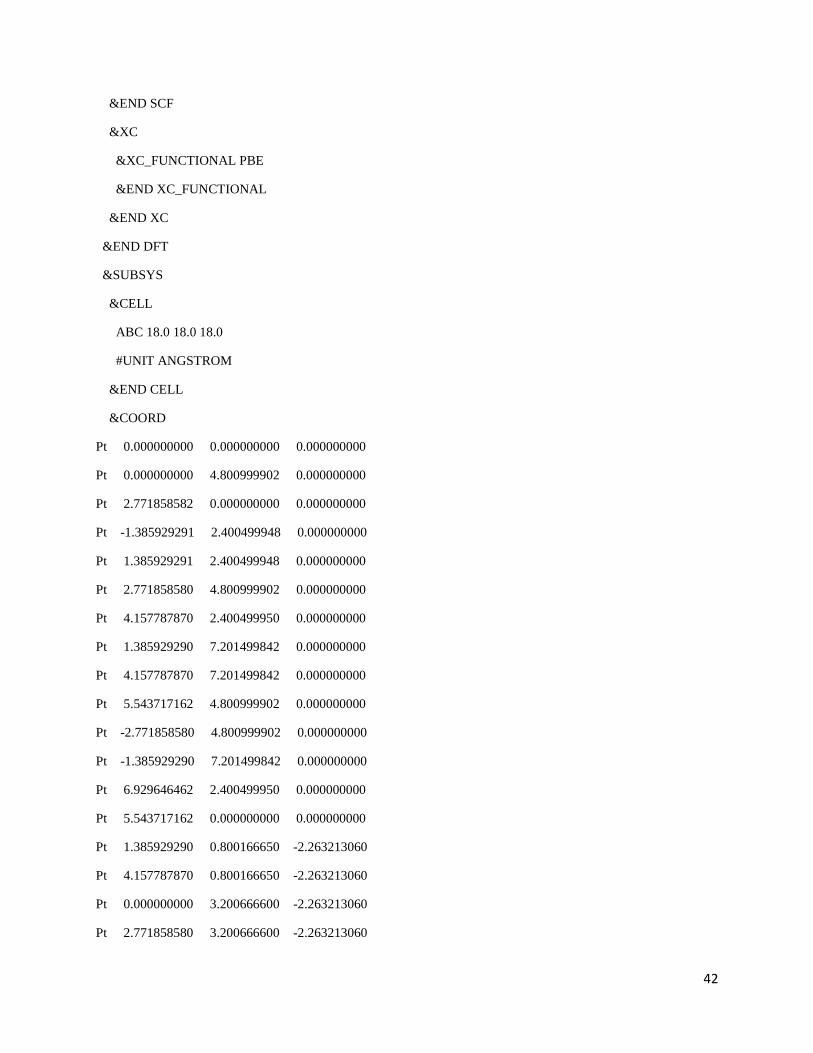
&END SCF
&XC
&XC_FUNCTIONAL PBE
&END XC_FUNCTIONAL
&END XC
&END DFT
&SUBSYS
&CELL
ABC 18.0 18.0 18.0
#UNIT ANGSTROM
&END CELL
&COORD
Pt 0.000000000 0.000000000 0.000000000
Pt 0.000000000 4.800999902 0.000000000
Pt 2.771858582 0.000000000 0.000000000
Pt -1.385929291 2.400499948 0.000000000
Pt 1.385929291 2.400499948 0.000000000
Pt 2.771858580 4.800999902 0.000000000
Pt 4.157787870 2.400499950 0.000000000
Pt 1.385929290 7.201499842 0.000000000
Pt 4.157787870 7.201499842 0.000000000
Pt 5.543717162 4.800999902 0.000000000
Pt -2.771858580 4.800999902 0.000000000
Pt -1.385929290 7.201499842 0.000000000
Pt 6.929646462 2.400499950 0.000000000
Pt 5.543717162 0.000000000 0.000000000
Pt 1.385929290 0.800166650 -2.263213060
Pt 4.157787870 0.800166650 -2.263213060
Pt 0.000000000 3.200666600 -2.263213060
Pt 2.771858580 3.200666600 -2.263213060

43
Pt 5.543717162 3.200666600 -2.263213060
Pt 1.385929290 5.601166552 -2.263213060
Pt -1.385929290 5.601166552 -2.263213060
Pt 4.157787870 5.601166552 -2.263213060
Pt -2.771858582 0.000000000 0.000000000
Pt -4.157787873 2.400499948 0.000000000
Pt -1.385929291 -2.400499952 0.000000000
Pt 1.385929291 -2.400499952 0.000000000
Pt 4.157787870 -2.400499950 0.000000000
Pt -1.385929292 0.800166650 -2.263213060
Pt -2.771858582 3.200666600 -2.263213060
Pt 0.000000000 -1.600333300 -2.263213060
Pt 2.771858580 -1.600333300 -2.263213060
C -0.597461666 1.970405058 2.400000000
C 0.577455032 2.727945075 2.400000000
C 1.805984311 2.076407261 2.400000000
C 1.834613418 0.680597837 2.400000000
C 0.656916497 -0.061841845 2.400000000
C -0.554515937 0.580687023 2.400000000
C 0.548828582 4.123755399 2.400000000
C 1.726450699 4.866136480 2.400000000
C 2.937883747 4.223656570 2.400000000
C 2.980902956 2.833961972 2.400000000
H -1.548369363 2.452883783 2.522547236
H 2.767313263 0.164159864 2.522547236
H 0.683321228 -1.141340614 2.522547236
H -1.465300984 -0.001793079 2.522547236
H -0.383719671 4.640433859 2.522547236
H 1.699805795 5.945573758 2.522547236
H 3.848597594 4.806154632 2.522547236

44
H 3.931859086 2.351548418 2.522547236
&END COORD
&KIND Pt
BASIS_SET DZVP-MOLOPT-SR-GTH
POTENTIAL GTH-PBE-q18
&END KIND
&KIND O
BASIS_SET TZVP-MOLOPT-GTH
POTENTIAL GTH-PBE-q6
&END KIND
&KIND C
BASIS_SET TZVP-MOLOPT-GTH
POTENTIAL GTH-PBE-q4
&END KIND
&KIND H
BASIS_SET TZVP-MOLOPT-GTH
POTENTIAL GTH-PBE-q1
&END KIND
&END SUBSYS
&END FORCE_EVAL
&GLOBAL
PROJECT Pt-nap
RUN_TYPE GEO_OPT
# RUN_TYPE ENERGY
PRINT_LEVEL LOW
&END GLOBAL
&MOTION

45
&GEO_OPT
MAX_ITER 200
MAX_FORCE 0.0009725
OPTIMIZER BFGS
&END GEO_OPT
&CONSTRAINT
&FIXED_ATOMS
LIST 8 9 10 11 12 13 14 15 16 17 18 19 20 21 22 23 24 25 26 27 28 29 30 31
&END FIXED_ATOMS
&END CONSTRAINT
&END MOTION