catalysing development: transport sector - world...
TRANSCRIPT

Catalysing Development:Transport Sector
Prof G RaghuramIndian Institute of Management, Ahmedabad

Key Growth ParametersYear 2002-03 2003-04 2004-05 2005-06
GDP (US$ billion)
467.0 553.9 632.7 724.8
% Growth 3.8 8.5 7.5 8.4Transport Sector Share (% of GDP)
7.9 8.2 8.5
% Growth 9.6 17.2 14.8
Year 1971 1981 1991 2001
Population (million) 547.9 685.2 838.6 1029.0
Urban Population(% of Population)
19.9 23.3 25.7 27.8
Urban Population (million)
109.1 159.7 215.8 286.1
Urbanization
[Source: CMIE, 2006]

Key Growth Parameters
Year 2002-03 2003-04 2004-05 2005-06US$ billion 61.7 78.2 108.0 133.1% of GDP 12.1 13.0 15.6 18.3% Growth 19.7 26.7 38.1 23.5
Import
[Source: CMIE, 2006]
Year 2002-03 2003-04 2004-05 2005-06US$ billion 53.0 63.9 83.5 102.7% of GDP 10.4 10.6 12.0 14.2% Growth 20.6 20.5 30.7 23.0
Export

Key Growth Parameters: GujaratGross State Domestic Product
Year 2000-01 2001-02 2002-03 2003-04
GSDP (US$ billion) 23.0
% of GDP 5.6 5.8 6.3 6.6
-0.32
25.5 29.2 36.4
% Growth 11.57 16.55 18.64
[Source: CMIE, 2006]Urbanization
http://censusgujarat.gswan.gov.in/
Year1971 1981 1991 2001
Population (million)26.7 34.1 41.3 48.4
Urban Population(million) 7.5 10.6 14.2 18.2Urban Population(% of Population) 28.1 31.1 34.5 37.7
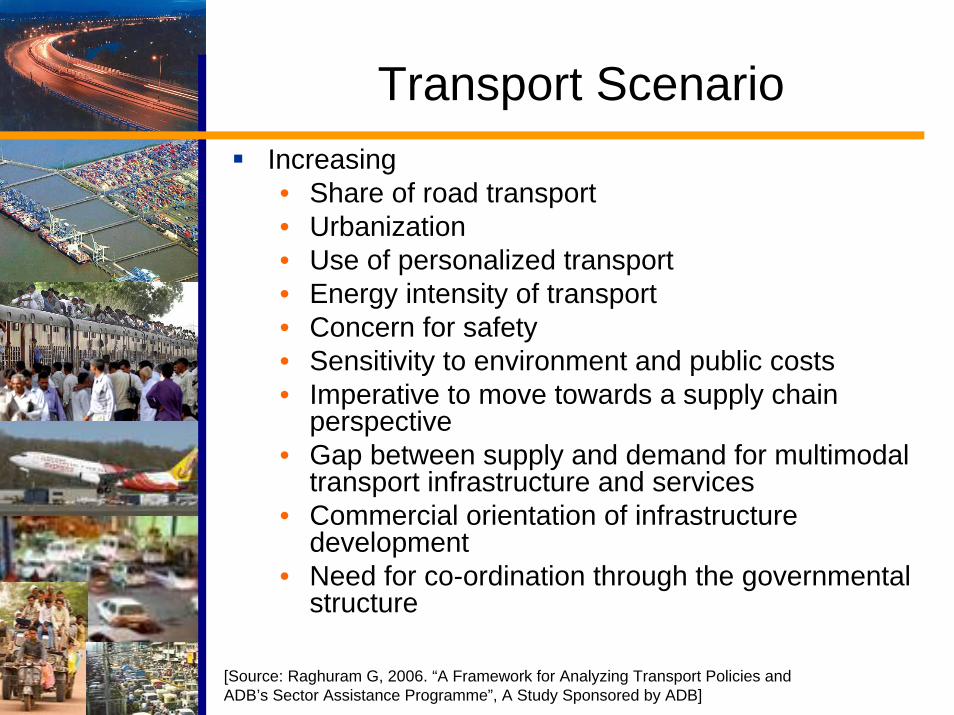
Transport ScenarioIncreasing • Share of road transport• Urbanization• Use of personalized transport• Energy intensity of transport• Concern for safety• Sensitivity to environment and public costs • Imperative to move towards a supply chain
perspective• Gap between supply and demand for multimodal
transport infrastructure and services• Commercial orientation of infrastructure
development • Need for co-ordination through the governmental
structure
[Source: Raghuram G, 2006. “A Framework for Analyzing Transport Policies and ADB’s Sector Assistance Programme”, A Study Sponsored by ADB]

Freight Traffic: Modal Split
Mode 1998-99 2002-03 2003-04
BTKM%
Share BTKM%
Share BTKM%
Share
Road 449 51.7 655 55.2 694 54.1
Rail 284 32.7 356 30.0 384 30.0Pipeline(max) 70 8.1 80 6.7 86 6.7
Coastal 66 7.6 96 8.1 118 9.2
Total 869 100.0 1187 100.0 1282 100.0[Source: Author’s Analysis]

Passenger Traffic: Modal Split
Mode 1998-99 2002-03 2003-04
BPKM%
ShareBPK
M%
ShareBPK
M%
Share
Road 2034 83.0 2775 83.3 3003 83.4
Rail 404 16.5 543 16.3 581 16.1
Air 11 0.4 13 0.4 14 0.4Coastal(max) 1 - 1 - 1 -
Total 2450 100.0 3332 100.0 3599 100.0[Source: Author’s Analysis]

Drivers of Transport Demand
Population Growth
Speed
Cost
Comfort
Purchasing Power
Social Forces (Acceptance, Attitude)
Growth and Spread of Industrial Development
[Source: Bleijenberg A, 2002. “The Driving Forces Behind Transport Growth and Their Implications for Policy”, International Seminar on Managing the Fundamental Drivers of Transport Demand, Brussels, December 2002]

Transport Components: Demand Side
Freight• Dry Bulk • Liquid Bulk • Other High Value Goods
Passenger• Sub-urban• Non Sub-urban
Short Distance Long Distance
Transport Components: Supply Side (1)
Infrastructure
Ownership and Asset Creation• Right of Way• Terminals• Rolling Stock and Equipment

Services1. Maintenance
• Right of Way• Terminals• Rolling Stock and Equipment
2. Operations• Right of Way• Terminals• Rolling Stock and Equipment
3. Customer Services• Basic Services• Special Services
Transport Components: Supply Side (2)

Transport Components: Supply Side (3)
Regulation
• Licensing• Pricing• Safety• Environment• Service Levels• Dispute Resolution
[Source: Raghuram G, 2001. Integrated Transport – Chapters 7.1 and 7.2, India Infrastructure Report,Oxford University Press, New Delhi, December 2000]
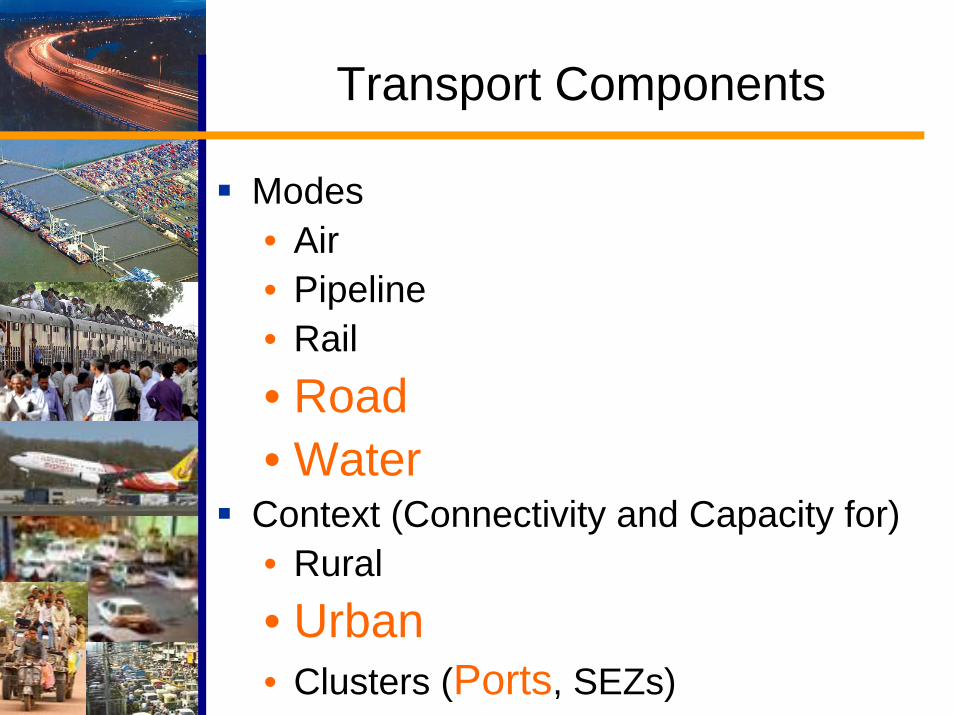
Transport Components
Modes• Air• Pipeline• Rail• Road• Water
Context (Connectivity and Capacity for)• Rural• Urban• Clusters (Ports, SEZs)

Highways
:
Total Road Network 3.34 million kmExpressways 200 kmNational Highways 65,569 kmState Highways 130,000 km
Second largest road network in the worldThe road network carries nearly 65% of freight and 85% of passenger trafficTraffic on roads is growing at 7-10% per annum, while vehicle growth is about 12% National Highways constitute 2% of road network, but carry 40% of total road traffic
Current (Year 2005)
[Source: Department of Road Transport and Highways, Ministry of Shipping, Road Transport and Highways, GOI]
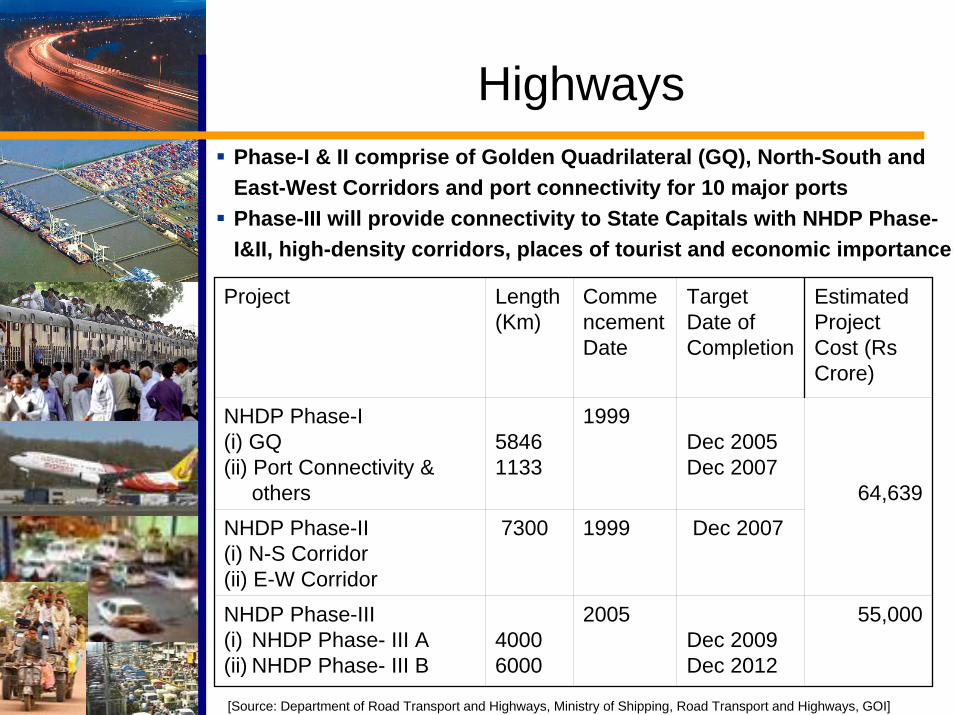
Project Length (Km)
Commencement Date
Target Date of Completion
Estimated Project Cost (Rs Crore)
NHDP Phase-I(i) GQ(ii) Port Connectivity &
others
58461133
1999
1999
2005
NHDP Phase-II(i) N-S Corridor(ii) E-W Corridor
7300
Dec 2005Dec 2007
Dec 2007
NHDP Phase-III (i) NHDP Phase- III A(ii) NHDP Phase- III B
40006000
Dec 2009Dec 2012
55,000
64,639
HighwaysPhase-I & II comprise of Golden Quadrilateral (GQ), North-South and East-West Corridors and port connectivity for 10 major portsPhase-III will provide connectivity to State Capitals with NHDP Phase-I&II, high-density corridors, places of tourist and economic importance
[Source: Department of Road Transport and Highways, Ministry of Shipping, Road Transport and Highways, GOI]

HighwaysRoad Transport• Safety• Environmental Pollution• Overloading • Interstate Issues• Vehicle Design• Trucking Industry Structure (Manufacturing, Services)
Road Infrastructure• Capacity and Speed• All Weather Connectivity• Land Acquisition• Contracts and Concession Agreements• Financing, including Tolling• O/D Data for Network Planning• Institutional Reform: NHAI, State PWD• Capacity Building: Supervision, Contractors,
Equipment Manufacture[Source: Raghuram, 2006. Presentation for MS University Vadodara]

Ports
Significant growth of maritime transport
Continued increase in ship size
Mergers and alliances of shipping companies
Emergence of international terminal operators doing their
business at multiple ports on a global basis
Increasing involvement of private sector in ports
Focus on port connectivity
The public port authority will focus more on landlord,
regulatory, co-ordination, facilitation/promotion functions
[Source: Raghuram, 2006. Presentation for MS University Vadodara]

Current (2005-06)• Plan for 1000 mt in five years, with about 150 mt (12
mTEUs) containerized• Plan for 2000 mt in ten years, with about 250 mt (20
mTEUs) containerized
Large public ports Need for scale economies (upto 100 mt per port) Hinterland connectivityFocus on the northern maritime states
Non-major ports: Key driversCaptive cargo (supply chain effectiveness)Coastal shipping, inland water transport perspectivesIndustrial parks and special economic zones
Chennai, Mumbai and Kolkata – move towards closure since value for alternate land use is increasing
Ports
[Source: Raghuram, 2006. Presentation for MS University Vadodara]
Shipping• India incurs about 12% freight as a proportion of
total import value. World average is 6% (developed countries: 5%, developing countries: 9%)
• Liberalise all aspects including cabotage• Encourage ship repair and ship building
Coastal• High potential area – needs appropriate
infrastructure including traffic drivers
Inland water transport• River estuaries (including tidal river systems),
backwaters, and canals (future) have potential• NW-1 (Allahabad to Haldia) is losing its potential due
to alternate use of water• Massive river training efforts are required with
unpredictable consequences
Ports
[Source: Raghuram, 2006. Presentation for MS University Vadodara]

Increasing urbanization is inevitableMass rapid transport should be provided with a strong intermediate passenger transport (taxis, three wheelers, cycle rickshaws) supportAppropriate zoning of developmental activities to enable use of mass rapid transportAll urban activity licensing must include traffic anticipation and parking plans. Public parking must be chargedFocus on urban renewal, heritage, walk only zones
Urban Transport
[Source: Raghuram, 2006. Presentation for MS University Vadodara]

Road Safety
Number of Deaths, 2004
Per Capita Death Rate, 2004 Deaths per bvkm
China 107077 8.26India* 90000 8.33 60*USA 42636 14.53 9.4Russia 34506 24.01Japan 7358 5.76 11.2France 5232 8.67 10.9Canada 2730 8.56 8.9Australia 1596 7.94 8.0
* Average passengers per vehicle is taken as 2 (71% of vehicles are MTWs). As per this, the deaths per vkm is about 60.
Source: www.driveandstayalive.com
AwarenessSafe Roads, Safe Drivers, Safe Vehicles and Safe UsersRoad Safety Education and TrainingEmergency Medical ServicesLegal, Institutional and Financial Environment at Various Levels
[Source: National Road Safety Policy, MOSRTH, 2005]
Key Issues
Other modes: air, pipeline and railMulti-modal integrationPrivate sector participationRegulatory and institutional issues

Key Issues: Gujarat
Industrial development leveraging ports.Long coastline. Potential northern hinterland. But what is the actual servicing? Lack of OD data.
Over 20% pa EXIM Traffic growth: Containerisation (expected growth over 15% pa), Hinterland Connectivity (Rail, Road, Coastal), ICDs, Potential Significant Role of Gujarat Ports: Mundhra, Pipavav, Kandla and Hajira
Transhipment – Feeder will be the movement structure. Mundhra and JNPT have an edge (draft, early entrants) in attracting transhipment traffic. Rest will be recipients of feeder traffic, either from international ports or using coastal movement.
Key Issues: Gujarat

Dedicated Freight Corridoor• Mumbai - Surat - Vadodara -
Ahmedabad - Palanpur - Jaipur –Delhi
• Gujarat can leverage this for EXIM traffic, with connection to Mundhra –Kandla and Pipavav and for domestic traffic
Key Issues: Gujarat
SEZs will need rail and road connectivity, both to ports and the hinterland.Public urban transport systems are required on potential high density corridoors,which need to be nurtured with appropriate zoning.Domestic tourism, including for pilgrims have high growth potential
Key Issues: Gujarat

Thank You